
bls_1935_1977.pdf
55
Industry Wage Survey: Fabricated Structural Steel November 1974 U S. Department of Labor Bureau of Labor Statistics Digitized for FRASER http://fraser.stlouisfed.org/ Federal Reserve Bank of St. Louis
Transcript of bls_1935_1977.pdf

Industry Wage Survey: Fabricated Structural Steel November 1974U S. Department of Labor Bureau of Labor Statistics
Digitized for FRASER http://fraser.stlouisfed.org/ Federal Reserve Bank of St. Louis
Industry Wage Survey: Fabricated Structural Steel November 1974U.S. Department of Labor Ray Marshall, Secretary Bureau of Labor Statistics Julius Shiskin, Commissioner 1977
Bulletin 1935
For sale by the Superintendent of Documents, U.S. Government Printing Office, Washington, D.C. 20402, GPO Bookstores, or BLS Regional Offices listed on inside back cover. Price $1.10
Make checks payable to Superintendent of Documents Stock No. 029-001-01978-5
Digitized for FRASER http://fraser.stlouisfed.org/ Federal Reserve Bank of St. Louis

Digitized for FRASER http://fraser.stlouisfed.org/ Federal Reserve Bank of St. Louis
Preface
This b u lletin sum m arizes the results o f a Bureau o f Labor S tatistics survey o f w ages and supp lem entary b en efits in th e fabricated structural steel industry in N ovem ber 1 9 7 4 . A sim ilar survey o f th is industry w as con d u cted in O ctober 1 9 6 9 .
Separate releases w ere issued earlier for B irm ingham , A la.; C hicago, 111.; C leveland, O hio; D etro it, M ich.; H o u sto n , T ex .; Los A ngeles-L ong B each , C alif.; and N ew Y ork-N ortheastern N ew Jersey. C opies o f th ese releases are available from the Bureau o f Labor S ta tistics, W ashin g to n , D . C. 2 0 2 1 2 , or any o f its regional o ff ice s .
The stu d y w as co n d u cted in the B ureau’s O ffice o f W ages and Industrial R ela tion s. Harry B. W illiams o f the D iv ision o f O ccupational Wage Structures prepared the analysis in th is b u lletin . F ield w ork for th e survey w as d irected b y the B ureau’s A ssistant R egional C om m issioners for O perations.
O ther reports available from the B ureau’s program o f industry wage stu d ies, as w ell as the addresses o f the B ureau’s regional o ff ic e s , are listed at the end o f the b u lle tin .
M aterial in th is p u b lica tion is in the p ub lic dom ain and m ay be reproduced w ith o u t the perm ission o f the Federal G overnm ent. Please credit the Bureau o f Labor S ta tistics and cite the nam e and num ber o f the p u b lica tion .
The Bureau has in trod u ced n ew job title s to elim inate th o se th at d en o te sex stereo ty p es. For purposes o f th is b u lle tin , h ow ever, o ld title s have been retained w here th e y refer sp ec ifica lly to jo b s for w h ich survey data w ere co llec ted under earlier d efin itio n s.
inDigitized for FRASER http://fraser.stlouisfed.org/ Federal Reserve Bank of St. Louis

Digitized for FRASER http://fraser.stlouisfed.org/ Federal Reserve Bank of St. Louis

Contents
Page
Summary..................................................................................................................................................................................... 1Industry characteristics......................................................................................... 1
Location........................................................................................................................................................................... 1Establishment size............................................................................................................................................................ 1Unionization................................................................................................................................................................... 1Method of wage paym ent............................................................................................................................................... 2
Average hourly earnings............................................................................................................................................................ 2Occupational earnings.............................................................................................................................................................. 2Establishment practices and supplementary wage provisions................................................................................................ 4
Scheduled weekly hours................................................................................................................................................. 4Shift differential provisions and practices..................................................................................................................... 4Paid holidays................................................................................................................................................................... 4Paid vacations................................................................................................................................................................... 4Health, insurance, and retirement plans........................................................................................................................ 5Other selected benefits............................................................................... 5
Text tables:1. Percent increase in average hourly earnings, fabricated
structural steel manufacturing, October 1969 toNovember 1974 ....................................................................................................................................................... 3
2. Occupational wage relationships in fabricated structuralsteel manufacturing, October 1969 and November 1974.................................................................................... 4
Reference tables:1. Average hourly earnings: By selected characteristics............................................................................................ 62. Earnings distribution: All production workers ............................................................................................... 7
Occupational averages:3. All establishments............................................................................................................................................ 84. By community s iz e .......................................................................................................................................... 95. By establishment size....................................................................................................................................... 116. By labor-management contract coverage...................................................................................................... 13
Occupational earnings:7. Birmingham, Ala................................................................................................................................................ 158. Chicago, 111......................................................................................................................................................... 169. Cleveland, Ohio................................................................................................................................................... 17
10. Detroit, Mich..................................................................................................................................................... 1811. Houston, Tex................... 1912. Los Angeles-Long Beach, Calif......................................................................................................................... 2013. New York-Northeastern New Jersey.............................................................................................................. 21
Establishment practices and supplementary wage provisions:14. Method of wage paym ent................................................................................................................................ 2215. Scheduled weekly hours.................................................................................................................................. 2316. Shift differential provisions............................................................................................................................. 24
v
Digitized for FRASER http://fraser.stlouisfed.org/ Federal Reserve Bank of St. Louis

Contents — Continued
17. Shift differential practices................................................................................................................................... 2718. Paid holidays....................................................................................................................................................... 2919. Paid vacations....................................................................................................................................................... 3020. Health, insurance, and retirement plans............................................................................................................ 3321. Other selected benefits....................................................................................................................................... 35
Appendixes:A. Scope and method of survey.............................................................................................................................. 36B. Occupational descriptions................................................................................................................................... 40
vi
Digitized for FRASER http://fraser.stlouisfed.org/ Federal Reserve Bank of St. Louis

Fabricated Structural Steel, November 1974
Summary
Straight-time earnings of production and related workers in fabricated structural steel establishments averaged $4.55 an hour in November 1974.1 Average (mean) earnings of production workers within the scope of the survey were 45 percent above the $3.13 recorded in October 1969 when a similar survey was conducted.1 2 The middle 50 percent of production workers earned between $3.72 and $5.30 an hour in November 1974.
Regionally,3 the highest average was reported in the Pacific—$6.10 an hour—and the lowest in the Southeast— $3.59. Nationwide, occupational averages ranged from $5.50 for general (production) mechanics to $3.13 for watchmen. Hand welders—the largest job studied separately-averaged $4.67 an hour.4
Industry characteristics
Establishments within the scope of the Bureau’s survey employed 63,741 production and related workers in November 1974, basically unchanged from the October 1969 study. Regionally, however, employment changes varied considerably over the 1969-74 period. For example, employment rose 37 percent in the Border States, 21 percent in the Mountain States, 10 percent in the Southwest, and 6 percent in New England; it declined 16 percent in the Pacific and less than 10 percent in each of the remaining regions—Middle Atlantic (9 percent), Southeast (6 percent), Great Lakes (5 percent), and Middle West (1 percent).
The fabricated structural steel industry cuts, shapes, and joins metal parts for use in buildings, bridges, ships, and other structures. Of the joining processes, welding was the primary technique used by plants employing nine- tenths of the workers in the BLS survey. In most of the remaining establishments, bolting was the primary joining process. Riveting, once an important method of joining metal parts, has been largely replaced.
1 See appendix A for scope and method of survey. Wage data contained in this bulletin exclude premium pay for overtime and for work on weekends, holidays, and late shifts.
2 See In d u s try Wage S u rvey : F a b r ica ted S tru c tu ra l S tee l, O c to b e r 1 9 6 9 , Bulletin 1695 (Bureau of Labor Statistics, 1971).
3 For definitions o f regions, see appendix A, table A -l, footnote 1.
4 See appendix B for job descriptions.
L ocation . Nearly three-fourths of the production workers in the survey were concentrated in four regions—Middle Atlantic (21 percent), Great Lakes (20 percent), Southwest (18 percent) and Southeast (15 percent). None of the remaining regions studied employed more than 7 percent of the industry’s work force.
Approximately nine-tenths of the production and related workers were located in metropolitan areas. Such areas included over nine-tenths of the workers in the Great Lakes, Middle Atlantic, Mountain, New England, and Pacific regions; seven-eighths in the Southeast; about four- fifths in the Border States and Middle West; and nearly seven-tenths in the Southwest.
Just under one-sixth of the industry’s production workers were concentrated in seven areas studied separately. Employment in these areas ranged from 2,068 in the New York-New Jersey Consolidated Area to 689 in Cleveland and 896 in Birmingham. The four remaining areas— Chicago, Detroit, Houston, and Los Angeles-Long Beach- reported between 1,250 and 1,450 workers.
Virtually all workers^were in establishments providing paid holidays and vacations, as well as at least part of the cost of life, hospitalization, surgical, and basic medical insurance. Workers typically received 6 to 10 paid holidays annually and 1 week of vacation pay after 1 year of service, 2 weeks after 3 years, 3 weeks after 10 years, and at least 4 weeks after 25 years. Retirement plans applied to slightly more than four-fifths of the workers.
E stablishm ent size. Nearly two-thirds of the industry’s production work force were in establishments employing at least 100 workers. Regionally, the proportions of workers in establishments with 100 workers or more ranged from nearly one-half in the Pacific to approximately three- fourths in the Border States, Great Lakes, and Southwest. Establishments with fewer than 20 workers were excluded from the survey.
Unionization. Plants operating under labor-management agreements employed just over seven-tenths of the production workers in the industry. Regionally, the proportion of workers ranged from slightly less than three-tenths in the Southeast to more than nine-tenths in the Great Lakes, Middle Atlantic, and Pacific. In the seven areas selected for separate study, the proportion of workers in union establishments varied from 25 percent in Houston to 75 percent in Birmingham and to over 90 percent in the remaining five areas. The International Association of Bridge, Structural
1Digitized for FRASER http://fraser.stlouisfed.org/ Federal Reserve Bank of St. Louis

and Ornamental Iron Workers (AFL-CIO) was the major union in the industry. The United Steelworkers of America (AFL-CIO) also had collective bargaining agreements with some establishments in fabricated structural steel manufacturing.
The degree of unionization was greater in metropolitan than in nonmetropolitan areas (three-fourths compared with about two-fifths) and somewhat higher in plants with 100 workers or more than in smaller establishments (three- fourths compared with about two-thirds).
M eth od o f wage paym en t. Over nine-tenths of the plant workers were paid on a time-rated basis, usually under formal plans that provided a single rate for a specified occupation (table 14). Formal systems with ranges of rates for specified jobs applied to one-third of the workers, while informal systems, which based rates primarily on the qualifications of individual workers, applied to slightly over one-eighth of the employees.
Average hourly earnings
Straight-time earnings of 63,741 production and related workers covered by the survey averaged $4.55 an hour in November 1974 (table l) .5 Workers in the Middle Atlantic and Great Lakes—the two largest regions studied separately-averaged $5.38 and $4.92 an hour, respectively. Other regional averages ranged from $3.59 in the Southeast to $6.10 in the Pacific.
Average earnings for the seven areas of industry concentration studied separately ranged from under $4 in Birmingham ($3.85) and Houston ($3.63) to over $6 an hour in Detroit, Los Angeles-Long Beach, and the New York-New Jersey Standard Consolidated Area (tables 7-13).
5 Straight-time average hourly earnings of production workers in this bulletin differ in concept from the gross average hourly earnings published in the Bureau’s monthly hours and earnings series ($4.98 in November 1974). Unlike the latter, the estimate presented here excludes premium pay for overtime and for work on weekends, holidays, and late shifts. Average earnings are calculated by summing individual hourly earnings and dividing by the number o f individuals; in the monthly series, the sum of the hours reported by establishments in the industry is divided into the reported payroll totals.
The estimate o f the number of production workers within the scope of the study is intended only as a general guide to the size and composition o f the labor force included in the survey. It differs from those published in the monthly series (80,700 in November 1974) in part by the exclusion o f establishments employing fewer than 20 workers. The advance planning necessary to make the survey required the use of lists o f establishments assembled considerably in advance of data collection. Thus, establishments new to the industry are omitted, as are establishments originally classified in the fabricated structural steel industry but found in other industries at the time of the survey. Also omitted are establishments classified incorrectly in other industries at the time the lists were compiled.
Nationwide, workers in metropolitan areas averaged $4.62 an hour, 19 percent more than the $3.88 average for workers in nonmetropolitan areas. Employees in plants with 20-99 workers were paid about the same as those in larger plants (100 workers or more)—$4.56 an hour compared to $4.54. Such nationwide relationships did not always hold regionally. To illustrate, workers in nonmetropolitan areas in the Southwest averaged 9 percent more than those in metropolitan areas. Workers in establishments with 20-99 workers in the Pacific region averaged 5 percent an hour more than larger firms—$6.25 compared with $5.94.
Establishments having labor-management contracts covering a majority of their production workers averaged $4.89 an hour, compared with $3.70 in plants with none or a minority covered by such agreements.
Comparisons of averages do not, of course, isolate the influence of each factor as a determinant of wages. The interrelationship of some variables has been suggested in the discussion of industry characteristics.
Individual earnings of slightly more than nine-tenths of the production workers fell within a range of $3 to $7 an hour in November 1974 (table 2). The middle 50 percent of the production work force earned between $3.72 and $5.30 an hour. Regionally, the proportions of workers at the lower and upper ends of the earnings array varied widely. For example, slightly more than one-fifth of the workers earned below $3 an hour in the Southwest. On the other hand, fewer than 5 percent of the workers earned below $3 an hour in the New England, Middle Atlantic, Great Lakes, Middle West, Mountain, and Pacific regions. At the upper end of the array, nearly two-thirds of the plant workers in the Pacific earned $6 or more an hour, compared with just over one-fourth of workers in the Middle Atlantic and 2 percent or less in the Border States, Middle West, Mountain, Southeast, and Southwest regions.
Occupational earnings
The survey developed earnings data for a number of individual occupations selected to represent a wide range of skills, from general helpers to highly trained personnel who fabricate metal parts in the industry. These occupations accounted for slightly less than two-thirds of the 63,741 production work force. Average hourly earnings in November 1974 ranged from $5.50 for general (production) mechanics to $3.13 for watchmen. Averages also exceeded $5 an hour for workers in occupational categories such as template makers ($5.45); maintenance machinists ($5.44); layers-out, structural steel ($5.36); inspectors, class A ($5.26); and maintenance carpenters and maintenance electricians (both at $5.25). Hand welders and structural fitters, numerically the two largest occupations studied, averaged $4.67 and $4.88 an hour, respectively (table 3).
2Digitized for FRASER http://fraser.stlouisfed.org/ Federal Reserve Bank of St. Louis
T e x t table 1. Percent increase in average h o u rly earnings, fabricated structural steel m anufacturing, O ctober 1969 toN ovem ber 1974
Occupation Percentincrease Occupation Percent
increase
All production workers 45 PROCESSING-CONTINUED
MAINTENANCE
Carpenters, m aintenance.....................Electricians, m aintenance...................Machinists, m aintenance....................
544352
Welders, handClass A ..........................Class B ...........................
Welders, machine (arc or gas) Welders, tack .............................
43403639
PROCESSING MISCELLANEOUSFitters, structural.......................................Flame-cutting-machine operators.........Friction-sawing-machine operators.....Helpers, general m echanic.......................Helpers, pow er-brake...............................Helpers, power-shear ...............................Helpers, punch-press.................................Layers-out, structural steel ....................Mechanics, general (p ro du ctio n )..........Painters, rough, brush ..............................Painters, rough, spray ..............................Planer operators, edge or ro ta ry ...........Power-brake operators, structural steelPower-shear operators..............................Punch-press operators
Class A ..............................................Class B ................................................
Riveters ..........................................................Template makers.........................................
3944 37404350 4746 524745514440
41 39 39 47
Inspectors, class A Inspectors, class BJanitors ..................M arkers...................Stock c le rks..........W atchm en..............
M ATERIAL MOVEMENT
Crane operators, electric bridgeUnder 20 to n s ...........................................20 tons and over.......................................
TruckdriversL ig h t............................................................M edium .......................................................Heavy (over 4 tons, trailer type)..........Heavy (over 4 tons, other than trailer
type).......................................................Truckers, power
F o rk lift........................................................Other than fo r k l i f t ..................................
434044 3541 56
4445
705148
30
4748
N o t e : T h e s e s u r v e y s , b a s e d o n a r e p r e s e n t a t i v e s a m p l e o f e s t a b l i s h
m e n t s , a r e d e s i g n e d t o m e a s u r e t h e l e v e l o f o c c u p a t i o n a l e a r n i n g s
a t a p a r t i c u l a r t i m e . T h u s , c o m p a r i s o n s m a d e w i t h p r e v i o u s s t u d i e s
m a y n o t r e f l e c t e x p e c t e d w a g e m o v e m e n t b e c a u s e o f c h a n g e s i n
t h e u n i v e r s e a n d s a m p l e o v e r t i m e a n d t h e a s s o c i a t e d n e c e s s a r y
c h a n g e i n t h e s a m p l e c o m p o s i t i o n a n d s h i f t s i n e m p l o y m e n t a m o n g
e s t a b l i s h m e n t s w i t h d i f f e r e n t p a y l e v e l s . S u c h s h i f t s , f o r e x a m p l e ,
c o u l d d e c r e a s e a n o c c u p a t i o n a l a v e r a g e , e v e n t h o u g h m o s t e s t a b l i s h
m e n t s i n c r e a s e d w a g e s b e t w e e n t h e p e r i o d s b e i n g c o m p a r e d .
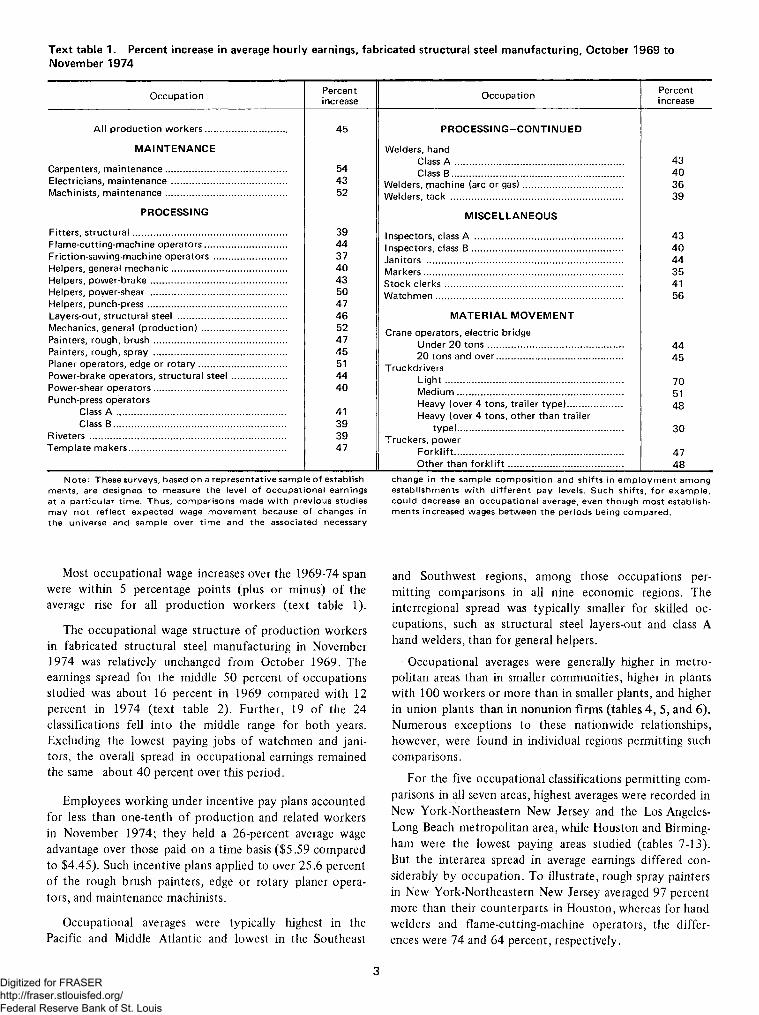
Most occupational wage increases over the 1969-74 span were within 5 percentage points (plus or minus) of the average rise for all production workers (text table 1).
The occupational wage structure of production workers in fabricated structural steel manufacturing in November 1974 was relatively unchanged from October 1969. The earnings spread for the middle 50 percent of occupations studied was about 16 percent in 1969 compared with 12 percent in 1974 (text table 2). Further, 19 of the 24 classifications fell into the middle range for both years. Excluding the lowest paying jobs of watchmen and janitors, the overall spread in occupational earnings remained the same—about 40 percent over this period.
Employees working under incentive pay plans accounted for less than one-tenth of production and related workers in November 1974; they held a 26-percent average wage advantage over those paid on a time basis ($5.59 compared to $4.45). Such incentive plans applied to over 25.6 percent of the rough brush painters, edge or rotary planer operators, and maintenance machinists.
Occupational averages were typically highest in the Pacific and Middle Atlantic and lowest in the Southeast
and Southwest regions, among those occupations permitting comparisons in all nine economic regions. The interregional spread was typically smaller for skilled occupations, such as structural steel layers-out and class A hand welders, than for general helpers.
Occupational averages were generally higher in metropolitan areas than in smaller communities, higher in plants with 100 workers or more than in smaller plants, and higher in union plants than in nonunion firms (tables 4, 5, and 6). Numerous exceptions to these nationwide relationships, however, were found in individual regions permitting such comparisons.
For the five occupational classifications permitting comparisons in all seven areas, highest averages were recorded in New York-Northeastern New Jersey and the Los Angeles- Long Beach metropolitan area, while Houston and Birmingham were the lowest paying areas studied (tables 7-13). But the interarea spread in average earnings differed considerably by occupation. To illustrate, rough spray painters in New York-Northeastern New Jersey averaged 97 percent more than their counterparts in Houston, whereas for hand welders and flame-cutting-machine operators, the differences were 74 and 64 percent, respectively.
3Digitized for FRASER http://fraser.stlouisfed.org/ Federal Reserve Bank of St. Louis

( W a t c h m e n ' s a v e r a g e h o u r l y e a r n i n g s = 1 0 0 f o r e a c h y e a r )
T e x t table 2. Occupational wage relationships in fabricated structural steel m anufacturing, O ctober 1969 andN ovem ber 1974
Occupation October1969
November1974 Occupation October
1969November
1974
Buckers-up, pneum atic.................................. 151 ( M Power-brake operators, structural steel ... 161 150Carpenters, m aintenance.............................. 170 168 Power-shear operators................................... 155 139Crane operators, electric bridge: Punch-press operators, structural steel:...
Under 20 to n s ..................................... 151 139 Class A ....................................................... 167 15120 tons and over................................. 162 151 Class B .................................................. 151 135
Crane operators, m o b ile ............................... ( 2 ) 159 Riveters, pn eu m atic ....................................... 165 147Electricians, m aintenance............................. 183 168 Stock clerks....................................................... 145 131Fitters, structural............................................ 175 156 Template makers ............................................ 184 174Flame-cutting-machine operators.............. 163 150 Truckdrivers:Friction-sawing-machine operators........... 151 133 L ig h t...................................................... 131 143Helpers, general m echanic............................ 138 124 Medium ................................................. 133 129Helpers, pow er-brake.................................... 143 131 Heavy (over 4 tons, trailer 157 150Helpers, power-shear...................................... 136 131 type).................................................Helpers, punch-press...................................... 141 133 Heavy (over 4 tons, other thanInspectors, class A ........................................... 183 168 trailer type)................................... 172 143Inspectors, class B ................................................... 166 149 Truckers, power:Inspectors, class C ........................................... <M 137 F o rk lift.................................................. 157 148Janitors............................................................... 119 110 Other than fo r k l i f t ............................ 152 144Layers-out, structural steel.......................... 183 171 W atchm en.......................................................... 100 100Machinists, maintenance............................... 178 174 Welders, hand:Markers............................................................... 164 142 Class A ....................................................... 170 156Mechanics, general (production)................ 180 176 Class B ................................................... 151 135Painters, rough, brush.................................... 150 142 Welders, machine (arc or gas)....................... 174 151Painters, rough, spray.................................... 149 139 Welders, machine (resistance)..................... 168 150Planer operators, edge or ro ta ry ................ 161 156 Welders, ta ck ..................................................... 142 127
1 D a t a d o n o t m e e t p u b l i c a t i o n c r i t e r i a .
2 J o b n o t s t u d i e d i n 1 9 6 9 .
Establishment practices and supplementary wage provisions
Information was also obtained for production workers, on work schedules, shift differential provisions and practices, and the incidence of selected supplementary benefits including paid holidays and vacations; health, insurance and retirement plans; cost-of-living provisions; paid funeral and jury-duty leave; technological severance pay; and supplemental unemployment benefits.
Scheduled weekly hours. Work schedules of 40 hours a week were in effect in establishments employing three- fourths of the production workers (table 15); most of the remaining work force had weekly work schedules of 45,48, or 50 hours. Three-fifths or more of production workers in all regions except the Southwest had work schedules of 40 hours. In the Southwest, however, a substantial proportion of the workers were scheduled 45 to 50 hours.
Shift differential provisions and practices. Nationwide, establishments employing four-fifths or more of the production workers had provisions for late-shift operations,although only one-sixth were on such shifts at the time of the survey (tables 16 and 17). Regionally, the proportions of workers actually employed on second shifts ranged from about 10 percent in the New England and Border States to
nearly 20 percent in the Great Lakes. The proportion of workers actually employed on third shifts did not exceed 4 percent in any region. A large majority of the workers on late shifts received a cents-per-hour differential over day rates. The most common differentials for second-shift workers were 10 and 15 cents an hour, and for third- or other late-shift work—15 cents an hour.
Paid holidays. Paid holidays, typically 6 to 10 days annually, were provided by establishments employing virtually all of the production workers in the survey (table 18). Provisions varied among and within regions. The most common provisions were 6 to 8 days annually in the Border States, Southeast, and Southwest; 8 or 9 days in the Mountain States; and 9 days or more in the other regions.
Paid vacations. Paid vacations, after qualifying periods of service, were provided to nearly all of the production workers in the industry (table 19). In November 1974, typical provisions for these employees were 1 week of vacation after 1 year of service, 2 weeks after 3 years, 3 weeks after 10 years, and at least 4 weeks after 25 years. The emerging trend toward longer vacations was especially apparent in the Middle Atlantic, Great Lakes, Middle West, and Pacific regions where about half of the workers or more were eligible for 4 weeks after 20 years in November 1974.
4Digitized for FRASER http://fraser.stlouisfed.org/ Federal Reserve Bank of St. Louis

H ealth , insurance, and re tirem en t plans. Life, hospitalization, surgical, basic medical, and major medical insurance were provided to nearly nine-tenths of the production workers or more in the industry (table 20). Provisions for accidental death and dismemberment insurance, and sickness and accident insurance or sick leave or both applied to about four-fifths of the workers. Both dental care and visual care plans were available to one-sixth of the work force and long-term disability insurance plans, to one- twelfth. Such extended disability coverage applied to approximately one-eighth of the workers in the New England, Southeast, Southwest, and Great Lakes regions, but was virtually nonexistent in the remaining regions.
Retirement pension plans, usually entirely employer- financed, were available to about four-fifths of the workers
nationwide and to a majority of the workers in each region shown separately.
O ther selected benefits. Formal provisions for jury-duty and funeral leave pay each covered approximately seven- tenths of the production workers in the industry. Provisions for periodic cost-of-living pay adjustments were reported by plants employing about one-third of the industry’s work force. Among regions, only in the Middle Atlantic and Great Lakes were about one-half the workers covered by such pay adjustments. Establishments having formal plans for lump-sum payments to eligible employees permanently separated from employment because of technological change or force reduction employed nearly one-eighth of the workers in the industry. A similar proportion of production workers were in plants providing supplemental unemployment benefits (table 21).
5Digitized for FRASER http://fraser.stlouisfed.org/ Federal Reserve Bank of St. Louis

TftM« 1. Average hourly earnings: By selected characteristics 1 2 3
(Number and average straight-time hourly earnings1 of production workers in fabricated structural steel manufacturing establishments by selected characteristics, United States and Regions, November 1974)
Middle BorderPaci f i cUnited S tates New England A tla n t ic S ta tes Southeast Southwest Great Lakes Middle West Mounta in
Num Aver Num Aver Num Aver N um A ver - Num Aver Num Aver Num Aver- Num- A ver Num Aver- Num- Aver-Item ber age ber age ber age ber age ber age ber age ber age ber age ber age ber age
o f hourly o f hourly o f hourly o f hourly o f hourly of h ou rly o f hourly o f hourly o f hourly o f hourlywork earn work earn work earn work earn work earn work earn work earn work earn work earn work earn
ers ings e rs ings e rs ings ers in gs ers in g s ers in g s e r s in g s e rs in g s ers in gs e rs ings
All nr n^n /*■ +• i on wnrV pr^ 63 ,741 $4 .55
4 .6 2
1 ,753 $4 .78 1 3 ,2 0 7 $ 5 .3 8 4 ,0 2 5 $ 3 . 8 2 9 ,2 6 4 $ 3 .5 9 1 1 ,3 2 7 $3 .7 1 12, 716 $ 4 .9 2 4 , 7 0 9 $ 4 . 3 7 2 ,5 2 0 $ 4 .3 0 4 ,2 2 0 $6 . 10i i l i pi UUUC t l '-'l 1 WUJ.ACI.O JL/ ••«••• ••••••♦
Sis* of community:"t it o po l i t an ar^as / _P__ 56 ,922 1 ,616 4 . 8 5 1 3 ,0 5 7 5 .4 0 3 ,0 9 0 3 . 7 9 8 ,0 5 0 3 .6 1 8 ,0 6 4 3 . 6 2 12 ,7 1 6 4 . 9 2 3 ,8 3 9 4 . 3 8 2 ,2 7 0 4 . 3 7 4 ,2 2 0 6 - 10
N onm etrop^litan _________ 6 ,8 1 9 3. 88 _ _ - - - 3 ,2 6 3 3 .9 5 - - - - - - - -
Size of establishment:20 -9 9 w orkers................................................... 2 1 , 1 2 1 4 .56 4 ,7 4 1 * 5 .37 3 ,4 7 7 * 3 . 4 6 2 ,8 4 6 3 . 4 3 3, 208 4 .7 4 _ _ _ - 2 ,1 4 8 6 . 2 51 0 0 workers ^r m nrp._. . . . . . . . . . . . . . 4 2 ,6 2 0 4 .54 1, 164 4 . 5 8 8 , 4 6 6 5 .3 8 2 ,9 0 0 3 . 7 0 5 ,7 8 7 3 . 6 7 8 ,481 3 .8 1 9, 508 4. 98 3 , 1 9 9 4 . 4 6 - - 2 ,072 5 .9 4
Labor-management contract coverage:E stablishm ents w ith —
M a jority o f workers c o v e r e d .. . . . . - 45 ,320 4 .89 1 ,533 4 .8 4 1 2 , 5 4 8 5 .43 2 ,3 2 4 3 . 7 0 2 ,5 5 3 3 . 9 3 3 ,8 3 0 3 . 8 3 12, 274 4. 94 3 ,8 6 2 4 . 3 8 2 ,2 1 6 . 4 . 3 6 4 ,1 8 0 6 . 1 1
None or m in ority o f workers7 ,4 9 7 3 . 6 6co v e re d ........................................................... 18,421 3 . 7 0 “ “ “ ~ '
6 ,711 3 . 4 6
1 Excludes premium pay for overtime and for work on weekends, holidays, and late shifts.2 Virtually all workers were men.3 Standard Metropolitan Statistical areas as defined by the U. S. Office of Management and Budget through February 1974.
NOTE: Dashes indicate no data reported or data that do not meet publication criteria.
Digitized for FRASER http://fraser.stlouisfed.org/ Federal Reserve Bank of St. Louis

Table 2. Earnings distribution: All production workers
(Percent distribution of production workers in fabricated structural steel manufacturing establishments by straight-time hourly earnings,1 United States and regions, November 1974)
H ourly e a r n i n g s ,\/U nitedS t a t e s New England
M id dleA t l a n t i c
BorderS ta te s S o u th e a s t Southw est G rea t Lakes M id dle West Mountain P a c i f i c
T o t a l ........................................................................................... 1 0 0 . 0 1 0 0 . 0 1 0 0 . 0 1 0 0 . 0 1 0 0 . 0 1 0 0 . 0 1 0 0 . 0 1 0 0 . 0 1 0 0 . 0 1 0 0 . 0
Under $ 2 . 5 0 . . . . . . . . ....................................................... 2 . 1 - . 2 3 .5 4. 8 6 . 0 ( 2 ) .3 1 . 0 . 2
$ 2 . 5 0 and under $ 2 . 6 0 .................................................. 1 . 2 _ (2 ) 1 . 0 1. 5 4 . 5 . 2 .4 . 2 _$ 2 . 6 0 and under $ 2 . 7 0 .................................................. . 8 - . 1 2 .5 1 - 2 2 . 4 - - . 1 _$ 2 . 7 0 and under $ 2 . 8 0 .................................................. 1 . 2 . 2 - 2-5 2 - 1 3 . 6 . 2 . 1 .4 _$ 2 . 8 0 and under $ 2 . 9 0 .................................................. 1 . 2 . 3 - 1 . 2 4. 5 2 . 6 ( 2 ) - 1 . 1 _$ 2 . 9 0 and under $ 3 . 0 0 .................................................. 1 . 0 1 . 6 . 1 2 .5 1 . 6 3 . 0 ( 2 ) . 2 . 2 "
$ 3 . 0 0 and under $ 3 . 2 0 . . . . . ...................................... 3 . 8 1 .3 . 3 2 . 2 9 .9 8 . 7 . 8 4 . 0 2. 5 _$ 3 . 2 0 and und er $ 3 . 4 0 . . . . .............................. .. 4 . 7 2 . 2 . 9 5 .8 14 .0 7 . 9 . 8 5. 1 3 . 8 -
$ 3 . 4 0 and under $ 3 . 6 0 ........................................ .. 5 . 2 5. 2 . 9 14 .9 8 . 5 7 . 5 3 . 4 5 . 2 6 .9 . 1$ 3 . 6 0 and under $ 3 . 8 0 .................................................. 6 . 1 3. 3 1. 3 12 .7 1 2 .5 9 . 8 1 .7 8 . 8 1 0 . 0 . 2$ 3 . 8 0 and under $ 4 . 0 0 . . . . . . . . . . . . . . . . . . . . . 6 . 4 6 . 1 1 . 9 16.2 1 0 . 0 8 . 2 5 . 4 6 . 1 9 . 2 -
$ 4 . 0 0 and under $ 4 . 2 0 ............................................... .. 6 . 9 10 . 6 3. 0 1 0 . 2 11.4 5. 9 7 . 3 1 1 . 6 7 . 4 . 2$ 4 . 2 0 and under $ 4 . 4 0 ................................. ................ 7 . 4 8 . 0 6 . 0 8 .3 8 . 0 5 . 3 8 . 7 13 .1 13. 2 1 . 0$ 4 . 4 0 and under $ 4 . 6 0 . ........................................ .. 7 . 0 8 . 7 8 . 6 4 .6 5 . 1 7 . 6 8 . 7 7 . 2 6 . 3 1 . 0$ 4 . 6 0 and under $ 4 . 8 0 ................................. .. 6 . 4 1 .4 7 . 4 5 .3 2 . 2 4 . 4 9 . 4 1 3 .0 9 .3 2 .5$ 4 . 8 0 and under $ 5 . 0 0 . . . .......................................... 5 . 4 6 . 4 9. 1 1.4 . 8 3 . 1 7 . 3 3 .9 17. 1 2 .7
$ 5 . 0 0 and und er $ 5 . 2 0 . ................................................ 5. 0 3. 6 1 0 . 7 1 . 2 1 .3 . 8 7 . 3 5 . 2 4 .7 3.0$ 5 . 2 0 and under $ 5 . 4 0 . . . . . ....................... .............. 6 . 3 9 . 2 8 . 6 1 . 2 .3 6 . 8 10 .9 2 . 2 2 . 1 7 . 4$ 5 . 4 0 and und er $ 5 . 6 0 . . . . . . . .................. 4 .2 9. 0 5 .4 1 . 2 . 1 1 . 0 8 . 4 6 . 6 4 . 5 3 .4$ 5 . 6 0 and under $ 5 . 8 0 ............. .................................... 2. 9 1 0 . 0 4. 2 . 4 (2 ) . 5 5 . 0 3 . 9 . 2 5 .0$ 5 . 8 0 and under $ 6 . 0 0 . . . . ..................... .. 2 . 7 5. 5 4. 1 - (2 ) . 1 5 - 2 1 . 8 ( 2 ) 8 .3
$ 6 . 0 0 and under $ 6 . 2 0 ................................. ................ 2 . 8 1 . 2 4. 4 (2 ) (2 ) . 2 2 . 5 . 5 . 2 18.7$ 6 . 2 0 and under $ 6 . 4 0 ............................................. 1 .9 3 . 5 1 .7 - 3 .1 . 1 . 2 12.7$ 6 . 4 0 and under $ 6 . 6 0 .......................................... .. 2 .9 1. 9 8. 7 ( 2 ) - - 1 .3 - - 11 .4$ 6 . 6 0 and under $ 6 . 8 0 . . . . . . . ................................. 1 . 8 . 1 5. 6 . 1 - - . 9 . 1 ( 2 ) 6 .4$ 6 . 8 0 and under $ 7 . 0 0 . . . . . . . . . ............................ 1 . 1 . 1 1 . 5 - - - .7 - . 2 9 .4
$ 7 . 0 0 and o v e r ................................................ ................... 1 . 8 . 7 5. 3 . 8 - - .7 . 6 . 1 6 . 6
Number o f w o r k e r s .................. ......................................... 6 3 ,741 1 ,7 5 3 13 ,207 4 ,025 9 , 2 6 4 11 ,327 12 ,716 4 , 7 0 9 2 ,5 2 0 4 ,2 2 0
A v era ge h o u r l y e a r n i n g s . . . . . . ....................... .. $ 4 . 5 5 $ 4 . 7 8 $ 5 .3 8 $3 .82 $ 3 .59 $ 3 .7 1 , $ 4 .9 2 $4. 37 $ 4 .3 0 $ 6 . 1 0
1 Excludes premium pay for overtime and for work on weekends, holidays, and late shifts.2 Less than 0.05 percent.
NOTE: Because of rounding, sums of individual items may not equal 100.
Digitized for FRASER http://fraser.stlouisfed.org/ Federal Reserve Bank of St. Louis

Table 3. Occupational averages: All establishmentsNumber and average straight-time hourly earnings1 of production workers in selected occupations in fabricated structural steel manufacturing establishments, United States and selected regions, November 1974)
UnitedS t a t e s New England
MiddleA t l a n t i c
BorderS t a t e s S o u th e a s t Southw est Great Lakes M id d le West Mountain P a c i f i c
O c c u p a t i o n and s e xNum
bero f
worke r s
A v e r age
h o u r l ye a r n
i n g s
Numb e ro f
worke r s
Aver age
h o u r l ye a r n
i n g s
Numbero f
w ork e r s
Average
h o u r l ye a r n
i n g s
Numbero f
worke r s
A v e r age
h o u r l ye a r n
i n g s
Numb e ro f
worke r s
Average
h o u r lye a r n
i n g s
Numbero f
worke r s
A v e r age
h o u r l ye a r n
i n g s
Num-bero f
worke r s
A v e r -age
h o u r l ye a r n
i n g s
Numb e ro f
w orke r s
A v er age
h o u r l ye a r n
i n g s
Numbero f
worke r s
Avera ge
h o u r l ye a r n
i n g s
Numb e ro f
worke r s
Aver age
hou r lye a r n
in g s
S e l e c t e d o c c u p a t i o n s 2 /
C a r p e n t e r s , m a i n t e n a n c e . ............................................ 65 $5. 25 1 9 $ 5 .5 5 15 $ 4 .4 3Crane o p e r a t o r s , e l e c t r i c b r i d g e 3 / ( 2 , 0 4 5
men, 29 w o m e n ) . . . . . . ........................................... .. 2 ,0 7 4 4 . 5 7 56 $4 .7 7 527 5 .1 7 150 $3 . 71 293 $ 3 .5 6 273 4 .0 0 437 $ 4 .8 2 170 $ 4 . 4 0 40 $ 4 .2 5 128 $5 .9 5Under 20 t o n s (1 ,1 6 1 men, 17 women)........... 1, 178 4 . 36 42 4 .5 9 207 5. 33 88 3. 69 228 3. 52 157 3 . 4 9 274 4 . 6 7 74 4 . 18 37 4 . 2 3 71 5 .8 820 t o n s and o v e r (623 men, 12 w o m e n ) . . . . 635 4 . 7 4 - - 176 5 . 1 9 62 3 . 7 5 65 3 .71 116 4 . 6 9 132 5. 17 55 4 . 39 - - - -
Crane o p e r a t o r s , m o b i l e . . . . . ........... .. 235 4 . 9 8 19 $5. 16 34 5 .5 4 - - 43 4 .4 2 h i 4 . 0 7 42 5 .3 3 1 0 4 . 0 7 - - 29 $6.45E l e c t r i c i a n s , m a i n t e n a n c e ................................. .. 466 5. 25 13 5 .4 8 139 5 .7 4 31 $4 . 30 66 4 .3 4 60 4 . 6 2 97 5 .4 9 20 5 .0 8 11 $ 4 . 6 5 29 6 .79F i t t e r s , s t r u c t u r a l ( 5 ,3 9 6 men, 4 w om en ) . . 5 ,400 4 .8 8 98 4 .7 3 1 , 1 6 8 5 .71 310 4 . 1 3 891 3 .8 3 910 4 .3 0 1,073 5. 15 367 4 . 5 8 170 4 .8 0 413 6 . 2 1F I a m e - c u t t i n g - m a c h i n e o p e r a t o r s ( 1 ,5 1 2
men, 1 woman)......................................................... ............ 1 ,513 4 .71 24 5 .0 2 406 5 . 2 6 67 4 . 12 215 3 .83 2 1 2 3 . 9 9 325 4 .89 1 2 2 4 .7 2 53 4 . 4 7 89 5 .93F r i c t i o n - s a w i n g - m a c h i n e o p e r a t o r s . . ................ 418 4 . 1 7 15 4 .5 4 40 4 . 9 8 41 3. 99 92 3 .5 0 89 3 .7 4 74 4 . 8 3 22 4 . 2 9 30 4 . 2 2 15 5.21H e l p e r s , g e n e r a l m ech an ic ( 2 ,7 6 0 men, 34
women) ................................................................................. .. 2 ,794 3 . 8 8 89 3 .9 8 860 4 . 7 8 265 3. 19 424 2 . 8 8 29 3 3 .0 7 253 4. 12 302 3 . 3 7 177 3 . 6 5 131 5 .37H e l p e r s , p o w e r - b r a k e ................ ..................................... 181 4. 11 - - 27 5 . 0 0 7 3 . 8 5 24 3 .2 0 29 3 .2 7 57 4 . 5 3 17 3 .8 7 - - - -H e l p e r s , p o w e r - s h e a r (357 men, 2 w o m e n ) . . . 359 4 .1 0 - - 108 5 . 0 0 29 3 . 90 38 3 .1 8 54 3 .0 1 54 4 . 3 3 41 3 . 9 0 - - - -H e l p e r s , p u n c h - p r e s s (290 men, 4 w o m e n ) . . . 294 4 . 1 6 7 $ 4 .2 7 92 5 . 1 3 20 3 . 7 7 29 3. 39 49 2 . 8 8 54 4. 10 2 2 3 .9 4 - - 17 $4 .90I n s p e c t o r s , c l a s s A (543 men, 2 w o m e n ) . . . . 545 5 . 2 6 7 4 .9 6 173 5 . 7 6 19 4 . 5 0 80 4 .39 106 4. 54 82 6 . 0 6 50 5 . 4 2 18 $ 4 .9 6 10 6 .17I n s p e c t o r s , c l a s s B (169 men, 9 w o m e n ) . . . . 178 4 . 6 5 14 5 . 0 0 13 5. 11 21 4 . 0 9 28 4 .29 35 3 . 9 7 57 5 . 2 1 - - - - - -I n s p e c t o r s , c l a s s C................ .. 75 4. 28 - - - - - - 21 3 .9 5 - - 40 4 .3 6 9 $ 4 . 8 5 - - - -J a n i t o r s (412 men, 18 w o m e n ) . . . . . . ............. 430 3 . 4 4 - - 63 4 . 3 0 38 $2 . 87 78 2. 87 105 $ 2 . 7 0 99 4. 06 27 3 . 8 2 - - 12 $4 .83L a y e r s - o u t , s t r u c t u r a l s t e e l ( 3 ,1 2 1 men, 1
woman)....................................................................................... 3 ,122 5 . 3 6 2 1 0 $ 5 .5 5 74 9 6 . 2 2 182 4 . 7 8 394 4 .24 344 4 . 2 2 460 5 .3 4 207 4 . 8 0 213 $ 4 . 8 5 363 6 . 7 6M a c h i n i s t s , m a i n t e n a n c e . . . . . . . . . . . . . . . . . . . 434 5 . 4 4 14 4 . 6 8 137 6 . 1 1 18 4 . 2 2 35 4 .4 7 84 4 .3 8 91 6 . 2 3 18 4 . 7 9 19 4 . 8 6 18 6 .32M a r k e r s . . . ......................................... ........................... .. 47 4 . 4 3 - - 20 4 .71 - - - - - - 11 5 .3 1 6 4 . 3 6 - - - -M e c h a n i c s , g e n e r a l ( p r o d u c t i o n ) ( 2 ,1 5 1
men, 2 women). . . . . . . . . . . . . . . . . . . . . . . . . . . . 2 ,153 5 . 5 0 118 4. 59 729 6 . 7 8 74 4 . 2 7 176 $ 3 .8 8 87 $ 4 .0 2 238 4 . 4 3 249 4 .5 1 148 4 . 7 3 334 6 .4 0P a i n t e r s , r o u g h , b ru s h (116 men, 3 women). 119 4 . 4 3 - - 50 4. 48 - - - - - - 49 4 .6 8 - - - -P a i n t e r s , r o u g h , s p r a y ( 1 ,5 7 6 men, 6
women) ............... ............................................................... .. 1 ,582 4. 35 69 $ 4 .59 289 5. 12 86 $ 3 . 5 3 319 $ 3 .41 251 $ 3 . 7 5 258 4 .6 2 108 $ 4 . 2 5 63 $ 4 . 3 3 139 5 .9 8P l a n e r o p e r a t o r s , e d g e o r r o t a r y . . .................. 122 4 . 8 8 - - 53 5 .3 3 - - 24 4 .2 5 - - 18 5 .0 6 18 4 . 2 0 - - - -P o w e r -b ra k e o p e r a t o r s , s t r u c t u r a l s t e e l
(504 men, 1 woman). . . . . . . . . . . . . . . . . . . . . . . 505 4 . 6 8 _ _ 77 5 . 9 2 34 $ 3 . 7 8 55 3 .85 87 $ 3 . 6 5 148 5 . 0 4 51 4 . 3 6 21 4 .1 0 30 $6 . 15P o w e r -s h e a r o p e r a t o r s (1 ,1 7 8 men, 8 women) 1 ,186 4 . 3 5 16 $ 4 .8 4 198 5 . 2 5 69 3 . 7 7 192 3. 52 239 3 . 5 2 259 4 .8 1 92 4 .2 0 58 4 . 2 7 63 6 . 0 2P u n c h - p r e s s o p e r a t o r s , s t r u c t u r a l s t e e l ,
c l a s s A (799 men, 1 woman).................................... 801 4 . 7 4 30 5 .4 4 179 5. 42 61 4 . 0 9 1 0 2 3 .8 2 134 3 . 6 3 131 5 .01 47 4 . 6 5 18 4 .2 4 99 5 .9 0P u n c h -p r e s s o p e r a t o r s , s t r u c t u r a l s t e e l ,
c l a s s B (418 men, 3 women) .................................... 421 $ 4 .2 4 15 $4 .63 77 $ 4 .8 6 43 $ 3 . 6 3 74 $3 .53 63 $ 3 .3 9 84 $4 .76 17 $ 4 . 04 24 $ 4 . 3 3 24 $ 5 .7 0R i v e t e r s , p n e u m a t i c . . . . . . . . . . . . . . . . . . . . . . . 31 4 .6 1 - - - - - - - - - - - - - - - - - -S t o c k c l e r k s . . . . ........... ................................ ................... 267 4. 10 7 4 .6 5 59 $ 4 . 3 5 31 $ 3 .7 7 51 $ 3 .7 7 27 $ 3 .3 3 49 $ 4 . 3 7 16 $ 3 . 9 4 12 $ 4 .0 9 15 5.32T em p la te makers (417 men, 2 w o m e n ) . . . . . . . . 419 5 . 4 5 8 5-18 173 5 . 7 4 - - 42 4.21 32 4 . 2 5 87 5 . 8 0 23 4 . 9 4 - - 35 6 .7 3T r u c k d r i v e r s 3 / ( 1 , 4 5 6 men, 1 w o m a n ) . . . . . . . 1,461 4 .5 1 51 5 .00 244 5 . 5 6 132 $ 3 .8 6 325 3 .5 0 217 3 .5 1 273 5. 24 95 4 . 87 52 $ 4 . 5 2 72 6 . 1 0
L i g h t (under 1 - 1 / 2 t o n s ) . . . . . . . . .................. 66 4 . 4 9 - - 15 5. 26 - - - - 6 3 .8 0 15 4 . 2 9 8 5 . 4 2 - - 8 6 .0 3Medium ( 1 - 1 / 2 t o and i n c l u d i n g 4 t o n s ) . . 207 4 . 0 4 - - 27 5 . 17 9 3 . 5 4 42 $3 .21 46 3 . 3 5 50 4 . 7 4 16 4 . 16 10 $ 4 . 2 4 - -Heavy ( o v e r 4 t o n s , t r a i l e r t y p e ) . . . . . . . 786 4. 69 19 $ 5 .6 5 125 6 . 0 0 78 4 . 0 5 180 3 .7 8 138 3 . 4 7 131 5 .3 4 44 5 . 4 3 23 5 .23 48 $6 . 2 0Heavy ( o v e r 4 t o n s , o t h e r than t r a i l e r t y p e ) . . . ........... .............. .. 224 4 . 4 9 14 5 .4 9 57 4 . 9 1 35 3 . 6 5 44 3 .6 2 _ _ 36 5 . 3 3 _ _ 11 3 .6 9 13 5 .9 7
T r u c k e r s , power (416 men, 1 w o m a n ) . . . . . . . . 417 4 .6 0 - - 91 5. 11 35 3 . 8 3 33 3 .62 48 $ 3 . 4 7 133 4 . 9 6 14 $ 4 .3 1 27 4 . 0 5 34 5.81F o r k l i f t (320 men, 1 w o m a n ) . . . . . . . . ........... 321 4 . 6 3 - - 6 8 5 . 0 9 - - 30 3 . 5 8 43 3 . 4 5 107 4 . 9 2 14 4 .3 1 20 4 . 1 6 32 5 .8 4Other than f o r k l i f t . ............................................ .. 96 4 . 5 2 - - 23 5 . 18 30 $ 3 . 8 6 - - - - 26 5- 10 - - 7 3 . 7 3 - -
Watchmen............................................... .. 133 3 . 1 3 - - 31 4 . 2 1 - - 45 $2 .50 - - 16 3 .9 1 - - - - - -W e l d e r s , hand ( 7 ,9 8 8 men, 29 w o m e n ) . . . . . . . 8 ,017 4 . 6 7 359 $4 .77 1 ,3 8 8 5 . 5 0 555 $ 3 .9 4 1 , 2 2 0 3 .78 1,601 $ 4 . 3 0 1 ,574 4 . 9 6 566 $ 4 . 6 4 396 $ 4 .4 5 358 $6 . 15
C l a s s A ( 5 , 3 8 8 men, 7 w o m e n ) . . ........................ 5 ,395 4 . 8 8 117 5 .24 1 ,0 1 3 5 . 8 0 364 4 . 0 3 677 3.91 1 ,2 5 6 4 . 5 0 894 5 .1 3 433 4 . 7 3 328 4 . 5 7 313 6 . 2 5C l a s s B ( 2 ,6 0 0 men, 22 w o m e n ) . . . . ............. 2 ,6 2 2 4 . 2 3 242 4 .5 4 375 4. 6 8 191 3 . 7 8 543 3 .62 345 3 .5 8 680 4 . 7 5 133 4 . 3 5 6 8 3 . 8 9 45 5 .4 2
W e l d e r s , m ach ine ( a r c o r gas) ( 2 , 6 7 6 men, 9 women) - ..................................................................... .. 2 ,6 8 5 4 . 7 3 93 5-06 445 5 . 2 6 68 4 . 1 0 314 3 -64 569 4 . 1 9 527 4 . 5 6 242 4 . 7 6 96 4 . 7 2 331 6 . 2 7
W e l d e r s , m achine ( r e s i s t a n c e ) . . . . . . . . . . . . . 193 4 . 6 8 - - - - - - 33 4 .2 4 - - 70 5. 15 - - 12 4 .9 8 - -W e l d e r s , t a c k ( 1 , 6 7 4 men, 10 w o m e n ) . . ........... 1 ,684 3 . 9 7 351 $ 4 . 9 0 105 $ 4 . 0 4 291 3 .5 8 544 $ 3 . 3 0 293 4.48 65 $ 3 . 7 2 32 3 . 9 9
1 Excludes premium pay for overtime and for work on weekends, holidays, and late shifts. These surveys, based on a representative sample of 2 Except where indicated, all workers were men.establishments, are designed to measure the level of occupational earnings at a particular time. Thus, comparisons made with previous studies may 3 Includes workers in classification in addition to those shown separately,not reflect expected wage movements because of changes in the universe overtime and the associated necessary change in the sample composition
and shifts in employment among establishments with different pay levels. Such shifts, for example, could decrease an occupational average, even NOTE: Dashes indicate no data reported or data that do not meet publication criteria,though most establishments increased wages between the periods being compared.
Digitized for FRASER http://fraser.stlouisfed.org/ Federal Reserve Bank of St. Louis

Table 4. Occupational averages: By size of community(Number and average straight-time hourly earnings1 of production workers in selected occupations in fabricated structural steel manufacturing establishments, United States and selected regions, November 1974)
U n i t e d S t a t e s New E n g la n d M i d d l e A t l a n t i c B o r d e r S t a t e s S o u t h e a s t
O c c u p a t i o nM e t r o p o l i t a n
a r e a sN o n m e t r o p o l i t a n
a r e a sM e t r o p o l i t a n
a r e a sM e t r o p o l i t a n
a r e a sM e t r o p o l i t a n
a r e a sM e t r o p o l i t a n
a r e a sNumber
o fw o r k e r s
A v e r a g eh o u r l y
e a r n i n g s
Numbero f
w o r k e r s
A v e r a g eh o u r l y
e a r n i n g s
Numbero f
w o r k e r s
A v e r a g eh o u r l y
e a r n i n g s
Numbero f
w o r k e r s
A v e r a g eh o u r l y
e a r n i n g s
Numbero f
w o r k e r s
A v e r a g eh o u r l y
e a r n i n g s
Numbero f
w o r k e r s
A v e r a g eh o u r l y
e a r n i n g s
C r a n e o p e r a t o r s , e l e c t r i c b r i d g e . . . . . . . . . . 1 , 9 2 0 $ 4 . 6 0 154 $ 4 . 1 7 48 $ 4 . 9 8 527 $ 5 . 17 118 $ 3 . 7 0 266 $ 3 . 6 1U n d er 20 t o n s .......................................................... .. 1 , 116 4 . 4 1 62 3 . 5 4 34 4. 8 5 20 7 5 . 3 3 8 8 3 . 6 9 2 0 1 3 . 5 82 0 t o n s a n d o v e r . . . . . . . . . . . . . . . . . . . . . . . . 543 4 . 7 6 92 4 . 6 0 - - 176 5 . 1 9 30 3 . 7 3 65 3 . 7 1
E l e c t r i c i a n s , m a i n t e n a n c e . . . . . . . . . . . . . . . . . 414 5 . 3 4 - - 13 $ 5 . 4 8 139 5 . 7 4 18 4 . 4 3 63 4 . 3 5F i t t e r s , s t r u c t u r a l .............. .. ............................................ 4 , 8 2 1 4 . 94 579 $ 4 . 3 4 89 4 . 7 8 1 , 1 6 8 5 . 7 1 27 2 4 . 12 810 3 . 8 5F l a m e - c u t t i n g - m a c h i n e o p e r a t o r s . ......................... 1 , 4 2 3 4 . 7 6 90 4 . 0 2 23 5 . 0 6 40 6 5 . 2 6 46 4 . 2 2 206 3 - 8 9F r i c t i o n - s a w i n g - m a c h i n e o p e r a t o r s . . . . . . . . . 361 4 . 25 57 3 . 6 7 1 2 4 . 7 3 40 4 . 9 8 37 3 . 9 5 83 3 . 63H e l p e r s , g e n e r a l m e c h a n i c . ......................... ................ 2 , 4 3 5 3 . 9 9 359 3 . 1 7 8 0 4 . 0 7 8 6 0 4 . 7 8 188 3 . 13 424 2 . 8 8H e l p e r s , p o w e r - s h e a r ......................... 31 8 4 . 2 0 - - - - 108 5 . 0 0 2 5 3 . 8 9 17 3 . 2 2H e l p e r s , p u n c h - p r e s s . . . . . . . . . . . . . . . . . . . . . . 275 4 . 2 0 - - 7 $ 4 . 27 92 5 . 1 3 14 3 . 7 0 29 3 . 3 9I n s p e c t o r s , c l a s s A.............. .......................... .. ................ 471 5. 41 - - - - 173 5 . 7 6 7 4 . 8 7 56 4 . 6 6J a n i t o r s . ............................................... ......................................... 383 3 . 4 8 - - - - 63 4 . 3 0 35 2 . 8 3 6 8 2 . 8 4L a y e r s - o u t , s t r u c t u r a l s t e e l . . . . . . . ................. 2 , 9 7 9 5. 42 143 $ 4 . 1 5 194 $ 5 . 6 6 7 3 7 6 . 2 5 162 4 . 8 2 367 4 . 2 5M a c h i n i s t s , m a i n t e n a n c e ................. ................................ 407 5 . 5 1 27 4 . 4 6 14 4. 6 8 137 6 . 1 1 16 4 . 1 9 32 4 . 5 0M e c h a n i c s , g e n e r a l ( p r o d u c t i o n ) . . . . . ............... 2 , 0 8 4 5 . 5 4 - - 108 4 . 6 8 7 2 9 6 . 7 8 74 4 . 2 7 176 3 . 8 8P a i n t e r s , r o u g h , s p r a y ...................... 1 , 4 0 3 4 . 3 9 - - 64 4 . 6 7 2 8 0 5 . 1 6 65 3 . 4 5 292 3 . 41P o w e r - b r a k e o p e r a t o r s , s t r u c t u r a l s t e e l . . . 429 4 . 8 3 76 $ 3 . 8 2 - - 7 7 5 . 9 2 17 3 . 48 36 4. 11P o w e r - s h e a r o p e r a t o r s . . . . . . . . . . . . . . . . . . . . . 1 , 0 1 6 4 . 49 170 3 . 4 8 15 $ 4 . 9 1 198 5 . 2 5 56 3 . 7 0 139 3 . 5 3P u n c h - p r e s s o p e r a t o r s , s t r u c t u r a l s t e e l ,
c l a s s A . . . . . . . . . . . . . . . . . . . . . . . . . . . . . . . . . . 754 4 . 8 1 _ . 3 0 5 . 4 4 179 5 . 4 2 54 4 . 0 7 1 0 2 3 . 8 2P u n c h - p r e s s o p e r a t o r s , s t r u c t u r a l s t e e l ,
c l a s s B . . . . . ....................................... .. .................................. 371 4 . 30 _ _ 15 4 . 6 3 7 7 4 . 8 6 26 3 . 4 1 59 3 . 5 6S t o c k c l e r k s . . . . . . . . .............. ........................................... 246 4 . 13 - - 7 4 . 6 5 59 4 . 3 5 2 0 3 . 7 8 49 3 . 7 8T e m p l a t e m a k e r s . ................. .. 4 0 8 5 . 4 7 - - 8 5 . 1 8 173 5 . 7 4 15 4 . 2 8 42 4 . 2 1T r u c k d r i v e r s 2 / . ...................... .............................................. 1 , 3 8 5 4 . 5 5 76 $ 3 . 7 5 47 5 . 0 7 241 5 . 5 7 119 3 . 8 3 3 2 5 3 . 5 0
Medium ( 1 - 1 / 2 t o a n d i n c l u d i n g 4 t o n s ) . . 205 4 . 0 5 - - - - 27 5 . 17 9 3 . 5 4 42 3 . 2 1H eavy ( o v e r 4 t o n s , t r a i l e r t y p e ) . . . . . . . 731 4 . 7 6 55 $ 3 . 7 5 17 $ 5 . 7 8 1 2 2 6 . 0 3 65 4 . 0 4 180 3 . 7 8H eavy ( o v e r 4 t o n s , o t h e r t h a n
t r a i l e r t y p e ) ............................ .. 2 1 1 4 . 5 3 _ 1 2 5 . 7 4 5 7 4 . 9 1 35 3 . 6 5 . 44 3 . 6 2T r u c k e r s , p o w e r , f o r k l i f t ............................................ 310 4 . 6 6 - - - - 6 8 5 . 0 9 - - 27 3 . 64W atch m en . .................................................. ................................ 95 3 . 2 0 - - - - 31 4 . 2 1 - - - _
W e l d e r s , h a n d . . ............................... .. ...................................... 6 , 9 4 1 4 . 7 2 1 , 0 7 6 $ 4 . 3 3 ' 3 4 8 $ 4 . 7 9 1 , 3 1 9 5 . 5 8 4 3 7 $ 3 . 8 9 1 , 0 3 0 $ 3 . 8 0C l a s s A . . . . . . . .............. ...................................................... 4 , 5 8 3 4 . 9 5 812 4 . 5 0 108 5 . 3 4 1 , 0 1 0 5 . 8 1 2 6 8 3 . 9 7 577 3 . 9 6C l a s s B. . ............................ ................................................... .. 2 , 3 5 8 4 . 2 8 264 3 . 8 0 2 40 4 . 5 5 3 0 9 4 . 8 5 169 3 . 7 6 4 5 3 3 . 5 9
W e l d e r s , m a c h i n e ( a r c o r g a s ) . . .............. 2 , 191 4 . 8 5 49 4 4 . 1 8 91 5 . 0 8 44 5 5 . 2 6 6 8 4 . 10 2 0 9 3 . 7 2W e l d e r s , t a c k . . . . ................. ................................................. 1 , 2 9 9 4 . 14 385 3 . 3 9 - 351 4 . 9 0 65 3 . 9 0 2 8 5 3 . 5 8
See footnotes at end o f table.
Digitized for FRASER http://fraser.stlouisfed.org/ Federal Reserve Bank of St. Louis

(Number and average straight-time hourly earnings1 of production workers in selected occupations in fabricated structural steel manufacturing establishments, United States and selected regions, November 1974)
Table 4. Occupational averages: By size of community —Continued
S o u t h w e s t G r e a t L a k e s M i d d l e W est M o u n t a i n P a c i f i c
O c c u p a t i o nM e t r o p o l i t a n
a r e a sN o n m e t r o p o l i t a n
a r e a sM e t r o p o l i t a n
a r e a sM e t r o p o l i t a n
a r e a sM e t r o p o l i t a n
a r e a sM e t r o p o l i t a n
a r e a sNumber
o fw o r k e r s
A v e r a g eh o u r l y
e a r n i n g s
N umber o f
w o r k e r s
A v e r a g e h o u r l y
e a r n i n g s
Numbero f
w o r k e r s
A v e r a g eh o u r l y
e a r n i n g s
Numbero f
w o r k e r s
A v e r a g eh o u r l y
e a r n i n g s
Numbero f
w o r k e r s
A v e r a g eh o u r l y
e a r n i n g s
Numbero f
w o r k e r s
A v e r a g eh o u r l y
e a r n i n g s
C r a n e o p e r a t o r s , e l e c t r i c b r i d g e - . . ................. 203 $ 3 . 7 3 70 $ 4 . 7 8 43 7 $ 4 . 8 2 154 $ 4 . 3 9 39 $ 4 . 2 6 128 $ 5 . 9 5U nder 20 t o n s ........................- .............................................. 141 3 . 48 16 3 . 5 7 274 4 . 6 7 63 4 . 1 2 37 4 . 2 3 71 5 . 8 82 0 t o n s a n d o v e r ................................................... .. . . . . 62 4 . 30 - - 132 5 . 1 7 50 4 . 4 0 - - - - •
E l e c t r i c i a n s , m a i n t e n a n c e . .......................................... 27 4 . 4 4 33 $ 4 . 7 7 97 5 . 4 9 17 5 . 1 5 1 1 $ 4 . 6 5 29 $ 6 . 7 9F i t t e r s , s t r u c t u r a l . ........................................................... 553 4 . 1 9 357 4 . 4 7 1 , 0 7 3 5 . 15 280 4 . 6 0 163 4 . 8 3 4 1 3 6 . 2 1F l a m e - c u t t i n g - m a c h i n e o p e r a t o r s . . . . . . . . . . . 176 3 . 9 3 36 4 . 2 8 325 4 . 8 9 99 4 . 8 2 53 4 . 4 7 89 5 . 9 3F r i c t i o n - s a w i n g - m a c h i n e o p e r a t o r s ...................... 52 3 .6 4 . 37 3 . 8 8 74 4 . 8 3 18 4 . 3 3 30 4 . 2 2 15 5 . 2 1H e l p e r s , g e n e r a l m e c h a n i c ............................................. 105 3 . 17 - - 25 3 4 . 1 2 231 3 . 36 163 3 . 6 9 131 5 . 3 7H e l p e r s , p o w e r - s h e a r ............ .............................................. 50 3 . 0 1 - - 54 4 . 3 3 3 7 3 . 9 2 - - - -H e l p e r s , p u n c h - p r e s s . . . . . ............................................. 44 2 . 8 6 - - 54 4 . 10 18 3 . 9 9 - - 17 $ 4 . 9 0I n s p e c t o r s , c l a s s A . . . .................... .. .............................. 80 4 . 5 3 - - 82 6 . 0 6 39 5 . 5 5 17 $ 4 . 9 8 1 0 6 . 17J a n i t o r s . .................... .. ................ .. ........................ ..................... 79 2 . 6 3 26 $ 2 . 9 1 99 4 . 0 6 19 4 . 0 2 5 3 . 5 1 1 2 4 . 8 3L a y e r s - o u t , s t r u c t u r a l s t e e l . . . . . . . . . . . . . . 32 2 4 . 23 22 4 . 1 2 4 6 0 5 . 3 4 171 4 . 9 7 203 4 . 8 8 3 6 3 6 . 7 6M a c h i n i s t s , m a i n t e n a n c e . ............................ 6 8 4 . 3 5 - - 91 6 . 2 3 13 4 . 8 6 18 4 . 8 9 18 6 . 3 2M e c h a n i c s , g e n e r a l ( p r o d u c t i o n ) . . . . . . . . . . . 50 3 . 5 9 - - 238 4 . 4 3 233 4 . 5 4 142 4 . 7 9 3 3 4 6 . 4 0P a i n t e r s , r o u g h , s p r a y .............. ................................... - 157 3 . 4 4 94 $ 4 . 2 6 258 4 . 6 2 8 8 4 . 1 9 6 0 4 . 3 6 139 5 . 9 8P o w e r - b r a k e o p e r a t o r s , s t r u c t u r a l s t e e l . . . 6 6 3 . 6 8 2 1 3 . 5 5 148 5 . 0 4 38 4 . 3 2 16 4 . 17 3 0 6 . 1 5P o w e r - s h e a r o p e r a t o r s . . . . . ..........................................P u n c h - p r e s s o p e r a t o r s , s t r u c t u r a l s t e e l .
153 3 . 6 7 8 6 3 . 2 6 259 4 . 8 1 85 4 . 1 9 48 4 . 3 5 6 3 6 . 0 2
c l a s s A . . . . . . . . . . . . . . . . . . . . . . . . . . . . . . . . . .P u n c h - p r e s s o p e r a t o r s , s t r u c t u r a l s t e e l .
1 0 1 3 . 7 5 131 5 . 0 1 40 4 . 6 8 18 4 . 2 4 99 5 . 9 0
c l a s s B . . . . . .................... ........................................... .. 58 3 . 36 - - 84 4 . 7 6 15 4 . 0 8 13 4 . 7 1 24 5 . 7 0S t o c k c l e r k s .......................................................................... 25 3 . 3 8 - - 49 4 . 3 7 10 3 . 8 0 1 2 4 . 0 9 15 5 . 3 2T e m p l a t e m a k e r s . ............................................. .. ............... 26 4 . 1 4 - - 87 5 . 8 0 2 0 4 . 9 7 - - 35 6 . 7 3T r u c k d r i v e r s 2 / . ................................................ .. 173 3 . 5 4 44 $ 3 . 4 1 273 5 . 2 4 8 8 4 . 9 1 47 $ 4 . 5 8 7 2 6 . 1 0
Medium ( 1 - 1 / 2 t o a n d i n c l u d i n g 4 t o n s ) . . 45 3 . 3 6 - - 50 4 . 7 4 15 4 . 1 9 1 0 4 . 2 4 - -H eavy ( o v e r 4 t o n s , t r a i l e r t y p e ) . . . . . . .H eavy ( o v e r 4 t o n s , o t h e r t h a n
106 3 . 5 2 32 $ 3 . 3 0 131 5 . 34 40 5 . 4 6 2 2 5 . 2 8 4 8 $ 6 . 2 0
t r a i l e r t y p e ) .......................... ................. .. ..................... - - - - 36 5 . 3 3 - - 1 1 3 . 6 9 13 5 . 9 7T r u c k e r s , p o w e r , f o r k l i f t . . . . . . . . . . ................. 3 7 3 . 38 - - 107 4 . 9 2 1 2 $ 4 . 3 7 2 0 4 . 16 32 5- 84W atch m en . .................................. ....................................................... - - - - 16 3 . 9 1 - - - - - -W e l d e r s , h a n d ............................ 1, 152 $ 4 . 1 6 449 $ 4 . 6 8 1 , 5 7 4 4 . 9 6 402 $ 4 . 6 6 321 $ 4 . 5 5 3 5 8 $ 6 . 15
C l a s s A . . ............................................................ .. ..................... 8 2 3 4 . 3 8 433 4 . 7 4 8 9 4 5 . 1 3 3 0 0 4 . 7 4 29 0 4 . 5 9 3 1 3 6 . 2 5C l a s s B . . . . . . . . . . . ................. .. ........................ 329 3 . 5 9 - - 6 8 0 4 . 7 5 1 0 2 4 . 4 5 31 4 . 1 5 45 5 . 4 2
W e l d e r s , m a c h i n e ( a r c o r g a s ) .................................. 199 3 . 8 7 3 7 0 $ 4 . 3 6 5 27 4 . 5 6 225 4 . 7 8 96 4 . 7 2 331 6 . 2 7W e l d e r s , t a c k . .............................................................. .. 25 2 3 . 3 7 292 3 . 2 4 29 3 4 . 4 8 30 4 . 0 3 2 0 4 . 20 ~
1 Excludes premium pay for overtime and for work on weekends, holidays, and late shifts.2 Includes workers in classification in addition to those shown separately.
NOTE: Dashes indicate no data reported or data that do not meet publication criteria.
Digitized for FRASER http://fraser.stlouisfed.org/ Federal Reserve Bank of St. Louis
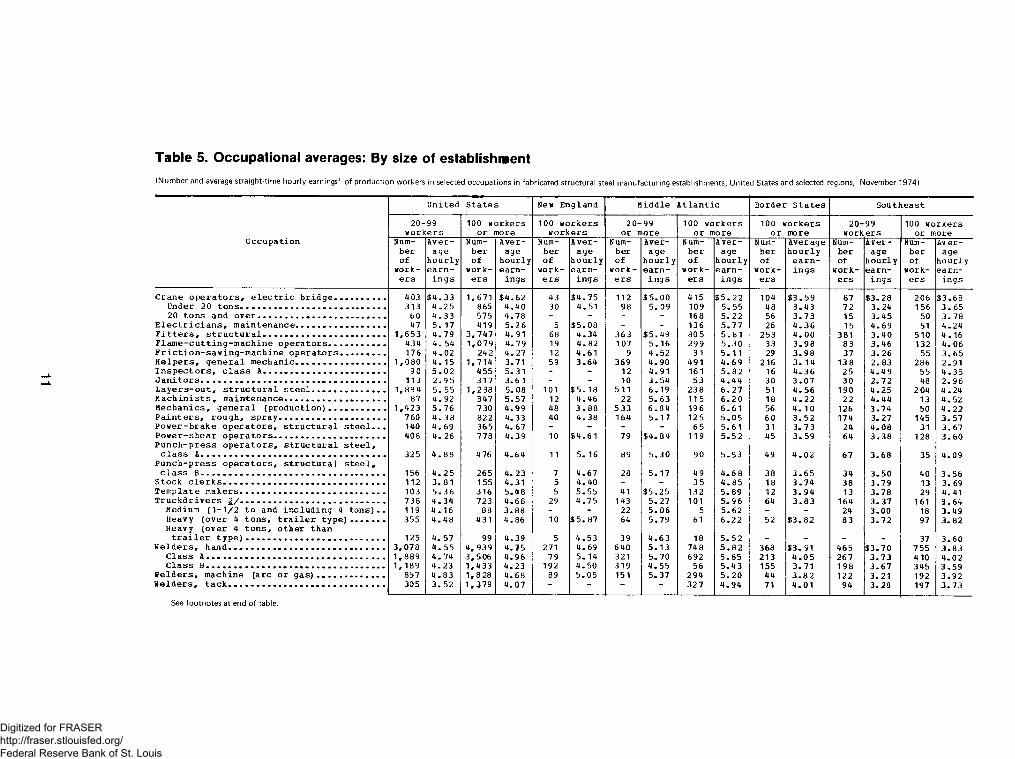
Table 5. Occupational averages: By size of establishment(Number and average straight-time hourly earnings1 o f production workers in selected occupations in fabricated structural steel manufacturing establishments, United States and selected regions, November 1974)
U n i t e d S t a t e s New E n g l a n d M i d d l e A t l a n t i c B o r d e r S t a t e s S o u t h e a s t
2 0 - 9 9w o r k e r s
1 0 0 w o r k e r s o r m ore
1 0 0 w o r k e r s w o r k e r s
2 0 - 9 9 o r m o r e
1 0 0 w o r k e r s o r m ore
1 0 0 w o r k e r s o r m ore
2 0 - 9 9w o r k e r s
1 0 0 w o r k e r s o r m ore
O c c u p a t i o n Numb e ro f
w o r k e r s
A v e r a g e
h o u r l ye a r n
i n g s
Numb e ro f
w o r k e r s
A v e r a g e
h o u r l ye a r n
i n g s
Numb e ro f
w o rk e r s
A v e r a g e
h o u r l ye a r n
i n g s
Numb e ro f
w o r k e r s
A v e r a g e
h o u r l ye a r n
i n g s
Numb e ro f
w o r k e r s
A v e r a g e
h o u r l ye a r n
i n g s
Numb e ro f
w o r k e r s
A v e r a g eh o u r l y
e a r n i n g s
Numb e ro f
w o r k e r s
A v e r a g e
h o u r l ye a r n
i n g s
Numb e ro f
w ork e r s
Av e r - a g e
h o u r l ye a r n
i n g s
C r a n e o p e r a t o r s , e l e c t r i c b r i d g e . . .................... 403 $ 4 . 3 3 1 , 6 7 1 $ 4 . 6 2 43 $ 4 . 7 5 1 1 2 $ 5 . 0 0 415 $ 5 . 2 2 104 $ 3 . 5 9 87 $ 3 . 2 8 206 $ 3 . 6 8U nder 20 t o n s . ..................................................................... 313 4 . 2 5 865 4 . 4 0 30 4 . 5 1 98 5 . 09 109 5 . 5 5 48 3 . 4 3 7 2 3 . 2 4 156 3 . 6 52 0 t o n s a n d o v e r . . . . .............. 60 4 . 3 3 575 4 . 7 8 - - - - 168 5 . 2 2 56 3 . 7 3 15 3 . 4 5 50 3 . 7 8
E l e c t r i c i a n s , m a i n t e n a n c e .............. 47 5 . 17 419 5 . 2 6 5 $ 5 . 0 8 - - 136 5 . 7 7 26 4 . 3 6 15 4 . 6 9 51 4 . 2 4F i t t e r s , s t r u c t u r a l . . . . . . . . . . . . . . . . . . . . . . . 1 , 6 5 3 4 . 7 9 3 , 7 4 7 4. 91 6 8 4 . 3 4 3 6 3 $ 5 . 4 9 80 5 5 . 8 1 253 4 . 0 0 381 3 . 4 0 510 4 . 1 6F l a m e - c u t t i n g - m a c h i n e o p e r a t o r s . . . . . . . . . . . 43 4 4 . 54 1 , 0 7 9 4 . 7 9 19 4 . 8 2 107 5 . 1 6 2 9 9 5 . 3 0 33 3 . 9 8 83 3 . 4 6 132 4 . 0 6F r i c t i o n - s a w i n g - m a c h i n e o p e r a t o r s . . . . . . . . . 176 4 . 0 2 242 4 . 2 7 1 2 4 . 6 1 9 4 . 5 2 31 5 . 1 1 29 3 . 9 8 37 3 . 2 6 55 3 . 6 5H e l p e r s , g e n e r a l m e c h a n i c . . « .................... 1 , 0 8 0 4 . 1 5 1 , 7 1 4 3 . 7 1 59 3 . 6 4 369 4 . 9 0 491 4 . 6 9 216 3 . 14 138 2 . 8 3 286 2 - 9 1I n s p e c t o r s , c l a s s A.................................................... .. 90 5 . 0 2 455 5 . 3 1 - - 1 2 4 . 9 1 161 5 . 8 2 16 4 . 3 6 25 4 . 4 9 55 4 . 3 5J a n i t o r s . ................. ........................ ................... 113 2 . 9 5 3 1 7 3 . 6 1 - - 1 0 3 . 5 4 5 3 4 . 4 4 30 3 . 0 7 3 0 2 . 7 2 48 2 . 9 6L a y e r s - o u t , s t r u c t u r a l s t e e l .................................... 1 , 8 8 4 5 . 55 1 , 2 3 8 5 . 0 8 1 0 1 $ 5 . 1 8 511 6 . 1 9 238 6 . 2 7 51 4 . 5 6 190 4 . 2 5 2 04 4 . 2 4M a c h i n i s t s , m a i n t e n a n c e . . . . . . . . . . . . . . . . . . . 87 4 . 9 2 347 5 . 5 7 1 2 4 . 4 6 2 2 5 . 6 3 115 6 . 2 0 18 4 . 2 2 2 2 4 . 4 4 13 4 . 5 2M e c h a n i c s , g e n e r a l ( p r o d u c t i o n ) . . . . . . . . . . . 1 , 4 2 3 5 . 7 6 730 4 . 9 9 48 3 . 8 8 5 3 3 6 . 8 4 196 6 . 6 1 56 4 . 1 0 126 3 . 7 4 50 4 . 2 2P a i n t e r s , r o u g h , s p r a y .................................................... 760 4 . 3 8 822 4 . 3 3 40 4 . 3 8 164 5 . 1 7 125 5 . 0 5 60 3 . 5 2 174 3 . 2 7 145 3 . 5 7P o w e r - b r a k e o p e r a t o r s , s t r p c t u r a l s t e e l . . . 140 4 . 6 9 36 5 4 . 6 7 - - - - 6 5 5 . 6 1 31 3 . 7 3 24 4 . 0 8 31 3 . 6 7P o w e r - s h e a r o p e r a t o r s . .....................................................P u n c h - p r e s s o p e r a t o r s , s t r u c t u r a l s t e e l .
408 4 . 26 778 4 . 3 9 1 0 $ 4 . 6 1 79 $ 4 . 8 4 119 5 . 5 2 45 3 . 5 9 64 3 . 3 8 128 3 . 6 0
c l a s s A. .................... .................. .. ............. .. ......................P u n c h - p r e s s o p e r a t o r s , s t r u c t u r a l s t e e l .
325 4 . 8 8 4 76 4 . 6 4 1 1 5 . 16 89 5 . 3 0 90 5 . 5 3 49 4 . 0 2 67 3 . 6 8 35 4 . 0 9
c l a s s B ............ .. ................ .. ........................................... .. 156 4 . 2 5 265 4. 23 7 4 . 6 7 28 5 . 17 49 4 . 6 8 38 3 . 6 5 34 3 . 5 0 40 3 . 5 6S t o c k c l e r k s . . . . . . . . . . . . . . . . . . . . . . . . . . . . . . 1 1 2 3 . 81 155 4 . 3 1 5 4 . 4 0 - - 3 5 4 . 8 5 18 3 . 7 4 38 3 . 7 9 13 3 . 69T e m p l a t e m a k e r s . . . . . . . . ............................... .. 103 5 . 3 6 316 5 . 4 8 5 5 . 5 5 41 $ 5 . 2 5 132 5 . 8 9 1 2 3 . 9 4 13 3 . 7 8 29 4 . 41T r u c k d r i v e r s 2 / - ...... ..................... .. 738 4 . 3 4 723 4 . 6 8 29 4 . 7 5 143 5 . 2 7 1 0 1 5 . 9 6 64 3 . 8 3 164 3 . 3 7 161 3 . 6 4
Medium ( 1 - 1 / 2 t o a n d i n c l u d i n g 4 t o n s ) . . 119 4 . 1 6 88 3 . 8 8 - - 2 2 5 . 0 6 5 5 . 6 2 - - 24 3 . 0 0 18 3 . 4 9H eavy ( o v e r 4 t o n s , t r a i l e r t y p e ) .................H e a v y ( o v e r 4 t o n s , o t h e r t h a n
355 4 . 4 8 431 4 . 8 6 1 0 $ 5 . 8 7 64 5 . 7 9 61 6 . 2 2 52 $ 3 . 8 2 83 3 . 7 2 97 3 . 8 2
t r a i l e r t y p e ) ..................................................................... 125 4 . 5 7 99 4 . 3 9 5 4 . 5 3 39 4 . 6 3 18 5 . 5 2 - - - - 37 3 . 6 0W e l d e r s , h a n d . . . . . . . . . . . . . . ...................................... 3 , 0 7 8 4 . 55 4 , 9 3 9 4 . 7 5 271 4 . 6 9 6 4 0 5 . 1 3 7 4 8 5 . 8 2 368 $ 3 - 91 46 5 $ 3 . 7 0 7 5 5 3 . 8 3
C l a s s A . . . . . . . . . . . . . . . . . . . . . . . . . . . . . . . . . 1 , 8 8 9 4 . 7 4 3 , 5 0 6 4 . 9 6 79 5 . 14 321 5 . 7 0 692 5 . 8 5 213 4 . 0 5 2 6 7 3 . 7 3 410 4 . 0 2C l a s s B . ........................................................... .......................... 1 , 1 8 9 4 . 2 3 1 , 4 3 3 4 . 2 3 192 4 . 5 0 31 9 4 . 5 5 56 5 . 4 3 155 3 . 7 1 1 9 8 3 . 6 7 345 3 . 5 9
W e l d e r s , m a c h i n e ( a r c o r g a s ) . . ......................... 857 4 . 8 3 1 , 8 28 4 . 6 8 89 5 . 0 5 151 5 . 3 7 2 9 4 5 . 2 0 44 3 . 8 2 1 2 2 3 . 2 1 192 3 . 9 2W e l d e r s , t a c k . ............................................ .............................. 305 3 . 52 1 , 3 7 9 4 . 0 7 ~ - 3 2 7 4 . 9 4 71 4 . 0 1 94 3 . 2 8 197 3 . 7 3
See footnotes at end of table.
Digitized for FRASER http://fraser.stlouisfed.org/ Federal Reserve Bank of St. Louis
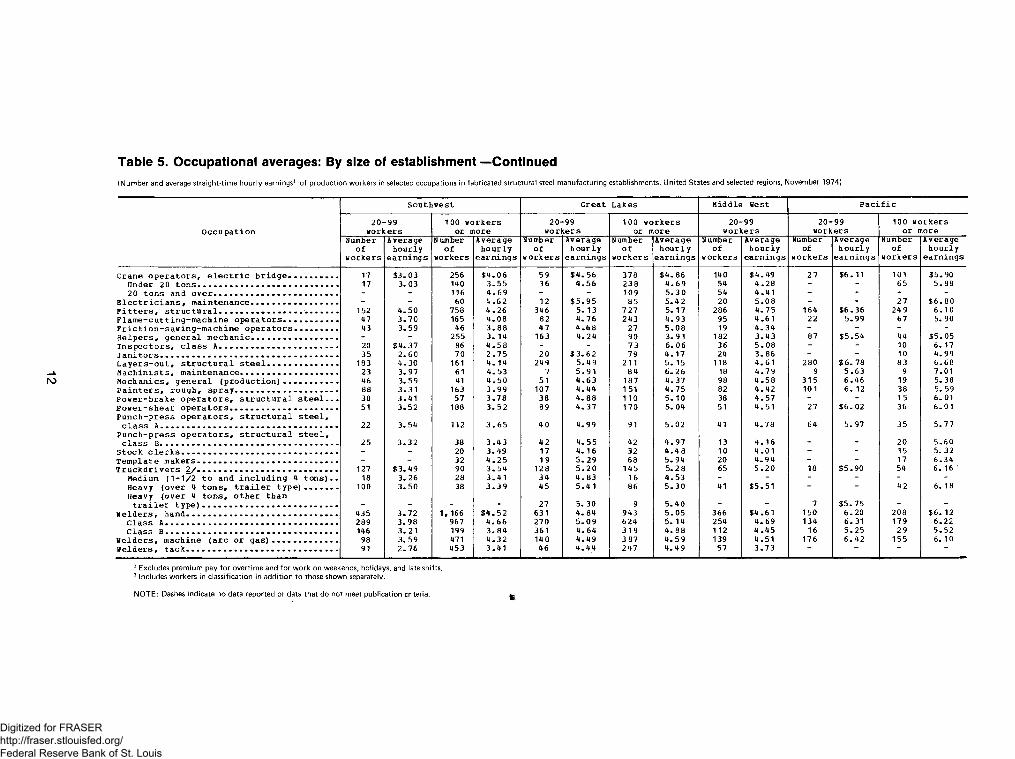
Table 5. Occupational averages: By size of establishment—Continued(Number and average straight-time hourly earnings1 of production workers in selected occupations in fabricated structural steel manufacturing establishments, United States and selected regions, November 1974)
S o u t h w e s t G rea t L a k es M id d le West P a c i f i c
O c c u p a t i o n2 0 - 9 9
w o rk e rs1 0 0 w o r k e r s
o r more2 0 - 9 9
w o r k e r s1 0 0 w o r k e r s
o r m ore2 0 - 9 9
w o r k e r s2 0 - 9 9
w o rk e rs1 0 0 w o r k e r s
o r moreNumber
o fw o r k e r s
A v e ra g eh o u r l y
e a r n i n g s
N umber o f
w ork ers
A v e ra g eh o u r l y
e a r n i n g s
Numbero f
w o r k e r s
A v era geh o u r l y
e a r n i n g s
Numbero f
w o r k e r s
A v e ra g eh o u r l y
e a r n i n g s
Numbero f
w o r k e r s
A v era g eh o u r l y
e a r n i n g s
Numbero f
w o r k e r s
A v e ra g eh o u r l y
e a r n i n g s
Numbero f
w o rk e rs
A v e ra g eh o u r l y
e a r n i n g s
C ran e o p e r a t o r s , e l e c t r i c b r i d g e - . . . . . . . . . 17 $ 3 . 0 3 256 $ 4 . 0 6 59 $ 4 . 5 6 378 $ 4 . 8 6 140 $ 4 . 4 9 27 $6 . 1 1 1 0 1 $ 5 . 9 0Under 20 t o n s ................................................. ............ .. 17 3 .0 3 140 3 . 5 5 36 4 . 5 6 238 4 . 6 9 54 4 . 2 8 - - 65 5 . 8 82 0 t o n s and o v e r ................... ................................. .. - - 116 4 . 6 9 - - 109 5 . 3 0 54 4 . 4 1 - - - -
E l e c t r i c i a n s , m a i n t e n a n c e . . . . . . . . . . . . . . . . . - - 60 4 . 6 2 1 2 $ 5 . 9 5 85 5 . 4 2 20 5 . 0 8 - - 27 $ 6 . 8 0F i t t e r s , s t r u c t u r a l . ......................................................... 152 4 . 5 0 758 4 . 2 6 346 5. 13 7 27 5 . 1 7 286 4 . 7 5 164 $ 6 . 3 6 249 6 . 1 0F l a m e - c u t t i n g - m a c h i n e o p e r a t o r s . ........................ 47 3 . 7 0 165 4 . 0 8 82 4 . 7 6 243 4 . 9 3 95 4 . 6 1 22 5 . 9 9 67 5. 90F r i c t i o n - s a w i n g - m a c h i n e o p e r a t o r s . ................... 43 3 . 5 9 46 3 . 8 8 47 4 . 6 8 27 5 . 0 8 19 4 . 3 4 - - - -H e l p e r s , g e n e r a l m e c h a n i c . ........................... ............ - - 255 3 . 1 4 163 4 . 2 4 90 3 . 9 1 182 3 . 4 3 87 $ 5 . 5 4 44 $ 5 . 0 5I n s p e c t o r s , c l a s s A . . . . . . . . . . . . . . . . . . . . . . . 20 $ 4 . 3 7 86 4 . 5 8 - - 73 6 . 06 36 5 . 0 8 - - 10 6 . 17J a n i t o r s . ........................... .................... .................... 35 2 . 6 0 70 2 . 7 5 2 0 $ 3 . 6 2 79 4 . 1 7 24 3 . 8 6 - - 1 0 4 . 9 9L a y e r s - o u t , s t r u c t u r a l s t e e l . . . . . . ................... 183 4 . 3 0 161 4 . 1 4 249 5 . 4 9 2 1 1 5 . 15 118 4 . 6 1 280 $ 6 . 78 83 6 . 6 8M a c h i n i s t s , m a i n t e n a n c e . .............................................. 23 3 .9 7 61 4 . 5 3 7 5 .9 1 84 6 . 2 6 18 4 . 7 9 9 5 . 6 3 9 7 .01M e c h a n i c s , g e n e r a l ( p r o d u c t i o n ) . . . . . . . . . . . 46 3 .5 9 41 4 . 5 0 51 4 . 6 3 187 4 . 3 7 98 4 . 5 8 315 6 . 4 6 19 5 .3 8P a i n t e r s , r o u g h , s p r a y . . . . . . . . . . . . . . . . . . . . 88 3.31 163 3 . 9 9 107 4 . 4 4 151 4 . 7 5 82 4 . 4 2 1 0 1 6 . 12 38 5 .5 9P o w e r - b r a k e o p e r a t o r s , s t r u c t u r a l s t e e l . . . 30 3 .4 1 57 3 . 7 8 38 4 . 8 8 1 1 0 5 . 10 38 4 . 5 7 - - 15 6 . 0 1P o w e r - s h e a r o p e r a t o r s .............................. .. 51 3 . 5 2 188 3 . 5 2 89 4 . 3 7 170 5 . 0 4 51 4 . 5 1 27 $6 . 0 2 36 6 . 0 1P u n c h - p r e s s o p e r a t o r s , s t r u c t u r a l s t e e l ,
c l a s s A.............. ................................. ...................................... 22 3 . 5 4 1 1 2 3 . 6 5 40 4 . 9 9 91 5 . 0 2 41 4 . 7 8 64 5 . 9 7 35 5 . 7 7P u n c h - p r e s s o p e r a t o r s , s t r u c t u r a l s t e e l ,
c l a s s B . . . .............................. ................................................. 25 3 . 3 2 38 3 . 4 3 42 4 . 5 5 42 4 . 9 7 13 4 . 1 6 _ _ 2 0 5 . 6 0S t o c k c l e r k s . ................... ............................................... .. - - 20 3 . 4 9 17 4. 16 32 4 . 4 8 1 0 4 . 0 1 - - 15 5 . 3 2T e m p l a t e m a k e r s . . . . ................... .. ............................... - - 32 4 . 2 5 19 5 . 2 9 6 8 5 . 9 4 20 4 . 9 4 - - 17 6 . 3 4T r u c k d r i v e r s 2 / - . . . . . . . . . . . . . . . . . . . . . . . . . . 127 $ 3 . 4 9 90 3 . 5 4 128 5 . 2 0 145 5 .2 8 65 5 . 2 0 18 $ 5 . 9 0 54 6 . 16
Medium ( 1 - 1 / 2 t o and i n c l u d i n g 4 t o n s ) . . 18 3 . 2 6 28 3 . 4 1 34 4 . 8 3 16 4 . 5 3 - - - - - -Heavy ( o v e r 4 t o n s , t r a i l e r t y p e ) ................. 1 0 0 3 . 5 0 38 3 . 3 9 45 5 . 4 1 8 6 5 . 3 0 41 $ 5 . 5 1 - - 42 6 . 18Heavy ( o v e r 4 t o n s , o t h e r t h a n
t r a i l e r t y p e ) .................................................................... _ _ _ _ 27 5 . 3 0 9 5 . 4 0 _ _ 7 $ 5 . 7 5 _ -
W e l d e r s , h a n d . ................................... ............................. .. 435 3 . 7 2 1 , 166 $ 4 . 5 2 631 4 . 8 4 943 5 . 0 5 366 $ 4 . 6 1 150 6 . 2 0 208 $ 6 . 12C l a s s A . . . . . . .............................. .. 289 3 . 9 8 967 4 . 6 6 270 5 . 0 9 624 5 . 14 254 4 . 6 9 134 6 .3 1 179 6 . 2 2C l a s s B .............................................. ....................................... 146 3 . 2 1 199 3 . 8 4 361 4 . 6 4 319 4 . 8 8 1 1 2 4 . 4 5 16 5 . 2 5 29 5 . 5 2
W e l d e r s , m a c h in e ( a r c o r g a s ) . . . . . . . . . . . . . 98 3 . 5 9 471 4 . 3 2 140 4 . 4 9 3 87 4 . 5 9 139 4 . 5 1 176 6 . 4 2 155 6 . 10W e l d e r s , t a c k . .............................................................. 91 2 - 7 6 453 3 . 4 1 46 4 . 4 4 247 4 . 4 9 57 3 . 7 3 ” “ ~
1 Excludes premium pay fo r overtime and for work on weekends, holidays, and late shifts.2 Includes workers in classification in addition to those shown separately.
NOTE: Dashes indicate no data reported or data that do not meet publication criteria.
Digitized for FRASER http://fraser.stlouisfed.org/ Federal Reserve Bank of St. Louis

Table 6. Occupational averages: By labor-management contact coverage
(Number and average straight-time hourly earnings1 of production workers in selected occupations in fabricated structural steel manufacturing establishments, United States and selected regions, November 1974)
U n i t e d S t a t e s New E n g l a n d M i d d l e A t l a n t i c B o r d e r S t a t e s S o u t h e a s t
O c c u p a t i o nM a j o r i t yc o v e r e d
N o n e o r m i n o r i t y c o v e r e d
M a j o r i t yc o v e r e d
M a j o r i t yc o v e r e d
M a j o r i t yc o v e r e d
M a j o r i t yc o v e r e d
None o r m i n o r i t y c o v e r e d
Numbero f
w o r k e r s
A v e r a g eh o u r l y
e a r n i n g s
N u m bero f
w o r k e r s
A v e r a g eh o u r l y
e a r n i n g s
N u m b e ro f
w o r k e r s
A v e r a g eh o u r l y
e a r n i n g s
N u m bero f
w o r k e r s
A v e r a g eh o u r l y
e a r n i n g s
Num bero f
w o r k e r s
A v e r a g e h o u r l y
e a r n i n g s
N u m bero f
w o r k e r s
A v e r a g eh o u r l y
e a r n i n g s
Num bero f
w o r k e r s
A v e r a g eh o u r l y
e a r n i n g s
C r a n e o p e r a t o r s , e l e c t r i c b r i d g e . . . . . ........... 1 ,6 1 9 $ 4 . 8 0 455 $ 3 . 7 6 52 $ 4 . 8 6 497 $ 5 . 2 3 89 $ 3 . 6 1 95 $ 4 . 0 4 198 $ 3 . 3 3U n d e r 20 t o n s . .................................................................. 888 4 . 6 8 290 3 . 3 8 38 4 . 6 9 200 5 . 4 0 43 3 . 4 5 66 4. 14 162 3 . 2 720 t o n s a n d o v e r - . . . . . . . . . . . . . ..................... 470 4 . 8 5 165 4 . 4 2 - - 153 5 . 2 8 46 3 - 7 5 29 3 . 8 1 36 3 . 6 2
E l e c t r i c i a n s , m a i n t e n a n c e . ..................................... .. 370 5 . 4 6 96 4 . 4 7 13 $ 5 . 4 8 132 5 . 7 9 18 4 . 0 7 31 4 . 6 4 35 4. 08F i t t e r s , s t r u c t u r a l . ... ............................ .. 3 , 9 1 7 5 . 17 1 , 4 8 3 4 . 10 88 4 . 7 1 1 , 1 0 0 5 . 7 7 183 3 . 9 3 2 02 4 . 2 0 689 3 . 7 2F l a m e - c u t t i n g - m a c h i n e o p e r a t o r s . . . . . . . . . . . 1 ,1 9 6 4 . 94 317 3 . 8 7 24 5 . 0 2 378 5 . 3 2 47 4 . 0 6 76 4 . 2 0 139 3 . 6 3F r i c t i o n - s a w i n g - m a c h i n e o p e r a t o r s . . . . . . . . . 261 4 . 5 3 157 3 . 5 7 1 1 4 . 4 5 37 5 . 0 7 20 4 . 0 2 26 3 . 8 9 66 3 . 3 4H e l p e r s , g e n e r a l m e c h a n i c . . . . . . . . . . . . . . . . . 2 , 1 5 5 4 . 1 4 639 3 - 0 0 8 3 4 . 0 3 852 4 . 8 0 139 3 . 0 1 47 3 . 3 0 3 7 7 2 . 8 3H e l p e r s , p o w e r - s h e a r . . . ........... ................................... 281 4 . 3 8 78 3 . 0 9 - - 108 5 . 0 0 - - - - 33 3 . 1 3H e l p e r s , p u n c h - p r e s s ................... 247 4 . 3 4 47 3 . 1 8 - - 92 5 . 1 3 17 $ 3 . 8 4 10 $ 3 . 4 1 19 3 . 3 8I n s p e c t o r s , c l a s s A . . . . . . . . . . . . . . . . . . . . . . . 415 5 .5 1 130 4 . 4 8 - - 168 5 . 81 17 4 . 4 8 17 4 . 50 63 4 . 3 6J a n i t o r s . ..................................................................................... 272 3 . 7 9 158 2 . 8 2 - - 58 4 . 3 2 19 2 . 6 7 29 3 . 1 0 49 2 . 7 3L a y e r s - o u t , s t r u c t u r a l s t e e l . ................................ 2 ,3 3 5 5 . 6 6 787 4 . 4 9 186 $ 5 . 6 1 722 6 . 2 6 75 4 . 3 8 131 4 .3 0 263 4 . 2 2M a c h i n i s t s , m a i n t e n a n c e . ................... ................. .. 366 5 . 6 3 68 4 . 4 5 14 4 . 6 8 131 6 . 17 - - - - 13 4 . 2 6M e c h a n i c s , g e n e r a l ( p r o d u c t i o n ) . . ................ 1 ,6 6 1 5. 88 492 4 . 2 2 104 4 . 6 7 700 6 . 8 6 45 $ 4 . 0 2 21 $ 4 . 2 4 155 3 . 8 3P a i n t e r s , r o u g h , s p r a y . . 1 ,0 6 3 4 . 7 0 519 3 . 6 3 57 4 . 6 9 269 5 . 1 7 53 3 . 4 6 81 3 . 7 2 238 3 . 3 0P o w e r - b r a k e o p e r a t o r s , s t r u c t u r a l s t e e l . . . 390 4 . 9 6 115 3 . 7 2 - - 76 5 . 9 4 30 3 . 6 8 11 4 . 0 4 44 3 . 81P o w e r - s h e a r o p e r a t o r s . . . . . . . . . . . . . . . . . . . . . 812 4 . 7 4 374 3 . 4 9 12 $ 5 . 0 1 191 5 . 2 8 54 3 . 7 2 20 3 . 9 1 172 3 . 4 8P u n c h - p r e s s o p e r a t o r s , s t r u c t u r a l s t e e l ,
c l a s s A ..................................................... 62 5 4 . 9 9 176 3 . 8 3 28 5 . 5 4 174 5 . 4 3 42 4 . 0 7 28 3 . 8 9 74 3 . 7 9P u n c h - p r e s s o p e r a t o r s , s t r u c t u r a l s t e e l ,
c l a s s B . . . . . . . . . . . . . . . . . . . . . . . . . . . . . . . . . . 301 4 . 5 8 120 3 . 3 9 11 5 . 0 8 67 5 . 0 4 36 3 . 6 3 19 3 . 8 7 55 3 . 4 2S t o c k c l e r k s . . . . . . . . . . . . . . . . . . . . . . . . . . . . . . 167 4 . 3 9 100 3 . 6 0 7 4 . 6 5 41 4 . 5 6 - - 18 4 . 15 33 3. 56T e m p l a t e m a k e r s . . . . . . . . . . . . . . . . . . . . . . . . . . . 351 5 . 6 5 68 4 . 4 0 6 5 . 4 9 170 5 . 7 5 10 $ 3 . 8 6 15 4 . 3 5 27 4 . 1 4T r u c k d r i v e r s 2 / . ............................................................. 890 5 .0 3 571 3 . 7 0 42 5 . 0 9 2 1 6 5 . 55 73 3 . 8 8 75 3 . 6 9 250 3 . 45
M ed ium ( 1 - 1 / 2 t o a n d i n c l u d i n g 4 t o n s ) . . 102 4 . 6 2 105 3 . 4 8 - - 27 5 . 1 7 - - - - 40 3 . 15H e a v y ( o v e r 4 t o n s , t r a i l e r t y p e ) . . . . . . . 462 5 . 2 4 324 3 . 9 1 17 $ 5 . 5 9 100 6 . 0 5 52 $ 3 . 8 4 46 $ 3 . 7 7 134 3 . 7 8H e a v y ( o v e r 4 t o n s , o t h e r t h a n
t r a i l e r t y p e ) . ............................................................... 155 4 .9 1 69 3 - 5 5 14 5 . 4 9 54 4 . 9 7 _ _ 18 3 . 50 26 3 . 7 0T r u c k e r s , p o w e r , f o r k l i f t . . . ........................ 257 4 . 9 3 64 3 . 4 2 - - 65 5 . 1 2 1 $ 3 . 9 0 12 3 . 8 4 18 3 .4 1W a t c h m e n .............. .. ............................... .. 84 3 . 5 2 49 2 . 4 6 - - 31 4 .2 1 2 2 . 7 2 - - 45 2 . 5 0W e l d e r s , h a n d . . . . . . . . . . . . . . ..................................... 5 ,3 0 9 4 . 9 7 2 , 7 0 8 4 . 0 9 3 2 0 $ 4 . 8 0 1 , 3 5 3 5 - 5 4 302 3 . 8 5 3 92 4 . 0 5 8 28 3 . 6 5
C l a s s A............................................. ...................................... 3 , 6 7 6 5 . 1 5 1 , 7 1 9 4 . 3 2 117 5 . 2 4 1 , 0 0 4 5 . 8 1 212 3 . 9 7 26 4 4 . 15 413 3 . 7 5C l a s s B . . . . . ...................... .. .................... ......................... 1 ,6 3 3 4 . 5 6 989 3 . 6 8 203 4 . 5 4 349 4 . 7 5 90 3 . 5 8 128 3 . 8 6 415 3 . 5 4
W e l d e r s , m a c h i n e ( a r c o r g a s ) .............. ................. 1 ,9 3 9 5 . 0 3 746 3 . 9 6 93 5 . 0 6 3 94 5 . 3 2 - - 60 4 . 25 254 3 . 5 0W e l d e r s , t a c k . . . . . ........... ...................... .. 1 ,0 2 7 4 . 4 0 657 3 . 2 9 - - 351 4 . 9 0 64 $ 4 . 1 1 168 3 . 8 8 123 3 . 1 8
See footnotes at end of table.
Digitized for FRASER http://fraser.stlouisfed.org/ Federal Reserve Bank of St. Louis

(Num ber and average straight-time hourly earnings1 of production workers in selected occupations in fabricated structural steel manufacturing establishments, United States and selected regions, November 1974)
Table 6. Occupational averages: By labor-management contact coverage—Continued
S o u t h w e s t G r e a t L a k e s M i d d l e W e s t M o u n t a i n P a c i f i c
O c c u p a t i o nM a j o r i t yc o v e r e d
N o n e o r m i n o r i t y c o v e r e d
M a j o r i t y c o v e r e d
M a j o r i t yc o v e r e d
M a j o r i t y c o v e r e d
M a j o r i t yc o v e r e d
N u m b e ro f
w o r k e r s
A v e r a g eh o u r l y
e a r n i n g s
N u m b e r o f
w o r k e r s
A v e r a g eh o u r l y
e a r n i n g s
N u m b e ro f
w o r k e r s
A v e r a g eh o u r l y
e a r n i n g s
N u m b e ro f
w o r k e r s
A v e r a g eh o u r l y
e a r n i n g s
N u m b e ro f
w o r k e r s
A v e r a g eh o u r l y
e a r n i n g s
N u m b e ro f
w o r k e r s
A v e r a g eh o u r l y
e a r n i n g s
C r a n e o p e r a t o r s , e l e c t r i c b r i d g e - . . . . . . . . - 127 $ 3 . 8 4 146 $ 4 . 14 4 37 $ 4 . 82 154 $ 4 . 4 3 4 0 $ 4 . 25 128 $ 5 . 9 5
U n d e r 2 0 t o n s . . . . ............................ 101 3 . 7 3 56 3 . 0 6 274 4 . 6 7 58 4 . 2 2 37 4 . 2 3 71 5 . 88
2 0 t o n s a n d o v e r . . . . . . . . .................... .................... 26 4 . 26 90 4 . 8 1 - - 55 4 . 3 9 - - - -E l e c t r i c i a n s , m a i n t e n a n c e ............................................. 20 4 . 4 1 40 4 . 7 3 97 $ 5 . 4 9 19 5 . 0 9 11 $ 4 . 6 5 2 9 $ 6 . 7 9
F i t t e r s , s t r u c t u r a l . . ....................................................... 412 4 . 2 0 4 9 8 4 . 3 8 1 , 0 1 0 5 . 2 0 3 4 9 4 . 5 9 1 6 0 4 . 8 3 4 1 3 6 . 21F l a m e - c u t t i n g - m a c h i n e o p e r a t o r s ......................... .. 110 4 . 1 0 102 3 . 8 8 3 1 8 4 . 9 1 106 4 . 8 1 52 4 . 4 8 8 5 5 . 99F r i c t i o n - s a w i n g - m a c h i n e o p e r a t o r s . . . . . . . • • 39 4 . 09 50 3 . 4 7 6 9 4 . 8 9 15 4 . 4 6 2 9 4 . 2 1 15 5 . 2 1H e l p e r s , g e n e r a l m e c h a n i c . .................... ............... - - 46 2 . 7 0 2 2 2 4 . 1 7 290 3 . 3 7 144 3 . 8 2 131 5 . 3 7H e l p e r s , p o w e r - s h e a r . .................... .................................. 28 $ 3 . 27 26 2 . 7 3 - - 33 3 . 9 7 - - - -H e l p e r s , p u n c h - p r e s s ........................................................... 34 3 . 0 1 15 2 . 5 7 - - 16 4 . 0 1 - - 17 $ 4 . 9 0I n s p e c t o r s , c l a s s A . . . . . . ................. ........................... 53 4 . 5 6 53 4 . 5 2 - - 44 5 . 4 2 17 $ 4 . 9 4 10 6 . 17J a n i t o r s .................... ................... .. .............................. 34 2 . 7 9 71 2 . 6 5 - - 20 4 . 0 2 - - 12 4 . 8 3
L a y e r s - o u t , s t r u c t u r a l s t e e l ..................................... 107 4 . 34 2 37 4 . 1 7 4 2 6 $ 5 . 3 2 124 4 . 9 1 2 0 5 $ 4 . 8 4 3 5 9 6 . 7 7M a c h i n i s t s , m a i n t e n a n c e . .................... .......................... 49 4 . 3 8 35 4 . 3 8 91 6 . 2 3 14 4 . 8 7 19 - 14 -
M e c h a n i c s , g e n e r a l ( p r o d u c t i o n ) . . . ........... ... - - 82 3 . 9 8 2 1 9 4 . 3 7 148 4 . 6 4 89 $ 4 . 7 7 33 0 $ 6 . 42P a i n t e r s , r o u g h , s p r a y . . 90 $ 3 . 6 6 161 3 . 8 0 2 3 2 4 . 7 2 87 4 . 2 3 5 9 4 . 3 4 1 3 5 5 . 9 9P o w e r - b r a k e o p e r a t o r s , s t r u c t u r a l s t e e l . . . 29 3 . 9 0 58 3 . 5 3 - - 43 4 . 4 2 21 4 . 1 0 30 6 . 1 5P o w e r - s h e a r o p e r a t o r s . ..................................................... 85 3 . 8 9 154 3 . 3 2 254 $ 4 . 8 2 76 4 . 2 4 57 4 . 2 6 63 6 . 0 2P u n c h - p r e s s o p e r a t o r s , s t r u c t u r a l s t e e l ,
c l a s s A ............ ............................................................... 73 3 - 6 8 61 3 . 5 7 127 5 . 0 3 38 4 . 7 5 16 4 . 2 2 9 9 5 . 9 0P u n c h - p r e s s o p e r a t o r s , s t r u c t u r a l s t e e l ,
c l a s s B ....................... ..................................................................... 25 3 . 7 2 38 3 . 17 80 4 . 8 0 15 4 . 1 0 24 4 . 3 3 24 5 . 7 0S t o c k c l e r k s . ... .......................................................................... - - 24 3 . 2 8 49 4 . 3 7 11 4 . 0 3 12 - 15 5 . 3 2T e m p l a t e m a k e r s ......................................................................... 14 $ 4 . 3 1 18 4 . 2 0 82 5 . 8 7 18 4 . 9 0 - - 35 6 . 7 3T r u c k d r i v e r s 2 / - . . ............................. .. ................................ 51 3 . 9 3 166 3 . 3 9 2 5 2 5 . 2 7 70 5 . 1 0 3 9 $ 4 . 6 0 7 2 6 . 10
M e d iu m ( 1 - 1 / 2 t o a n d i n c l u d i n g 4 t o n s ) . . 9 3 . 41 37 3 . 3 4 - - - - 9 - - -H e a v y ( o v e r 4 t o n s , t r a i l e r t y p e ) ................. 22 4 . 0 2 116 3 . 3 6 123 $ 5 . 3 6 37 $ 5 . 6 7 17 $ 5 . 4 1 48 $ 6 . 20H e a v y ( o v e r 4 t o n s , o t h e r t h a n
t r a i l e r t y p e ) ............ .. ....................................................... _ _ _ 36 5 . 3 3 _ _ 9 _ 13 5 . 9 7T r u c k e r s , p o w e r , f o r k l i f t .................... ........................ - - 33 $ 3 . 2 0 - - 10 $ 4 . 4 3 18 $ 4 . 2 0 32 5 . 8 4W a t c h m e n . ............... .. ........................................................................ - - 4 2 . 0 0 - - - - - - -W e l d e r s , h a n d . . . . . . . ................................................. .. 356 $ 4 . 2 5 1 , 2 4 5 4 . 3 2 1 , 4 6 5 $ 5 . 0 2 433 $ 4 . 6 9 3 3 4 $ 4 . 5 2 3 5 4 $ 6 . 16
C l a s s A .................................. ...................................................... 28 5 4 . 40 971 4 . 5 4 8 3 4 5 . 1 7 3 4 9 4 . 7 2 298 4 . 5 7 3 1 3 6 . 2 5C l a s s B . ................................................ .............................. .. 71 3 . 6 7 2 7 4 3 . 5 5 631 4 . 8 2 84 4 . 5 9 36 4 . 15 41 5 . 4 8
W e l d e r s , m a c h i n e ( a r c o r g a s ) . ............................... 188 4 . 3 8 381 4 . 10 5 2 3 4 . 5 6 2 32 4 . 7 7 96 - 3 2 3 6 . 2 8W e l d e r s , t a c k ............ .. .............................. .. ..................... 68 3. 59 476 3 . 2 6 2 9 3 4 . 4 8 48 3 . 8 4 3 2 $ 3 . 9 9 - “
1 Excludes premium pay for overtime and for work on weekends, holidays, and late shifts.2 Includes workers in classification in addition to those shown separately.
NOTE: Dashes indicate no data reported or data that do not meet publication criteria.
Digitized for FRASER http://fraser.stlouisfed.org/ Federal Reserve Bank of St. Louis

Table 7. Occupational earnings: Birmingham, Ala.1(Number and average straight-time hourly earnings2 of workers in selected occupations in fabricated structural steel establishments, November 1974)
Number of workers receiving straight-time hourly earnings of—
Occupation3Number
ofworkers
Average hourly
learnings ’ Under$2.80
$2.80and
under2.90
$2.90
3.00
$3.00
3.10
$3.10
3.20
$3.20
3.30
$3.30
3.40
$3.40
3.50
$3.50
3.60
$3.60
3.70
$3.70
3.80
$3.80
3.90
$3.90
4.00
$4.00
4.10
$4.10
4.20
$4.20
4.30
$4.30
4.40
$4.40
4.50
$4.50
4.60
$4.60
4.70
$4.70
4.80
$4.80
5.00
$5.00
5.20
$5.20
5.60
$5.60
6.00
$6.00
6.40
All production workers.................................................. 896 $3.85 46 44 2 7 42 16 70 18 72 40 29 50 2 165 17 16 100 _ 97 10 43 3 1 3 1 2
SELECTED OCCUPATIONS
Fitters, structural.............................................................. 60 4.25 _ _ _ _ _ _ _ _ _ _ 4 _ 1 25 15 11 3 1 _Flame-cutting-machine operators................................ 32 4.26 - _ - - - - 1 - - - 1 - _ 15 _ _ 3 _ 6 6 _ _ _ _ _ _Janitors............................................................................... 8 2.88 2 _ — 4 2 — — — — — — _ _ _ _ _ _ _ _ _ _ _ _ _ _ _Layers-out, structural steel ........................................ 23 4.65 - - - _ - - - - - _ _ _ 9 _ _ 1 _ 6 1 _ _ _ 3 1 2Painters, rough, spray....................................................... 20 3.88 - - - 1 - - - 1 - 6 7 _ _ _ _ 5 _ _ _ _ _ _ _Punch-press operators, structural
steel, class B ................................................................ 25 3.46 — . — — 14 — — 1 1 6 _ _ _ _ _ _ _ _ 3 _ _ _ _ _ _ _Truckdrivers...................................................................... 6 3.68 - _ _ - _ 1 3 - _ - _ _ _ _ _ _ 2 _ _ _ _ _ _ _ _ _Welders, hand..................................................................... 98 4.27 - - - - - - - 1 1 - - - - 36 _ 6 29 _ 25 _ _ _ _ _ _ _
class A ....................................................................... 69 4.24 - _ - - - - - 1 1 - - - - 36 _ 6 _ _ 25 _ _ _ _ _ _ _Welders, tack...................................................................... 76 3.78 1 - - 2 — 26 1 2 - - 44 - - - - - - - - - - - -
! The Birmingham Standard Metropolitan Statistical Area consists of Jefferson, St. Clair, Shelby, and Walker Counties.2 Excludes premium pay for overtime and for work on weekends, holidays, and late shuts. These surveys, based on a representative
sample of establishments, are designed to measure the level of occupational earnings at a particular time. Thus, comparisons made with previous studies may not reflect expected wage movements because of change in the sample composition, and shifts in employ
ment among establishments with different pay levels. Such shifts, for example, could decrease an occupational average, even though most establishments increased wages between periods being compared. Virtually all of the production workers covered by the survey were paid on a time basis.
3 Includes'data for workers in classification in addition to those shown separately.
Digitized for FRASER http://fraser.stlouisfed.org/ Federal Reserve Bank of St. Louis
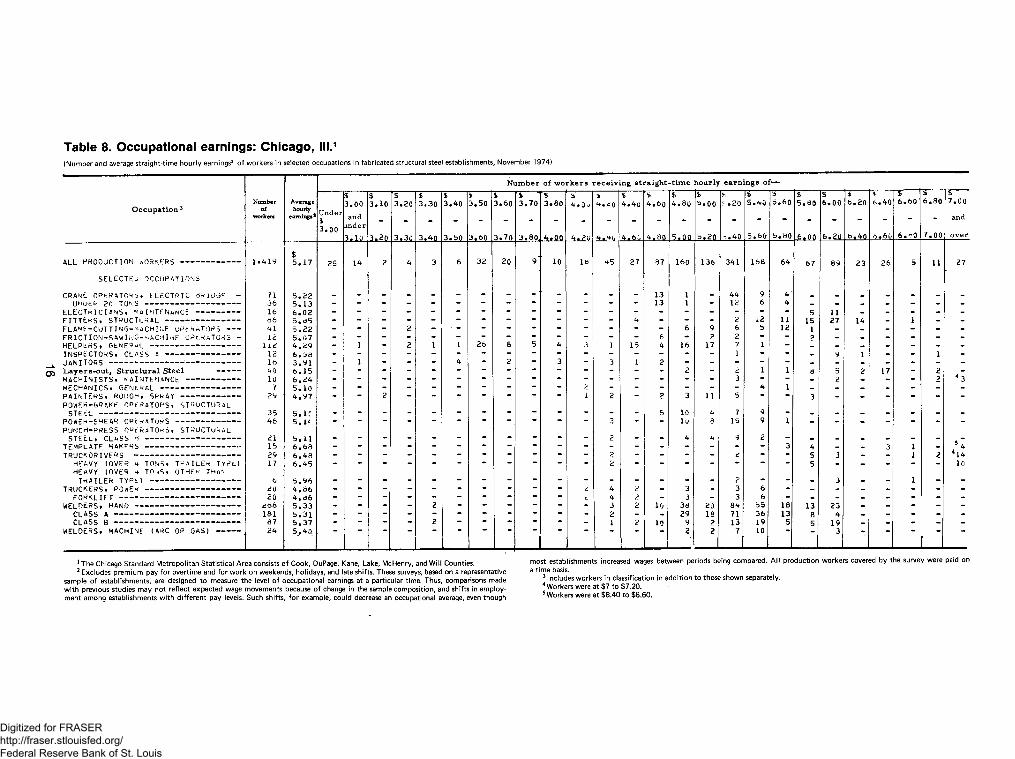
Table 8. Occupational earnings: Chicago, III.1(Number and average straight-time hourly earnings2 o f workers in selected occupations in fabricated structural steel establishments, November 1974)
Number of workers receiving straight-time hourly earnings of—
Occupation 3Numberof
worker,
Averagehourlyearnings*Under
$3.00
S3.00and
under
3.10
$3.10
3*20
$3.20
3,30
$3.30
3.40
S3.40
3.50
%3.50
3,6Q
i ‘ 3,60
3.70
3.70
3.80
3.80
.4.00
1 5" 4.0v
4.20
*4.20
4,40
$4.40
4.60
’S4.60
4.80
$4.80
5.00
$5.00
5.20
sf- .20
..40
1 ----5.40
5.60
■$— 5.60
5.80
55.80
_6a-Q0
$6.00
6,21L
£6 .20
6.40
6.40
d.6G
"5----6.60
6 .» 0
^ — 6.80
7.00(
-$---7.00
and
over
ALL PRODUCTION WORKERS -------------- 1,419$5.17 25 14 2 4 3 6 32 20 9’ 10 16 45 27 87 160 136 341 168 64 67 89 23 26 5 11 27
SELECTED OCCUPATIONS
CRANE OPERATORS, t LECTRIC BRIDGE - 71 5.22 - 13 1 . 44 9 4' _ _ ' . • . _5.13 1 6 4JO 1 o X c
11e l e c t r i c i a n s , m a i n t e n a n c e 16 6 . 0 212 1 I 5 ~ 7 ”
FITTERS, STRUCTURAL —---- ---- —----- 5.85 1 i 15 27 14 — i — —FLAME-CUTTING-MACHIUE OPERATORS --- 41 5.22 - - - 2 - - - - - - - - - 6 9 6 5 12 1 - - - - - -FRICTION-SAw ING-m ACHIiMF o p e r a t o r s - 12 5.07 - - - - - - - - - - - - - 6 - 2 2 - - 2 - - - - - -HELPERS, GENERAL --------------------- 1 1 2 4.29 - 1 - 2 1 1 26 8 5 4 5 ) 15 4 16 17 7 1 “ - - - - - - -INSPECTORS, CLASS A —— ——— _______ 12 6.06 9 1 1ukifTOnr 1 At 1 2 3JANI 1UKb ---- ~ — i o 3 • 91 i 1
1 1 17Layers-out, Structural Steel * 40 6.15 8 52
2 2 4 TMACHINISTS, MAINTENANCE ------------ 10*7 6.24 i — “ ~ 2 JMECHANICS, GENERAL f 5.10 lPAINTERS, ROUGH, SPRAY -------------- 29 4.97 - - 2 - - - - - - - 1 2 - 2 3 11 5 - - 3 - - - - - -POWER-BRAKE OPERATORS, s t r u c t u r a l
5.If 1 A 7 9STEEL -------------------------------- bb 1 Ulu 8 1 u 9 “
POWEk —SHEAR OPERATORS ———— ——————— 46 5.1* b i b — —PUNCH-PRESS OPERATOk S, s t r u c t u r a l
5.11 9 2STEEL, CLASS 8 c i*1 L.
2** ** -a “ *
l 5 7TEMPLATE MAKERS Ib 6 . 6 8 J 4 “ ~ 3 7 44i aTRUCKORIVERS ------------------------ 29 6.48 5 3 i 2
HEAVY (OVER A TONS, TRAILS* TYPc ) 17 6.45 - - - - - - - - - - - 2 - - - - - - - 5 - - - - - 10HEAVY (OVER 4 TOm S, 0TH£k THAN
5.96 oTRAILER TYPE) — — — — — — b cg ” 3
TRUCKERS, POWER C OO A 4.86 ti 4 2
2
33
o “ ” “FORKLIFT — — — — — — — — — — — 20 4.d6 d 4 3 6
WELDERS, HAND ------------------------ 2bb 5.33 - “ - - 2 “ “ ~ 3 2 10 38 20 84 55 18 13 23 - - - - -CLASS A — — — — — — — — 181 5.31 2 29 18 71 Id 8 4CLASS 8 ----------------------------- 87 5.37 “ “ ” - 2 “ - 1 2 10 9 2 13
~7191 f\
5 5 19 - - - - -WELDERS, MACHINE (ARC OR GAS) — — — 24 5.4 0
!_____
2 2 f i u
3 1^ h e Chicago Standard Metropolitan Statistical Area consists of Cook, DuPage, Kane, Lake, McHenry, and Will Counties.2 Excludes premium pay for overtime and for work on weekends, holidays, and late shifts. These surveys, based on a representative
sample of establishments, are designed to measure the level of occupational earnings at a particular time. Thus, comparisons made with previous studies may not reflect expected wage movements because of change in the sample composition, and shifts in employment among establishments with different pay levels. Such shifts, for example, could decrease an occupational average, even though
most establishments increased wages between periods being compared. All production workers covered by the survey were paid on a time basis.
3 Includes workers in classification in addition to those shown separately.4 Workers were at $7 to $7.20.5 Workers were at $8.40 to $8.60.
Digitized for FRASER http://fraser.stlouisfed.org/ Federal Reserve Bank of St. Louis

Table 9. Occupational earnings: Cleveland, Ohio1(Number and average straight-time hourly earnings2 o f workers in selected occupations in fabricated structural steel establishments, November 1974)
Number of workers receiving straight-time hourly earnings of—$ $ $ $ • $ S $ $ $ $ $ $ $ $ $ $ $ S 5 S $ 5 3 ------
Occupation3Nu m ber
o fA v e ra g ehourly
4 ,0 0 4 . 1 0 4 . 2 0 4 .3 0 4 . 4 0 4 . 5 0 4 . 6 0 4 .7 0 4 . 8 0 4 .9 0 5 .0 0 5 . 1 0 5 . 2 0 5 .3 0 5 .4 0 5 .5 0 5 .6 0 5 . 7 0 5 .8 0 5 .9 0 6 . 0 0 6.20 6 .4 0 6 .6 0 6 . Boworkers earnings 2 Undei and and5 undei
4 .0 04 ,1 0 4 . 2 0 4 . 3 0 4 . 4 0 4 . 5 0 4 . 6 0 4 . 7 0 4 . 8 0 4 . 9 0 5 .0 0 5 .1 0 5 . 2 0 5 , 3 0 5 .4 0 6 .5 0 5 . 6 0 5 ,7 0 5 ,8 0 5 . 9 0 6 .0 0 6.20 6 .4 0 6 .6 0 6 .8 0 over
mLL production workers ------------------------- 689$5 . 0 2 35 4 1 2 _ 48 33 18 38 57 69 3 94 11 29 19 68 66 15 2 1 1 0 8 17 5 1 2 6
SELECTED OCCUPATIONS
CRANE OPERATORS* ELECTRIC bRIDGE - 34 5 . 0 9 2 10 - 12 _ _ 4 4 2i iKinFo ?n TfiMS 24
1115 . 0 2 2 8 1 nU'VUCf' cv Iv-'O
C T TTPDC - CTDI IPTI ID Al • 5 .6 7A U
r 11 1 Cnof j 1 nUv 1 UnMLi 39 26 10 10 1 ?,FLAME-CUTTING-MACHINE o p e r a t o r s — 26 4 . 9 9 6 9 ) 4 _ _ 2 _ 4 - _ _ _ - _ _ _LAYERS-OUT, STRUCTURAL STEEL...................... 2b 5 . 6 8 1 _ . 8 5 1 4 _ 2 ? 1 _ 1 _PAINTERS* ROUGH* SPRAY 24 4 . 9 8 10POWER-BRAKE OPERATORS. STRUCTURAL
CTCCI ________ _ _ _ ______ ______ _____ _ 3 5 . 1 9D V C.C.L.PflUFW-cur *R HPFP — 19 5 . 0 4 5
J J c
PUNCH-PRESS OPERATORS* STRUCTURAL12 2
STEEL* CLASS A ---- ___--------------- ___ 19 4 . 8 8 3 7 l 4WELDERS. H A N D ------------------ ------- 69 5 . 1 6 29 n 4 1 2 6 l J 6 - - - “ - -
*The Cleveland Standard Metropolitan Statistical Area consists of Cuyahoga, Geauga, Lake, and Medina Counties.2 Excludes premium pay for overtime and for work on weekends, holidays, and late shifts. These surveys, based on a representative
sample of establishments, are designed to measure the level of occupational earnings at a particular time. Thus, comparisons made with previous studies may not reflect expected wage movements because of change in the sample composition, and shifts in employment
among establishments with different pay levels. Such shifts, for example, could decrease an occupational average, even though most establishments increased wages between periods being compared. All production workers covered by the survey were paid on a time basis.
3 Includes workers in classification in addition to those shown separately.
Digitized for FRASER http://fraser.stlouisfed.org/ Federal Reserve Bank of St. Louis

Table 10. Occupational earnings: Detroit, Mich.1(Number and average straight-time hourly earnings2 o f workers in selected occupations in fabricated structural steel establishments, November 1974)
Number of workers receiving straight-time hourly earnings of—
$ $ $ $ $ $ $ 3 -------- $ $ % s $ $ a> $ % S 3 ------- % $ 3 — 3 —N u m ber A v e ra g e 3 . 6 0 3 . 8 0 4 . 0 0 4 . 2 0 4 . 4 0 4 . 6 0 4 . 8 0 5 . 0 0 5 . 2 0 5 .4 , , 5 . 6 0 5 . 8 0 6 . 0 0 6 . 2 0 6 . 4 0 6 . 6 0 6 . 6 0 7 . 0 0 7 . 2 0 7 . 4 0 7 . 6 0 7 . 8 0 8 . 0 0 8 . 2 0 8 .4 C
Occupation 3 o fworkers
hourly earn ings 2 Un der
$and
un d e rand
3 . 6 03 . 8 0 4 . 0 0 4 . 2 0 4 . 4 0 4 . 6 0 4 . 8 0 5 . 0 0 5 . 2 0 5 . 4 0 5 . 6 0 5 . 8 0 6 . 0 0 6 . 2 3 6 . 4 0 6 .6 Q 6 .8 0 7 . 0 0 7 . 2 0 7 . 4 0 7 . 6 0 7 * 8 0 E.OOi a_.E o 8 . 4 0 OY&f
$6 • 2S 17 2 38 93 61 109 2 87 99 198 57 57 76 179 48 7 2 2 4ALL r'KOuUC 1 IUN WUKKLKo 1 f j J D
SELECTED OCCUPATIONS
93 5 . 7 1FITTERS* STRUCTURAL -------------------------------------- — 6 12 b
f l a m e - c u t t i n g - m a c h i n e o p e r a t o r s — 29 5 . 1 2 - - - - - - - 4 23 - r'
FRICTION-SAW 1 NG-MACriINF OPERATORS - 61610
4 . 5 9/. CL O 4 o
- - - 2 ~ 4 ~ ~
**
“ ** “ " ~ ~ ~ * *
HELPERS* GENERAL --------------------------------------------- H # OO C5 o ” 4
JANITORS ------------------------------------------------------------------ v3 . 8 76 . 0 64 . 6 4
3 2 5 3*7 10
' _ 4L A Y E R S -O U T , S T R U C T U R A L S T E E L ------------------- 62 * ” “ f 6 6 23 6
PAINTERS* ROUGH, SPRAY ------------------------------ 24 ” 2 “ 6 2 8 6POWFR-SHEAR OPERATORS -------------------------------- 17 4 . b 5 * ~ — ~ * 13 * 4PUNCH-PRESS OPERATORS* STRUCTURAL
22 5 . 0 4STEEL, CLASS A ------------------------------------------------ * ~ — 2 L c ** 85 . 8 2 6 2 6 3 2 2C l o
HEAVY (OVER 4 TONS* TRAILER TYPE) 123 0 8188120
6 . 4 8 • “ “ “ ~Q 117 A.*7 8
8
21 A
6 ** “ * “ 2 c
WELDERS, HAND ----------------------------------------------------- 4 . 9 7 5 . 1 0 4 . 7 8 ,
“ VQ
H f 7W1 nCLASS A ~ d c
a -787 C.C x u
CLASS B --------------------------------------------------------------- 65 *♦ f
*The Detroit Standard Metropolitan Statistical Area consists of Lapeer, Livingston, Macomb, Oakland, St. Clair, and Wayne Counties.
2 Excludes premium pay for overtime and for work on weekends, holidays, and late shifts. These surveys, based on a representative sample of establishments, are designed to measure the level of occupational earnings at a particular time. Thus, comparisons made with previous studies may not reflect expected wage movements because of change in the sample composition, and shifts in employment among establishments with different pay levels. Such shifts, for example, could decrease an occupational average, even though
most establishments increased wages between periods being compared. All production workers covered by the survey were paid on a time basis.
3 Includes workers in classification in addition to those shown separately.4 Workers were at $3.20 to $3.40.5 Workers were at $3 to $3.20.
Digitized for FRASER http://fraser.stlouisfed.org/ Federal Reserve Bank of St. Louis

Table 11. Occupational earnings: Houston, Tex.1(Number and average straight-time hourly earnings2 o f workers in selected occupations in fabricated structural steel establishments, November 1974)
N u m b e r of workers receiving straight-time hourly earnings of—
Occupation3Number
ofworkers
Average hourly
earnings 2
■ 5--------2 . 0 0
andunder
$2 . 1 0
$2.20
$2 . 3 0
$2 . 4 0
s2 . 5 0
$2 . 6 0
s2 . 7 0
S2 . 8 0
S>-------2 . 9 0
$3 . 0 0
■5— 3.20
■ ?-------3 . 4 0
43 . 6 0
$3 . 8 0
S4 . 0 0
$4 . 2 0
$4 . 4 0
$4 . 6 0
S4 . 8 0
S5 . 0 0
—5.20
$5 . 4 0
$5 . 6 0
rs-------5 . 8 0
$6 . 0 0
2 . 1 0 2* 20. 2 . 3 0 2 . 4 0 2 . 5 0 2 . 6 0 2 . 7 0 2.80 2 . 9 0 3 . 0 0 3 . 2 0 3 . 4 0 3 . 6 0 3 . 8 0 4 . 0 0 4 . 2 0 4 . 4 0 4 . 6 0 4 . 8 0 5 . 0 0 5 . 2 0 5 . 4 0 5 . 6 0 5 . 8 0 6 . 0 0 6 . 2 0
1 • IftQ$
16 1 5 10 7 5 3 1 100 24 38 1 2 6 1 2 1 1 4 3 n o 68 7 5 7 3 79 86 32 24 23 22ALL. rKU UU vl lUlM WUKrNtKo • • • • • • • • • • • • 1 ♦ JO 7 J f O J 5 5 5 3
SELECTED OCCUPATIONS
CRANE OPERATORS. ELECTRIC BRIDGE — UNDER 20 T O N S ____ ___________________
5 22 78522
8141619
2524
112 7
1 1 14
1 7"*
3 . 6 73 . 3 44 . 9 23 . 9 33 . 3 5 2 . 8 2 4 . 3 8 3 . 4 3
3 . 5 63 . 7 4
3 . 8 53 . 2 4
3 . 2 23 . 2 2•1 7-T
- - - - - 5 - 11
- - - 3 121 2
10c
61
4 1 1
FITTERS. STRUCTURALO 1 c b
0 1 r
FLAME-CUTTING-MACHINE OPERATORS ------HELPERS. POWER-SHEAR - - - - - - - - - - - - - -
1 4c8 -
16 45
44
1 3 7 6 1 5 2- -
i O
JANITORS — — — — — — — — — — — 12 c
1LAYERS-OUT, STRUCTURAL STEEL -----------------PAINTERS. ROUGH. SPRAY — — — — —
O 6
c
i1 1 1 1 - 8 2 1 - 1 - - - -
POWER-BRAKE OPERATORS. STRUCTURAL STEEL — — — — — — — — —
O J
1 A 1-J
1POWER-SHEAR OPERATORS — — — —
10 3 1 u
PUNCH-PRESS OPERATORS. STRUCTURAL STEEL. CLASS A — — — — —
2 2 8 7
1
J 2
TRUCKDRI VERS — — — — — — —1 O i 2
MEDIUM ( 1 - 1 / 2 TO AND INCLUDING 4 T O N S ) __—___ - ___ ——__ —-----------—___
7 5 2 9 4
HEAVY (OVER 4 TONS. TRAILER TYPE)wfi n r d c . uAKirt —____ ___ ____ _____ ____
’ - - - -10 10
34
1 5- - 5
1 1
2
1
68 3
1 4O
24 1 1
1 31 7
16 2 7 16*)
•VLLUUKO. nMINU — “CLASS A --------------------------------- ----------------------
1 1 J69
1 A ix
f f 4 * 2 67 AC
“ * ** 5 6 3 2 *
ACC p _ -r_ -r10 1 C
10 1 5 11.c
1c
1 2c
1 1 13
1 J 151
c b2
J13
- “
WELDERS* TACK -------------------------------------------------------------IU*t
61 2 . 7 9 C C* “ 5 6 3 2 “ * —
D 1 D J b 10 b
*The Houston Standard Metropolitan Statistical Area consists of Brazoria, Fort Bend, Harris, Liberty, Montgomery, and Waller Counties.
2 Excludes premium pay for overtime and for work on weekends, holidays, and late shifts. These surveys, based on a representative sample of establishments, are designed to measure the level of occupational earnings at a particular time. Thus, comparisons made with previous studies may not reflect expected wage movements because of change in tne sample composition, and shifts in employ
ment among establishments with different pay levels. Such shifts, for example, could decrease an occupational average, even though most establishments increased wages between periods being compared. All production workers covered by the survey were paid on a time basis.
3 Includes workers in classification in addition to those shown separately.
Digitized for FRASER http://fraser.stlouisfed.org/ Federal Reserve Bank of St. Louis

Table 12. Occupational earnings: Los Angeles-Long Beach, Calif.1(Number and average straight-time hourly earnings2 of workers in selected occupations in fabricated structural steel establishments, November 1974)
N u m b e r of w o r k e r s r e c e i v i n g s t r a i g h t - t i m e h o u r l y e a r n i n g s of—
$ $ $ S S $ S $ $ $ 1---- $ $ $ i $ $ $ s $ $ $ ■$---- $Occupation3
Numberof
Averagehourly 4.80 4.90 5.00 5.10 5.20 5.30 5.40 5.50 5.60 5.70 5.80 5.90 6.00 6.10 6.20 6.30 6.40 6.50 6.60 6.70 6.80 7.00 7.20 7.40 7.60
workers earnings Ulidel and
l . 80 under4.90 5.00 5.10 5.20 5.30 5.40 5.SO 5.60 5.7Q 5.80 5.9o 6.00 6.10 6.20 6.30 6.40 6.50 6.60 6.70 6.80 7.00 7.20 7.40 7.60 7.80
ALL PRODUCTION WORKERS ------------- 1*285$6.01 48 5 5 12 9 23 94 50 49 75 65 133 25 72 69 43 254 74 33 21 11 37 20 17 25 16
SELECTED OCCUPATIONS
CRANE OPERATORS, ELECTRIC BRIDGE - 43 6,26 _ _ _ _ _ _ 5 _ - _ - 16 2 - - - - 4 - _ 16 _ _ _UNDER 20 T O N S ---------------------- 37 6.32 - - - - - - 5 - - - - 10 2 - - - - 4 - - - 16 _ _ _ _
ELECTRICIANS, MAINTENANCE ---------- 16 7.09 - - - - - - - - - - - - - - 4 - 3 - - - - _ _ _ _ 9FITTERS, STRUCTURAL ----------------- 104 6.22 - - - - - - - - - - - 13 - 12 10 - 60 5 4 - - _ _ . _FLAME-CUTTING-MACHINE OPERATORS --- 28 5.52 4 4 - - - - - 11 - - 3 - - - 10 - - - - - - - - _ _ _ _LAYERS-OUT, STRUCTURAL STEEL---------- 97
146.49A 1 A
4 - ”2
~ 35
“ 54 4 12 2 3 2 11 2 - -MACHlMblo* MA IN 1 tiMAINLfc.--— --—D» Tm TFDC. DOI IfiH. CODAV ____________ 39
0*10q op 6 20 3 3
rAJ.NIC.Ko* KUUon, SrKMT ——— —POWER-BRAKE OPERATORS, STRUCTURAL
o
w • Oc
AS T E E L ------------ — ___POWER-SHEAR OPERATORS ---------------
o32
6.306.08 _ _ _ _ _ _ 1 _ . 6 - 9 - _ 3
H? 11 - _ _ _ _ _
PUNCH-PRESS OPERATORS, STRUCTURALq TFFI . n AQF A __________ _ ________ 56
295.755.85
3 34 13 231 CuL f LUHjO H ■2 2 2 16 2 3 ”1 KULI'UKl VunO
HEAVY (OVER A TONS, OTHER THANc.
7 5.75 2 2 31 I'W iLC*'' I J * J20 5.83 1 g 3 31 nUV/f'C.nj f ri/nLi\
WELDERS, HAND ------------------------ 142 6.16 _ 4 19 1 27 - 6 69 12 4 _ _C. 1 A 1 5 Av*L»A A X C.C. D . C*r J 1 o 07 ic
WELDERS, MACHINE (ARC OR GAS) ----- 43 5.80 4 20 4 4 11 * “
*The Los Angeles—Long Beach Standard Metropolitan Statistical Area consists of Los Angeles County.2 Excludes premium pay for overtime and for work on weekends, holidays, and late shifts. These surveys, based on a representative
sample of establishments, are designed to measure the level of occupational earnings at a particular time. Thus, comparisons made with previous studies may not reflect expected wage movements because of change in the sample composition, and shifts in employment among establishments with different pay levels. Such shifts, for example, could decrease an occupational average, even though
most establishments increased wages between periods being compared. All production workers covered by the study were paid on a time basis.
3 Includes workers in classification in addition to those shown separately.4 Workers were at $4.50 to $4.60.
Digitized for FRASER http://fraser.stlouisfed.org/ Federal Reserve Bank of St. Louis

Table 13. Occupational earnings: New York-Northeastern New Jersey1(Number and average straight-time hourly earnings2 of workers in selected occupations in fabricated structural steel establishments, November 1974)
N u m b e r of workers receiving straight-time hourly earnings of—$ $ $ 3 — r~$------ T5------- r$------- ^ S $ $ $ $ $ i> * $ $ $ $ i> $ $ $ ■ ■$
O c c u p a t i o n 3Numberof
Averagehourly l l T ^ r
5 . 7 0 5 . 8 0 5 . 9 0 6 . 0 0 6 . 1 0 6 . 2 0 6 . 3 0 6 . 4 0 6 . 5 0 6 . 6 0 6 . 7 0 6 . 8 0 6 . 9 0 7 . 0 0 7 . 1 0 7 . 2 0 7 . 3 0 7 . 4 0 7 . 5 0 7 . 6 0 7 . 7 0 7 . 8 0 7 . 9 0 8 . 0 0 8 . 1 0workers earnings2 | n e r and
1 5 .7 0 u n d e r a nd
i—____ 5 . 8 0 5 . 9 0 6 . 0 0 6 . 1 0 6 . 2 0 6 . 3 0 6 . 4 0 6 . 5 0 6 . 6 0 6 . 7 0 6 . 8 0 6 . 9 0 7 . 0 0 7 . 1 0 7 . 2 0 7 . 3 0 7 . * 0 7 . 5 0 7 . 6 0 7 . 7 0 7 . 8 0 7 . 9 0 8 . 0 0 8 . 1 0 o v e r
ALL PRODUCTION WORKERS ------------------------- 2 * 0 t) 8, $
6 . 7 6 4 5 1 0 1 119 18 2 2 4 17 82 143 2 8 4 46 55 5 70 84 27 89 93 2 0 58 3 26 36 2 1 2 6 106
SELECTED OCCUPATIONS
CRANE OPERATORS, ELECTRIC BRIDGE — 62 6 . 4 3 _ _ _ _ _ _ _ 4 4 _ 7 - 1 1 _ _ _ _ _ _ _ _ _ _ _
UNDER 20 T O N S ____ - ________ ________- - 56 6 . 4 2 4 4 1 1FITTERS, STRUCTURAL — — — — — — — 6 6 6 . 9 3 _ _ 1 61 4FLAME-CUTTING-MACHINE OPERATORS ----- 40 6 . 4 5 _ . _ _ _ - - 36 2 2uci pppc . fiFNFRAI _________ ________ _ 23 8 5 . 9 0 7 c 96 1 ft 1 1 2 5nuUr LnOfHELPERS, PUNCH-PRESS ----------------------------- 17 5 . 9 0
1 c f J 8 5
1 o X X4 . _ _ _ _ _
18 I I ~LAYERS-OUT, STRUCTURAL STEEI--------- ---------- 29 6 7 . 4 3 - - - - - - - - - - - - - - 6 64 8 0 - 51 2 2 1 34 2 7 6 23M FCHANir? . (iFMFO Al 6 4 4
527 . no 4 9 5 59 19 6 0n C . v ” n l N l v O f w u i N l - n n L m
P A T m TFRC- ROI IfiH. C P P AY ————————————1 . u c 6 . 7 6 38 O 1 4
r M l i ' l 1 C r 3 • >> V U v? n f j r WMT ■ ■POWER-BRAKE OPERATORS, STRUCTURAL
c. 4 6
S T E E L ______________________________________——______ 1 1 g . 72 2
PUNCH-PRESS OPERATORS, STRUCTURALo 5 6
STFEL, CLASS A _________________________ — 38 6 . 4 8 30 7 1
TPUCKDPI VERS ---------------------------------------------------------------- 59 6 . 3 7 6 6 6 _ 6 _ . . 3 - 30 4 _ _X3 _ _ i _
HEAVY (OVER 4 TONS, TRAILER TYPE) 37 6 . 7 1 - - - - 6 - - - - - - 23 4 - - 3 - •» i _ _ _HEAVY (OVER 4 TONS, OTHER THAN TRAILER TYPE) — — — — — — — — 6 6 . 6 4 2 4
WELDERS, HAND ------------------------------------------------------------- 2 1 5 6 . 5 7 _ - _ _ _ . . _ 2 2 0 2 9 1 - _ - _ _ - _ _ 1 _ _
191 1 f l A 6v L M O w n " " O . P / 1 O H 1CLASS B ——___————————————————————— 24 6 . 5 7 2 18 3 1
WELDERS, MACHINE (ARC OR GAS) -------------- 37 6 . 6 6 “ ~ “ “ “ " 18 1 2 3 “ 4 - “ " - - - - - - - -
^ h e 18 county New York-Northeastern New Jersey area consists of Bronx, Kings, New York, Putnam, Queens, Richmond, Rockland, and Westchester Counties, N.Y., and Bergen County, N.J. in the New York area; Essex, Morris, Somerset, and Union Counties in the Newark area; Hudson County in the Jersey City area; Passaic County in the Paterson-Clifton-Passaic area; and Middlesex County in the Perth Amboy area; and Nassau and Suffolk Counties.
2 Excludes premium pay for overtime and for work on weekends, holidays, and late shifts. These surveys, based on a representative sample of establishments, are designed to measure the level of occupational earnings at a particular time. Thus, comparisons made with previous studies may not reflect expected wage movements because of change in the sample composition, and shifts in employ
ment among establishments with different pay levels. Such shifts, for example, could decrease an occupational average, even though most establishments increased wages between periods being compared. All production workers covered by the survey were paid on a time basis.
3 Includes workers in classification in addition to those shown separately.4 Workers were at $9.80 to $9.90.5 Workers were to $10.50 to $10.60.6 Workers were at $4.30 to $4.40.
Digitized for FRASER http://fraser.stlouisfed.org/ Federal Reserve Bank of St. Louis

Table 14. Method of wage payment(Percent o f production workers in fabricated structural steel establishments by method of wage payment,1 United States, regions, and selected areas, November 1974)
Method of wage payment UnitedStates
RegionsNew
EnglandMiddle
AtlanticBorder S ta te s Southeast Southwest
GreatLakes
MiddleVest Mountain Pacific
All workers................... . 100 100 100 100 100 100 100 100 100 100
Time-rated workers............. 92 100 83 97 95 100 8 7 94 100 94Formal plans.............. 78 92 82 77 71 73 79 81 100 71
Single rate...... .......... 45 53 71 38 35 34 41 10 60 67Range of r a t e s . • 33 39 11 39 37 39 38 71 40 5
Individual rates............. 14 8 1 20 24 27 8 13 ~ 23
Incentive workers............ . 8 - 17 3 5 - 13 6 - 6Individual piecework........ 2 - 7 - (2) - 2 - - 1Group piecework.............. 1 - 6 - - - (2) - (2)Individual b o n u s . . . 2 - 4 - - - 6 - - -Group bonus........... 3 — (2) 3 4 — 5 6 4
All workers............
Time-rated workers...»Formal plans........
Single ra te.......Range of rates....
Individual rates....
Incentive workers..... Individual piecework Group piecework...•• Individual bonus.... Group bonus*...... . 1 2
AreasNew York--*
Birmingham Chicago Cleveland Detroit Houston Los Angeles- NortheasternLong Beach New Jersey
100 100 100 100 100 100 100
98 92 77 100 100 81 10093 88 70 100 70 73 10074 10 1 97 25 73 10019 79 68 3 44 - -6 4 8 - 30 8 -
2 8 23 _ - 19 -
2 62
23 — _ 41 _
_ - : : _ 14 -
1 For definition of methods of wage payment, see appendix A.2 Less than 0.5 percent.
NOTE: Because of rounding, sums of individual items may not equal totals.
Digitized for FRASER http://fraser.stlouisfed.org/ Federal Reserve Bank of St. Louis

Table 15. Scheduled weekly hours(Percent of production workers in fabricated structural steel establishments by scheduled weekly hours,1 United States, regions, and selected areas, November 1974)
l\DCO
BegionsWeekly hours United
StatesNew
EnglandMiddle
AtlanticBorderStates Southeast Southwest
GreatLakes
MiddleWest Mountain Pacific
All workers................... 100 100 100 100 100 100 100 100 100 100
40 hours....... . 75 60 95 89 67 42 78 69 91 10042.5 hours...................... 1 - - - - 3 - 6 - -43 hours. ............... (2) - - - 2 - - - - -44 hours............ ........... 1 9 - - 4 - 2 - - -45 hours....... ........... . 11 10 5 7 13 28 8 14 5 -47.5 hours.............. . (2) - - - - 2 - 1 - -48 hours... .......... ........... 4 21 - 3 12 (2 ) 6 - - -49 hours. .................... . (2 ) - - - - 1 - - - -49.5 hours. ..................... 2 - - - - 10 - - - -50 hours...................... . 3 - - - 3 12 2 - - -Over 50 hours................. 2 ~ ~ 2 4 9 4
Areas
Birmingham Chicago Cleveland Detroit Houston Los Angeles- Long Beach
New York- Northeastern New Jersey
All workers................... 100 100 100 100 100 100 100
40 ho ur s............ . 80 96 78 87 27 100 10043 ho ur s............... 20 - - - - - -
45 hours. ......... ......... - - - - 20 - -48 hours-. ................ . - - 7 11 3 - -50 ho u r s ........................ . - - - - 50 - -Over 50 hours........ . 4 15 2 ~ ~
1 Data relate to the predominant schedule for full-time day-shift workers in each establishment.2 Less than 0.5 percent.
NOTE: Because of rounding, sums of individual items may not equal 100.
Digitized for FRASER http://fraser.stlouisfed.org/ Federal Reserve Bank of St. Louis

Table 16. Shift differential provisions(Percent o f production workers by shift differential provisions,1 in fa b r ic a te d s tr u c tu r a l s t e e l e s ta b lis h m e n ts , United States, regions, and selected areas, November 1974)
Regions
Shift differential UnitedStates
NewEngland
MiddleAtlantic
BorderStates Southeast Southwest
GreatLakes
MiddleWest Mountain Pacific
Second shiftVorkers in establishments withprovisions for second shift.. 81.7 90.8 94.7 67.8 61.3 63.9 91.1 88.2 97.2 98.2With shift differential..... 80.4 90.8 94.7 67.8 53.2 63.9 90.5 88.2 97. 2 98.2
Uniform cents per hour.... 64.1 52.3 75.3 67.8 47.8 63.9 81. 3 70. 3 55.9 12.15 cents........... . 4.0 - .9 - 3.4 4. 7 8. 2 7.5 7.3 -6 cents...... ............. 1.1 - - 1.3 - 4.1 - 3.4 - -7 cents. ................... . 3 - - - I.9 - - - - -7.5 cents........... .2 - - - - - - - 4.9 -8 cents........... 3.2 - - 11.0 4.3 - 3- 4 10.8 10.1 -9 cents*. ..... ........ 1.1 - - - 7.2 - - - - -10 cents...... . 26.1 14.5 42.9 29.3 16.2 35.6 20.5 15.2 22.6 2.711 cents....... . . 1 - - - - - .4 - - -12 cents........ . 5.2 14.3 7.9 5.9 4. 8 - 10.4 - - -13 cents...... . .4 - - - - - - 2.7 4.4 -14 cents. .......... . .2 - - - - 1 . 0 - - - -15 cents............... • 9.6 17.0 7.5 7.4 5.9 13.0 15.8 6.6 6.5 .917 cents........ 1.0 - - 9.0 - - 2.3 - - -18 cents.... ......... . 1.4 - - - - - 7.1 - - -20 cents................ 5.7 - 2.3 4.0 - 3.6 13.2 19.4 - 3.625 cents........... . 3.8 3. 1 13.8 - 1.4 1 . 8 - - - 4.730 c e nt s................. . .8 3.3 - - 2.7 - - 4.7 - -
Uniform percentage........ 5.8 16.3 6.6 - 2. 3 - 8.1 11.0 3.5 15.94 percent................. 1 . 1 - - - - - - - - 15.95 percent..... ...... . 1.3 - 2.8 - - - - 9.1 - -6 p e r c e n t . ....... . 1 - - - - - - 1.9 ~
7.5 percent...... ........ . 2 - .8 - - - - “ - -
8 percent................. 1 . 2 - - - - - 5.6 - 3-5 -
1 0 percent.......... 1.3 - 2.2 - 2.3 - 2.5 - -
12 percent.............. . 1 1.9 - - - - - -
12.5 percent............ . .4 14.4 - - - - - ~
15 percent....... ........ .2 - .8 - - - - - - -8 hours pay for7.5 hours work............ 2.3 - 6 . 1 - 1.4 - . 8 4. 1 - 5.8
Other full pay forreduced hours. ........... . 2.0 14.4 6. 7 1.6 - - - - -
Other formal differential. 6 . 2 7.8 - - - - .3 2.8 37.8 64.4
See footnotes at end of table.
Digitized for FRASER http://fraser.stlouisfed.org/ Federal Reserve Bank of St. Louis
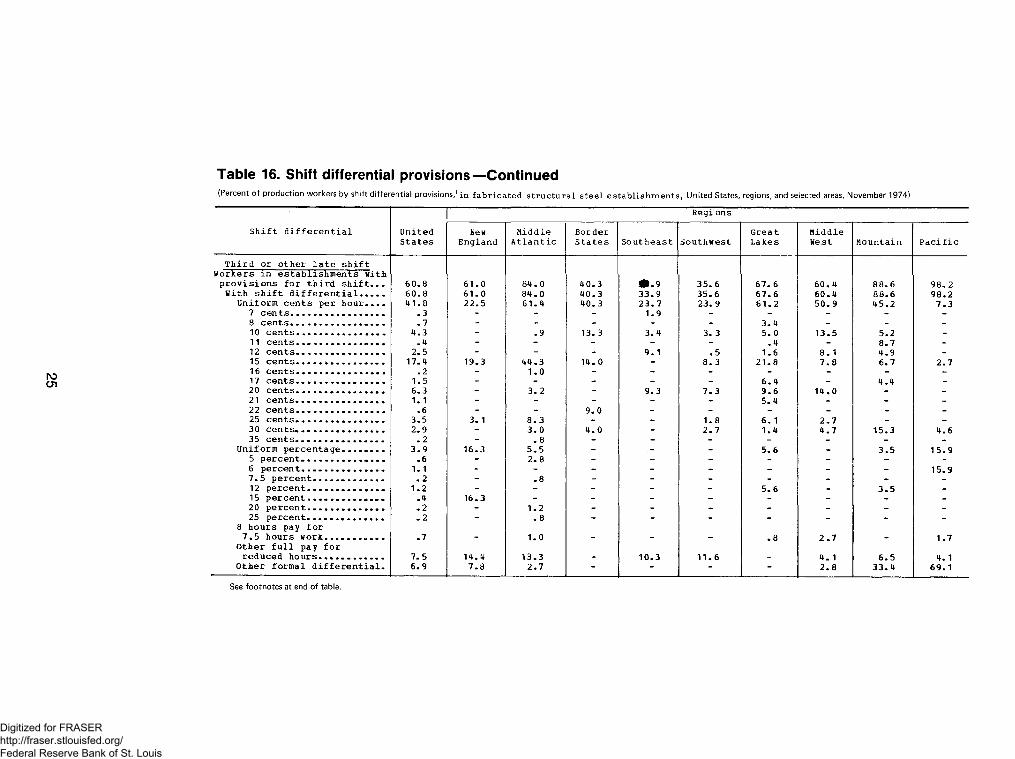
Table 16. Shift differential provisions—Continued(Percent of production workers by shift differential provisions,^in fa b r ic a te d s tr u c tu r a l s t e e l e s ta b lis h m e n ts , United States, regions, and selected areas, November 1974)
Regions
Shift differential UnitedStates
NewEngland
MiddleAtlantic
BorderStates So utheast Southwest
GreatLakes
MiddleWest Mountain Paci fic
Third or other late shift Workers in establishments withprovisions for third shift... 60.8 61.0 84.0 40.3 • .9 35.6 67.6 60.4 88.6 98.2With shift differential.• • . . 60.8 61.0 84.0 40.3 33.9 35.6 67.6 60.4 88.6 98.2
Uniform cents per hour.... 41.8 22.5 61. 4 40.3 23.7 23.9 61.2 50.9 45.2 7.37 cents..... .............. .3 - - - 1.9 - - - - -8 cents........... . .7 - - - - - 3.4 - - -10 cents................. 4.3 - .9 13. 3 3.4 3. 3 5.0 13.5 5.2 -11 cents............... .4 - - - - - .4 - 8.7 -12 cents................ 2.5 - - - 9.1 .5 1.6 8.1 4.9 -15 cents..... ......... 17.4 19.3 44.3 14.0 - 8.3 21.8 7.8 6.7 2.716 cents. .. .............. . . 2 - 1.0 - - - - - - -17 cents.......... 1.5 - - - - - 6.4 - 4.4 -20 cents. ......... ........ 6.3 - 3 . 2 - 9.3 7.3 9.6 14.0 - -21 cents..... ......... 1. 1 - - - - - 5.4 - - -2 2 cents.............. .6 - - 9 . 0 - - - - - -25 cents. ......... ..... . 3.5 3. 1 8.3 - - 1 . 8 6 . 1 2.7 - -30 cents.................. 2.9 - 3.0 4.0 - 2 . 7 1.4 4.7 1 5 . 3 4.635 cents............ . . 2 - . 8 - - - - - - -
Uniform percentage........ 3.9 16.3 5 . 5 - - - 5.6 - 3 . 5 15.95 percent............ . . 6 - 2-8 - - - - - - -6 percent................. 1 . 1 - - - - - - - - 15.97.5 percent............. . 2 - . 8 - - - - - - -12 percent..... . 1 . 2 - - - - - 5 . 6 - 3 . 5 -15 per cent.. ......... .4 16.3 - - - - - - - -20 percent............. . . . 2 - 1 . 2 - - - - - - -
25 percent. . . . . . . . . . . . . . - 2 - . 8 - - - - - - -
8 hours pay for7.5 hours work . . . . . . . . . . . . 7 - 1 . 0 - - - . 8 to -o - 1.7
Other full pay forreduced hours. . . . . . . . . . . . 7.5 14.4 13.3 - 10.3 1 1 . 6 - 4 . 1 6.5 4. 1
Other formal differential. 6.9 7.8 2.7 - - - - 2.8 33.4 69.1
See footnotes at end of table.
Digitized for FRASER http://fraser.stlouisfed.org/ Federal Reserve Bank of St. Louis

Table 16. Shift differential provisions—Continued(Percent o f production workers by shift differential provisions,1 ^ f a b r ic a t e d s tr u c tu r a l s t e e l e s ta b lis h m e n ts , ( United States, regions, and selected areas, November 1974)
AreasShift differential
Birmingham Chicago Cleveland Detroit Houston Los Angeles- Long Beach
New York- Northeastern New Jersey
Second shiftWorkers-in establishments withprovisions for second shift.. 94.3 72.8 91.9 92.7 75.7 96.9 95-6With shift differential..... 94.3 72.8 91.9 92.7 75.7 96.9 95.6
Uniform cents per hour.... 94.3 48.0 91.9 92.7 75.7 12.1 48.05 cents......... . - - - 22.9 12.1 - -7 cents................. 19.5 - - - - - -9 cents........... ........ 74.8 - - - - - -10 cents. .............. . - 17.7 - 12.7 46.1 9.0 -11 cents........... ....... - - - 3. 9 - - -12 cents.......... ........ - - - 51.3 - - -14 cents................ - - - - 8.9 - -15 cents........... . - 13.6 25. 3 1.9 - 3.1 -18 cents......... . - - 66.6 - - - -20 cents............. . - 1 6.8 - - 8.5 - -25 cents....... . - - - - - - 48.0
Uniform percentage......... - 22.4 - - - - 4.910 percent.......... . - 22. 4 - - - - -15 percent...... . - - - - - - 4.9
Other full pay forreduced hours...... . - - - - - - 42.7
Other formal differential. - 2. 4 - - - 84.7
Third or other late shift Workers in establishments withprovisions for third shift... 94. 3 34.4 91.9 90. 8 16.8 96.9 95.6With shift differential..... 94. 3 34.4 91 .9 90.8 16.8 96.9 95.6
Uniform cents per hour.... 19.5 34.4 91.9 90-8 16. 8 1 2 . 1 48.07 ce nt s............ ....... 19.5 - - - - - -10 cents .......... . - - - 22. 9 12.1 - -11 cents..... ............. - - - 3. 9 - - -12 cents............... . - - - - 4.7 - -15 ce nt s................ - 17.7 25.3 - - 9.0 -17 cents............... - - - 51.3 - - -20 cents........ . - - 6 6 . 6 12.7 - - -21 cents. .............. - 16.8 - - - - -25 cents .............. . - - - - - - ■Cr 0
0 o
30 cents............ - - - - - 3.1 -Uniform percentage........ - - - - - 4.9
25 percent.......... . - - - - - - 4.9Other full pay for reduced hours............ ■c? • 0
0 _ _ _ _ 42.7Other formal differential. - - - - - 84.7 -
1 Refers to policies of establishments either currently operating late shifts or having provisions covering late shifts.
NOTE: Because of rounding, sums of individual items may not equal totals.
Digitized for FRASER http://fraser.stlouisfed.org/ Federal Reserve Bank of St. Louis

Table 17. Shift differential practices(Percent of production workers employed on late shifts in fabricated structural steel establishments, United States, regions, and selected areas, November 1974)
Shift differentialR e g ions
UnitedStates
NewEngland
MiddleAtlan t i c
BorderStates S o u theast Southwest
GreatLakes
MiddleWest Mountain Pacific
Second shiftW o r k e r s e m ployed on seconds h i f t . ............ ................ 15.3 10. 4 16.5 10.9 14.3 14. 0 19.9 14.4 10.8 13.3R e c e i v i n g shift d i f ferential 14. 8 10.4 16.5 10.9 10.7 14.0 19.9 14. 4 10.8 13.3
U n i f o r m cents per hour,... 13.0 10.4 15.6 10.9 10.5 14.0 17. 1 13. 6 5.3 1.85 c e n t s ........... .6 - - - 1.6 . 3 . 8 1.5 - -6 cents ................... .4 - - - - 1. 9 - 1.2 - -8 cents................. -8 - - 3.3 .8 - 1.0 2.9 1.3 -9 c e n t s . . ............... .4 - - - 2. 9 - - - - -10 c e n t s .................... 4.7 3.2 9.3 .7 3-0 7.3 3. 9 1.4 2.0 -12 cents. ..... ........ . 1. 1 4.6 2. 2 1.2 .2 - 2. 1 - - _13 c e n t s . . ........ . . 1 - - - - - - .9 . 1 _15 c e n t s ........ ........... 2.3 2.7 1.6 2.5 1.5 4.4 3. 5 .3 2.0 . 117 c e n t s ........ . .4 - - 3. 2 - - .9 - - _18 c e n t s . . . ..... . .3 - - - - - 1.4 - - _20 c e n t s , . .................. 1. 1 - . 2 - - . 1 3.5 4.6 - .725 c e n t s . . .............. .6 - 2.3 - .3 - - - - .930 c e n t s . ............... .1 - - - . 1 - - . 8 - -
U n i f o r m p e r c e n t a g e......... 1.0 - .8 - .2 - 2.6 C D .7 4.04 p e r c e n t . . . ............... .3 - - - - - - - 4.05 percent............... .2 - .8 - - - - - - -6 p e r c e n t ................... (1) - - - - - - ( D - -8 p e r c e n t . ....... .......... .5 - - - - - 2. 6 .7 -10 p e r c e n t ........ (D - - - .2 - d ) - - -
8 h o u r s pay for7. 5 hours w o r k . . ..... . . 1 - .2 - - - . 2 _ _ _
O t h e r f ormal differential. .7 - - - - - - .7 4.8 7.5
T h i r d or other late shift W o r k e r s emplo y e d on thirds h i f t .......................... 1.4 - 4.0 .2 . 1 - 2.2 -1 .7 .6Recei v i n g shift differential 1.4 - 4.0 .2 .1 - 2.2 . 1 .7 .6
U n i f o r m c e nts per hour.... 1.3 - 3.8 .2 ( D - 2. 2 . 1 .7 -8 c e n t s ............ (D - - - - . 1 - _ _10 c e n t s . ..... . (1) - - . 2 - - - _ _ _12 c e n t s . ....... . CD - - - C D - - - - _15 cents.. ............... . . 1.1 - 3.4 - - 1-8 - .7 -20 c e n t s • .1 - .4 - - - - _ _ _25 c e n t s . ............... .1 - - - - - . 3 . 1 _ _
U n i f o r m p e r c e n t a g e . • ( D - .2 - - - - - - -5 p e r c e n t . .................. C D - .2 - - - - - - _
8 hours pay for7.5 hours work........... C D - - - - - - 1 _ - _
O t h e r full pay forred u c e d h o u r s . • C D - - - .1 - _ - _ _
O t h e r form a l differential. C D - - - - - - - - . 6
See footnotes at end of table.
Digitized for FRASER http://fraser.stlouisfed.org/ Federal Reserve Bank of St. Louis

Table 17. Shift differential practices—Continued(Percent of production workers employed on late shifts in fabricated structural steel establishments, United States, regions, and selected areas, November 1974)
AREASS h i f t D i f f e r e n t i a l Birmingham C h i c a g o Cleveland Detroi t H o u s t o n Los Angeles-
Long BeachN o r t h e a s t e r n New Jersey
Second shiftW o r k e r s e m p l o y e d on secondshift . . . ...................... . 30.4 13.6 23.7 22.6 6.6 10.6 .4R e c e i v i n g s h i f t differential 30.4 13.6 23. 7 22.6 6.6 10.6 .4
U n i f o r m c e n t s per hour.... 30.4 13.2 23.7 22.6 6.6 .4 .45 c e n t s . ............ - - - 3.7 .8 -9 c e n t s ........ ............ 30. 4 - - - - - -10 c e n t s . . . . . ..... . - 4.7 - - 5.0 - -12 c e n t s .................... - - - 18.0 - - -15 c e n t s ....... ........... . - 1.4 7.3 -9 - .4 -18 cents- ........... . - - 16.4 - - - ~20 c e n t s ................ - 7.0 - - . 9 -25 c e n t s ............. . - - - - - - .4
U n i f o r m p e r c e n t a g e . . ....... - .4 - ~ ~10 p e r c e n t . ............. - .4 - ~
o t h e r formal differential. ~ " 10. 2
T h i r d or o t h e r late shift W o r k e r s e m p l o y e d on third
1.4s h i f t ............................. . .7 - - - ”R e c e i v i n g s h i f t differential .7 - - - - 1.4 -
O t her full pay forr e d u c e d h o u r s ............ . .7 - - - - - -
O t h e r f ormal differential. ~ — —" '
1.4
1 Less than 0.05 percent.
NOTE: Because of rounding, sums of individual items may not equal totals.
Digitized for FRASER http://fraser.stlouisfed.org/ Federal Reserve Bank of St. Louis

Table 18. Paid holidays(Percent of production workers in fabricated structural steel establishments with provisions for paid holidays, United States, regions, and selected areas, November 1974)
N>CO
Number o f p a id h o l i d a y s UnitedS ta t e s
NewEngland
M id d leA t l a n t i c
B ord erS t a t e s S o u t h e a s t
Regi ons
S outhw estG reatLakes
M idd leNest Mountain P a c i f i c
A l l w o r k e r s . 100 100 100 100 100 100
Workers in establishments providing paid holidays......4 days.............. ...........5 d ays............... ........ .5 days plus 1 half day......6 days.......................6 days plus 1 half da y ......6 days plus 2 half days.....7 d a y s ...........................7 days plus 1 half day......7 days plus 2 half days.....8 d a y s .................. ........8 days plus 1 half day......8 days plus 2 half days.....9 d a y s ...... ...................9 days plus 1 half day......9 days plus 2 half days.....10 days. . .......................10 days plus 1 half day.....10 days plus 2 half days....11 d a y s .........................12 d a y s ..... ................. .13 d a y s .....................14 days.....................
All w o r kers........ .
Workers in establishments providing paid holidays......4 days............. ............5 days......................5 days plus 1 half d a y ..... .6 d a y s ......................... .6 days plus 1 half day......6 days plus 2 half days.....7 d a ys. ..........................7 days plus 1 half d a y.....7 days plus 2 half days.....8 d a y s . .................. .......8 days plus 1 half d a y .....8 days plus 2 half days.....9 da ys... .................9 days plus 1 half day......9 days plus 2 half days.....10 d a y s..... ...................10 days plus 1 half day.....10 days plus 2 half days....11 days. ......... ............12 days.............13 d a y s .........................14 days................ . 1
9912
d )12O )( D10( D1
14
100
3
99 100
16
100141
282
1 24 21
15 39 28
(1) -(1) -
30 262 -
(1) -14 49(D 8d ) -6 132 -
3 -
(D -
44319
101014
1
17
3
1
14
10029
28
120
1
18
13
99
5 4 1
426
22
17( 1 )
100 100 100
12 10
213 7
1
15 27 5
535 53 30
Birmingham Chicago Cleveland Detroit Houston Los Angeles- Long Beach
New York- Northeastern New Jersey
100 100 100 100 100 100 100
100 100 100 98 100 100 95
6 - - - 18 -
- 4 1 2 8 - -
- - - - 53 - -
75 - - - - - -
20 3 4 - 6 21 5 6 -
- 6 2 6 6 7 - 44 -
- - 33 80 - - -
_ - -z
- - 87- _ ~ — 8
1 Less than 0.5 percent.
NOTE: Because of rounding, sums of individual items may not equal totals.
Digitized for FRASER http://fraser.stlouisfed.org/ Federal Reserve Bank of St. Louis

Table 19. Paid vacations(Percent of production workers in fabricated structural steel establishments with formal provisions for paid vacations after selected periods of service, United States, regions and selected areas,November 1974)
Vacation policy \ / UnitedStates
NewEngland
MiddleAtlantic
BorderStates Southeast
Regions
SouthwestGreatLakes
MiddleWest Mountain Pacific
All w orkers...........o...... . 100 100 100 100 100 100 100 100 100 100
METHOD OF PAYMENT
Workers in establishmentsproviding paid vacations..... 99 100 99 100 100 99 100 100 100 100
Length-of-time payment..... 94 90 97 91 95 91 98 84 100 95Percentage payment......... 5 10 2 9 5 8 2 16 - 5
Amount of vacation pay 2/
After 1 year of service:Under 1 we e k .................... (3) - 2 - - - - - - -1 week................ 85 74 84 94 82 79 89 92 100 88Over 1 and under 2 weeks.... 4 - 5 - - 8 7 3 - -2 weeks..................... 9 26 8 6 18 11 3 5 - 12
After 2 years of service:Under 1 week............... . (3) - 2 - - - - - - -1 week ................. . 58 41 48 64 54 60 72 74 63 31Over 1 and under 2 weeks.... 14 - 25 11 6 10 19 3 28 132 w e e k s .......................... 27 59 24 25 40 28 9 23 9 56
After 3 years of service:1 week ...................... . 15 - 5 21 39 30 2 23 1 -Over 1 and under 2 weeks.... 9 - 18 6 12 4 10 - 2 -2 weeks............... . 71 89 69 73 49 58 * 83 75 86 100Over 2 and under 3 weeks... 4 11 4 - - 6 6 3 10 -3 w e e k s . .................... 1 - 3 - - - - - - -
After 5 years of service:1 w e ek..................... • 2 - 2 - 2 4 - - 1 -Over 1 and under 2 weeks.... (3) - - - - - 1 - - -2 w e e k s . . . . . . . ...... . 86 71 89 97 94 86 70 97 88 86Over 2 and under 3 weeks... 9 25 4 - - 8 26 3 10 -3 weeks. ......................... 3 3 3 3 3 - 3 - - 14
After 10 years of service:1 week. ........ ................ 1 - - - 2 4 - - 1 -
Over 1 and under 2 weeks.... (3) - 2 - - - - - - -2 weeks.. . . . . . . ....... . 28 52 4 21 53 64 13 30 19 2Over 2 and under 3 weeks... 5 - - - - 13 13 - 5 -3 weeks..................... 60 30 85 76 45 18 67 67 49 97Over 3 and under 4 weeks.... 4 18 4 - - - 6 3 26 -4 weeks . . . . ...... . (3) - - 3 - - - - - 1Over 4 and under 5 weeks.... (3) - - - - - 1 - - -5 weeks..................... 1 - 3 - - - - - - -
See footnotes at end of table.
Digitized for FRASER http://fraser.stlouisfed.org/ Federal Reserve Bank of St. Louis

Table 19. Paid vacations—Continued(Percent of production workers in fabricated structural steel establishments with formal provisions for paid vacations after selected periods of service, United States, regions and selected areas,November 1974)
Vacation policy ly UnitedStates
RegionsNew
EnglandMiddle
AtlanticBorde r States Southeast Southwest
GreatLakes
MiddleWest Mountain Pacific
After 12 years of service:1 week............. . 1 - - - 2 4 - - 1 -Over 1 and under 2 weeks.... (3) - 2 - - - - - - -2 weeks.................... . 23 33 4 21 46 57 5 25 15 2Over 2 and under 3 weeks... 5 - - - - 13 11 - 9 -3 w e e k s ..... • 62 49 80 76 52 25 74 65 49 96Over 3 and under 4 weeks.... 5 18 6 - - - 10 3 26 -4 weeks............... . 1 - 3 3 - - - 8 - 2Over 4 and under 5 weeks.... (3) - - - - - 1 - - -5 weeks................... ...... 1 - 3 - - - - - - -
After 15 years of service:1 week......... . 1 - - - 2 4 - - 1 -Over 1 and under 2 weeks.... (3) - 2 - - - - - - -2 weeks...................... 13 - - 8 31 34 3 13 7 2Over 2 and under 3 weeks... (3) - - - - - 2 - - -3 weeks............ . 61 74 6 1 77 62 50 52 65 66 87Over 3 and under 4 weeks.... 9 24 6 - - 8 22 8 26 -4 w e e k s ............... . 12 2 26 14 5 2 14 14 - 12Over 4 and under 5 weeks.... 1 - - - - - 6 - - -5 weeks............ . 1 - 3 - - - 1 - - -
After 20 years of service:1 w e e k . ............ ............. 1 - - - 2 4 - - 1 -Over 1 and under 2 weeks..... {3) - 2 - - - - - - -2 weeks..................... 12 - - 8 31 30 3 8 7 23 we e k s ................. ....... 36 54 38 65 30 41 23 39 50 21Over 3 and under 4 weeks.... 4 28 3 - - 8 1 4 26 -4 wee k s . . ........... . 32 18 24 15 37 15 49 33 16 78Over 4 and under 5 weeks.... 5 - 4 - - - 18 8 - -5 weeks.............. 8 - 28 11 - - 5 8 - -6 w e e k s . .................... (3) - 1 - - - - - - -Over 6 and under 7 weeks.... (3) - - - - - 1 - -- -
After 25 years of service: 4/1 w e e k ................. ........ 1 - - - 2 4 - - 1 -2 weeks............... . 12 - 2 8 31 30 3 8 7 23 weeks..................... 23 44 10 56 28 36 12 8 50 6Over 3 and under 4 weeks.... 4 20 1 - - 8 1 4 26 -4 w e e k s ...... .................. 41 35 39 24 39 20 47 64 16 87Over 4 and under 5 weeks.... 4 - 3 - - - 16 8 - -
5 weeks..................... 12 - 30 11 - - 19 8 - 6Over 5 and under 6 weeks.... (3) - - - - - 1 - - -
6 w e e k s..... ................... 3 - 13 - - - - - - -
Over 6 and under 7 weeks.... (3) - - - - - 1 - - -
See footnotes at end of table.
Digitized for FRASER http://fraser.stlouisfed.org/ Federal Reserve Bank of St. Louis

Table 19. Paid vacations—Continued(Percent of production workers in fabricated structural steel establishments with formal provisions for paid vacations after selected periods of service, United States, regions and selected areas,November 1974)
Areas
Vacation policy 1/ Birmingham Chicago Cleveland Detroit Houston Los Angeles- Long Beach
---New YofTT-Northeastern New Jersey
All workers............ 100 100 100 100 100 100 100
METHOD OF PAYMENT
Workers in establishmentsproviding paid vacations..... 99 100 100 100 100 100 95
Length-of-time payment..... 99 100 100 100 100 100 95
Amount of vacation pay 2/
After 1 year of service:1 week....... ......... . 80 100 33 98 82 100 95Over 1 and under 2 weeks.... - - 67 - - - -2 weeks..................... 20 - - 2 9 - -
After 2 years of service:1 week. ......................... 75 98 _ 35 76 9 _
Over 1 and under 2 weeks.... 6 - 100 53 8 44 -2 weeks....................• 20 2 - 12 15 47 95
After 3 years of service:1 week.*............ . 75 - - - 10 - -Over 1 and under 2 weeks.... 6 - 1 4 8 - -2 weeks..................... 20 100 8 96 82 100 95Over 2 and under 3 weeks... - - 92 - - - -
After 5 years of service:Over 1 and under 2 weeks.... - - 1 - - - -2 weeks.......... 100 100 8 47 100 56 95Over 2 and under 3 weeks... - - 92 53 - - -3 weeks..................... - - - - - 44 -
After 10 years of service:2 weeks..................... 6 - - 5 100 - -Over 2 and under 3 weeks... - - 33 - - - -3 weeks..................... 94 100 1 95 - 100 95Over 3 and under 4 weeks.... - - 67 - - - -
After 12 years of service:2 weeks........................ 6 - - 5 100 - -3 weeks........... . 94 100 8 95 - 97 95Over 3 and under 4 weeks.... - - 92 - - - -4 weeks..................... - - - - - 3 -
After 15 years of service:2 weeks..................... 6 - - 5 39 - -3 weeks............ 94 98 1 15 61 64 -Over 3 and under 4 weeks.... - - 33 51 - - -4 weeks..................... - 2 - 29 - 36 95Over 4 and under 5 weeks.... - - 67 - - - -
After 20 years of service:2 weeks...... ................. 6 - - 5 39 - -3 weeks....... ................ 20 21 1 9 61 21 -4 weeks. .................... . 75 79 8 77 - 79 -Over 4 and under 5 weeks.... - - 92 6 - - -5 weeks.............. - - - 4 - - 95
After 25 years of service: 4/2 weeks. ........ ...... . 6 - - 5 39 - -3 weeks..................... 20 4 1 9 61 12 -4 weeks..................... 75 80 8 25 - 88 -Over 4 and under 5 weeks.... - - 92 6 - - -5 weeks..................... - 17 - 55 - - 476 weeks................ “ ~ ~ ~ ~ 48
1 Includes basic plans only.2 Vacation payments such as percent of annual earnings were converted to an equivalent time basis. Periods of service were arbitrarily chosen and do not necessarily reflect individual
establishment provisions for progression. For example, changes indicated at 10 years may include changes that occurred between 5 and 10 years.3 Less than 0.5 percent.4 Vacation provisions were virtually the same after longer periods of service.
NOTE: Because of rounding, sums of individual items may not equal totals.
Digitized for FRASER http://fraser.stlouisfed.org/ Federal Reserve Bank of St. Louis

Table 20. Health, insurance, and retirement plans(Percent of production workers in fabricated structural steel establishments with specified health, insurance, and retirement plans, United States, regions and selected areas, November 1974)
Regi onsType of plan United
StatesNew
E n glandMiddle
AtlanticBorder S ta te s S o u t h e a s t Southvest
GreatL a k e s
MiddleWest Mountain Pacific
All w o r k e r s . . . . . ................. 100 100 100 100 100 100 100 100 100 100
Wor k e r s in e s t ablishments providing:
Life i n s u r a n c e . . ................. 98 100 99 92 95 98 99 98 99 100N o n c o n t r i b u t o r y plans....... 76 100 96 56 70 40 91 53 94 100
A c c i d e n t a l death andd i s m e m b e r m e n t insurance...... 79 94 67 92 75 78 77 86 98 93No n c o n t r i b u t o r y plans...o... 60 94 64 60 54 27 .71 52 93 93
S i c k n e s s and accident i n s u r a n c e or sick leaveor both 2 / . . .................. . 83 97 88 87 73 70 96 82 88 77
Sickn e s s and accidentinsurance. ............ . 77 97 88 87 62 53 96 82 88 60N o n c ontributory plans... 66 97 85 66 47 31 88 58 83 60
Sick l e a v e (full pay.no waiting period)....... 4 3 8 1 - 4 (3) 3 13 9
Sick leave (partial payor waiting period)....... 6 - 1 - 11 19 - 5 9 9
L o n g - t e r m d i sability insurance 8 13 3 - 13 16 13 - - 1Nonco n t r i b u t o r y p l ans........ 7 13 3 - 8 11 12 - - 1
H o s p i t a l i z a t i o n i n s u r a n c e..... 99 100 100 100 100 99 100 94 100 100N o n c o n t r i b u t o r y p l a n s . ...... 79 100 97 71 80 40 90 64 94 100
S urgical insurance............ 99 100 100 100 100 99 100 94 100 100N o n c o n t r i b u t o r y plans....... 79 100 97 71 80 40 90 64 94 100
M e d i c a l i n s u r a n c e . ............ 98 100 99 100 99 95 100 94 100 100Nonco n t r i b u t o r y plans....... 79 100 97 71 79 40 90 64 94 100
Major m edical insurance....... 89 97 92 93 95 94 70 92 100 100N o n c o n t r i b u t o r y plans....... 70 97 89 64 76 40 60 66 94 100
Den t a l care insurance......... 16 3 25 3 3 7 6 8 18 89N o n c o n t r i b u t o r y p l a n s . ...... 14 3 19 3 1 7 4 8 18 89
V isual care insurance......... 15 3 27 13 1 7 18 4 - 44Nonc o n t r i b u t o r y plans....... 12 3 20 3 1 7 15 - - 44
R e tirement plans 4 / ......... 84 84 94 75 67 78 94 83 64 95P e n s i o n s . ................... 79 84 93 67 61 60 94 83 64 95
N o n c o n t ributory plans..... 73 81 93 67 57 40 89 78 55 95S e v e r a n c e p a y . . . ......... . 11 - 23 7 5 21 4 - - 3
No p l a n s ...................... ~ - ~ - - - - -
See footnotes at end of table.
Digitized for FRASER http://fraser.stlouisfed.org/ Federal Reserve Bank of St. Louis

Table 20. Health, insurance, and retirement plans—Continued(Percent of production workers in fabricated structural steel establishments with specified health, insurance, and retirement plans, United States, regions and selected areas, November 1974)
Areas
Type of planBirmingham Chicago Cleveland Detroit Houston Los Angeles-
Long Beach
New York- Northeastern New Jersey
All workers- ..... .......... . 100 100 100 100 100 100 100
Workers in establishments providing:
Life insurance.......... 100 100 99 100 100 100 100Noncontributory plans....... 94 100 99 100 91 100 83
Accidental death anddismemberment insurance...... 100 100 92 100 70 88 100Noncontributory plans....... 94 100 92 100 61 88 83
Sickness and accident insurance or sick leaveor both 2/.......... .......«... 80 100 100 100 64 50 100
Sickness and accidentinsurance..... . 80 100 99 100 61 9 100Noncontributory plans... 75 100 99 100 61 9 83
Sick leave (full pay.no waiting period) ...... . - - 1 - - 30 5,2
Sick leave (partial payor waiting period)....... - - - - 3 12 -
Long-term disability insurance - 17 - - 9 - -Noncontributory plans....... - 17 - - 9 - -
Hospitalization insurance..... 100 100 100 100 100 100 100Noncontributory plans....... 94 100 100 100 91 100 83
Surgical insurance........ . 100 100 100 100 100 100 100Noncontributory plans....... 94 100 100 100 91 100 83
Medical insurance ............ . 100 100 99 100 100 100 100Noncontributory plans....... 94 100 99 100 91 100 83
Major medical insurance....... 100 100 23 66 97 100 99Noncontributory plans....... 94 100 23 66 87 100 82
Dental care insurance......... - - 15 10 - 85 84Noncontributory plans....... - - 15 10 - 85 47
Visual care insurance......... - - 25 29 - - 83Noncontributory plans....... - - 25 29 - - 46
Retirement plans 4/........... 100 96 99 98 64 88 100Pensions. ....................... 80 96 9 9 9 8 64 8 8 100
Noncontributory plans..... 80 96 9 9 98 29 8 8 100Severance pay......... . 20 18 - - - 9 9
No p l a n s . • — — —'
1 Includes only those plans for which the employer pays at least part o f the cost. Legally required plans such as workers' compensation were excluded; however plans required by State temporary disability laws are included if the employer contributes more than is legally required or the employees receive benefits in excess of legal requirements. "Noncontributory plans"1 include only those paid for entirely by the employer.
2 Unduplicated total of workers receiving sickness and accident insurance and sick leave plans shown separately.3 Less than 0.5 percent.4 Unduplicated total of workers covered by pension or retirement severance plans shown separately.
NOTE: Because of rounding, sums of individual items may not equal totals.
Digitized for FRASER http://fraser.stlouisfed.org/ Federal Reserve Bank of St. Louis

Table 21. Other selected benefits(Percent of production workers in fabricated structural steel establishments providing cost-of-living adjustments, funeral leave pay, jury duty pay, severance pay, and supplemental unemployment benefits,1 United States, regions, and selected areas, November 1974)
COC71
Item
Workers in establishments with provisions for:
C o st-o f- liv in g a d ju stm e n ts1 2 ................F u n e ra l le a v e p a y .....................................Ju ry duty pay .............................. .. ............T e c h n o lo g ic a l s e v e r a n c e pay3 ...........S u p p lem en ta l u n em p loym en t
b e n e f i t s ............................... .. • • • • • • • «
RegionsUnitedStates
NewEngland
MiddleAtlantic
BorderStates Southeast Southwest
GreatLakes
---MiddleWest Mountain Pacific
32 11 46 17 34 53 13 11 2170 94 93 74 46 38 93 71 41 7668 42 73 54 60 70 70 77 51 8112 5 39 - - 6 10 - 15 3
14 - 36 - 5 1 28 - 5 3
Workers in establishments with provisions for:
Cost-of-living adjustments*...Funeral leave pay..............Jury duty pay.Technological severance pay3.. Supplemental unemployment benefits..... ...................
Areas
Birmingham Chicago Cleveland Detroit Houston Los Angeles- Long Beach
Nev York- Northeastern New Jersey
WO 92 51 53 4620 100 99 72 - 56 7294 100 25 85 65 42 7- 18 15 - - 9 40
- 18 - 51 - 9 -
1 For definition of benefits, see appendix A. paid as a supplement to such rates.2 Unless periodic adjustments were currently provided for, establishments were considered as not having 3 Refers to formal plans providing for payments to employees permanently separated because of a change
this provision, even though adjustments accrued earlier-but not incorporated in basic wage rates-continued to be in technology or plan or department closing.
Digitized for FRASER http://fraser.stlouisfed.org/ Federal Reserve Bank of St. Louis

Appendix A. Scope and Method of Survey
Scope of survey
Included in the survey w ere estab lish m en ts engaged prim arily in m anufacturing fabricated iron and stee l or o th er m etal for structural purposes, for bridges, b u ild ings, and sectio n s for sh ips, b o a ts , and barges (in d u stry 3 4 4 1 as d efin ed in the 1 9 6 7 ed itio n o f the Standard Industrial Classification Manual, prepared b y the U . S. O ffice o f M anagem ent and B u d get). Separate auxiliary u n its such as central o ff ice s w ere ex c lu d ed . T he estab lishm ents stud ied w ere se lected from th o se em p lo y in g 2 0 w orkers or m ore at the tim e o f reference o f the data used in com p ilin g the universe lists.
T able A -l sh ow s the num ber o f estab lish m en ts and w orkers estim ated to be w ith in the scop e o f the survey, as w ell as the num ber actually stud ied b y the Bureau.
Method of study
D ata w ere o b ta in ed by personal visits o f the B ureau’s field s ta ff to a representative sam ple o f estab lish m en ts w ith in the scope o f the survey. T o ob ta in appropriate accuracy at m in im um c o st , a greater p rop ortion o f large than o f sm all estab lish m en ts w as stud ied . In com b in in g the data, h ow ever, all estab lish m en ts w ere given their appropriate w eigh t. A ll estim ates are p resen ted , th erefo re , as relating to all estab lish m en ts w ith in the scop e o f the survey at the tim e o f reference o f the universe data.
Establishment definition
A n estab lish m en t, for purposes o f th is s tu d y , is d efin ed as a single physica l lo ca tio n w here industrial op eration s are perform ed . An estab lish m en t is n o t necessarily id en tica l w ith a co m p a n y , w h ich m ay con sist o f on e or m ore esta b lish m en ts. T he term s “esta b lish m en t” and “p la n t” have
b een used in terchangeab ly in th is b u lle tin .
Employment
The estim ates o f the num ber o f w orkers w ith in the scop e o f the stu d y are in ten d ed as a general guide to the size and co m p o sitio n o f the labor fo rce , rather than as a
precise m easure o f em p lo y m en t.
Production workers
The term “ p ro d u ctio n w ork ers,” as used in th is b u lle tin , inclu d es w ork ing fo rem en and all nonsupervisory w orkers engaged in n o n o ff ic e fu n ctio n s . A d m in istrative , ex ecu tiv e , profession a l, and tech n ica l p erson n el, and force-account co n stru ctio n em p lo y ees , w h o w ere u tilized as a separate w ork force on the firm ’s o w n p rop erties, w ere ex c lu d ed . W orkers o f the covered estab lish m en ts w h o were em p lo y ed at a con stru ctio n site aw ay from the shop were also e x cluded from the p rod u ction -w ork er data but w ere included in the to ta ls sh ow n in table A - l .
Occupations selected for study
O ccu p ation al classifica tion w as based on a un iform set o f job descrip tion s designed to take accou n t o f in terestab lish m en t and interarea variations in duties w ith in the sam e jo b . (S ee ap p en d ix B for these d escr ip tion s.) The criteria for se lec tio n o f the o ccu p a tio n were: N um ber o f w orkers in the o ccu p a tio n ; u sefu ln ess o f the data in co llective bargaining; and appropriate representation o f the entire job scale in the in d u stry . W orking supervisors, apprentices, learners, beginners, tra inees, and h an d icap p ed , part-tim e, tem porary , and probationary w orkers w ere n o t reported in the data for se lected o ccu p a tio n s b ut were included in the data for all p ro d u ctio n w orkers.
Wage data
In form ation on w ages relates to average straight-tim e h ou rly earnings, exc lu d in g prem ium pay for overtim e and for w ork on w eek en d s, h o lid a y s, and late sh ifts . Incentive p aym en ts, such as th ose resulting from p iecew ork or p rod u ction bon u s sy stem s, and cost-of-liv ing b onuses were in clu d ed as a part o f the w ork ers’ regular p ay . N o n p ro d u ctio n b on u s p a y m en ts, such as Christm as or year-end b on u ses, w ere ex c lu d ed .
Average (m ea n ) h ou rly rates or earnings for each o c cu p ation or category o f w orkers, such as p rod u ction w ork ers, w ere ca lcu lated b y w eighting each rate (or h ou rly earnings) b y the num ber o f w orkers receiving the rate, to ta lin g , and divid ing b y the num ber o f ind ividuals. The h ou rly earnings o f salaried w orkers w ere ob ta in ed by dividing their straight-tim e salary b y norm al or standard hours to w h ich the salary corresponded .
36
Digitized for FRASER http://fraser.stlouisfed.org/ Federal Reserve Bank of St. Louis

The m edian designates p o sitio n ; that is, o n e-h a lf o f the em p lo y ees surveyed received m ore than th is rate and one- h a lf received less. The m iddle range is defin ed by tw o rates o f pay; on e-fou rth o f the em p lo y ees earned less than the low er o f these rates and on e-fou rth earned m ore than the higher rate.
Size of community
C om panies w ere classified according to their lo ca tio n in either m etrop o litan or n o n m etro p o lita n areas. The term “m etrop o litan area,” as used in th is b u lle tin , refers to the Standard M etropolitan Statistica l Areas as d efin ed b y the U. S. O ffice o f M anagem ent and B udget through February1 9 7 4 .
E xcep t in N ew E ngland, a Standard M etropolitan S ta tistical Area is defined as a co u n ty or group o f co n tig u o u s co u n ties w h ich con ta in s at least one c ity o f 5 0 ,0 0 0 in h ab itants or m ore. C ounties con tigu ou s to the on e conta in ing such a c ity are included in a Standard M etropolitan S ta tistical Area if , according to certain criteria, th ey are essen tia lly m etrop o litan in character and are socia lly and e c o n o m ically in tegrated w ith the central c ity . In N ew E ngland, the c ity and to w n are adm inistratively m ore im portant than the co u n ty and th ey are the un its used in defin ing Standard M etropolitan Statistica l Areas.
Method of wage payment
T abulations by m eth o d o f wage paym ent relate to the num ber o f w orkers paid under the various tim e and in cen tive wage system s. Form al rate structures for tim e-rated w orkers provide single rates or a range o f rates for in d ividual job categories. In the absence o f a form al rate structure, pay rates are determ ined prim arily by the qualifica tion s o f the individual w orker. A single rate structure is one in w h ich the sam e rate is paid to all exp erienced w orkers in the sam e job c lassification . (L earners, apprentices, or p robationary w orkers m ay be paid according to rate schedu les w h ich start b e lo w the single rate and perm it the w orkers to achieve the fu ll job rate over a period o f tim e .) An exp erienced w orker o ccasion a lly m ay be paid above or b e lo w the single rate for special reasons, but such p aym en ts are ex cep tio n s . R ange-of-rate plans are those in w h ich the m in im um or m axim u m , or b o th o f these rates paid ex p erien ced w orkers for the sam e job are sp ecified . S p ecific rates o f individual w orkers w ith in the range m ay be d eterm ined b y m erit, len gth o f service, or a com b in ation o f th ese . Incentive w orkers are classified under p iecew ork or b onus plans. P iecew ork is w ork for w h ich a predeterm ined rate is paid for each unit o f o u tp u t. P rod u ction b onuses are based on p rod u ction over a q u ota or for co m p letio n o f a task in less than standard tim e.
Labor-management agreements
Separate wage data are presen ted , where p oss ib le , for estab lishm ents w ith (1 ) a m ajority o f the p rod u ction w ork ers covered by labor-m anagem ent con tracts, or (2 ) non e or a m in ority o f the p rod u ction w orkers covered by labor- m anagem ent contracts.
Scheduled weekly hours
D ata on w eek ly hours refers to the predom inant w ork schedule for fu ll-tim e p rod u ction w orkers em p lo y ed on the
day sh ift.
Table A-1. Estimated number of establishments and employees within scope of survey and number studied, fabricated structural steel industry, November 1974
Region]/ and area2/
Number of establishments3/
Workers in establishments
Within scope of studyActuallystudied
Within scope of
study
Actuallystudied Total4/ Production
workersTotal
United States................... 987 332 90,558 63,741 52,709
New England......... ................ 35 18 2,626 1,753 2,137Middle Atlantic..................... 219 67 19,406 13,207 11,103
New York-Northeastern New Jersey 86 25 3,458 2,068 1 ,464Border States........................ 52 18 5,882 4,025 3,369Southeast............................. 152 39 12,459 9,264 4,963
Birmingham.................... .... 10 4 1,057 896 847Southwest............. ............... 151 49 15,156 11,327 9,274
Houston......... .................. 19 10 1,863 1,309 1,627Great lakes..................... 174 64 18,430 12,716 11,362
Chicago............... ............ 22 11 1,891 1,420 1,442Cleveland.......................... 11 7 1,026 689 750Detroit.................. 18 9 1,832 1,336 1,571
Middle Vest........................ . 63 26 6,357 4,709 4,303Mountain......... ................... 46 21 3,404 2, 520 2 ,1 4 1Pacific............................... 95 30 6,838 4, 220 4,057
Los Angeles-Long Beach........... 23 11 2,080 1,285 1,517
1 The regions used in this study include New England—Connecticut, Maine, Massachusetts, New Hampshire, Rhode Island, and Vermont; Middle Atlantic—New Jersey, New York, and Pennsylvania; Border States-Delaware, District of Columbia, Kentucky, Maryland, Virginia, and West Virginia; Southeast—Alabama, Florida, Georgia, Mississippi, North Carolina, South Carolina, and Tennessee; Southwest—Arkansas, Louisiana, Oklahoma, and Texas; Great Lakes— Illinois, Indiana, Michigan, Minnesota, Ohio, and Wisconsin; Middle West— Iowa, Kansas, Missouri, Nebraska, North Dakota, and South Dakota; Mountain—Arizona, Colorado, Idaho, Montana, New Mexico, Utah, and Wyoming; and Pacific—California, Nevada, Oregon, and Washington. Alaska and Hawaii were not included in the study.
2 See individual area tables 7-11 for definitions of selected areas.3 Includes only those establishments with 20 workers or more at the time of reference of the universe data.4 Includes executive, professional, and other workers excluded from the production workers cateaorv shown senaratelv.
37Digitized for FRASER http://fraser.stlouisfed.org/ Federal Reserve Bank of St. Louis

Shift provisions and practices
S h ift provisions relate to the p o lic ies o f estab lishm ents either currently operating late sh ifts or having form al prov isions covering la te-sh ift w ork . S h ift practices relate to w orkers em p lo y ed on late sh ifts at the tim e o f the survey.
Supplementary wage provisions
S upplem entary b en efits in an estab lish m en t w ere c o n sidered applicable to all p rod u ction w orkers i f th ey applied to h a lf or m ore o f such w orkers in an estab lish m en t. S im ilarly , i f few er than h a lf o f the w orkers were covered , the b en efit w as considered n o n ex is ten t in th e estab lish m en t. B ecause o f length-of-service and oth er e lig ib ility requirem en ts, th e p rop ortion o f w orkers receiving the b en efits m ay be sm aller than estim ated .
Paid holidays. Paid h o lid a y provisions relate to fu ll-day
and half-day h o lid ays provided annually .
Paid vacations. T he sum m aries o f vacation plans are lim ited to form al arrangem ents and ex c lu d e in form al plans w h ereb y tim e o f f w ith pay is granted at th e d iscretion o f the em p lo y er or supervisor. P aym en ts n o t on a tim e basis w ere con verted ; for ex a m p le , a p aym en t o f 2 percent o f annual earnings w as considered the equ iva len t o f 1 w e e k ’s pay. The periods o f service for w h ich data are presented represent th e m o st co m m o n p ractices, b u t th e y d o n o t n ecessarily reflect ind iv idual estab lish m en t provisions for p rogression . F or ex a m p le , changes in p rop ortion s in d ica ted at 10
years o f service m ay in clu d e changes w h ich occu rred b e tw een 5 and 10 years.
Health, insurance, and retirement plans. D ata are presen ted for h ea lth , insurance, p en sio n , and retirem ent severance p aym en t plans for w h ich the em p lo y er pays all or a part o f the cost exc lu d in g program s required b y law , such as w orkers’ co m p en sa tio n and socia l secu rity . A m ong the plans inclu d ed are th ose underw ritten b y a com m ercial insurance com p an y and th o se paid d irectly b y the e m p loyer from operating funds or from a fund set aside for this purpose.
D eath b en efits are included as a form o f life insurance. Sickness and accid en t insurance is lim ited to that ty p e o f insurance under w h ich predeterm ined cash paym en ts are m ade d irectly to the insured on a w eek ly or m o n th ly basis during illness or accid en t d isab ility . In form ation is presented for all such plans to w h ich the em p loyer c o n tributes at least a part o f the co st . H ow ever, in N ew Y ork and N ew Jersey , w here tem porary d isab ility insurance law s
require em p lo y er co n tr ib u tio n s ,1 plans are inclu d ed o n ly i f the em p loyer (1 ) co n tr ib u tes m ore than is legally required, or (2 ) provides the em p lo y ee w ith b en efits w h ich ex ceed the requirem ents o f the law .
2The temporary disability insurance laws in California and Rhode Island do not require employer contributions.
T abulations o f paid sick-leave plans are lim ited to form al plans w h ich provide fu ll pay or a prop ortion o f the w o rk er’s pay during absence from w ork because o f illness; in form al arrangem ents have b een o m itted . Separate tab u la tion s are provided for (1 ) plans w h ich provide fu ll pay and n o w aiting p eriod , and (2 ) p lans providing either partial pay or a w aiting period .
L ong-term d isab ility insurance p lans provide paym en ts to to ta lly d isabled em p lo y ees u p on the exp ira tion o f their paid sick leave an d /or sickness and a ccid en t insurance, or after a predeterm ined period o f d isab ility . P aym ents are m ade u n til th e end o f the d isab ility , a m axim u m age, or e lig ib ility for retirem ent b en efits . Full or partial p aym en ts are a lm ost alw ays reduced b y socia l secu rity , w orkers’ disab ility co m p en sa tio n , and private p en sion b en efits payable to the d isab led e m p lo y ee .
M edical insurance refers to p lans providing for co m p lete or partial p aym en t o f d o c to r s’ fees . Such plans m ay be underw ritten b y a com m ercia l insurance com p an y or a n o n p ro fit organ iza tion , or th ey m ay be a form o f self- insurance.
Major m ed ica l insurance, so m etim es referred to as e x tended m ed ical insurance, in clu d es plans designed to cover em p lo y ees for sickness or injury involving an exp en se w h ich ex ceed s the norm al coverage o f h o sp ita liza tio n , m ed ica l, and surgical plans.
D ental insurance plans provide norm al dental service b en efits , u sually for fillings, ex tra ctio n s , and X -rays. Plans w hich provide b en efits o n ly for oral surgery or repairing accident dam age are ex c lu d ed .
V isual care insurance plans provide norm al visual care b en efits , usually for ey e exa m in a tio n s an d /or eyeg lasses. Plans w h ich provide for certain k inds o f surgery or care required as a result o f an accident are ex c lu d ed .
T abu lations o f retirem ent pen sion s are lim ited to plans w hich provide regular p aym en ts for the rem ainder o f the retiree’s life . D ata are presen ted separately for retirem ent severance p aym en ts (o n e p aym en t or several over a sp ec ified period o f tim e) m ade to em p lo y ees on retirem ent. E stab lishm ents provid ing b o th retirem ent severance p a y m en ts and retirem ent p en sion s to em p lo y ees w ere co n sid ered as having b o th retirem ent pen sion s and retirem ent severance plans; h ow ever , estab lish m en ts having o p tio n a l plans providing em p lo y ees a ch o ice o f either retirem ent severance p aym en ts or pen sion s w ere considered as having o n ly retirem ent pen sion b en efits .
Cost-of-living adjustments. P rovisions for cost-of-liv ing adjustm ents relate to form al plans w h ereb y wage rates are changed p eriod ica lly in keep ing w ith changes in the C onsum er Price In d ex or on som e o th er basis. U nless period ic ad justm ents w ere currently provided for , e sta b lish m en ts were considered as n o t having provisions for cost-of-liv ing ad justm ents, even th ou gh adjustm ents that accrued earlier—b u t w ere n o t incorporated in basic wage rates—co n tin u ed to b e paid as a supp lem ent to such rates.
38Digitized for FRASER http://fraser.stlouisfed.org/ Federal Reserve Bank of St. Louis

Paid funeral and jury-duty leave. D ata for paid funeral and ju ry-d u ty leave relate to form al plans w h ich provide at least partial p aym en t for tim e lo s t as a result o f attend ing funerals o f sp ec ified fam ily m em bers or serving as a juror.
Supplemental unemployment benefits. D ata relate to
form al plans designed to supp lem ent b en efits paid under State u n em p lo y m en t system s.
Technological severance pay. D ata relate to form al provisions for severance pay to em p lo y ees p erm anently separated from the com p an y because o f a tech n o lo g ica l change or p lant closing .
39Digitized for FRASER http://fraser.stlouisfed.org/ Federal Reserve Bank of St. Louis

Appendix B. Occupational Descriptions
The prim ary purpose o f preparing job d escrip tions for th e B ureau’s wage surveys is to assist its field s ta ff in c lassify ing in to appropriate o ccu p a tio n s w orkers w h o are em p lo y ed under a variety o f payroll title s and d ifferen t w ork arrangem ents from estab lish m en t to estab lish m en t and from area to area. This perm its the grouping o f occu p a tio n a l wage rates representing com parable job c o n ten t . Because o f th is em phasis on in terestab lish m en t and interarea com p arab ility o f o ccu p a tio n a l co n ten t , the B ureau’s jo b d escrip tions m ay d iffer sign ifican tly from th o se in use in ind ividual e sta b lish m en ts or th ose prepared for o th er purposes. In applying th ese job d escrip tion s, the B ureau’s field s ta ff is in stru cted to ex c lu d e w orking supervisors, apprentices, learners, beginners, trainees, and h an d icap p ed , part-tim e, tem porary , and probationary w orkers.
Plant Occupations
Bucker-up, pneumatic
(Holder-on; rivet bucker)
A ssists p n eu m atic riveter in driving rivets to fasten t o gether steel p lates or structural steel p osts b y pressing a heavy steel bar (d o lly ) against head o f rivet w h ile the riveter u p sets rivet and clinches it from o p p o site side by ham m ering the shank d o w n . M ay rem ove b o lts tem porarily ho ld in g steel m em bers togeth er as riveting progresses. M ay insert rivets in p o sitio n .
Carpenter, maintenance
Perform s the carpentry d u ties necessary to con stru ct and m aintain in g o o d repair bu ild ing w o o d w o rk and eq u ip m ent such as b ins, cribs, cou n ters , b en ch es, partitions, d oors, flo o rs, stairs, casings, and trim m ade o f w o o d in an estab lish m en t. W ork involves most o f the following: P lanning and laying o u t o f w ork from b lu ep rin ts, draw ings, m o d els , or verbal in stru ction s; using a variety o f carpenter’s h a n d to o ls , portab le pow er to o ls , and standard m easuring in strum ents; m aking standard shop co m p u ta tio n s relating to d im en sion s o f w ork; se lecting m aterials necessary for the w ork . In general, the w ork o f th e m ain tenance carpenter requires rounded training and exp erience usually acquired through a form al apprenticesh ip or equivalent
training and exp erien ce .
Crane operator, electric bridge
(Overhead-crane operator; traveling-crane operator)
L ifts and m oves heavy ob jects w ith an e lectrica lly
p ow ered h o is t m o u n ted u p on a m etal bridge, w h ich runs
along overhead rails. W ork involves c losing sw itch to turn on e lec tr ic ity ; m oving electrica l con tro llers levers and brake pedal to run the crane bridge a long overhead rails, to run the h o istin g tro lley back and forth across the bridge, and to raise and low er the load line and an yth in g attached to it . (M otion s o f crane are usually carried o u t in response to signals from o th er w orkers, on the grou n d .)
F or wage stu d y purposes, crane operators are classified b y size o f crane, as fo llo w s:
Crane operator (co m b in a tio n o f sizes listed separately)
Crane operator, e lectric bridge (under 2 0 to n s)
Crane op erator, e lectric bridge (2 0 to n s and over)
Crane operator, mobile
O perates gasoline- or d iesel-pow ered crane m o u n ted on specia lly co n stru cted truck chassis to lift and m ove m aterials such as steel s to ck or sub-assem blies. W ork usually in volves b o th driving veh icle to and from w orksite and operating crane. M ay, w h en app licab le , supervise the
activ ities o f a person engaged in driving crane and p lacing b lock s and out-riggers to prevent capsizing w hen liftin g heavy loads. Exclude mobile crane operators employed at construction sites.
Electrician, maintenance
P erform s a variety o f electrica l trade fu n ctio n s such as the in sta lla tion , m a in ten a n ce , or repair o f eq u ip m en t for the generating, d istr ib u tio n , or u tiliza tio n o f e lectric
energy in an estab lish m en t. W ork involves most o f the
40Digitized for FRASER http://fraser.stlouisfed.org/ Federal Reserve Bank of St. Louis
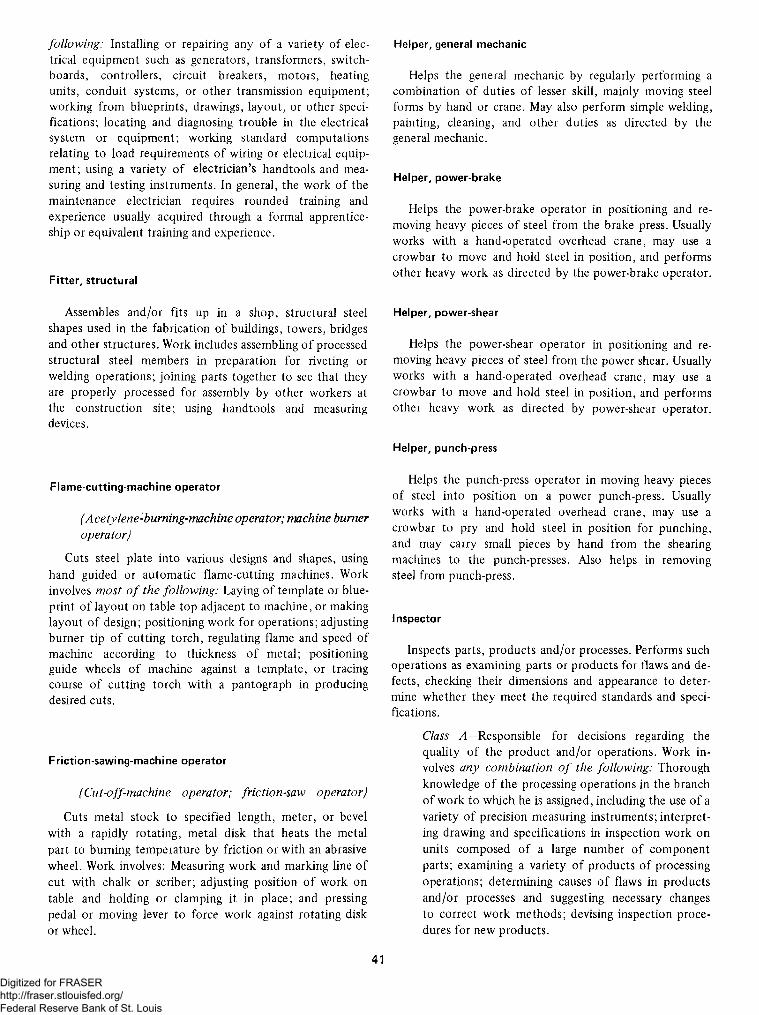
following: Installing or repairing any o f a variety o f e le c trical eq u ip m en t such as generators, transform ers, sw itch boards, co n tro llers , circuit breakers, m o to rs, heating u n its, co n d u it system s, or o th er transm ission equ ip m en t; w orking from b lueprin ts, draw ings, la y o u t, or o th er sp ecifica tion s; loca tin g and diagnosing troub le in the e lectrical system or eq u ip m en t; w ork ing standard co m p u ta tio n s relating to load requirem ents o f w iring or electrica l eq u ip m en t; using a variety o f e lec tr ic ian ’s h a n d to o ls and m easuring and testin g in strum ents. In general, the w ork o f the m aintenance electric ian requires rounded training and exp erience usually acquired through a form al app ren ticeship or equ iva len t training and exp erien ce .
Fitter, structural
A ssem bles and /or fits up in a sh o p , structural steel shapes used in the fabrication o f b u ild ings, tow ers, bridges and oth er structures. W ork includes assem bling o f processed structural steel m em bers in preparation for riveting or w eld ing operations; jo in in g parts togeth er to see that th ey are properly processed for assem bly b y oth er w orkers at the co n stru ctio n site; using h a n d to o ls and m easuring devices.
Flame-cutting-machine operator
(Acetylene-burning-machine operator; machine burner operator)
C uts stee l plate in to various designs and shapes, using hand guided or au tom atic flam e-cu ttin g m ach ines. W ork involves most o f the following: L aying o f tem p late or b lu eprint o f la y o u t on table to p adjacent to m ach in e, or m aking la y o u t o f design; p ositio n in g w ork for operations; adjusting burner tip o f cu ttin g to rch , regulating flam e and speed o f m achine according to th ick n ess o f m etal; p osition in g guide w h eels o f m achine against a tem p la te , or tracing course o f cu ttin g torch w ith a pantograph in producing desired cu ts.
Friction-sawing-machine operator
(Cut-off-machine operator; friction-saw operator)
Cuts m eta l sto ck to sp ecified len g th , m eter, or bevel w ith a rapidly rotating , m eta l disk th at h eats the m eta l part to burning tem perature b y fr iction or w ith an abrasive w h eel. W ork involves: M easuring w ork and m arking line o f
cut w ith chalk or scriber; adjusting p o sitio n o f w ork on table and hold in g or clam ping it in place; and pressing pedal or m oving lever to force w ork against rotating disk or w h eel.
Helper, general mechanic
H elps the general m echan ic b y regularly perform ing a co m b in a tio n o f du ties o f lesser sk ill, m ain ly m oving steel form s by hand or crane. M ay also perform sim ple w eld ing , painting, clean ing, and oth er d u ties as d irected b y the general m ech an ic .
Helper, power-brake
H elps the pow er-brake operator in p ositio n in g and rem oving heavy p ieces o f stee l from the brake press. U sually w orks w ith a hand-operated overhead crane, m ay use a crow bar to m ove and h o ld steel in p o sitio n , and perform s other heavy w ork as d irected b y the pow er-brake operator.
Helper, power-shear
H elps the pow er-shear operator in p osition in g and rem oving heavy p ieces o f stee l from the p ow er shear. U sually w orks w ith a hand-operated overhead crane, m ay use a crow bar to m ove and h o ld steel in p o sitio n , and perform s other heavy w ork as d irected b y pow er-shear operator.
Helper, punch-press
H elps the punch-press operator in m oving heavy p ieces o f steel in to p o sitio n on a pow er punch-press. U sually w orks w ith a hand-operated overhead crane, m ay use a crow bar to pry and h o ld stee l in p o sitio n for p unch ing , and m ay carry sm all p ieces b y hand from the shearing m achines to the punch-presses. A lso helps in rem oving steel from punch-press.
Inspector
Inspects parts, prod u cts a n d /or processes. Perform s such operations as exam in ing parts or p rod u cts for flaw s and d e fec ts , check ing their d im ensions and appearance to d eterm ine w h eth er th e y m eet the required standards and sp ecification s.
Class A — R esponsib le for d ec is ion s regarding the q u ality o f the p roduct an d /or o p eration s. W ork in volves any combination o f the following: T horough
k n ow led ge o f the processing op eration s in the branch o f w ork to w h ich he is assigned , includ ing the use o f a variety o f precision m easuring instrum ents; in terp reting drawing and sp ecifica tion s in in sp ectio n w ork on
units co m p o sed o f a large num ber o f co m p o n en t parts; exam in in g a variety o f products o f processing operations; d eterm in ing causes o f flaw s in p roducts an d /or processes and suggesting necessary changes to correct w ork m eth o d s; devising in sp ectio n p ro cedures for new p roducts.
41
Digitized for FRASER http://fraser.stlouisfed.org/ Federal Reserve Bank of St. Louis
Class B—Work involves any combination o f the following: K now ledge o f processing op eration s in the branch o f w ork to w h ich he is assigned , lim ited to fam iliar p roducts and processes or w here p erform ance is d ep en d en t on past exp erien ce; perform ing in sp ectio n op eration s o n p rod u cts an d /or processes having rigid sp ec ifica tio n s, bu t w here the in sp ectio n procedures involve a sequence o f in sp ectio n operatio n s, includ ing d ec ision s regarding proper fit or perform ance o f som e parts; using p recision m easuring instrum ents.
Class C—Work involves any combination o f the following: S h o rt-cy cle , repetitive in sp ectio n operation s; using a standardized , special-purpose m easuring in stru m en t rep etitive ly ; visual exam in ation o f parts or p rod u cts , rejecting u n its having ob v iou s d eform ities or flaw s.
Janitor
(Sweeper; porter; cleaner)
Cleans and k eep s in an orderly co n d itio n fa cto ry w o rk ing areas and w ash room s, or prem ises o f an o ff ic e , apartm en t h o u se , or com m ercia l or o th er estab lish m en t. D u ties involve a combination o f the following: S w eep in g , m opping or scrubbing, and polish ing floors; rem oving ch ip s, trash, and o th er refuse; dusting eq u ip m en t, furn iture, or fix tures; polish ing m eta l fix tu res or trim m ings; providing supplies and m inor m ain tenance services; cleaning lavatories, sh o w ers, and restroom s. W orkers w h o specia lize in w in d o w w ashing are ex c lu d ed .
Lay-out man, structural steel
(Lay-out, structural steel)
W orks from in stru ction s, b lu ep rin ts, and w ork orders, and lays o u t sp ec ifica tio n s for fabrication o f structural stee l. W ork involves: L ocating h o le s , cu ts , edges, bend lin es, e tc ., in accordance w ith details o f drawing; m easuring and m arking o f f required len gth s o f steel; cen ter p u n ch ing h o le s , cu ts , and edges; and m arking con tract sh eet, and piece num bers on stee l. M ust be fam iliar w ith shop practices and sy m b o ls and m ust com p u te bevels. A m on g the to o ls and eq u ip m en t used are: Square, tape lin e , soap sto n e , cen ter p u n ch , hand ham m er, scriber, and various
gauging devices.
Machinist, maintenance.
P roduces rep lacem ent parts and n ew parts in m aking repairs o f m eta l parts o f m echan ica l eq u ip m en t operated in an estab lish m en t. W ork involves most o f the following:
Interpreting w ritten in stru ction s and sp ecifica tion s; p lan ning and laying o u t o f w ork; using a variety o f m a ch in ist’s h a n d to o ls and p recision m easuring instrum ents; settin g up and operating standard m achine to o ls; shaping o f m eta l parts to c lose to lerances; m aking standard shop co m p u ta tio n s relating to d im en sion s o f w ork , to o lin g , feed s and speeds o f m achining; k n ow led ge o f the w orking properties o f the co m m o n m etals; se lecting standard m aterials, parts, and eq u ip m en t required for h is w ork; fittin g and assem bling parts in to m echan ica l eq u ip m en t. In general, the m a ch in ist’s w ork norm ally requires a rounded training in m achine-shop practice usually acquired through a form al apprenticesh ip or equ ivalen t train ing and exp erience .
Marker
Marks o u tlin es o f tem p la tes on structural steel to loca te h o les and cu ts . W ork involves: C lam ping tem p late to steel and cen ter p unch ing h o les through te m p la te ; loca tin g som e h o les b y m eans o f sim ple gauges or m easuring tape; and m arking co n tra ct, sh eet, and p iece num bers o n stee l for id en tifica tio n .
Mechanic, general (production)
R egularly perform s a co m b in a tio n o f sk illed hand and /or m achine op eration s, such as w eld in g , riveting, pa in ting , fittin g , cu ttin g , and m arking, o n structural stee l form s, rather than specia lizing in any o n e o p eration . W orkers in this c lassifica tion are usually fo u n d w here sp ecia lization o f operations is im practical and it is, th u s , n o t possib le to classify w orkers according to m ore sp ecific du ties.
Painter, rough
A pplies p a in t, varnish, lacquer, or o th er fin ishes to surfaces o f m anufactured p ro d u cts , for p rotective purposes prim arily, w ith brush or spray gun . W ork is repetitive in character, requiring no se lec tio n o f co lor schem es or shading and m atch ing o f co lo rs , and the fin ishes are either standard in character or prepared b y others.
For wage study pu rp oses, rough painters are classified as
fo llow s:
Painters, rough , brush
Painters, rough, spray
Planer operator, edge or rotary
S ets up and operates a planer to square, b ev el, or fin ish edges to sp ecified w id th and len g th , eith er singly or in stacks o f several p ieces. W ork involves: S ettin g up m achine b y adjusting sto p gu ides and inserting cu ttin g to o ls; p o sition in g steel in th e bed o f the m achine w ith the aid o f
42
Digitized for FRASER http://fraser.stlouisfed.org/ Federal Reserve Bank of St. Louis

helpers; p lacing cu tter head in p o sitio n for required p rocessing; con tro llin g op eration o f m achine; and d irecting the w ork o f one or m ore helpers. M ay also m easure and mark the len gth o f steel for shearing after proper w id th has been a tta ined .
Power-brake operator, structural steel
(Brake press operator; bender-brake press operator)
Sets up and operates a brake press to bend and cope structural stee l. W ork involves: S e lectin g , inserting, and adjusting the required dies; lay ing o u t bend lin es, or settin g stop gauges to p o sitio n b en d s, or w orking to b end lines laid o u t b y others; p ositio n in g m aterial in d ies and settin g depth o f stroke for ram; activating m achine to b en d , c o p e , or crim p m aterial; m an ipulating m aterial in d ies as required; check ing shape o f m aterials being form ed to tem p lates; and grinding or filing edges o f stee l at bon d lines to prevent cracking.
Power-shear operator
O perates on e or m ore ty p es o f pow er shears to cu t m eta l sh eets, p la tes, bars, rods and o th er m eta l shapes to size or len gth . W ork involves most o f the following: Setting-up and operating pow er-shear eq u ip m en t, settin g stop gauges, aligning m aterial and perform ing shearing op eration s on m achine; shearing large or h eavy m aterial to la y o u t or sp ecified d im ensions; perform ing shearing op eration s in volving angular or o th er d ifficu lt cu ts .
Punch-press operator, structural steel
S ets up and operates a p unch press to punch h o les in structural steel to prepare th e m aterials for riveting. S elects the p u n ch , according to the size o f h o le to be punched and fastens it in place in th e head o f the m achine; p laces m aterial on the bed o f the m achine so th at the cen ter-punch hole is d irectly under the p o in t o n the punch; and operates the m achine to p unch the required h o les .
Class A —Work involves: D iff icu lt p osition in g o f w ork units because o f size or shape, or ty p e o f o p eration to be perform ed; processing unusually large w ork th at is p o sitio n ed in the press w ith the aid o f helpers; p rocessing w ork un its that m ust be stead ied w hile op eration s are being perform ed; perform ing op eration s requiring careful p ositio n in g o f w ork and prom pt recogn ition o f fa u lty op eration ; exam in ing o u tp u t
and m aking adjustm ents as necessary to m aintain p rod u ction w ith in standards; settin g , aligning, and adjusting the press.
Class R equired m ain ly to feed , co n tro l and ex a m ine o p eration o f the press, and w h en troub le occurs to call on forem an or leadm an to correct th e situ atio n . W ork involves: T he perform ance o f single op eration s, such as p u n ch in g , or piercing o n sm all or m ed ium -size sto ck easily p o sitio n ed or perform ing repetitive and sim ple punch ing on larger sto ck requiring the assistance o f helpers.
Riveter, pneumatic
(Hammer riveter)
R ivets to g eth er m eta l parts, stee l p late and shapes w ith a p neum atic ham m er. W ork involves most o f the following: W orking from la y o u t on a variety o f w ork; using over a period o f tim e a variety o f ty p es and size o f riveting ham m ers; se lecting ham m er, d ies, rivets for assigned w ork and inserting die in head o f ham m er th at corresponds w ith size o f rivet; w ork on pressure vessels required to be liquid or steam tight; k n ow led ge o f riveting tem peratures and stan d ard m easurem ent practices.
Stock clerk
R eceives, stores, and issues eq u ip m en t, m aterial, m erchandise or to o ls in a sto ck ro o m or storeroom . W ork involves a combination o f the following: C hecking in co m ing orders; storing supplies; applying id en tifica tio n s to articles; issu ing supplies; taking p eriod ic in ven tory or keep ing perpetual in ven tory; m aking up necessary reports; requesting or ordering supplies w hen n eed ed . Stockroom Laborers, Tool Crib Attendants, and employees who supervise Stock Clerks and Laborers are excluded.
Template maker
M akes fu ll-sized w o o d , cardboard, or sheet-m eta l tem plates from b lueprin ts or m o d els for use in laying o u t or m arking rivet h o le s , cu ts , and bends on structural steel. L ocates h o le s , cu ts , and bevels , applying m athem atica l and other tec h n o lo g y , and m arks their lo c a tio n , using such la y o u t to o ls as squares, dividers, and scales. A lso uses pow er saw s, jo in ters, trim m ers, hand saw s, and planes.
Truckdriver
Drives a truck w ith in a c ity or industrial area to transport m aterials, m erchand ise, eq u ip m en t, or m en b etw een various ty p es o f estab lish m en ts such as: M anufacturing plants, freight d ep o ts , w areh ou ses, w h olesa le and retail estab lish m en ts, or b etw een retail estab lish m en ts and cu sto m ers’ h o u ses or p laces o f business. M ay also load or
43Digitized for FRASER http://fraser.stlouisfed.org/ Federal Reserve Bank of St. Louis

unload truck w ith or w ith o u t h elpers, m ake m inor m ech an ical repairs, and keep truck in g o o d w orking order. Driver- salesmen and over-the-road drivers are excluded.
For wage stu d y purposes, truckdrivers are classified b y size and ty p e o f eq u ip m en t, as fo llo w s: (Tractor-trailer should be rated on the basis o f trailer ca p a city .)
Truckdriver (co m b in a tio n o f sizes listed separately)
T ruckdriver, light (under IV2 to n s)
T ruckdriver, m ed iu m (IV2 to and including 4 to n s)
Truckdriver, heavy (over 4 to n s , trailer ty p e )
T ruckdriver, heavy (over 4 to n s , o th er than trailer ty p e )
Trucker, power
O perates a m anually co n tro lled gasoline- or electric- pow ered truck or tractor to transport good s and m aterials o f all k inds about a w areh ou se, m anufacturing p lant, or oth er estab lish m en t.
For wage stu d y purposes, w orkers are classified b y ty p e o f truck as fo llo w s:
T rucker, p ow er (fo rk lif t)
T rucker, pow er (o th er than fo rk lift)
Watchman
M akes rounds o f prem ises period ica lly in p rotectin g property against fire, th e ft , and illegal en try .
Welder, hand
(Manual welder)
F uses (w e ld s) m eta l ob jects togeth er b y m anually gu id ing a w eld in g torch or stick e lec tro d e in the fabrication o f m etal shapes and in repairing broken or cracked m eta l
^objects. In ad d ition to perform ing hand w eld in g or brazing o p era tio n , the w elder m ay also lay o u t guide lines or m arks on m eta l parts and m ay cu t m eta l w ith a cu ttin g to rch . W orkers ex c lu siv e ly engaged in tack w eld ing (ta ck w elders) are to be ex c lu d ed from th is c lassifica tion .
Class A —Work involves m aking w eld s in m eta l jo in ts placed in any p o s it io n , includ ing the overhead p o sitio n .
Class B —Work involves m aking w eld s in m eta l jo in ts placed o n ly in th e flat or h o rizon ta l p o sitio n .
Welder, machine (arc or gas)
( Welding machine operator)
O perates one ty p e or m ore o f arc or gas au tom atic w e ld ing m ach ines designed to w eld m eta l jo in ts w ith o u t m anual m an ip u lation o f th e w eld ing e lec trod e or to rch . W ork in volves: C lam ping w ork p ieces o n to m ach ine; p ositio n in g elec trod e or to rch over w eld line at sp ec ified a n g le; th read ing filler w ire from reel through feed rolls; filling hop p er w ith flu x ; turning co n tro l k n o b s to syn ch ron ize m ovem en t o f e lec tro d e or torch and feed o f filler w ire, and flu x w ith speed o f w eld ing action ; settin g lim it sw itch w h ich a u to m atica lly stop s m achine at end o f w eld ; starting m achine and observing w eld in g a c tio n . W orkers m ay be designated according to the ty p e o f eq u ip m en t u sed , such as gas- sh ielded arc w eld in g m ach ine op erator, subm erged arc w eld ing m achine operator, or gas w eld in g m ach ine operator.
Welder, machine (resistance)
(B utt welder; flash welder; seam welder; spot welder)
O perates on e ty p e or m ore o f resistance welding apparatus to w eld (b o n d ) togeth er m eta l ob jects such as bars, p ipes, and p lates. R esistance w eld in g is a process w herein an e lec tr ic current is passed through the parts to be w eld ed at the p o in t o f co n ta c t , and m echanical pressure is applied forcing the co n ta c t surfaces togeth er at the p o in ts to be jo in ed . W elding m ach ines are generally designated according to ty p e o f w eld perform ed and arrangem ent o f w eld in g surfaces o f parts to be jo in ed . W elds m ay be m ade o n overlapping u n its in the form o f on e or m ore sp ots (sp o t w eld in g) or lin ea lly b y using a rolling elec trod e (seam w eld in g). M achine w eld ing o f u n its w here the edges are brought to g eth er w ith o u t lapping is referred to as b u tt w eld ing .
Welder, tack
M anually m akes tem porary w elds along m eta l jo in ts to h o ld parts in proper alignm ent for final w eld in g .
44
Digitized for FRASER http://fraser.stlouisfed.org/ Federal Reserve Bank of St. Louis
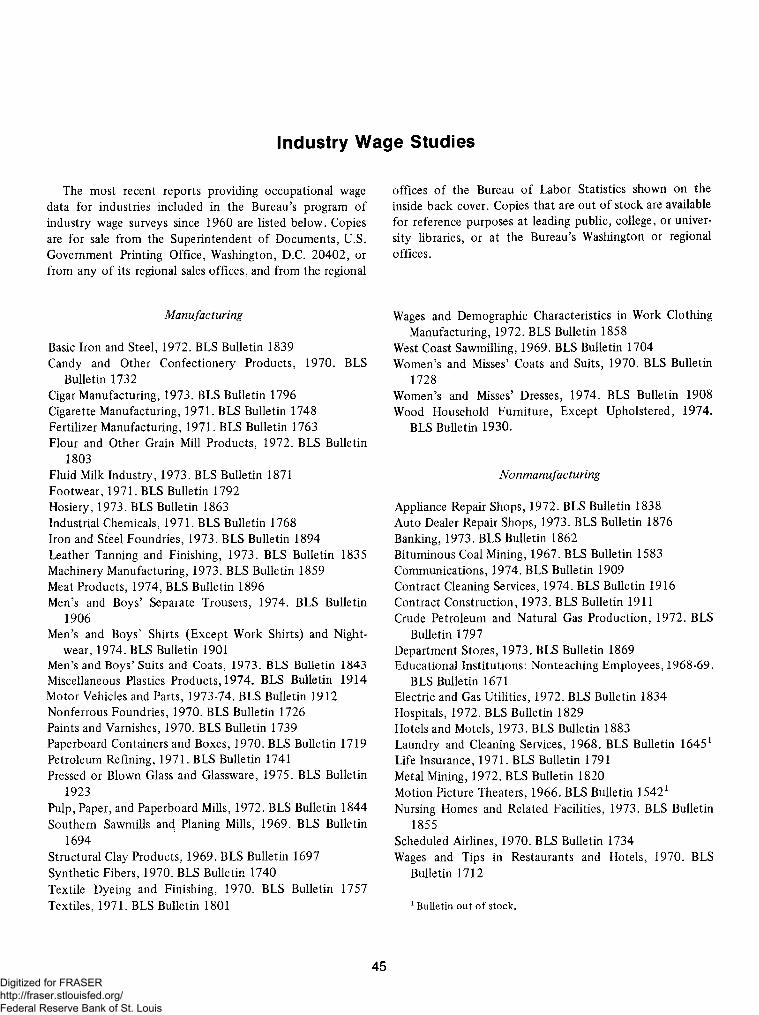
Industry Wage Studies
The m ost recent reports providing occu p a tio n a l wage data for industries in clu d ed in the B ureau’s program o f industry wage surveys since 1 9 6 0 are listed b e lo w . C opies are for sale from the Su p erin ten d en t o f D o cu m en ts, U .S . G overnm ent Printing O ffice , W ashington, D .C . 2 0 4 0 2 , or from any o f its regional sales o ff ic e s , and from the regional
Manufacturing
Basic Iron and S tee l, 1 9 7 2 . BLS B u lletin 183 9 C andy and O ther C o n fectio n ery P rod u cts, 1 9 7 0 . BLS
B ulletin 1 7 3 2Cigar M anufacturing, 1 9 7 3 . BLS B u lletin 179 6 C igarette M anufacturing, 1 9 7 1 . BLS B ulletin 1 7 4 8 F ertilizer M anufacturing, 1 9 7 1 . BLS B ulletin 1763 Flour and O ther Grain Mill P roducts, 1 9 7 2 . BLS B ulletin
1803F luid M ilk Industry , 1 9 7 3 . BLS B u lletin 1871 F oo tw ea r , 1 9 7 1 . BLS B ulletin 1 7 9 2 H osiery, 1 9 7 3 . BLS B ulletin 1863 Industrial C hem icals, 1 9 7 1 . BLS B u lletin 17 6 8 Iron and S teel F ou n d ries, 1 9 7 3 . BLS B u lletin 1 8 9 4 L eather T anning and F in ish ing, 1 9 7 3 . B LS B ulletin 183 5 M achinery M anufacturing, 1 9 7 3 . B LS B u lletin 1859 M eat P roducts, 1 9 7 4 , BLS B u lletin 1 8 9 6 M en’s and B o y s’ Separate T rousers, 1 9 7 4 . BLS B ulletin
1 9 0 6M en’s and B o y s ’ Shirts (E x cep t W ork Shirts) and N ig h t
w ear, 1 9 7 4 . BLS B u lletin 1901 M en’s and B o y s ’ Su its and C oats, 1 9 7 3 . BLS B ulletin 18 4 3 M iscellaneous P lastics P rod u cts, 1 9 7 4 . B LS B u lletin 1 9 1 4 M otor V eh icles and Parts, 1 9 7 3 -7 4 . BLS B ulletin 1 9 1 2 N onferrous F ou n d ries, 1 9 7 0 . BLS B ulletin 17 2 6 Paints and V arnishes, 1 9 7 0 . BLS B u lletin 1 7 3 9 Paperboard C ontainers and B o x es , 1 9 7 0 . B LS B ulletin 17 1 9 P etroleum R efin in g , 1 9 7 1 . BLS B ulletin 1741 Pressed or B low n G lass and G lassw are, 1 9 7 5 . BLS B ulletin
1923Pulp , Paper, and Paperboard M ills, 1 9 7 2 . BLS B u lletin 1 8 4 4 Southern Saw m ills and Planing M ills, 1 9 6 9 . B LS B ulletin
1 6 9 4Structural Clay P rod u cts, 1 9 6 9 . B LS B ulletin 1 6 9 7
S y n th etic F ibers, 1 9 7 0 . BLS B u lletin 1 7 4 0 T extile D yein g and F in ish ing, 1 9 7 0 . B LS B u lletin 175 7
T ex tile s , 1 9 7 1 . BLS B u lletin 1801
o ffice s o f the Bureau o f Labor S tatistics sh ow n on the inside back cover. C opies th at are o u t o f sto ck are available for reference purposes at leading p u b lic , co lleg e , or university libraries, or at the B ureau’s W ashington or regional o ffice s .
Wages and D em ographic C haracteristics in W ork C loth ing M anufacturing, 1 9 7 2 . BLS B u lletin 185 8
W est C oast S aw m illing, 1 9 6 9 . BLS B ulletin 1 7 0 4 W om en ’s and M isses’ C oats and Su its, 1 9 7 0 . BLS B ulletin
1 7 2 8W om en ’s and- M isses’ D resses, 1 9 7 4 . BLS B u lletin 19 0 8 W ood H ou seh old Furniture, E x cep t U p h olstered , 1 9 7 4 .
BLS B ulletin 1 9 3 0 .
Nonmanufacturing
A ppliance Repair S h op s, 1 9 7 2 . BLS B ulletin 183 8 A u to D ealer R epair S h op s, 1 9 7 3 . BLS B u lletin 1876 B anking, 1 9 7 3 . B LS B u lletin 1 8 6 2 B itu m in ou s Coal M ining, 1 9 6 7 . BLS B ulletin 1583 C o m m u n ication s, 1 9 7 4 . BLS B u lletin 19 0 9 C ontract C leaning Services, 1 9 7 4 . B LS B ulletin 1 9 1 6 C ontract C on stru ction , 1 9 7 3 . BLS B u lletin 1911 Crude P etro leum and N atural Gas P ro d u ctio n , 1 9 7 2 . BLS
B ulletin 179 7D epartm ent S tores, 1 9 7 3 . BLS B ulletin 1869 E ducational In stitu tion s: N on teach in g E m p lo y ees , 1 9 6 8 -6 9 .
BLS B ulletin 1671E lectric and Gas U tilitie s , 1 9 7 2 . B LS B u lletin 1 8 3 4 H ospita ls, 1 9 7 2 . BLS B u lletin 1 8 2 9 H otels and M otels, 1 9 7 3 . BLS B u lletin 1883 L aundry and C leaning Services, 1 9 6 8 . BLS B u lletin 1 6 4 5 1 L ife Insurance, 1 9 7 1 . BLS B u lletin 1791 M etal M ining, 1 9 7 2 . BLS B u lletin 1 8 2 0 M otion P icture T heaters, 1 9 6 6 . B LS B u lletin 1 5 4 2 1 N ursing H om es and R elated F acilities, 1 9 7 3 . BLS B ulletin
1855Schedu led A irlines, 1 9 7 0 . BLS B ulletin 1 7 3 4 Wages and Tips in R estaurants and H o te ls , 1 9 7 0 . BLS
B ulletin 1 7 1 2
1 B u lle t in o u t o f s to c k .
45Digitized for FRASER http://fraser.stlouisfed.org/ Federal Reserve Bank of St. Louis
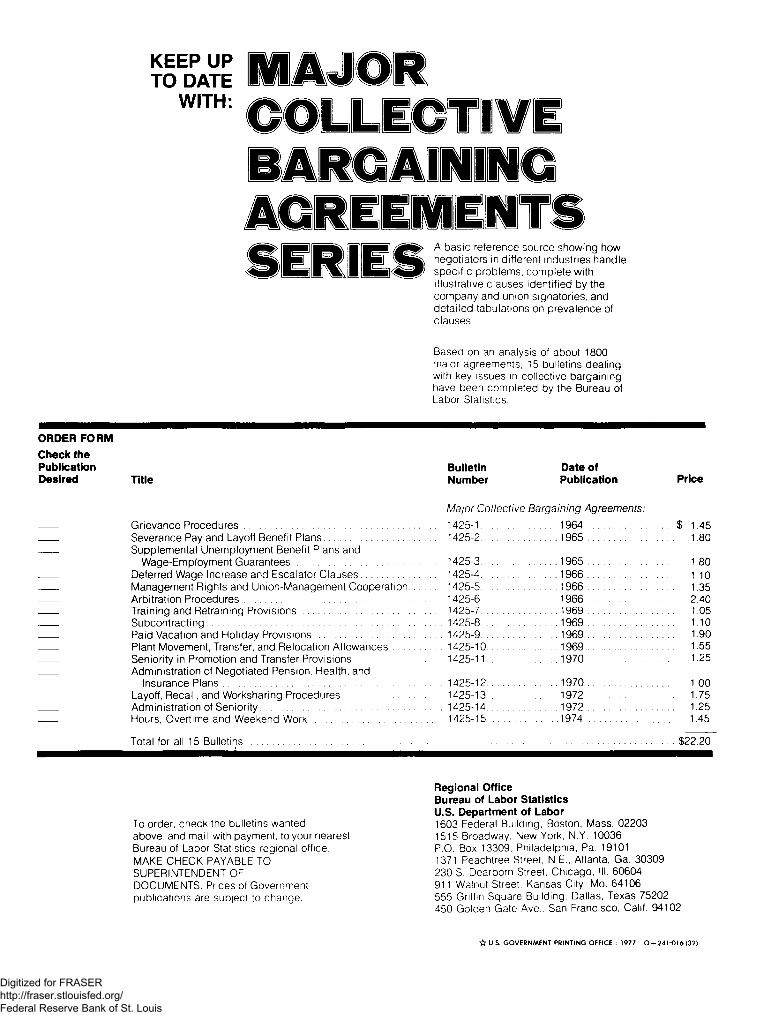
| A basic reference source showing hownegotiators in different industries handle
]< |B P specific problems, complete with illustrative clauses identified by the company and union signatories, and detailed tabulations on prevalence of clauses.
Based on an analysis of about 1800 major agreements, 15 bulletins dealing with key issues in collective bargaining have been completed by the Bureau of Labor Statistics.
ORDER FORM
Check thePublication Bulletin Date ofDesired Title Number Publication Price
Grievance Procedures........................................................Severance Pay and Layoff Benefit Plans.............................Supplemental Unemployment Benefit Plans and
Wage-Employment Guarantees........................................Deferred Wage Increase and Escalator Clauses................Management Rights and Union-Management CooperationArbitration Procedures........................................................Training and Retraining Provisions....................................Subcontracting.....................................................................Paid Vacation and Holiday Provisions...............................Plant Movement, Transfer, and Relocation Allowances . . .Seniority in Promotion and Transfer Provisions................Administration of Negotiated Pension, Health, and
Insurance Plans...............................................................Layoff, Recall, and Worksharing Procedures....................Administration of Seniority.................................................Hours, Overtime and Weekend Work ...............................
Major Collective Bargaining Agreements:1425-1............ ...........1964 .............................. $ 1.451425-2............ ...........1965 .............................. 1.80
1425-3............ ........... 1965 .............. ............ 1.801425-4............ ...........1966 .............................. 1.101425-5............ ...........1966 .............................. 1.351425-6........... ...........1966 .............................. 2.401425-7............ ...........1969 .............................. 1.051425-8............ ...........1969 .............................. 1.101425-9............ ...........1969 .............. .............. 1.901425-10........... ...........1969 .............. .............. 1.551425-11........... ........... 1970 ............. 1.25
1425-12........... ........... 1970 ............. 1.001425-13........... ........... 1972 .............. .............. 1.751425-14........... ........... 1972 .............. .............. 1.251425-15 ......... ...........1974 ............. ............. 1.45
Total for all 15 Bulletins ................................................................................................................................................$22.20
To order, check the bulletins wanted above, and mail with payment, to your nearest Bureau of Labor Statistics regional office. MAKE CHECK PAYABLE TO SUPERINTENDENT OF DOCUMENTS. Prices of Government publications are subject to change.
Regional Office Bureau of Labor Statistics U.S. Department of Labor1603 Federal Building, Boston, Mass. 02203 1515 Broadway, New York, N.Y. 10036 P.O. Box 13309, Philadelphia, Pa. 19101 1371 Peachtree Street, N.E., Atlanta, Ga. 30309 230 S. Dearborn Street. Chicago, III. 60604 911 Walnut Street, Kansas City, Mo. 64106 555 Griffin Square Building, Dallas, Texas 75202 450 Golden Gate Ave., San Francisco, Calif. 94102
☆ U.S. GOVERNMENT PRINTING OFFICE : 1977 0-241-016(32)
Digitized for FRASER http://fraser.stlouisfed.org/ Federal Reserve Bank of St. Louis

BUREAU OF LABOR STATISTICS REGIONAL OFFICES
Region I1603 JFK Federal Building Government Center Boston, Mass. 02203 Phone: (617)223-6761
Region IISuite 3400 1515 Broadway New York, N.Y. 10036 Phone: (212) 399-5405
Region III3535 Market Street P.O. Box 13309 Philadelphia, Pa. 19101 Phone: (215)596-1154
Region IV1371 Peachtree Street, NE. Atlanta, Ga. 30309 Phone: (404) 881-4418
Region V9th FloorFederal Office Building 230 S. Dearborn Street Chicago, III. 60604 Phone: (312)353-1880
Region VISecond Floor555 Griffin Square Building Dallas, Tex. 75202 Phone: (214)749-3516
Regions VII and V lir911 Walnut Street Kansas City, Mo. 64106 Phone: (816)374-2481
Regions IX and X**450 Golden Gate Avenue Box 36017San Francisco, Calif. 94102 Phone: (415)556-4678
Regions VII and VIII are serviced by Kansas City Regions IX and X are serviced by San FranciscoDigitized for FRASER
http://fraser.stlouisfed.org/ Federal Reserve Bank of St. Louis

U. S. Department of Labor Bureau of Labor Statistics Washington, D.C. 20212
Official Business Penalty for private use, $300
Postage and Fees Paid U.S, Department of Labor
Third Class Mail
Lab-441
Digitized for FRASER http://fraser.stlouisfed.org/ Federal Reserve Bank of St. Louis


