Blessing or Curse: The Stabilizing Role of Remittances ... · The authors gratefully acknowledged...
26
Blessing or Curse: The Stabilizing Role of Remittances, Foreign Aid and FDI to Pakistan Junaid Ahmed 1 Inmaculada Martínez-Zarzoso 2 Abstract Inflows of remittances to Pakistan are being increasingly viewed as a relatively attractive source of external finance, one that can help to foster development and manage economic shocks. Remittances have become a major source of revenue, surpassing the volume of FDI and official development assistance that the country receives. This study focuses primarily on the stability, cyclicality and stabilization impacts of migrant remittances to Pakistan. It is evident that foreign inflows exhibit different types of volatility; remittances are found to be a less volatile source of external finance than FDI and ODA that are counter-cyclical and stabilizing, thus serving to steady the recipient economy in times of economic downturns. ODA appears to be acyclical and stabilizing, whereas FDI emerges as pro-cyclical and destabilizing. Furthermore, remittances are insensitive to cyclical fluctuation in source countries. We also proceed with SVAR-based identification in order to examine the responses of financial flows to innovation in receiving and source economies. We confirm the counter-cyclical mechanism of remittances with Pakistani output. In particular, our results indicate that remittance flows to Pakistan are mainly due to the economic conditions in the receiving economy. Keywords: Remittances, FDI, ODA, Business Cycle, Pakistan. JEL Codes: E32, F15, F21, F22, F35 1. Introduction During the last decade the inflow of remittances has increased rapidly and now constitutes one of the largest sources of external development finance for developing countries. Recorded remittance flows to developing countries are estimated to have reached $406 billion in 2012, a 6.5 percent increase from $381 billion in the preceding year (World Bank, 2012). Remittances are the second largest source of foreign exchange earnings for developing countries after Foreign Direct Investment (FDI). These remittances have proved remarkably resilient during economic downturns compared to other capital inflows, namely foreign direct investment and official development assistance (Gupta et al., 2000; Ratha, 2003; Buch and Kuckulenz, 2004; and IMF, 2005). For instance, remittances dropped by only 5.5 percent in 2009 after the global financial crises, but rapidly recovered in 2010. By contrast, FDI declined by 40 percent and private debt and portfolio equity flows dropped by 46 percent in 2009 (see Table 1). The authors gratefully acknowledged the comments by Prof. Stephan Klasen, Dr. Felicitas Nowak-Lehmann D. and Dr. Mazhar Mughal. 1 Development Economic Research Group, Faculty of Economic Sciences, Göttingen University, Germany. COMSATS Institute of Information Technology, Pakistan. 2 Ibero-America Institute for Economic Research, Göttingen, Germany. Instituto de Economía Internacíonal, Universidad Jaume I in Castellon, Spain.
Transcript of Blessing or Curse: The Stabilizing Role of Remittances ... · The authors gratefully acknowledged...

Blessing or Curse: The Stabilizing Role of Remittances, Foreign Aid and FDI to
Pakistan
Junaid Ahmed
1 Inmaculada Martínez-Zarzoso
2
Abstract
Inflows of remittances to Pakistan are being increasingly viewed as a relatively attractive source
of external finance, one that can help to foster development and manage economic
shocks. Remittances have become a major source of revenue, surpassing the volume of FDI and
official development assistance that the country receives. This study focuses primarily on the
stability, cyclicality and stabilization impacts of migrant remittances to Pakistan. It is evident that
foreign inflows exhibit different types of volatility; remittances are found to be a less volatile
source of external finance than FDI and ODA that are counter-cyclical and stabilizing, thus
serving to steady the recipient economy in times of economic downturns. ODA appears to be
acyclical and stabilizing, whereas FDI emerges as pro-cyclical and destabilizing. Furthermore,
remittances are insensitive to cyclical fluctuation in source countries. We also proceed with
SVAR-based identification in order to examine the responses of financial flows to innovation in
receiving and source economies. We confirm the counter-cyclical mechanism of remittances with
Pakistani output. In particular, our results indicate that remittance flows to Pakistan are mainly
due to the economic conditions in the receiving economy.
Keywords: Remittances, FDI, ODA, Business Cycle, Pakistan.
JEL Codes: E32, F15, F21, F22, F35
1. Introduction During the last decade the inflow of remittances has increased rapidly and now constitutes one of
the largest sources of external development finance for developing countries. Recorded
remittance flows to developing countries are estimated to have reached $406 billion in 2012, a
6.5 percent increase from $381 billion in the preceding year (World Bank, 2012). Remittances are
the second largest source of foreign exchange earnings for developing countries after Foreign
Direct Investment (FDI). These remittances have proved remarkably resilient during economic
downturns compared to other capital inflows, namely foreign direct investment and official
development assistance (Gupta et al., 2000; Ratha, 2003; Buch and Kuckulenz, 2004; and IMF,
2005). For instance, remittances dropped by only 5.5 percent in 2009 after the global financial
crises, but rapidly recovered in 2010. By contrast, FDI declined by 40 percent and private debt
and portfolio equity flows dropped by 46 percent in 2009 (see Table 1).
The authors gratefully acknowledged the comments by Prof. Stephan Klasen, Dr. Felicitas Nowak-Lehmann D. and Dr. Mazhar
Mughal. 1 Development Economic Research Group, Faculty of Economic Sciences, Göttingen University, Germany.
COMSATS Institute of Information Technology, Pakistan. 2 Ibero-America Institute for Economic Research, Göttingen, Germany. Instituto de Economía Internacíonal, Universidad Jaume I
in Castellon, Spain.

1
Table 1 Remittances and other resource flows into developing countries
(US$ billions)
Source: World Development Indicator, and World Bank Development Prospects 18.
Similarly, remittances tend to rise during recessive phases in the economic cycle, as migrants
send more money home to support their families in the receiving country (Orozco, 2003; World
Bank, 2005; Ratha, 2007). Remittances may therefore smooth consumption and contribute to the
stability of recipient economies (World Bank, 2006). In contrast, other private financial flows
frequently move pro-cyclically, raising income in good times and decreasing it in bad times
(Ratha, 2003). There are different motives for which remittances may be sent. On the one hand,
Lucas and Stark (1985) suggested the pure altruism approach according to which remittances are
expected to smooth household consumption and contribute to the stabilization of receiving
countries following macroeconomic shocks. The hypothesis of remittances being countercyclical
is based on the evidence that a large portion of remittance transfers are intended for altruistic
purposes (e.g. Agarwal and Horowitz, 2002). The fact that remittances rose sharply after the
economic crises in countries like Indonesia (1997), Ecuador (1999) and Argentina (2001) seems
to support this view (Spatafora, 2005). The World Bank (2006) points out that remittances
increased after natural disasters in Bangladesh, Haiti, Honduras and the Dominican Republic, as
well as in response to conflicts in Albania and in Sierra Leone. Ahmed (2012) reported that
remittances to Pakistan display a counter-cyclical tendency to both real output and household
consumption and have helped households cope with natural catastrophes (Suleri and Savage,
2006).
What is more, remittances can also be destined for investment in recipient countries (Woodruff
and Zenteno, 2001), which has been generally called the portfolio approach. According to this
approach, remittances are supposed to increase when the expected returns of these transfers rise
in receiving countries (El-Sakka and McNabb, 1999; Hysenbegasi and Pozo, 2002). Ratha (2003)
mentioned that remittance receipts in Turkey and the Philippines declined after the financial
crises in the late 1990s, although the decline was marginal compared to other capital inflows. In
the same vein, Lueth & Ruiz-Arranz (2006) reported that remittances do not seem to increase in
the wake of natural disasters. However, if altruism dominates, migrants are expected to transfer
more money during economic crises to compensate for the decrease in income suffered by the
family left behind (Quartey, 2007; Yang and Choi, 2007).
Pakistan is among the top ten remittance receiving countries. Remittances sent by Pakistani
migrants from around the world have grown sharply. These flows have not only provided critical
Resource flows 1995 2005 2006 2007 2008 2009 2010 2011
Migrant Remittances 54 198 232 286 331 316 341 381
Foreign Direct Investment 95 307 398 559 637 428 583 644
Private debt and Portfolio Equity 59 193 277 429 186 180 284 201
Official Development Assistance 57 108 107 108 127 126 130 -

2
support to the balance of payments, but have also helped to improve the external debt situation.
Remittances have alleviated poverty and reduced inequality (Mughal and Anwar, 2012). The rise
in remittances to Pakistan also helped to partially offset the negative effects of the oil crisis,
reduce unemployment and improve the living standards of recipient households (Pakistan
Economic Survey, 2012). As a result, the country is increasingly relying on remittances for its
economic development (Mughal, 2012). This is particularly the case during times when FDI and
Official Development Assistance (ODA) flows dry up. The country is not succeeding in
attracting new foreign investments due to the fragile state of the economy and the inflow has
been deteriorating continually. Similarly, foreign aid to the country is quite volatile over time
(Malik, 2009). It is thus imperative to know the driving forces behind the cyclical behavior of
these sources of foreign exchange, namely foreign aid and FDI. Are they procyclical, i.e. moving
in the same direction as the economy, countercyclical, i.e. moving in the opposite direction to the
receiving economy, or acyclical, i.e. having no association with economic performance? This
study attempts to find these cyclical properties of remittance inflows in comparison to alternative
sources of foreign exchange. Although some previous studies exist on the business cycle
properties of one of the flows,3 only two studies have compared the behavior of various flows.
Vargas-Silva (2009) compared remittances and FDI and Neagu and Schiff (2009) compared the
cyclicality, stability and stabilization impacts of remittances with FDI and ODA. To the best of
our knowledge, this study is the first to present a comprehensive and comparable empirical
analysis of financial flows in the context of Pakistan.
The main goal of the study is to assess the stylized facts of the cyclicality of migrants’
remittances, ODA and FDI employing annual time series data over the period 1974-2011. We
explore to what extent these financial flows neutralize macroeconomic shocks and contribute to
macroeconomic stability in the country. Moreover, we will also examine these flows with respect
to the business cycles of major sending economies. It is relevant because if migrant remittances
are pro-cyclical to the source economy business cycle, then remittances could be another channel
through which economic fluctuations in the regions can impact the economic conditions of
Pakistan. In order to achieve the abovementioned goals, we estimate an SVAR model to evaluate
the extent to which migrant remittances respond to cyclical fluctuations in Pakistan’s and source
countries’ output in comparison to ODA and FDI.
The rest of the paper proceeds as follows: Section 2 documents the stylized facts of capital
inflows to Pakistan. Section 3 discusses the data and methodology. Section 4 presents a
comprehensive assessment of our main findings and Section 5 contains the concluding remarks.
1.1 Remittances, FDI and ODA Inflows to Pakistan: Some Stylized Facts
In this section, we highlight the pattern of remittances and other capital inflows to Pakistan.
During the last decade, remittances have grown significantly. The influx of remittances has
surpassed that of foreign direct investment and official development assistance (Figure 1),
becoming the second largest source of foreign exchange after the country’s exports.
3 For instance, Giuliano and Ruiz-Arranz (2009), Akkoyunlu and Kholodilin (2008), Sayan and Tekin-Koru (2010) , Ahmed
(2012), Lueth and Ruiz-Arranz (2007) and Barjas et.al (2012) on the cyclical nature of remittances and Bulir and Hamann
(2003), Chauvet and Guillaumont (2009) and Pallage and Robe (2001) on foreign aid.

3
Figure 1 Remittances and other resource flows to Pakistan (US$ million)
Source: calculation based on World Bank and OECD (2012) data
Recorded remittances have risen from less than $1 billion in 2000 to $12 billion in 2011,
equivalent to 6 percent of GDP (Figure 2).
Figure 2 Remittances and other resource flows as a share of GDP to Pakistan
(US$ million)
Source: calculation based on World Bank and OECD (2012) data
The significant growth in remittance inflows has proved a lifeline for the economy during times
of economic crisis. Lowering the cost of remitting to redirect these flows from unofficial to
official channels under the Pakistan Remittances Initiative (State Bank of Pakistan, 2012) and the
increase in the size of Pakistani diasporas4 (World Bank, 2006; Pakistan Economic Survey, 2012)
are among the main reasons for this spectacular rise in remittances. The Middle East is the
foremost source of remittances to Pakistan, followed by North America and Europe (Figure 3).
4 An estimated 6.3 million Pakistanis live abroad. In regional terms about 3 and a half million Pakistanis migrated to
the Middle East, 1.8 to Europe and 1.2 to the Americas, respectively (Bureau of Emigration and Overseas
Employment, 2012). The main concentrations of Pakistani migrants are found in Saudi Arabia, United Arab
Emirates, United Kingdom, United States and Canada, respectively.
-2000
0
2000
4000
6000
8000
10000
12000
14000
19
73
19
75
19
77
19
79
19
81
19
83
19
85
19
87
19
89
19
91
19
93
19
95
19
97
19
99
20
01
20
03
20
05
20
07
20
09
20
11
FDI ODA Remittances
-2
0
2
4
6
8
10
12
19
73
19
75
19
77
19
79
19
81
19
83
19
85
19
87
19
89
19
91
19
93
19
95
19
97
19
99
20
01
20
03
20
05
20
07
20
09
20
11
FDI as share of GDP ODA as share of GDP
Rem as Share of GDP

4
Figure 3 Top remittance sending regions (figure in US$ million)
Source: calculation based on State Bank of Pakistan data
FDI constitutes the second major source of foreign exchange for Pakistan. Although FDI rose
over the last decade, flows have generally lagged behind those reaching other major Asian
economies. The share of FDI inflows to the economy was negligible before the 1990s, due to the
regulatory policy framework (Arshad and Sujaat, 2011). After the liberalization program in 1992,
FDI displayed remarkable progress (Khan, 1997). For instance, in 2001-02 FDI stood at US$ 823
million, but rose to $5.4 billion during 2006-07 accounting for approximately four percent of
GDP. Since then, flows have fallen sharply (Figure 2). In 2011-12, foreign direct investment
(FDI) in Pakistan witnessed a 36 percent decline from US$ 840 million in 2011 to US$ 532
million (State Bank of Pakistan, 2012), in spite of the fact that Pakistan ranks 83rd
among the 183
economies of the world in terms of ease of doing business, ahead of several other Asian
economies (World Bank and IFC, 2011). Pakistan’s major investors include the United States, the
United Arab Emirates, China, Japan and the European Union. Banking and finance,
telecommunications, oil and gas and retail sectors have attracted most of the recent foreign direct
investment inflows to Pakistan (State Bank of Pakistan, 2012).
Foreign aid is another form of capital inflows. It refers to grants, loans and technical and
economic assistance. Pakistan received US$ 3509 million net official development assistance in
2011, which accounts for only about 1.6 percent of Pakistan’s GDP (see figures 1 and 2). Given
such low inflows of foreign aid, Pakistan is not considered an aid-dependent country (Malik,
2009). Inflows have fluctuated substantially depending on the changing circumstances during
different decades. Flows remained high during the 1980s given the country’s frontline state role
in the US-Soviet conflict in Afghanistan (Malik et al 1994). Flows decreased during the
following decade, drying up in the aftermath of Pakistan’s nuclear tests in 1998. Aid flows
returned to the country after 2001, as Pakistan once again became a frontline state in the
American-led war in Afghanistan (Aning, 2007). In general, the top donors to Pakistan are the
USA, International Development Association (IDA), Asian development Bank special funds, the
UK, Japan, EU institutions, Germany, the United Arab Emirates, Turkey and Australia (OECD,
2012).
0
2000
4000
6000
8000
10000
12000
14000
1973 1980 1990 2000 2010 2012
Total
MiddleEast
North America
Europe
Other Countries

5
2. Financial Flows and the Business Cycle: A Review of the Empirical
Literature
In this section we review the empirical literature that examines the relationship between financial
flows and output fluctuations, placing special emphasis on remittances, but also covering foreign
aid and FDI. In particular, we start by revising studies that focus on remittances for a cross-
section of countries and for specific countries before revising the literature that addresses aid and
FDI. Chami et.al (2009) suggest that remittances have a significant impact on smoothing
macroeconomic fluctuations in recipient countries, concluding that remittances can be used as a
stabilizing tool. They employ data for 70 different countries, including 16 advanced economies
and 54 developing countries. Similarly, Giuliano and Ruiz-Arranz (2009) examine remittances
and output cycles for a sample of approximately 100 developing countries over the period 1975-
2002. They find that remittances are pro-cyclical for about two-thirds of the countries. In the
same fashion, Sayan (2006) studies the behavior of migrant remittance flows for 12 developing
countries. Using a polynomial fitting model for the period 1976-2003, the study finds that while
aggregate country data exhibit counter-cyclicality with GDP, greater heterogeneity is present by
country, as remittances can be pro-, counter-, or even a-cyclical. Lueth and Ruiz-Arranz (2006)
reported that in the wake of a natural disaster, remittances appear to be aligned with the
receiving-country’s business cycle and may not play a major role in restraining vulnerability to
shocks. The analysis is based on estimating a gravity model for migrants’ remittances to a sample
of developing countries. In contrast, Frankel (2011), using the same datasets of bilateral
remittances, suggests that migrants’ remittances play a stabilizing role in the receiving countries.
Vargas Silva (2009) revealed that remittances are countercyclical with respect to the Mexican
business cycle, but the result was not sufficiently robust to different definitions of remittances.
However, strong coherence was found between the cyclical component of remittances and the US
business cycle. In the context of South Asia, Lueth and Ruiz-Arranz (2007) determined that
remittances in Sri Lanka are positively associated with the country’s business cycle. In contrast,
Ahmed (2012) argued that remittances to Pakistan are counter-cyclical with respect to the
cyclical components of receiving output and consumption, whereas their behavior with respect to
the cyclical components of source output from the United States and the United Kingdom is
acyclical. Indian remittances are likewise found to be acyclical with respect to source economies
(Mughal and Ahmed, 2013).
Foreign aid and FDI are similarly found to be pro-, counter- or a-cyclical depending on the
country or set of countries studied and the time periods examined. For instance, using a sample of
33 countries over the period 1969-95, Pallage and Robe (2001) determined that in the majority of
cases aid has been pro-cyclical. Similarly, Bulir and Hamann (2003) showed that foreign aid is
more volatile than domestic fiscal revenues and appeared to be pro-cyclical in the majority of
countries. However, Chauvet and Guillaumont (2009) compared the cyclical behavior of aid over
the period 1970-1999 using the trade cycle instead of the output cycle. They showed that foreign
aid is more effective in countries that are vulnerable to exogenous shocks, because it dampens
their negative effects on growth. They assert that the main factor behind aid effectiveness for
growth is the stabilizing nature of aid. In the same vein, comparing the cyclicality and
stabilization impacts of migrant remittances with other major capital inflows, Neagu and Schiff
(2009) claim that ODA are counter-cyclical while remittances tend to be pro-cyclical, but less so
than FDI over the period 1980-2007 including a sample of 116 developing countries.

6
Furthermore, they show that ODA is more stable than remittances and, in turn, remittances are
more stable than FDI.
In this study we take a similar approach to Neague and Schiff (2009) and Vargas-Silva (2009)
with some modifications. We extend their results using the recent dataset (1974-2011) and take a
closer look by focusing on a single country.
3 Data and Methodology 3.1 Data Description
In order to explore the stabilizing role of remittances and other financial flows to Pakistan, this
study utilizes yearly data over the period 1974-2011. The main variables used in our study are
Remittances, FDI net inflows, ODA, and GDP for receiving countries (e.g. Pakistan), while output
for source economies for each of the four regions is calculated as the weighted sum of GDP for all
the respective regions’ constituent countries5. The datasets used in this study were obtained from
the OECD (Organization of Economic Cooperation and Development), WDI (World Development
Indicators, World Bank), United Nations Conference on Trade and Development (UNCTAD) and
State Bank of Pakistan databases. The data on remittances come from receipts from the WDI and
State Bank of Pakistan. Remittances are current private transfers by migrants who are employed or
intend to remain employed for more than one year in the source country in which they are
considered residents. Therefore, remittances are recorded in the current account of the balance of
payments. The data on FDI are taken from the WDI. It is the sum of equity capital, reinvestment of
earnings, other long-term capital and short-term capital as shown in the balance of payments. It
reveals net inflows (new investment inflows minus disinvestment) from foreign investors. Finally,
the net ODA data as a measure of foreign aid comes from the UNCTAD and OECD databases.
ODA flows include grants and concessional loans—that is, loans that are at least 25% grants. We
gather the Gross Domestic Product data for both source and receiving countries from the WDI in
constant 2000 US dollars. All series are in real 2000 values in US dollars. Only, remittances, ODA
and FDI data are initially in current US$ and converted to constant 2000 US$ using the GDP
deflator. We take a logarithm of the variables before estimation.
Table 2 presents the descriptive statistics of key variables in real terms used in the analysis.
Table 2 Descriptive statistics
Mean Maximum Minimum Standard deviation
Remittances 5426.24 14002.88 1075 3714.18
Foreign Direct Investment 806.89 3530.70 46.25 783.83
Official Development Assistance 3001.13 8455.64 702.69 1949.71
Pakistanis Output 59635.94 118800 19411.12 29921.19
North American Output 7.36E+08 1.10E+09 4.00E+08 2.35E+08
Middle East Output 15725573 27967814 8423992 5585159
5 We separated source economies into four major geographic regions, namely North America (USA, Canada),
Middle East (Saudi Arabia, United Arab Emirates, Kuwait, Qatar, Bahrain, Oman, Turkey), Europe (United
Kingdom, Germany, France, Italy, Netherland, Spain, Greece, Belgium, Ireland, Switzerland, Sweden, Denmark,
Norway), and Asia Pacific (Japan, Australia, Singapore, Hong Kong, Malaysia, New Zealand, China).

7
European Output 99669866 1.32E+08 65951596 21522452
Asia Pacific Output 3.11E+08 3.91E+08 1.74E+08 68345080
Number of observation = 38
3.2 Methodology
The empirical method consists of four steps. Firstly, we use different types of filters to estimate
the cyclical component of remittances, other financial flows and output of both receiving and
source countries. Secondly, we estimate the co-movement between the cyclical components
(including correlations using leads and lags). Thirdly, we check the stabilization role of
remittances in comparison with other financial inflows. Finally, we estimate impulse response
functions and variance decompositions using a structural vector autoregressive (SVAR) model.
3.2.1 Time Series Filtering
In order to observe the cyclical behavior of time series, it is common practice to de-trend the
series by employing different filters. These filters eliminate the slowly-evolving (long-term trend)
component and the rapidly-varying (irregular) component of a variable, leaving behind the
intermediate-term or business-cycle component of the variable (Baxter and King, 1999). In this
study, we take a skeptical approach to this problem: none of the filtering methods employed is
exclusively supposed to be adequate. Instead, following Canova (1998), we assume that all
procedures are approximations which isolate different aspects of the trend and cyclical
components of the series, separating the intermediate components. In order to isolate the cyclical
components from the long-run trend, the Hodrick-Prescott (hereafter HP) is a high-pass filter,
extracting only low frequencies and leaving all higher frequency fluctuations. (Hodrick and
Prescott, 1997). Two band-pass filters are also used that depart all frequencies above 8 years and
below 1.5 years, namely the Baxter and King (hereafter BK) time domain-based filter and the
Ouliaris and Corbae (hereafter OC) frequency domain filter.
In this study, we carry out estimations using three different filters6, although we primarily discuss
the findings of the OC filter. This is because the OC filter is considered to perform better than
both the HP and the BK filter, as it overcomes some of the shortcomings of the other two filters
(Ouliaris and Corbae, 2002).
3.2.2 Main Features of Macroeconomic Fluctuations
Following Kydland and Prescott (1990), Agénor et al. (2000) and Pallage and Robe (2001), the
degree of co-movement between two stationary series and is measured by the magnitude of
correlation coefficients ( ) * +. The cyclical component of and derived
from using HP and BK and OC filters. For instance, the degree of co-movement between a
variable tx and another variable ty is said to be one of the following:
(a) Pro-cyclical if ( )
(b) Countercyclical if ( ) and
6 Details are available in the Appendix.

8
(c) Acyclical if ( )
Similarly, in order to observe significant correlation between two series, as Sayan and Tekin-
Koru (2010) did, we consider the variable to be procyclical (countercyclical) with
if | ( )| 7. Moreover, we also check the timing of the most significant correlation
coefficient to decide the dynamics of the relationship between a variable and ty . The purpose
is to ascertain whether there are possible phase shifts by looking at how early and how late the
highest correlation appears relative to the contemporaneous period (Pallage and Robe, 2002). For
instance, we say that series leads the cycle by j periods if significant | ( )| peaks at
, the series coincides with the cycle if | ( )| peaks for and that the
series lags the cycle by j periods if significant | ( )| peaks at . Finally if all
correlations are trivial, then we can conclude that the association between the variables is
acyclical.
3.2.3- SVAR Model Specification and Identifications of Restrictions
Cross correlations are useful for our analysis but with some limitations. Firstly, correlations do
not give information regarding causality with other variables. Secondly, correlations provide
straightforward bi-variate information and we would like to control for other variables. In order
to address these limitations, we employ Structural Vector Autoregression (SVAR); this model is
composed of a system of five equations including source output i.e. (Middle East, North
American, European and Asia Pacific output), receiving output, migrant remittances, official
development assistance and foreign direct investment. Furthermore, applying VAR addresses the
potential problem of endogeneity among variables. For instance, it is possible for remittances to
impact the receiving business cycle; it is also possible that these variables respond to changes in
the receiving business cycle.
Structural VAR is widely used in the empirical literature to distinguish the effects of endogenous
disturbances within a system. The aim of a structural VAR is to use economic theory,
rather than the Cholesky decomposition, to recover structural innovations from residuals of a
reduced-form VAR. A VAR is an n-equation, n-variable linear model in which each variable in
turn is explained by its own lagged values, current and past values of the remaining n-1 variables.
According to Sims (1980), variables should be treated on equal footing if there is simultaneity
among a set of variables. There should not be any a priori distinction between endogenous
and exogenous variables (Gujarati, 2004 p.848). Before estimating the VAR model, an
important decision must be made regarding the selection of the optimum number of lags. Adding
too many lagged terms can lead to insufficient degrees of freedom. However, adding too few lags
can lead to specification errors8. The subsequent recognition of VAR models still requires
7 In this study, the correlation coefficients that fall outside the [-0.32, 0.32] range require the null hypothesis to be
rejected, that is, it will be considered statistically significant. Details of how the minimum value 0.32 has been
calculated are available in Appendix A.1.
8 The decision of the appropriate lag length is made using the criterion of Akaike, Schwarz and Hannan-Quinn and
Final Prediction Error.

9
identifying assumptions9. A variety of structural VAR models have been proposed, supporting
short-term constraints (Sims, 1986; Bernanke, 1986; Blanchard and Watson, 1986), long-term
restrictions (Blanchard and Quah, 1989), or groups of both short-term and long-term restrictions
(Gali, 1992) on impulse response derived from the underline economic theory. The main
objective of a structural VAR estimation is to obtain non-recursive orthogonalization of the error
terms for the impulse response analysis. This alternative to the recursive Cholesky
orthogonalization requires the imposition of sufficient restrictions to identify the orthogonal
(structural) components of the error terms.
The structural model to be implemented in this study is described by the following dynamic
system of simultaneous equations (1 to 5).
∑
∑
∑
∑
∑
( )
∑
∑
∑
∑
∑
( )
∑
∑
∑
∑
∑
( )
∑
∑
∑
∑
∑
( )
∑
∑
∑
∑
∑
( )
Where,
( ) (
)
source output ( ), receiving output (
), remittances ( ), official development assistance
( ) and foreign direct investment (
) are endogenous variables and assumed to be
stationary. Here the exogenous error terms
are independent and
denoted as structural innovation.
Using matrix algebra, we can write the system (eq. 1 to 5) in matrix notation,
9 The ―identification problem‖ calls for imposing restrictions on some of the structural parameters. Identification by
means of the Cholesky decomposition is considered a mechanical technique that some deem unrelated to economic
theory.

10
[
]
[
]
[
]
[
]
[
]
[
]
( )
Where i= 1, 2, 3,…, n
Simply, it can be expressed as follows.
(7)
Where is the (n x 1) vector of the endogenous variables and is the (n x n) matrix that
contains the lagged endogenous variables, while ( ) yields the variance-covariance
matrix of the structural innovations.
Pre-multiplying with , we obtained the corresponding reduced form (VAR)10
in the context
of SVAR given in Equation (7), as we cannot use OLS directly to estimate SVAR, due to
contemporaneous effects correlated with the structural shocks ( )
Thus,
(8)
In other words the reduced form model given in eq. (7) is equal to
(9)
Where,
, the variance-covariance of the reduced form
is given by ( )
Equation (9) can be written in matrix form as:
[
]
[
]
[
]
[
]
[
]
( )
10 The main problem in estimating the structural model is that one cannot directly estimate the variables of interest, such as
in Equation (7)

11
Equations (9) and (10) represent a standard reduced form VAR which can be estimated with
OLS. The predetermined variables are comprised on the right hand side of the equation, while the
error terms are white noise. The errors are serially uncorrelated, but correlated across equations.
Let us recall equation (9), in which the structural model relates the regression residuals and the
pure innovations in the following way.
We can model the contemporaneous relationships among the variables as suggested by Vargas
Silva (2009) with some modifications.
(11)
(12)
(13)
(14)
(15)
Where are the regression residuals obtained from the reduced form VAR,
and , are the pure shocks (i.e., structural innovations) to the detrended
series in terms of log, (Ys) (Y
r), (X
rem), (X
oda) and (X
fdi) respectively. Hence the model specified
above in reduced form provides the number of assumptions necessary to identify the structural
VAR model. The assumptions imply that changes in the source output are assumed to be affected
only by its own shocks, meaning that source output is not promptly affected by other variables in
the model. Receiving output is affected by shocks to source output, remittances, ODA and FDI.
Remittances are influenced by source and receiving output shocks. This is consistent with the
evidence that changes in the economic conditions of receiving countries are significant in
explaining remittance behavior (Kock and Sun, 2011). Similarly, FDI is also influenced by
source and receiving output. However, ODA is only affected by innovation to source output. The
above specification is appealing, as it does not impose any restrictions on the long-run behavior
of economic variables.
4- Main Results:
Subsection 4.1 presents the volatility of the analyzed flows derived from the filtered series and
the corresponding correlation. The stabilizing nature of remittances, ODA and FDI with respect
to output are also reported in this section. The SVAR estimations are discussed in section 4.2.
4.1 Volatility, Cyclicality and Stabilization of Financial Flows
Figure 4 reports the volatility of each capital inflow over the period 1974-2011 based on the
standard deviation of the cyclical ratio of the corresponding variable to GDP. According to our

12
calculations, FDI is 163 percent and ODA is 27 percent more volatile than remittances during the
sample period 1974-11. These findings revealed that remittances to Pakistan are a relatively
stable source of external finance, compared with ODA and FDI inflows. The figures showing the
greater resilience of remittances corroborate the findings of Buch et al. (2002), IMF (2005),
Lueth et al. (2007) and Mughal and Makhlouf (2011).
Figure 4 Volatility of Capital Inflows to Pakistan, 1974–2011
Note: Volatility is defined as the percentage standard deviation of the detrended ratio of the
relevant inflows to GDP. The OC filter has been used to extract detrended series.
Next we look at the cross-correlation between the cyclical components of the financial flows and
the corresponding annual GDP for receiving and source economies. As discussed earlier, HP, BK
and OC filters are used to extract the cyclical components of a series. Following Burns and
Mitchel (1946), Business-cycle frequency is defined to be between 2 and 8 years in estimating
the cyclical components using BK-filtered (time domain) and OC –filtered (frequency domain)
technique. Meanwhile, the HP Filter is applied to the trend-cycle component of each variable, in
order to extract the stationary (cyclical) and non-stationary (trend) components. In this case, we
do so following the business cycle definition by Lucas (1977) and Kydland and Prescott (1990),
stated as deviations of aggregate real output from its long-run trend (a growth cycle). The
smoothing parameter (lambda) is set to 6.25 for the HP filter as suggested by Ravn and Uhlig
(2002). In next step of the correlation analysis, we compute correlation coefficients between the
detrended real output of both source and receiving countries and the lead, current and lag of
detrended remittances, ODA and FDI. The maximum number of leads and lags is fixed to two in
each case. The results of contemporaneous cross-correlation as well as asynchronous correlation
are presented in Table 3.
We look first at the correlations between the cyclical components of financial inflows and
Pakistani GDP during the period 1974- 2011. The negative association and statistical significance
of the contemporaneous correlation coefficient reported in Table 3 implies that remittances sent
to Pakistan tend to move counter-cyclically relative to receiving output, regardless of which filter
has been used11
. This implies that remittances provide relief to low income families, mainly in
times of economic hardship. The results corroborate the findings of Anwar and Mughal (2012)
that remittances to Pakistan are sent mainly for altruistic motives. Remittances therefore perform
11
Results of both HP and BK filters are available upon request
00.5
11.5
22.5
33.5
44.5
Remittances ODA FDIStan
dar
d D
evi
atio
n in
Pe
rce
nt
Capital Inflows

13
a welcome stabilization function during times of economic recession. On the contrary, the
association between FDI and receiving output appears to be positive and significant, implying
that FDI tends to act pro-cyclically and synchronous to the country’s business cycle. Similarly,
the pro-cyclical nature of FDI depicts that more is to be gained by a foreign investor when the
receiving economy performs better. This explains the fall in FDI flows over the last five years, as
the country is suffering from economic insecurity.
The correlation coefficient for ODA is found to be insignificant, implying acyclical behavior with
respect to receiving output. The results are not surprising as finalizing aid budgets, commitment
and disbursement procedures might be too sluggish to readily react to the ups and downs of
economic activity at receiving country output level. However, we find that FDI exhibits acyclical
behavior with receiving output by using the HP and BK filter. Overall, both ODA and FDI do not
seem to play a major role in limiting the vulnerability to macroeconomic shocks in the receiving
country.
Table 3 Summary of Cross Correlations between Source and Receiving Country Output at Time t
(t = 1974, …, 2011) and Remittances, FDI and ODA.
Variables Remittances Official
Development
Assistance
Foreign Direct Investment
Cyclicality Lead/Lag Cyclicality Cyclicality Lead/Lag
Pakistanis
Output
Counter-
cyclical
Coincident Acyclical Pro-cyclical Coincident
Middle East
Output
Counter-
cyclical
Lagging Acyclical Acyclical _____
North
American
Output
Acyclical _____ Acyclical Pro-cyclical Lagging
European
Output
Acyclical _____ Acyclical Pro-cyclical Lagging
Asia Pacific
Output
Acyclical _____ Acyclical Pro-cyclical Coincident
Table 3 shows the contemporaneous and asynchronous (up to two years) cross correlation of
remittances and major source countries’ business activity. In this scenario, remittance inflows
depend on the economic conditions of source economies. For instance, if incomes rise in the
source economy, Pakistani migrants may send more money back home, so the boom in the source
economy is transmitted to the receiving economy through remittances.
Remittances from Pakistan appear to move acyclicaly with Middle East output during the
examined period 1974-2011. However, when the OC filter is used, remittances to Pakistan and
the business cycle activity of the Middle East appeared to be negatively correlated, that is moving
counter cyclically and peaking one year after Middle East output. This last finding warrants some
discussion. In the 1970s and 1980s, Pakistan supplied a large proportion of the labor
requirements of countries in the Middle East. Official remittances to Pakistan during that period
accounted for about 10 percent of GDP and as a result were hit the hardest by the 1990-91 Gulf
war and the ensuing financial difficulties that the countries in the region faced. Thousands of

14
temporary Pakistani migrants returned home, bringing all of their savings with them. This reflects
in the negative correlation between flows to Pakistan and Middle East output. Another
explanation may be that during the current economic slump, remittances to Pakistan from the
Middle East have not suffered, but in fact kept on increasing, again indicating a negative
correlation. In similar fashion, it is important to ascertain how other external factors, such as
economic growth in the region, have influenced FDI and ODA flows to Pakistan. We find
acyclical behavior between FDI (ODA) and Middle East output, regardless of which filter is
used. This implies that investors’ decisions to invest in Pakistan as well as donors’ preferences
for aid are not primarily based on the country’s business cycle.
However, as shown in Table 3, we fail to find any association between the cyclical components
of remittances and economic activity in North America, Europe or the Asian pacific region.
Therefore, remittances are acyclical to major source countries. Similarly, correlation estimation
suggests that ODA inflows are unaltered by source countries’ economic cycles. However, the HP
filter suggests a significant relationship in the case of North America.
In contrast, FDI to Pakistan is typically pro-cyclical in regard to regional output. Our findings
show that FDI outflows from these countries contract when conditions in investor countries are
unfavorable. The finding shows that remittances to Pakistan remain acyclical regardless of
fluctuations in most of the source countries, particularly due to the diverse nature of migrant
outflows from Pakistan to different regions around the globe.
Another way to examine the stabilization impact of financial flows that goes beyond cyclicality
was suggested by Chauvet and Guillaumont (2008) and Neague and Schiff (2009). The authors
propose a stabilization index that is given by
Stabilization index of X= volatility of Y-volatility of (X+ Y)
Where X represents the financial flows to the country (Remittances, ODA or FDI) and Y
corresponds to receiving GDP.
( ) ( ) ( ) ( )
If this difference is positive (negative), the variable X has a stabilizing (destabilizing) nature with
respect to output.
Table 4 Stabilizing nature of remittances, ODA and FDI with respect to Output.
Standard deviation Mean Coefficients of
Variation
Remittances 0.706 8.367 8.43
ODA 0.678 7.793 8.70
FDI 0.936 6.310 14.8
GDP 0.548 10.86 5.04
Remittances + GDP 0.681 19.23 3.54
ODA + GDP 0.318 18.65 1.70
FDI + GDP 1.400 17.17 8.16 Note: CV= Coefficient of variation, computed as (standard deviation/mean) * 100
Stabilization Index of remittances = 1.5
Stabilization Index of ODA= 3.3
Stabilization Index of FDI= -3.1

15
Table 4 reports the stabilizing nature of Remittances, FDI or ODA, which helps decrease the
variability of GDP measured by the coefficient of variation. The results depict that both
remittance and ODA inflows appear to exert a stabilizing influence, but the opposite is true in
case of FDI, which emerges as destabilizing. This finding reflects that the relative stability of
remittances may provide further assistance to the economy in terms of reduced volatility of
receiving output.
4.2. Empirical Evidence from a Structural VAR
As a preliminary step, we investigate the time series properties of the data by testing for the
presence of unit roots. The results of the Augmented Dickey Fuller test12
show that all variables
are non-stationary in levels but stationary in first differences. Next, we use impulse response
functions commonly used in SVAR analysis in order to examine the responses of the variables to
exogenous shocks. For a lag length selection, an optimal lag length of two is chosen based on
different information criteria in order to obtain reasonable dynamics. Two lags were sufficient to
remove any serial correlation to satisfy the normality and stability tests, without losing too many
degrees of freedom. We then utilize impulse response functions to examine the dynamic causal
relationship between remittances, FDI, ODA and source and receiving output. The plot of
impulse responses presented in Figure 5 reveal the dynamic effects of remittances, ODA and FDI
to Pakistan and Middle East output shocks. The impulse response of remittances to Pakistan to
one standard deviation shock to Middle East output looks negative and significant after one year.
This is in line with the significantly negative correlation found for remittances to Pakistan. In
contrast, the impulse response of inward FDI and ODA is insignificant in the case of Middle East
annual output. Similarly, the response of remittances to Pakistani output is negative and
significant describing a counter-cyclical mechanism for these flows, which would rise when the
receiving country is growing below its potential level of income. However, the response of ODA
is mildly pro-cyclical, that is, it increases once economic conditions improve in the recipient
economy. Meanwhile, no significant association is found between FDI and receiving output.
Figure 5. Response of Remittances, ODA and FDI to Shocks to Middle East and Pakistani
Output
12
Test results are reported in the Appendix
-.2
-.1
.0
.1
.2
1 2 3 4 5
Response of Remittances to Shock to Middle East Output
-.2
-.1
.0
.1
.2
1 2 3 4 5
Response of Remittances to Shock to Pakistani Output
-.2
-.1
.0
.1
.2
.3
1 2 3 4 5
Response of ODA to Shock to Middle East Output
-.2
-.1
.0
.1
.2
.3
1 2 3 4 5
Response of ODA to Shock to Pakistani Output
-.4
-.2
.0
.2
.4
1 2 3 4 5
Response of FDI to Shock to Middle East Output
-.4
-.2
.0
.2
.4
1 2 3 4 5
Response of FDI to Shock to Pakistani Output
Response to Structural One S.D. Innovations ± 2 S.E.

16
Figure 6 presents impulse responses to a shock in North American output and responses of
financial flows. ODA to the country responds counter-cyclically after the shock to North
American output, while FDI responds positively and significantly after the second period to an
initial shock to North American output. The response of remittances to a shock to North
American output seems negative, but is not statistically significant. As regards the shock to the
receiving economy, ODA and FDI respond pro-cyclically, that is, they increase when the
receiving country enters an economic boom and would decrease in periods of economic
recession. In contrast, remittances appear to be counter-cyclical, but are not significantly
associated to Pakistan’s economic activity.
Figure 6 Response of Remittances, ODA and FDI to Shocks to North American and Pakistani
Output
Figure 7 Response of Remittances, ODA and FDI to Shocks to European and Pakistani Output
-.2
-.1
.0
.1
.2
1 2 3 4 5
Response of Remittances to Shock to North Amer ican Output
-.2
-.1
.0
.1
.2
1 2 3 4 5
Response of Remittances to Shock to Pakistani Output
-.2
-.1
.0
.1
.2
1 2 3 4 5
Response of ODA to Shock to North Amer ican Output
-.2
-.1
.0
.1
.2
1 2 3 4 5
Response of ODA to Shock to Pakistani Output
-.2
-.1
.0
.1
.2
.3
1 2 3 4 5
Response of FDI to Shock to North Amer ican Output
-.2
-.1
.0
.1
.2
.3
1 2 3 4 5
Response of FDI to Shock to Pakistani Output
Response to Structural One S.D. Innovations ± 2 S.E.
-.12
-.08
-.04
.00
.04
.08
.12
1 2 3 4 5
Response of Remittances to Shock to European Output
-.12
-.08
-.04
.00
.04
.08
.12
1 2 3 4 5
Response of ODA to Shock to European Output
-.2
-.1
.0
.1
.2
.3
1 2 3 4 5
Response of Remittances to Shock to Pakistani Output
-.2
-.1
.0
.1
.2
.3
1 2 3 4 5
Response of ODA to Shock to Pakistani Output
-.4
-.2
.0
.2
.4
1 2 3 4 5
Response of FDI to Shock to European Output
-.4
-.2
.0
.2
.4
1 2 3 4 5
Response of FDI to Shock to Pakistani Output
Response to Structural One S.D. Innovations ± 2 S.E.

17
The response of FDI to innovations in European output tends to be pro-cyclical (Figure 7). In
contrast, the impulse response of Remittances and ODA to a shock to European output remains
insignificant. Similarly, it seems that a shock to the cyclical component of Pakistani output is
negatively associated to both remittance inflows, confirming the altruistic motivation of migrants,
an economic recession in the receiving county accompanied by an increase in the inflows of
remittances. In contrast, both FDI and ODA react pro-cyclical to shock to Pakistani output.
However, the response of ODA to receiving output is temporary.
Figure 8. Response of Remittances, ODA and FDI to shocks to Asia Pacific and Pakistani
Output
The responses of resource flows to shocks to output in the Asia Pacific region and Pakistan are
illustrated in Figure 8. ODA shows significant impulse response to innovations in Pakistani
output. The response is countercyclical, albeit temporary. The initial impulse response of
remittances to shocks to receiving output is positive and significant, before turning negative and
significant in the fourth period. However, FDI appears as acyclical to shocks to receiving output.
Similarly, we found no association between remittances, FDI or ODA and Asia Pacific output.
Having examined how migrants' remittances and other financial inflows to Pakistan respond to
the receiving and source business cycles, we now assess which of the two sets of cycles is more
important for Pakistan. We obtain forecast error variance decompositions corresponding to our
SVAR models. These show the extent of the variability that each shock accounts for in the total
variation of the endogenous variable. The higher the share of the variable in the error variance,
the more important the variable is in the system. We follow Sim and Bernanke (1986) to obtain
forecast error variance decomposition. A variance decomposition of five future periods is
reported. The variance decomposition reported in Table 5 depicts to what extent the forecast error
variance in the cyclical component of remittances, FDI and ODA inflows to Pakistan explain
structural shocks to Pakistan’s and source regional output.
-.2
-.1
.0
.1
.2
1 2 3 4 5
Response of Remittances to Shock to Asia Pacific Output
-.2
-.1
.0
.1
.2
1 2 3 4 5
Response of Remittances to Shock to Pakistani Output
-.2
-.1
.0
.1
.2
.3
1 2 3 4 5
Response of ODA to Shock to Asia Pacific Output
-.2
-.1
.0
.1
.2
.3
1 2 3 4 5
Response of ODA to Shock to Pakistani Output
-.4
-.2
.0
.2
.4
1 2 3 4 5
Response of FDI to Shock to Asia Pacific Output
-.4
-.2
.0
.2
.4
1 2 3 4 5
Response of FDI to Shock to Pakistani Output
Response to Structural One S.D. Innovations ± 2 S.E.

18
Table 5 Error Variance Decomposition: Percentage of Variation in Capital Inflows Explained by
Pakistani and Regional Outputs
Period Percentage of the variation
in Remittances explained
Percentage of the variation
in ODA explained
Percentage of the
variation in FDI
explained
Middle
East output
Pakistani
Output
North
American
output
Pakistani
Output
North
American
output
Pakistani
Output
1 16.48 47.19 30.05 0 3.121 43.06
2 30.22 26.54 26.75 0.111 11.91 23.35
3 23.45 24.34 41.47 0.094 20.60 15.57
4 18.94 20.70 37.57 0.259 17.74 13.42
5 13.91 13.22 36.94 0.283 21.58 12.55
Table 5 shows that remittances are the main driving factor, since they explain around 47 percent
of variation due to receiving output. The fraction of FDI variance explained by Pakistani output
ranges between 13 and 43 percent. However, a shock to regional output explains little variation in
both remittances and FDI. Similarly, 41 to 27 percent of variance in inflows of ODA to Pakistan
are due to North American output.
In general, the study shows that the inflows of remittances and FDI to the country are typically
affected by their innovations to Pakistani output rather than source output. However, inflows of
ODA are mostly affected by source output fluctuations, rather than Pakistani output.
5- Conclusions
Remittance inflows have become an important source of foreign exchange earnings in Pakistan,
surpassing the inflow of FDI and Official Development Assistance. In this study, we examined
the stability, cyclicality and stabilization impact of remittances together with other major capital
inflows. We find that capital inflows exhibit different types of volatility, remittances being more
stable than ODA and, in turn, ODA being more stable than FDI. Similarly, we describe stylized
facts regarding capital flows and their co-movements with source and receiving real output. We
found that remittances are counter-cyclical and stabilizing, serving consequently as a
macroeconomic stabilizer for the Pakistani economy. ODA appeared to be acyclical and
stabilizing, whereas FDI is pro-cyclical and destabilizing. Moreover, no clear pattern of
cyclicality is found for remittances and source output, suggesting that remittances should not be a
factor through which business cycles in these regions are affecting the economic conditions of
Pakistan. However, we detected a positive association between FDI and source countries’ real
output. In particular, our findings show that two features make remittances an important source of
foreign exchange to Pakistan compared to FDI and ODA. Firstly, they are relatively stable and to
a certain extent compensate for the variability in output. Secondly, they tend to be counter-
cyclical, increasing in times of economic hardship in the migrants’ receiving countries.
We proceed with SVAR-based identification in order to examine the responses of remittances to
innovation in receiving and source economies. We find a negative relationship between the
cyclical components of remittances and the cyclical components of receiving output, which

19
corroborates the results we found earlier. The results revealed that migrants increase their
transfers during recessive phases of economic activity in Pakistan. Similarly, we find that FDI
responds positively to fluctuations in the economic conditions in the receiving country. However,
the response was insignificant in some cases. In contrast, results were inconclusive regarding the
relationship between ODA and the economic conditions in the receiving country. Meanwhile,
with regards to host region business cycles, remittances are acyclical except for the Middle East,
where they display a counter-cyclical trend. In variance decomposition analysis, inflows of
remittances and FDI to the country are typically affected by innovations in receiving output
rather than by source output. However, inflows of ODA are mostly affected by source output
fluctuations rather than by receiving output.
Our results indicate that remittance flows to Pakistan mainly respond to economic conditions in
the receiving economy. Similarly, a confluence of global factors and favorable domestic
conditions played a role in driving FDI flows to Pakistan. One major challenge for our
policymakers is to find substitutes to reduce reliance on remittances, so that the country is
capable of coping with the associated risks if inflows slow down.

20
References: Akkoyunlu, S & Kholodilin, K. (2008) A link Between Workers Remittances and Business
Cycles in Germany and Turkey. Emerging Markets Finance & Trade, 44, pp.23-40.
Agarwal, R., and Horowitz, A. W. (2002) Are International Remittances Altruism or Insurance?
Evidence from Guyana Using Multiple-Migrant Households. World Development, Vol. 30, pp.
2033-2044.
Ahmed, J. (2012) Cyclical Properties of Migrant's Remittances to Pakistan: What the data tell
us. Economics Bulletin, vol. 32(4), pp 3266-3278.
Aning, K (2007) Security, the War on Terror and Official Development Assistance, Theme Paper
prepared for the project on Southern Perspectives on Reform of the International Development
Architecture.
Baxter, M and King, R G (1999) Measuring Business Cycles: Approximate Band‐Pass Filters for
Economic Time Series. The Review of Economics and Statistics, 81, pp. 575–593
Barajas, A, Chami, R, Ebeke, C and Tapsoba, S (2012) Workers' Remittances: An Overlooked
Channel of International Business Cycle Transmission? IMF Working Paper No. 12/251.
Bernanke, B. (1986) Alternative explorations of the money-income correlation, Carnegie-
Rochester Series on Public Policy, 25, pp. 49-99.
Bjornland, H. C. (2000) Detrending Methods and Stylized Facts of Business Cycles in Norway-
An International Comparison. Empirical Economics, 25, pp. 369-392.
Blanchard, O.J., and D.T. Quah (1989) The Dynamic Effects of Aggregate Demand and Supply
Disturbances. The American Economic Review, 79 (4), pp. 655–673
Blanchard, O.J. and M.W. Watson, (1986) Are Business Cycles All Alike?, in Gordon, R. (ed.),
The American Business Cycle: Continuity and Change. University of Chicago Press, Chicago,
pp. 123-56.
Bulir, A, and A. J. Hamann (2003) Aid Volatility: An Empirical Assessment. IMF Staff Papers,
Vol. 50, No. 1, pp. 64–89.
Buch, C. M. and Kuckulenz, A. (2004) Worker Remittances and Capital Flows to Developing
Countries, ZEW Discussion Paper No. 04-31.
Canova, F., (1998) Detrending and Business Cycle Facts. Journal of Monetary Economics, 41,
pp. 475-540.
Chami, R., D. Hakura, and P.Montiel. (2009) Remittances: An Automatic Output Stabilizer‖?
IMF Working Paper 09/91.
Chauvet, L and P, Guillaumont (2009) Aid, Volatility and Growth Again. When Aid Volatility
Matters and When it does not. Review of Development Economics, 13(3).pp. pp. 452–463
Corbae, D, Ouliaris, S and Phillips, P C B (2002) Band Spectral Regression with Trending Data.
Econometrica, 70, pp. 1067–1109.
Corbae, D and Ouliaris, S (2006) Extracting Cycles from Nonstationary Data, in Corbae, D,
Durlauf, S N and Hansen, B E (eds.). Econometric Theory and Practice: Frontiers of Analysis
and Applied Research, Cambridge University Press.
El-Sakka, M. and McNabb, R. (1999) The Macroeconomic Determinants of Emigrant
Remittances. World Development, 27(8), pp. 1493-1502.
Federico S. & Zlate, Andrei, (2012) Immigration, remittances and business cycles. Journal of
Monetary Economics, vol. 59(2), pages 196-213.
Frankel, J. (2011) Are Bilateral Remittances Countercyclical?, Open Economies Review, 22(1),
pp. 1–16.
21
Gali, J. (1992) How Well Does the IS-LM Model Fit Postwar US Data?. Quarterly Journal of
Economics 107 (2): 709–738.
Giuliano, P & Ruiz-Arranz, M, (2009) Remittances, financial development, and growth, Journal
of Development Economics , vol. 90(1), pp. 144-152.
Gottschalk, J. (2001) An Introduction into the SVAR Methodology: Identification, Interpretation
and Limitations of SVAR Models. Kiel Institute for World Economics, WP 1072
Gupta, S., Pattillo, C. A. and Wagh, S. (2009). Effect of remittances on poverty and financial
development in Sub-saharan Africa. World Development, 37, pp. 104-115.
Gujarati, D. (2004) Basic Econometrics. Fourth Edition, the McGraw-Hill Companies.
Hysenbegasi, A. and S. Pozo. (2002) What Prompts Workers to Remit? Evidence Using a Panel
of Latin American and Caribbean Nations. Working Paper, Western Michigan University
Hodrick, R.J. and E.C. Prescott, (1997) Post-war U.S. Business Cycles: An Empirical
Investigation. Journal of Money, Credit and Banking, Vol. 29, pp. 1-16
Khan, M. A., and Khan, S. A. (2011) Foreign direct investment and economic growth in Pakistan
with sector analysis. Pakistan Institute of Development Economics Working Papers, 67 (2011)
Khan H. Ashfaque (1997). Foreign Direct Investment in Pakistan: Policies and Trends. Pakistan
Development Review, vol. 36:4.
Kock, U. & Sun, Y. (2011) Remittances to Pakistan- Why have they gone up and why aren’t they
coming down? IMF Working Paper WP/11/200
Kydland, F. E. and E. C. Prescott (1990) Business Cycles: Real Facts and a Monetary Myth.
Federal Reserve Bank of Minneapolis Quarterly Review, 14, pp.3-18.
Leuth, Erik & Ruiz-Arranz, M, (2007) Are Workers’ Remittances a Hedge Against
Maroeconomic Shocks? The Case of Sri Lanka. IMF Working Paper, 07/22.
Lueth, Erik and Marta Ruiz-Arranz. (2006) A Gravity Model of Workers Remittances. IMF
Working Paper WP/06/290.
Lucas and Stark (1985) Motivations to Remit: Evidence from Botswana, Journal of Political
Economy, Vol. 93(5), pp. 901-918.
Lucas, R.E., (1977). Understanding Business Cycles, in K. Brunner and A.H. Meltzer, eds.,
Stabilization of the Domestic and International Economy, Amsterdam: North Holland.
Malik, A. (2009). Quality and Coordination of Official Development Aid in Pakistan, Working
Paper 11. Washington, DC: Wolfensohn Center for Development.
Malik, Sohail. J., S. Aftab, and N. Sultana (1994). Pakistan’s Economic Performance 1947-1993:
A Descriptive Analysis, SURE Publishers Lahore, Pakistan.
Mughal, M.Y. (2012) Remittances as development strategy: Stepping stones or slippery slope?‖
Journal of International Development, 24:8.
Mughal, M.Y. and Makhlouf, F. (2011) Volatility of remittances to Pakistan: What do the data
tell?. Economics Bulletin, 31:1, pp. 605-612.
Mughal, M.Y. and Anwar, A.I. (2012) Remittances, Inequality and Poverty in Pakistan: Macro
and Microeconomic Evidence. Working Papers 2012-2013_2, CATT - UPPA - Université de Pau
et des Pays de l'Adour, revised Aug 2012.
Mughal, M.Y. and Ahmed, J. (2013) Remittances and Business Cycles: Comparison of South
Asian Countries. Working Papers 2013 CATT - UPPA - Université de Pau et des Pays de l'Adour
revised Jan, 2013.
Neagu, I. C. and Schiff, M. (2009) Remittance stability, cyclicality and stabilizing impact in
developing countries. The World Bank , Policy Research Working Paper Series 5077.

22
Orozco, M. (2003) Worker remittances in the international scope. Inter- American Dialogue
Working Paper, commissioned by the Multilateral Investment Fund.
Pallage, S. and M.A. Robe ( 2001) Foreign Aid and the Business Cycle. Review of International
Economics, Vol. 9(4), pp. 641-672.
Pakistan Economic Survey (2012). Pakistan Economic Survey, Ministry of Finance, Government
Pakistan.
Quartey, P., (2007) Migrant Remittances and Household Welfare in times of Macro volatility: the
case of Ghana. ISSER Technical Publication Number 61, ISSER, University of Ghana. ISBN:
9964-75-057-9.
Ratha, D. (2003) Workers’ Remittances: An Important and Stable Source of External
Development Finance. In Global Development Finance 2003, Striving for Development Finance,
The World Bank, Washington D.C.
______ (2007) Leveraging Remittances for Development.‖ Policy Brief, Migration Policy
Institute, Washington DC.
Suleri, A., and K. Savage. (2006) Remittances in Crisis: A Case Study from Pakistan.
Humanitarian Policy Group, Overseas Development Institute, London.
Spatafora, N., (2005) Workers' Remittances and Economic Development, (Chapter II) in World
Economic Outlook: Globalization and External Imbalances, IMF, Washington, DC, pp. 69-84.
Sayan, S. (2006) Business Cycles and Workers' Remittances: How do Migrant Workers Respond
to Cyclical Movements of GDP at Home?. IMF Working Paper No. 06/52
Sayan, S. and Tekin-Koru, A. (2010) Remittances, Business Cycles and Poverty: The Recent
Turkish Experience, International Migration.
Shapiro, M. and Watson, M. (1988) Sources of Business Cycles Fluctuations, in S. Fischer (ed.):
NBER Macroeconomics Annual 1988, MIT Press, vol. 3, pp. 111-148.
Sims, Christopher A (1980) Macroeconomics and Reality. Econometrica 48(1), pp.1-48.
Sims, C.A. (1986) Are Forecasting Models Usable for Policy Analysis?" Quarterly Review of the
Federal Reserve Bank of Minneapolis, 10, pp. 2-16.
State Bank of Pakistan (various issues) Balance of Payments Statistics of Pakistan
State Bank of Pakistan (2009) Annual Report 2008-09: The State of the Pakistan’s Economy.
Volume –I, State Bank of Pakistan: Karachi
OECD (Organisation for Economic Co-operation and Development) (2012), ODA Receipts and
Selected Indicators for Developing Countries and Territories.
Vargas-Silva, C. (2008) Are remittances manna from heaven? A look at the business cycle
properties of remittances. North American Journal of Economics and Finance, (19), pp. 290-303
World Bank and International Finance Corporation (2011). Ease of doing business 2011, making
a difference for entrepreneur.
World Bank. (2005) Global Economic Prospects: Economic Implications of Remittances and
Migration. Washington DC: World Bank.
____________(2006) Global economic prospects: Economic implication of remittances and
migration. Washington, D. C: World Bank.
____________(2011) Migration and Remittances Factbook 2011. Washington, DC: World Bank.
____________(2012) Migration and Development Brief 18. Washington, DC: World Bank.
Woodruff, Christopher, and Rene Zenteno. (2001) Remittances and Microenterprises in Mexico.
Unpublished paper, University of California, San Diego.
Yang, D. and Choi, H. (2007) Are Remittances Insurance? Evidence from Rainfall Shocks in the
Philippines. World Bank Economic Review, 21(2), pp. 219-248.
23
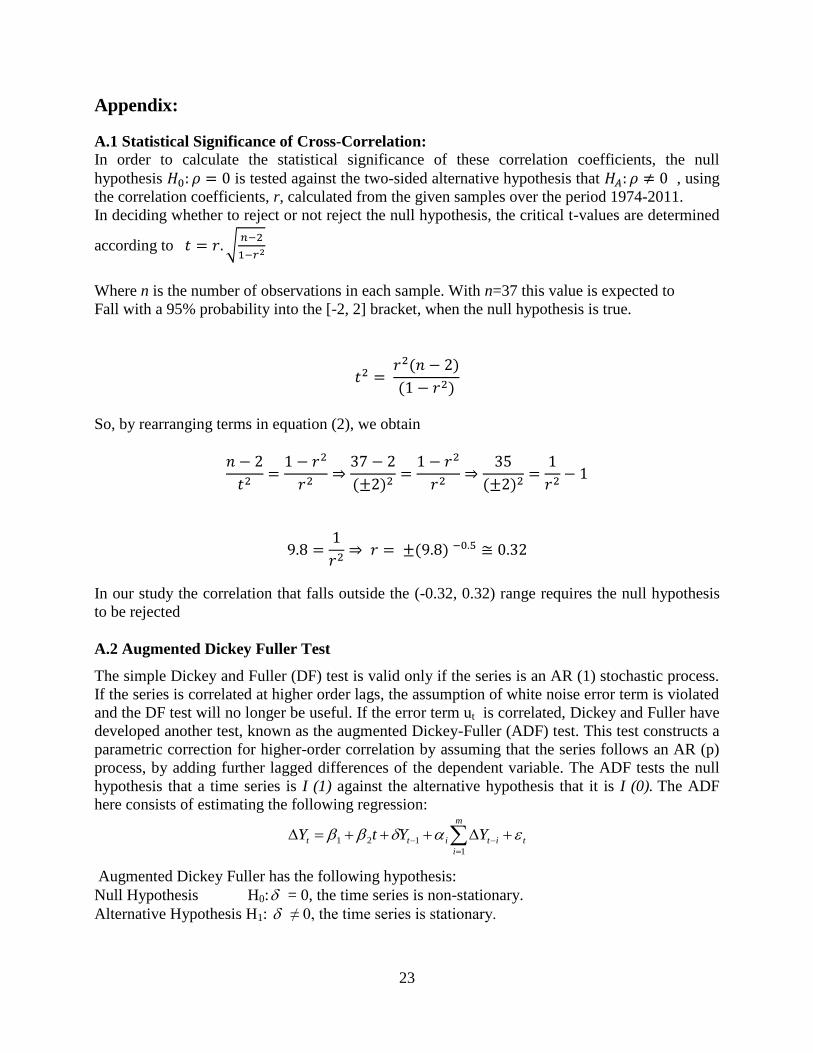
Appendix:
A.1 Statistical Significance of Cross-Correlation:
In order to calculate the statistical significance of these correlation coefficients, the null
hypothesis is tested against the two-sided alternative hypothesis that , using
the correlation coefficients, r, calculated from the given samples over the period 1974-2011.
In deciding whether to reject or not reject the null hypothesis, the critical t-values are determined
according to √
Where n is the number of observations in each sample. With n=37 this value is expected to
Fall with a 95% probability into the [-2, 2] bracket, when the null hypothesis is true.
( )
( )
So, by rearranging terms in equation (2), we obtain
( )
( )
( )
In our study the correlation that falls outside the (-0.32, 0.32) range requires the null hypothesis
to be rejected
A.2 Augmented Dickey Fuller Test
The simple Dickey and Fuller (DF) test is valid only if the series is an AR (1) stochastic process.
If the series is correlated at higher order lags, the assumption of white noise error term is violated
and the DF test will no longer be useful. If the error term ut is correlated, Dickey and Fuller have
developed another test, known as the augmented Dickey-Fuller (ADF) test. This test constructs a
parametric correction for higher-order correlation by assuming that the series follows an AR (p)
process, by adding further lagged differences of the dependent variable. The ADF tests the null
hypothesis that a time series is I (1) against the alternative hypothesis that it is I (0). The ADF
here consists of estimating the following regression:
t
m
i
ititt YYtY
1
121
Augmented Dickey Fuller has the following hypothesis:
Null Hypothesis H0: = 0, the time series is non-stationary.
Alternative Hypothesis H1: ≠ 0, the time series is stationary.

24
If the null hypothesis is rejected, it means that the variable is stationary, whereas acceptance of
the null hypothesis means the series is non-stationary at that level and needs to be differenced to
make it stationary.
Table A.1 ADF Test Results for Unit Roots
Variables’ Level HP Filter BK Filter OC Filter
Remittances -2.54(0) -5.50*(1) -4.78*(1) -5.29*(1)
Foreign Direct Investment -3.48(3) -5.18*(0) -4.18*(0) -5.70*(4) Official Development Assistance -3.14(0) -7.55*(1) -6.61*(1) -5.01*(5) Pakistanis Output -1.35(1) -4.46*(1) -3.94*(1) -5.69*(1) North American Output -1.62(1) -5.19*(1) -4.27*(1) -4.73*(1) Middle East Output -2.37(0) -4.83*(3) -4.60*(0) -5.07*(3) European Output -1.04(1) -5.68*(1) -3.74**(7) -5.21*(8) Asia Pacific Output -1.40(0) -5.68*(1) -4.78*(1) -4.77*(8)
ADF represents the Augmented Dickey-Fuller unit root test with trends for the original and the detrended series.
Asterisk,* represents 1% level of significance and ** represents 5% level of significance. For Lag length selection, SIC
Criterion was used. HP, BK and OC filter shows Hodrick Prescott, Baxter and King and Corbae and Ouliaris filters.
A.3 Hodrick and Prescott Filter
The HP Filter is applied to the trend-cycle component of each variable in order to extract the
stationary (cyclical) and non-stationary (trend) components. We do so using the definition of a
business cycle provided by Lucas (1977) and Kydland and Prescott (1990), stated as deviations of
aggregate real output from its long-term trend (a growth cycle). In order to examine the cyclical
aspects of remittances for instance, we first de-trend each series using the HP filter. The filter
decomposes a time series into an additive cyclical component and trend components.
For any series y the HP filter decomposes the trend (non-stationary) component represents the
long-run movements in the series, and the cyclical (stationary) component i.e.
arising from business cycle fluctuation. The HP filter removes smooth trends from some given data
by solving
∑, ( ) ( )-
∑, (
) (
)-
is the natural logarithm of the series at time t.
is the trend components at time t-
1, t , t+1. is the cyclical component at time . The first term (
) is the deviation from
trends over long time periods corresponds to cyclical components and is the object of economic
interest. The second term is the sum of squares of the growth components’ second difference, i.e.
smoothness of . λ is the smoothing parameter that reflects the relative variance of the two
components. The larger the value of λ the greater the smoothness. If λ =0 then the filtered series
is the original series, i.e. there is no smoothing.
If λ approaches infinity, then growth components correspond to a linear trend. We adopt the
value of λ =6.25 recommended by Ravn and Uhlig (2002). All the series are in logarithmic form
throughout our study, as we are concerned with percentage deviations from trends.

25
A.4 Band Pass Filters
Baxter and King (Time domain) Filter: Following Burn and Mitchell (1946), the classical
business cycle is defined as the sequential pattern of expansion and contraction in aggregate
economic activity. The Baxter-King (1999) filter is a band-pass filter that attempts to isolate
cycles with period lengths of between 1.5 and 8 years, which is the typical length of U.S.
business cycles. Any cycle lengths longer than 8 years are identified by the trend and the
remainder is consigned to the irregular component. The data is detrended using a band-pass filter
that leaves out all frequencies above 8 year and below 1.5 year. It can be shown that the exact
band pass filter is a double-sided moving average of the original series of infinite order and with
known weight. Moreover, Corbae-Ouliaris ideal (Frequency domain) filter are also used (Corbae
and Ouliaris, 2006) to extract the cyclical component of a series. Once the series is translated
from time domain to frequency domain, we can filter out all the components in a series, except
those that correspond to the selected frequency band (Bjornland , 2000). All variations in the data
with cycles between 1.5 and 8 years belong to the business-cycle component of the data, while
removing lower and higher frequencies. It follows the definition by Burns and Mitchell (1946)
that a business cycle is the fluctuation of real output with periodicity between 1.5 and 8 years.