Bird Wings
21
J. exp. Biol. (1981), 90, 143-162 TJ.3 With 8 figures Printed in Great Britain AN AERODYNAMIC ANALYSIS OF BIRD WINGS AS FIXED AEROFOILS B Y PHILIP C. WITHERS Department o f Biology, Portland State University, P.O. Box 751, Portland, Oregon 97207 (Received 5 March 1980) SUMMARY The aerodynamic properties of bird wings were examined at Reynolds numbers of 1-5 xio 4 and were correlated with morphological parameters such as apsect ratio, camber, nose radius and posit ion of maximum thickness. Th e many qualitative differences between the aerodynamic properties of bird , insect and aeroplane wings are attributable mainly to their differing Reynolds numbers. Bird wings, which operate at lower Reynolds numbers than aero- foils, have high minimum drag coefficients (o > o3-o-i3), low maximum lift coefficients (o-8-i - 2 ) an d low maximum lift/drag ratios (3-17). Bird and insect wings have low aerofoil efficiency factors (0-2-0-8) compared to conventional aerofoils (0-9-0-95) because of their low Reynolds numbers and high profile drag, rathe r than because of a reduced mechanical efficiency of animal wings. For bird wings there is clearly a trade-off between lift and drag perform- ance. Bird wings with low drag generally had low maximum lift coefficients whereas wings with high maximum lift coefficients had high drag coefficients. The pattern of air flow over bird wings, as indicated by pressure-distribution data, is consistent with aerodynamic theory for aeroplane wings at low Reynolds numbers, and with the observed lift and drag coefficients. INTRODUCTION The theory of animal flight can be better understood than the theory of many other aspects of animal energetics and locomotion, by making use of classical fluid dynamic and modern aerofoil theory. The fluid-dynamic basis for lift and drag applies equally to man-made and animal aerofoils, and our present understanding of bird flight is mostly derived from aerofoil theory with only some recourse to empirical data for birds (e.g. Pennycuick, 1969,1975; Tucker, 1968,1972, 1973; Weis-Fogh, 1973,1976; Greenewalt, 1975; Rayner, 1979). However, aerofoil data cannot be extrapolated directly to avi an and insect flight, but must be scaled accordingto the Reynolds num ber (Re). Bird wings generally operate at Re's below a critical transition range (io 4 - ! © 6 ), where lift and drag coefficients alter markedly (Von Mises, 1959; Hoerner, 1965; Hoerner & Borst, 1975)- Empirical studies of bird wings (Nachtigall & Kempf, 1971; Reddig, 1978; Nachtigall, 1979) and insect wings dramatically illustrate the aero- dynamic consequences of a low R e (see also Nachtigall, 1977; Jensen, 1956; Vogel, 1966).
-
Upload
scipione001 -
Category
Documents
-
view
219 -
download
0
Transcript of Bird Wings

8/6/2019 Bird Wings
http://slidepdf.com/reader/full/bird-wings 1/20
J. exp. Biol. (1981), 90, 143-162 TJ.3With 8 figuresPrinted in Great Britain
AN AERODYNAMIC ANALYSIS OF BIRD WINGS
AS FIXED AEROFOILSBY PHILIP C. WITHERS
Department of Biology, Portland State University, P.O. Box 751,Portland, Oregon 97207
(Received 5 March 1980)
SUMMARY
The aerodynamic properties of bird wings were examined at Reynoldsnumbers of 1-5 xio4 and were correlated with morphological parameterssuch as apsect ratio, camber, nose radius and position of maximum thickness.Th e many qualitative differences between the aerodynamic properties of bird,insect and aeroplane wings are attributable mainly to their differing Reynoldsnumbers. Bird wings, which operate at lower Reynolds numbers than aero-foils, have high minimum drag coefficients (o>o3-o-i3), low maximum liftcoefficients (o-8-i-2) and low maximum lift/drag ratios (3-17). Bird and insectwings have low aerofoil efficiency factors (0-2-0-8) compared to conventionalaerofoils (0-9-0-95) because of their low Reynolds numbers and high profiledrag, rather than because ofa reduced mechanical efficiency of animal wings.
For bird wings there is clearly a trade-off between lift and drag perform-ance. Bird wings with low drag generally had low maximum lift coefficientswhereas wings with high maximum lift coefficients had high drag coefficients.Th e pa ttern of air flow over bird wings, as indicated by pressure-d istributiondata, is consistent with aerodynamic theory for aeroplane wings at lowReynolds numbers, and with the observed lift and drag coefficients.
INTRODUCTIONThe theory of animal flight can be better understood than the theory of many other
aspects of animal energetics and locomotion, by making use of classical fluid dynamicand modern aerofoil theory. The fluid-dynamic basis for lift and drag applies equallyto man-made and animal aerofoils, and our present understanding of bird flight ismostly derived from aerofoil theory with only some recourse to empirical data forbirds (e.g. Pennycuick, 1969,1975; Tucker, 1968,1972,1973; Weis-Fogh, 1973,1976;Greenewalt, 1975; Rayner, 1979). However, aerofoil data cannot be extrapolateddirectly to avian and insect flight, bu t must be scaled accordingto the Reynolds num ber
(Re). Bird wings generally operate atRe's below a critical transition range (io4
-!©6
),where lift and drag coefficients alter markedly (Von Mises, 1959; Hoerner, 1965;Hoerner & Borst, 1975)- Empirical studies of bird wings (Nachtigall& Kempf, 1971;Reddig, 1978; Nachtigall, 1979) and insect wings dramatically illustrate the aero-dynamic consequences of a lowRe (see also Nachtigall, 1977; Jensen, 1956; Vogel,1966).

8/6/2019 Bird Wings
http://slidepdf.com/reader/full/bird-wings 2/20
144 P- C. WITHERS
The primary objectives of the present study are to investigate the basic aero-dynamic properties of isolated, fixed bird wings at their app ropriateMe, to determinehow the aerodynamic properties are affected by wing morphology, and to comparetheir performance with that of conventional aerofoils (working at highRe) and insect
wings (low Re). The basic aerodynamic measurements are: lift and drag coefficients atvarying angles of attack, minimum drag coefficient, m aximum lift coefficient, maximumlift/drag ratio, and aerofoil efficiency factor. The role of wing-tip slots, a complicationdue to bird wings being composed of many lam inated feathers, is considered elsewhere(P . C. Withers, in preparation) but basic aerodynamic data for a single primary featherfrom a black vulture are presented here as a comparison for the data concerningcomplete wings.
METHODS
Bird icings. Bird wings, dried in an appropriate gliding position, were used. Wingswere obtained from frozen birds or were borrowed from the ornithology collection ofthe Duke University Zoology Department. A brass rod was glued inside the humeruswith epoxy resin, and the rod was mounted directly on a force transducer assembly.Separation of the primary feathers did not occur for any species at positive angles ofattack. Only the hawk wing had wing-tip slots.
Wings from the following species were studied: European starling (Sturnidae;Stumus vulgaris); common nighthawk (Caprimulgidae;Chordeiles minor); chimneyswift (Apodidae; Chaetura pelagica); Leach's petrel (Hydrobatidae; Oceanodromaleucorhoa) ; bobwhite quail (Phasianidae;Colinus virginumus); wood duck (Anatidae;Aixsponsa); American Woodcock (Scolopidae;Philohela minor); red-shouldered hawk(Accipitridae; ButeO lineatus). The tip of a primary feather from a black vulture(Coragyps atratus) was also studied. Body mass and wing loading of these species are:starling, 0-0850 kg, 4-3 kg m"2; nighthawk, 0-064 kg, i" 9 k g rr r2 ; chimney swift,0-017 kg, 1-7 kg m~2; petrel, 0-027 kg, I - I kg m~2"> quail, 0-150 kg, 9-2 kg m~2; woodduck, 0-590 kg m~2; woodcock, 0-200 kg, 5-6kgm~~2; hawk, 0-550 kg, 3-3 kg m~2
(Poole, 1938; Hartman, 1961).The length of the wing, from tip to point of attachment at the humerus (i.e. wing
semi-span), was measured to the nearest millimetre and the projected wing area wascalculated by weighing tracings of the wing outline. Average wing cord (c) and aspectratio (AR) were then calculated as:
c = wing area/wing semi-span, AR = wing area/(wing semi-span)2.
Chord-wise cross-sections of the large wings were determined by cutting and fittingpaper templates to the upper and lower wing surfaces; for the small wings and vu lturefeather a three-dimensional micromanipulator was employed. These local cross-sections were used to calculate the average value for the wing of section chord tosection perimeter. The surface area of the wing ('wetted area') was then calculatedfrom the projected area and average ratio of wing chord/perimeter.
Wind tunnel. A Kenney Engineering Corporation model 1057 closed-circuit windtunnel (single return) was used. The working section was 0-26 x 0-30 m. The turbu-lence factor foi the wind tunnel was determ ined by measuring the drag coefficient ofadsphere (o-i m diam.) at differentRe (Pope & Harper, 1966). The drag coefficient of tht

8/6/2019 Bird Wings
http://slidepdf.com/reader/full/bird-wings 3/20
Bird wings as fixed aerofoils 145
sphere declined markedly atRe = i-6 x io6, hence the turbulence factor is quite low,at about 2-4.
Wind velocity in the tunnel was measured by using a pilot tube (United sensorPAC-12-ki) and a Barocell electric manometer (sensitivity =io~~* mmHg). Thestatic and dynamic pressure heads measured w ith the pitot tube were converted to airvelocity as described by Pope and Harper (1966).
Lift Idrag measurement. Lift and drag forces were measured by using two rectilinearstrain-gauge assemblies, with their movement axes mounted at 900. Each assemblywas composed of four strain-gauges for thermal stability. The strain-gauge assemblieswere mounted under the floor of the tunnel, and could be rotated through an angle ofabout ioo° with a motorized, rotating support. The lift and drag forces were calculatedtrigonometrically from the measured forces and the angle of rotation, since the wholestrain-gauge assembly rotated. The gauges were operated with a Beckman RSDynograph (type 462) with type 9802 strain-gauge couplers and416 B pre-amplifiers.The output signals were time-averaged over about 5 s using a Heath UniversalDigital Instrument EU-805. The strain-gauge assembly was calibrated daily by usinga o-o-i N Pesola scale. Lift and drag measurements were repeatable to ±0-002 N.
The bird wings were mounted vertically in the tunnel because the strain-gaugeassembly was located under the floor of the tunnel. This attitude did not affect theaerodynamic properties of the wing to a significant extent, but meant that the massof the wing was acting at 900 to its normal direction relative to the wing. However,the weight of the wing is generally small compared to the aerodynamic forces and canbe ignored. The wings were not mounted with the root flush against the tunnel wall(as model aeroplane wings are) because of technical difficulties. The wing root henceshed a vortex wake, and the pattern of air flow around the wing root was atypical.This might increaseCD\a , but would have little effect on minimumCD, or C c values.The most significant effect would be to underestimate aerofoil efficiency factor. How-ever, the data obtained with this mounting system do not indicate any significanteffects (see below). Standard wall interference factors for the wind tunnel werecalculated for a close-circuit, rectangular tunnel (Pope & Harper, 1966), bu t nocorrections were required except for the induced drag of the largest wing (red-shouldered hawk) which was adjusted for the proximity of the ground-plane.
The local angle of attack of the wing was measured at mid-span with a protractormounted on the top ofthe wind tunnel. Angle of attack varies along the wing, however,because of natural twist and aerodynamically induced bending.
Lift and drag coefficients(C L, C D) were calculated from the resolved forces using thestandard equations:
L = yv*scL, D = yv*scD,where p is the air density (1-18 kg m~3), V is the wind velocity (m s"1), 5 is the pro-jected area (m2), L and D are the lift and drag force (Newtons) andCL and CD are thedimensionless lift and drag coefficients. The term £pF2 (the dynamic pressure head)was measured with the pitot tube and electric manometer.
Pressure distribution. The pressure d istribution over the leading portion of the night-fcawk wing was measured at mid-span. Small (27-gauge) hypodermic needle tips wereforced through the rachis (central support of the fethers) in appropriate positions,

8/6/2019 Bird Wings
http://slidepdf.com/reader/full/bird-wings 4/20
146 P. C. WITHERS
Tab le 1. Morphometric parameters for bird wings and vulture primary feather, andmorphometrics of wing cross-section at approximately mid-span
(Thickness ratio = maximum thickness/chord; camber ratio= maximum deviation of centre of wingfrom line connecting leading and trailing edges; nose radius ratio= approximate radius of wing atleading edge /cho rd; twist is base totip twist angle.)
SwiftPetrelWoodcockWood duckQuailStarlingNighthawkHawkVulture primary
Length(m )
0-1410-2120-1710-257°'i450-1640-260O-3940-180
Projectedarea(m«)
0-0050-0116001370-02110-01090 0 0 8 80-01650-05220-00410
Wettedarea(m«)
0-01040-0240-0290-044002300350-0350 - I I 2
0-0086
AR
3 94'11 9
3 - ii - 8
3-o4 - i3 -0
7 9
Thicknessratio
0-0540-0480 0 5 3o- ioo0-0360-0360-0620 0 6 80-063
Camberratio
0 0 5 40-0650-0810-069.O-IOI
O - I I 2
0-0690-0990039
Nose Radiusratio
0-012o-on0-019O-O2O
0-019003200350-032~ o
Twist(degrees)
597
1 1
513
51 0
15
with the b lunt end of the needle flush with the upper (or lower) surface of the rachis.The bevelled end of the needle was pushed into thin-bore Polyethylene tubing (PE010 x 030), which was led under the secondary feathers to the base of the wing and outof the wind tunnel to the electric manometer. The needle was bentat the rachis toallow it to lie flush under the secondary feathers. This arrangement should resultinminimal aerodynamic interference with the wing. The pressure at each orificewas thenmeasured, and the values expressed in the standard manner:
where p' is the measured static pressure head at the orifice,p is the ambient dynamicpressure head and q is the ambient static pressure head (Pope& Harper, 1966).Classic lifting-line theory was used to evaluate many of the aerodynamic properties ofthe b ird wing, rather than lifting-surface theory. All units- areS.I.
RESULTS
Morphometrics. The ranges of various morphological parameters for the wingsstudied are shown in Table 1. Most of the wings were approximately ellipticalinplanform, although the hawk wing was the most rectangular and the wood duck wingwas the most tapered. The surface areas ('wetted' areas)of the wings were about2-04-2-14 times greater than the projected areas.
Lift /Drag . Th e absolute values of lift and drag (in Newtons) were dependent uponwind velocity although the general form of the lift-drag polar and the maximumlift/drag ratio were independent of velocity. All lift and drag data presented here areconverted to the lift and drag coefficients (C L = zL/(pV2S)\ C D = zD/^V^S)) tocorrect for variation in dynamic pressure head(^pV 2) and wing surface area(S). Thecorrection for dynamic pressure resulted in values ofCL and CD which were indep enden t of V over the narrow range of V used in this study. The aerodynamic forcesal

8/6/2019 Bird Wings
http://slidepdf.com/reader/full/bird-wings 5/20
Ta
le2Ln
a
q
acr
o
a
y
oh
a
o
micpo
eobrdwin
a
hv
u
pma
feh
paau
o
o
ha
eaaa
(a
a=c
a
a)6=
rod
em
a)c=s
od
ema)Vu
ax±ewhh
vu
o
hden
rmo
inp
nh
«sccuaedaITT A
$w
1shso
o
hC
C
r
o
a
esccuaeda4C {CC
»
A
e
S
e
Sw
n=4
Pr
»=4
Wo
k
(n=8
Wo
dk
(n=4
Q
n=6
San
(n=9
Nghw
(n=1
Hw
n=0
V
uePmay
(n= a
L
= a+ b
(a00
0
)
(600
0
67
to
—
(a0
19
(600
±0
UT)
to
-
(a00
±0
»«
(b
00
±0
18
to
-
(a— 00
±0
— o6
(600
±0
10
to
—
(aoo
±0
)
(60
3
to
-
(a00
45
(6oo
00
*o
to
—
(aoo
oo51
(600
0
43
to
-
(aoo
o266
(600
±
2
to
-
(a00
±0
20
(b
00
2
to
-
CD =
a+ b
+ ca*
00
±0
14
-0
5a
oo
o
16
0
±
1
00
±00
62
ooooo
73
oo
o
16
00
±o
o25
00
±oo
4°
00
±00
O"
— 0
±
0
—a4
00
±o
O)
00
±0
18
— 00
±
0
—2 '5
00
16
01
0
34
oo
±0
3
oo
o
19
OO
±00
38
— 00
±00
—7a
OO
OO
(16-9)
00
32
oo8
0
37
oo
oo
27
00
±o
o
52
OO
OO
O2
oo
o
74
C =O+IC
+C
0
0
1
01
0
—ia7
02
0
S
00
0
1
00
0
— 1a
03
±0
96
00
±0
a6
00
±0
—a
03
±0
12
01
±0
2
)
O4
O
1
o3
oO
87
00
±0
28
— 02
±0
— 1"
04
±0
37
-o5
5
15
o4
o
18
0
±
(3
— O-OI±0
— 1"
O2±OO
13
00
±0
a3
-o5
o7
88
05
27
00
±0
64
o7
o8— 97
02
0
n7
« 4 0 05
06
0 04
09
04
o5
« 05
0 o6
0 1"
0 i3
0 0
Bird to a

8/6/2019 Bird Wings
http://slidepdf.com/reader/full/bird-wings 6/20
148 P. C. WITHERS
Table 3. Profile drag coefficient, maximum lift coefficient, maximum lift/drag ratio,of lift cwve, and i/nARe for bird wings and vulture primary feather (tvith angle ofattack at mid-chord in parentheses for data from present study)
Species CD , 1 (.C L /C D ) M dd/da I/TT A R J Reference
SwiftPetrelWoodcockWood duckQuailStarlingNighthawkHawkVulture
primaryThrushSparrowDuckSnipePigeon models
0-030 (+ 1 )0-070 (0°)0-082 ( + 2°)0-096 ( + 1°)0-055 ( + 3°)0-125 (°°)00 51 ( + 30)O-074 ( + 2° )0-024 (°°)
0-050-16O - I I
O - I I
0-06-0-13
o-8o ( + 8°)o-88(+i3°)o-9o(+i5°)0-90 ( + 20°)I I 0 ( + 25°)i -oo ( + 150)1-15 (+15°)i-o ( + 250)I - I5 (+12° )
o-8I -O-I - I
0 9i - oO-8-I-2
17 ( + 5°)4-o( + 8°)3-5 ( + 8°)3-8 ( + 8°)6 0 ( + 8°)3-3 ( + 7°)9-o ( + 6°)3-8 ( + 6°)17 ( + 5°)
—32 - 8
o - i0 0 80-050-060-050-06o-o80-060-08
0-030-05o-o60-060-12-0-27
0-02 '0-320'330-16O-2I0-230 0 80-27007 /
Present study
°i3g 1 Nachtigall& Ken
0-34 Jo-330-1-0-7
Reddig (1978)Nachtigall (1979]
high wind speeds did not bend the wing sufficiently to alter the liftor drag coefficients.However, C L and C D would vary markedly over wider rangesof V (see Discussion).
The C L and C D of the various bird wings and the vulture primary feather alteredmarkedly at differing angles of attack (a) at mid-span; the C D -C L curves, C L, C D andCfJCD data are summarized in Figs. 1-3. The value of a was arbitrarily measured
only at mid-span, although the local a varied along the wing span because of inherentwing twist (see Table 1)and due to aerodynamic forces deforming (including twisting)the wing.
Aerodynamic parameters for the bird wings and vulture feathers were generallysimilar (Figs. 1-3; Tab les 2, 3) although there were many qualitative differences.Therelationship between C D and C L was generally U-shaped exceptat high a when C L
levelled off or even declined. Quadratic, best-fit equations were fittedto the C D -CL
data (excluding data at high a) since the relation is, in theory, parabolic. The curveswere often quadratic rather than parabolic (i.e. parabolicbut shifted from the originsince the minimum C D was not at zero lift; Figs. 1-3, Table 2). The C D varied with ain a parabolic fashion, and the quadratic best-fit equationsare presented in Table 2.The C L was usually linearat intermediate a and relatively constantat lower and highera. The best-fit linear equations for C L at intermediate a are summarized in Table 2.
The profile drag coefficient (ideally determinedas the minimum drag which occursat zero lift) was from 0-024t 0 ° ' I2 S but generally did not occur at the zero lift angle.The maximum C L values varied from about0-7 to 1-2 at a of 15-200 (Table 3). TheC L/C D ratio was often quite variable, reflecting the errors involved in lift and dragmeasurement, but C L /C D always increased from negative valuesat low a to maximalvalues ata of 5-80, then declined markedlyat higher a. T his is the expected form of therelation, but there is no theoretical equation so best-fit curves were obtainedby using10th degree polynomial equations to indicate the approximate relationship. Themaximum values for C L/C D ( = L/D) varied from 3-3 to 17 for the different wingsand vulture feather.
The aerofoil efficiency factor («) was calculatedin two ways. Firstly, e was calculated

8/6/2019 Bird Wings
http://slidepdf.com/reader/full/bird-wings 7/20
Co
0 - 5 -
n - 4 -
0 - 3 -
0 - 2 -
0 1 -
(a) Starling •
• • •
*• • • "• * J• *
•• •
.t" . . . -r'• M • •> • •
• • M • • ••* • • • •
-0 -3 0 0 0-3 0-6 0-9
1-6
1-2 -
CD
0 - 8 -
0-4 -
(b ) Hawk
J-"i r-0-4 0
1—
0-41—
0-8 1-2
C D
0-75 -
0-60 -
0-45 -
0-30 -
0 1 5 -
0-00 -
(c)QuaU
*
*•*
i—
•
;
•
• ••* •
—1 1 1
Co
0-30 •
0-25 •
0-20 •
0 1 5 •
0 1 0 •
C L
• 1 - 2
0
Y- 00
- lo>>
t# 7 •'
-r '•/•'vf 'J -»~«J ° g °• • OO
- 3
- 1 4 - 7 0 7 14
- 0
- - 1
C L/C D
-4 -5
- 3 0
-1-5
- - 1 - 5
15
C6
0-90k-
0-72
0-544-
0-36 •
0 1 8 -
0-00-
C L
• 1 - 2
• 0-8
• 0- 40
o •o V• 0 m °
-*r- +•
• -0-4
5
>
iV
•]/
i o 9 *oo i%6o
^ ^
^ 4
•'hi
t
9
O
K. Ci
/ ^ *
xx^
-7-2
- 5-4
- 3-6
- 1-8
- 0 0
- - 1 -
-0-30 000 0-30 0-60 0-90 1-20 -22-5
CL
0-0 22-5 37-5
Fig. 1. For starl ing , hawk and quail wings. Left: lift coefficient (Cx,) as a function of dragcoefficient (C D ). Right: lift coefficient (Ci), drag coefficient (C D), and lift/drag ratio (C L/C D )at differing angles of attack (a).

8/6/2019 Bird Wings
http://slidepdf.com/reader/full/bird-wings 8/20
8/6/2019 Bird Wings
http://slidepdf.com/reader/full/bird-wings 9/20
0-8 -
0-6 -
0 - 4 -
0 - 2 -
-0 -2 5 0 0-25 0-50 0-75
0-8 -
0-6 -
0-4 -
0-2 -
I I I I-0 -2 5 0 0-25 0-50 0-75
0 - 5 -
0-4 -
0-3 -
0-2 -
0 1 -
0 -
(c ) Vulture feather
•
•>
•• •• •
• •
• • • •
\ i r-0- 35 0 0-35 0-70 10 5
1-25 -
1-00 -
0-75 -
0-50 -
0 - 2 5 - -
0 -
30 45
CD
0 - 8 -
0-6 -
0-4 -
0 - 2 -
0 -
a
CL
- 1 - 2
- 0-8 *P*\IF
-0-4 U
-o J •;-/'
0-4
' cjc d
CJC D
- 5-4
- 3 - 6
-1-8
- 0
- -1-8
i i i r- 1 2 0 12 24 36 48
a
CD
0 - 6 -
0 4 -
0-2 -
0 -
CL
- 10
- 0-5
-o\
\
- - 1 0 •
V +
'A:/\cjc d
/ X
Ji \V'"' J Cd
CLICD
- 18
- 12
- 6
- 0
- - 6
i i i r-24 -16 - 8 0
a8 16
Fig. 3. For swift and petrel wings, and the tip of the vulture primary feather. Left: lift co-efficient (C[) as a function of drag coefficient (CD). Right: lift coefficient (C L), drag coefficient(CD), and lift/drag ratio (CL/CD) at differing angles of attack (a).

8/6/2019 Bird Wings
http://slidepdf.com/reader/full/bird-wings 10/20
152- 1 - 6 -
- 1 - 2 -
- 0 - 8 -
- 0 4 -
P. C. WITHERS
- 4 0
01 0-2I
0-3 0 4 OS x/c- 9 O
0-8 -
04 -
Bottom
x/c
- 1 O
- 0 4 -
-0-8 -
Fig. 4. Pressure distribution for the leading one half of the nightjar wing at mid-span, withdiffering angles of attack (<x).x/c indicates position of pressure measurement relative to thewing chord (c). P is the pressure at the flush orifice corrected for ambient static and dynamicpressure heads (see text).

8/6/2019 Bird Wings
http://slidepdf.com/reader/full/bird-wings 11/20
Bird wings as fixed aerofoils
Table 4. Lift and pressure drag coefficients calculated for the nighthawk icing from thepressure distributions at differing angles of attack (a), compared to values measured for thewing using force transducers assuming skin friction drag coefficient was0-02, and calcu-
lating induced drag as measured CL/TTKK (0-9)
a
- 8- 4+ a+ 7+ 20
Calculated
cL— 0 - 4 6- 0 1 3
o-440 7 60 6 6
Measured
cL— 0 - 4 0— 0 - 1 8
0 - 2 9o-6oI - I
Calculated
0-060-040-030-060-18
MeasuredCi>,m
o-o80-060-040-040-28
from a regression of CD and CL since the theoretical slope of this relationship isI/(TTAR<?) and the intercept is the profile drag coefficient (Greenewalt, 1975). Thevalues of e were also calculated from the (C L/C D)max value since e = \C D, p r o
(C i/CD)2m ax/(7r AR) (Greenewalt, 1975). The values ofe were in reasonable agree-
ment using the two different methods, and generally ranged from 0-3 to o-8 (ignoringthe unreasonable values > 1).
Pressure distribution. The pressure distribution (expressed asP, corrected for dyna-mic and static pressure head) over the m id-span of the nightjar wing altered markedlyat differing a (Fig. 4). The values forCL and CD can be calculated from these distri-bution data (Pope& Harper, 1966). Only the pressure for the leading one-half of the
wing section was measured, but this is the most important in terms of lift and drag, soapproximate calculated values for CL and CD are presented in Table 4. Theseestimated CL and CD values are in general agreement withCL and CD values measuredfor the whole wing.
DISCUSSION
The lift and drag characteristics of bird wings and the vulture feather resemble, ingeneral form, those of conventional (man-made) aerofoils (e.g. Von Mises, 1959;Hoerner, 1965; Pope & Harper, 1966; Hoerner & Borst, 1975), other bird wings(Nachtigall & Kempf, 1971; Reddig, 1978; Nachtigall, 1979) and insect wings (Jensen,1956; Vogel, 1966; Nachtigall, 1976). However, there are significant quantitativedifferences between the aerodynamic performances of conventional aerofoils, birdwings, and insect wings. The following discussion relates how these differences areattributable to variation in wing morphometrics and air-flow regime (i.e.Re).
Aerodynamic drag. The minimum drag coefficients measured here for the bird wingswere from 0-03 to 0-13, with the primary feather tip of a black vulture having a dragcoefficient of 0-024. These drag coefficients are similar to those measured for otherbird wings, or parts of bird wings, or models of bird wings. Minimum drag coeffi-cients for insect wings are similar or higher: locust forewing 0-024; locust hind wing,0-06 (Jensen, 1956);Drosophila wing 0-3 (Vogel, 1966). These values for bird andinsect wings are considerably higher than those for conventional aerofoils, whichtypically have minimum drag coefficients of less than o-oi. As will be shown below,
se marked variations in minimum drag coefficient for insect, bird and man-madeigs do not necessarily reflect different wing morphology or function but simply the
Re at which they operate.

8/6/2019 Bird Wings
http://slidepdf.com/reader/full/bird-wings 12/20
154 P. C. WITHERS
l - l
0 1 -
0 0 1 -
0001102 104
I10*
110'
Re
Fig. 5. Drag coefficient (CD) for bird wings and vulture primary feather (solid circles), insectwings (open circles, belowRe = io ' ) and other aerofoils (open circles) expressed relativeto'wetted area' (see text). Solid linesare for calculated skin friction drag coefficients, with tran-sition from laminar to turbulent shown by broken lines. Vulture primary feather is solid circleclosest to line for laminar skin friction drag coefficient. Insect wing data are from Jensen (1956)and Vogel (1966); other aerofoil data from Tucker & Parrott (1970).
There are three basic components of aerodynamic drag: skin friction drag (dragcoefficient = C DJ ), pressure drag (CDiVTe) and induced drag (CDiln). The first twodrag terms are generally combined intoa single term, profile drag(C Dt p r o).
Skin friction depends upon the Re, and whether flow is laminar or turbulent. Forlaminar flow,
C Dif = 1-33/ yjRe (Blasius' equation),
whereas the relationship for turbulen t flow islog (Re.CDtf) = 0-24/ *JC Dtf (Schoenherr's equation)
(see Hoerner, 1965). Transition from laminar to turbulent flow usually occursspontaneously at Re of I O ' - I O 6 but transition can be forced to occur at lower Re (andalso occurs immediately after the thickest section of an aerofoil at low Re). LaminarC Dtf ~ turbulent C Df in the range of Re applicable to bird wings (Fig. 5). Theminimum values for C D of bird wings are generally greater than the estimated skinfriction drag coefficient, although the drag of the vulture primary feather is only
slightly greater than the predicted skin friction drag (Fig. 5). (Note that theC D valuesin Fig. 5 are expressed relative to 'we tte d ' area, rathe r than the projected area becauseit is 'wetted' area, not projected area, that determinesC Dtf .) The vulture feather, notunexpectedly, had the drag coefficient most similar to its skin friction drag becauseit isthe 'cleanest' aerodynamic shape.The C D values of insect wings are also only a littlegreater than the predicted skin frictionC D (Fig. 5). Aeroplane wings, which o p e r a t ^much higher Re, have correspondingly lowerC Dif (Fig. 5).

8/6/2019 Bird Wings
http://slidepdf.com/reader/full/bird-wings 13/20
Bird zvings as fixed aerofoils
0 1 -
CD
0-01 -
0-001
104 10 s 10*I
107 10*Re
Fig. 6. Dr ag coefficient (Cz>) for bird win gs and v ultu re pri ma ry feather tip at differingRey nold 's nu mb ers , expressed relative to projected area, compared w ith values for conventionalaerofoils of thickness ratios from 006 to 0-5, and compared to calculated skin friction dragcoefficients for laminar and turbulent flow. Aerofoil data from Hoerner (1965).
0-4 - ,
0-3 -
CD
Su b
Aerofoil
0-2 -
0 1 - Super
0 1 0-2 0-3 0-4 0-5
Thickness, Camber
Fig. 7. Total drag coefficient (Cp) for bird wings as a function of camber, and total drag co-efficients for conventional aerofoils at subcritical and supercriticalRe as a function of thickness.Magnitude of skin friction drag is indicated by stippled area. Aerofoil data are from Hoerner(196s).
The pressure drag coefficient is determined by the magnitude of the turbulent wakeleft behind an object, and hence is lowest for streamlined bodies with delayed separ-tion. The CDi p re is experimentally determined as C DiPT0 — C Dif . Pressure dragbecomes relatively more important than skin friction to total drag at highRe since skin
friction is reduced. Separation of air flow is delayed at highRe by boundary layerturbulence, and this is reflected by a dramatic decrease inCDt p r e (or CD pro) at Reabove a critical level, about io8 (Fig. 6). Conventional aerofoils, which usually operateabove this critical Re, have a much lower drag than bird and insect wings. However,
wings have higher drag coefficients (Fig. 7) than aerofoils at equivalentRe (belowcritical range), perhaps reflecting the surface roughness of bird wings and the
tendency of individual feathers to flutter and increase drag, or wing twist (see below).

8/6/2019 Bird Wings
http://slidepdf.com/reader/full/bird-wings 14/20
156 P . C. W I T H E R S
Tab le 5. Multiple linear regression analysis for aerodynamic parameters as a function ofmorphom etric parameters, showing significantly correlated parameters {and r-values) and
presenting the multiple linear regression equation (n = 9 for all analyses)
Aerodynamic Multipl e linear regressionparameter Correlated morphometric parameters equations
CD, pro A R = aspect ratio (r = -0-54) CD pro = —00074 + 0-969 (j/c)f/c = camber (r = 0-71)r/c = nose radius (r = 0-57)
CL, mi! */ = position max. camber (r = 0-67) C t , M I = 1-24 — 0-55 (x f)
L/D nun AR = aspect ratio (r = 0-72) L/D mMI = 21-4 — 181 (f/c)f/c = camber (r = 0-74)r/c = nose radius (r = 0-57)
dCL,/dct f/c = camber (r = 0-70) dCh/da. = 0-105-0-48 (f/c)AR
=aspect ratio
(r = 052)dC D /dC L ' AR = aspect ratio (r = 0-62) dC D /dC L
x = 0-326-0032 (AR)
The profile drag coefficient, although markedly influencedby Re, is also dependentupon the thickness of the wing, particularly at low Re when flow separation occursimmediately after the thickest or most cambered portion of the wing. This is clearlyshown by the relationship between C Oj pro and thickness (or camber) for bird wingsand aerofoils at subcritical and supercritical Re (Fig. 7). The C Dt pro of different birdwings was correlated with aspect ratio, camberand nose-radius (Table 5). Camberwould be expected to have the same effect as thickness in determining the point offlow separation, the magnitude of the turbulent wake,and the drag coefficient. Indeed,camber was the morphological parameter which best predictedC Dt p ro using multiplelinear regression analysis (Table5).
Induced drag arises from the deflection of air by a wing; C Dt ln is related to the liftcoefficient and aspect ratio as:
Induced drag is dependent upon aspect ratio sincethe angle through which air mustbe deflected to produce a given change in momentum (hence lift) increasesas aspectratio decreases. Induced dragis also dependent upon morphological parameters suchas wing planform (elliptical wings havethe lowest C Di ln) and wing twist. Wing plan-form only slightly altersC Dt ln and can be ignored for bird wings, which tend to beelliptical in planform. Wing twist, however,can markedly increase C Dt ln by simul-taneously producing positiveand negative lift (which algebraically cancelout so C L islow) but drag is high since the induced drags from positive and negative lift addtogether, rather than cancel. Suchan effect of wing twist on C Di In is seen in the aero-
dynamic data not as induced drag, bu t as an apparently high profile drag coefficient.The high twist of bird wings thus contributes to their high C Di pro and probablyexplains why the minimum drag coefficients were oftennot observed at the angle ofzero lift.
Induced drag of wings is usually greater than calculated as Cjf/nAR even fqjelliptical, untwisted wings becausea wing is not a perfectly efficient device.An a er ^
8/6/2019 Bird Wings
http://slidepdf.com/reader/full/bird-wings 15/20
Bird ivings as fixed aerofoils 157
roil efficiency factor (e) is therefore introduced into the equation relatingCDi ln and
^ D, In "— *-̂ £ / / / x i l x c .
Values for e calculated for bird wings generally were from 0-3 to o-8, with valuesgreater than 1 discounted as experimental error or improper calculation. For conven-tional aerofoils, e is typically 0-9-0-95. The interpretation ofe for bird wings is some-what different from that for aerofoils at highRe (see below).
In summary, the drag of bird wings is considerably greater than that of conventionalaerofoils for a variety of reasons. Skin friction drag is higher because of the lowerRe,and whether air flow over bird wings is laminar or turbulent makes little difference tothe value for skin friction drag. Pressure drag is high for bird wings because theRe issubcritical and so separation occurs immediately after the thickest part of the wing; italso appears to be high because bird wings are twisted. Feathers may also result insome additional drag compared to a smooth aerofoil. Induced drag appears to begreater for bird wings, which have lower aerofoil efficiency factors. Insect wings,which operate at lowerRe than bird wings, have even higher drag coefficients despitetheir 'cleaner' aerodynamic shapes, because of higher skin friction drag.
Aerodynam ic lift. The lift coefficient for bird wings varied from about —0-4 toabout +1-2 for the various species, depending upon the angle of attack. This issimilar to the CL values noted elsewhere for bird wings, parts of wings, or models(Table 3), and also for insect wings (Jensen, 1956; Vogel, 1966). The slope of the
relationship between CL and a (i.e. the lift curve slope,dCL/da) was about 0-05-0-10for the bird wings. Other values for bird wings are from 0-03 to 0-23 (Table 3) anddata of Jensen (1956) and Vogel (1966) yield values of about 0-04 for insectwings. Thelift coefficient of a thin aerofoil is, in theory,
CL = 2?r sin a. ,
where a is the angle of attack (Hoerner& Borst, 1975). The lift curve slope is calcu-lated as:
dCL/da = 27r2/i8o = o-n
(Hoerner & Borst, 1975). However, many factors influence boundary layer adherenceto a wing, and hence alter the lifting characteristics of real (and non-thin ) wings. Suchfactors include cross-sectional shape of the wing, shape of the leading and trailingedges, thickness, camber and Re.
Lateral flow of air around wing tips is also of significance to aerofoils of low aspectratio (< 5) such thatdCL/da is higher ( = 0-5 x AR u p to a maximum of about 0-27;Hoerner & Borst, 1975). However, values fordCJda of the bird wings were usuallyless than or equal to o-i (Table 2). ThedCL/da for bird wings may have been u nder-estimated slightly since the CL-a relationship often appeared to be S-shaped (sig-moidal) but a linear regression was used to estimate the mean slope.
The maximum lift coefficient of aerofoils is predicted to be:
fcloerner & Borst, 1975). However, actual values ofCLi m a x are only 10-20% of thepredicted values, even for conventional aerofoils with extensive boundary layer con-

8/6/2019 Bird Wings
http://slidepdf.com/reader/full/bird-wings 16/20
158 P. C. W ITH ER S
trol. Bird wings had even lowerCLi m a x than conventional aerofoils. TheCLi m a x OTaerofoils decreases atRe less than about io6 because the progressive increase in thick-ness of the boundary layer along the wing chord promotes flow separation near theleading and trailing edges (Hoerner & Borst, 1975). Th is propensity for boundary
layer separation limitsCLt max to low values at Re < io5
for both bird wings (Figs.1-3) and other aerofoils.The values of C L> m a x of bird wings measured in the wind tunnel were quite low
( ^ 1-2). Similar values ofC Lmax for bird wings are reported elsewhere (Table 3).This is in marked contrast to calculated or estimated values ofCLt m a x for birds orbird wings for gliding or flapping flight (Tucker & Par rott, 1970; Weis-Fogh, 1973;Norberg, 1975). However, Norberg (1976) calculates lower values which are moreconsistent with steady state for hovering bats, of about1-4-1-6. Such high Ci>maxvalues are not consistent w ith steady-state aerodynamics, either for the measured bird
wings or conventional aerofoils at lowRe. The body and tail of birds probably con-tributes some lift (hence CL based only on wing projected area is overestimated).Separation of primary feathers during the wing stroke may increase the effectiveaerofoil area, hence use of the wing projected area would also overestimate the actualCL (see P. C. Withers, in preparation). Further, non-steady state aerodynamics havebeen shown to yield higherCLt m a x values in some instances (W eis-Fogh, 1973, 1976).
Morphological parameters, such as camber and leading-edge shape, can also affectCL, max- T h e CL. max f ° r bird wings was correlated with the position of maximumthickness, such that wings with the point of maximum thickness near the leading edgehad the lowestCLt m a x. The CLi m a x of bird wings (but not the vulture primary feathertip) was also correlated with camber (r = 0-52), as would be expected.
The CL of conventional aerofoils decreases dramatically at high a, but this is not sofor conventional aerofoils or bird wings at lowRe. A high CL at large a is of signifi-cance to birds during landing, when the wing may be' stalled' at high a, with a con-sequently high drag to decelerate the bird, without reducingCL. No special p ropertiesof bird wings are required to explain this lack of wing stall at high a, although Vogel(1966) suggests that insect wings are specially adapted to maintain highCL after'stall ' .
Lift/drag ratio. The CL of bird wings determines the angle of attack and windvelocity required for horizontal flight. TheCD determines the power required forflight (power = drag force x velocity). Th e lift/drag ratio(C L/C D = L/D) reflectsthe performance of the aerofoil, i.e. its aerodynamic 'cleanness' and glide angle. TheC L/C D of bird wings was maximum at small, positive a (and at lowCL values);(CL/CD)ma x ranged from 3-3 for the starling wing to about 17 for the swift wing andvulture primary feather. Conventional aerofoils typically haveC L/C D ratios of 20 ormore, at high Re, but (C L/C D)mStX is much lower at Re's similar to those of the bird
wings (Pope & Harper, 1966). The (C L/C D)m&x of moth, butterfly and Drosophilawings is even lower (2-4) than that of bird wings because of their very lowRe (Vogel,1966; Nachtigall, 1976), although it is about 8-10 for locust wings (Jensen, 1955). It isclear that the (C£ /C D )m a x, like many other aerodynamic parameters, is markedlydependent upon Re.
Aerofoil efficiency factor.The aerofoil efficiency factor,e (or Monk's span factor,
8/6/2019 Bird Wings
http://slidepdf.com/reader/full/bird-wings 17/20
Bird wings as fixed aerofoils j eg
Woerner and Borst's factor, a' ; Tucker's correction factor, R) is a correction factorapplied to the induced drag coefficient;
The value of e indicates the efficiency of the wing in deflecting air in order to producelift. The theoretical value ofe i9 i for elliptical, untwisted wings, but is generally0-9-0-95 for conventional aerofoils. The value ofe is often assumed to be high for birdwings (i-o by Pennycuick, 1969; 0-9 by Tucker, 1973) although estimates for birdsare from 0-5-0-7 (Greenewalt, 1975).
It proves to be much more difficult to determinee for a bird wing than for a con-ventional aerofoil, and the meaning is quite different. Greenewalt (1975) states that iti9 possible to determine bothe and CDi p ro by plotting C L*/n AR against CD j total sincethe result is a straight line whose slope is i/e and intercept isC DpT0 . However, this
assumes that CDt p ro is independent ofC t, CD and ct. In fact, the relationship betweenCJ^/TTKR. and CD i t ^ i 1 S clearly not linear and great care is required in selecting therange of CDi total u s e d t 0 estimate e since the slope is low (ande is high) at low a, andthe slope is high (and e is low) at greater a.
Values of e calculated in this study by two different methods were generally from0-3 to o-8, but some values were unreasonably high. Furthermore, values ofe for birdwings, are not simply an efficiency factor for the following reason.CDi p r0 is a signifi-cant portion of total drag, for bird wings, and CDi p ro will change at differing a. Thus,CDi wtai alters by more than the change in induced drag, and includes not only themechanical efficiency term but also the change inC D< p ro at differing a. Th is is not thesituation for conventional aerofoils at highRe since CDf p r o is a less significant pro-portion of CDi total an<^ ' more closely approximates a mechanical efficiency factor(C DtPro also changes with a for conventional aerofoils, but it is still relatively in-significant relative to C Di ln ). Values of e for insect wings range from about 02(Drosophila) to 0-5 (Schistocerca) (calculated from data of Jensen, 1956; Vogel, 1966).Similarly, the value ofe for a flat plate atRe = 4 x io4 is low, at about 0-4 (calculatedfrom data in Hoerner, 1965). It is therefore of little intrinsic value to calculatee forbird wings for this reason, except for the sake of having a value for substitution into
various equations.It is possible that the m anner of mounting the wing used here (no end-plate or wall
boundary as a reflecting plane) overestimated theCD at high a. However, the values ofi/nARe calculated for bird wings from other studies are also quite low (Table 3;i/nXRe could not be converted to e since AR was often not given). Furthermore,Nachtigall (1979) used a double end-plate system which approximates a wing ofinfinite span, so induced drag should be o (Von Mises, 1959). Nevertheless, there wasclearly a marked increase inCD at high a, indicating thatCDt ln is a small fraction ofthe increase in CD\ CDt p ro being the most important.
Pressure distribution. The pressure distribution over the nightjar wing (Fig. 4) wassimilar to that over a conventional aerofoil (Harper & Pope, 1966; Hoerner& Borst,19-75), with a pronounced suction peak forming on the upper, leading edge at a ofc-90. This suction peak diminished at lower and highera. A positive pressure
^veloped on the lower wing surface at moderate to higha (^ 20) whereas a suction
6-2
8/6/2019 Bird Wings
http://slidepdf.com/reader/full/bird-wings 18/20
i 6 o P. C. WITHERS
-2°> • — i
+7°
+20°
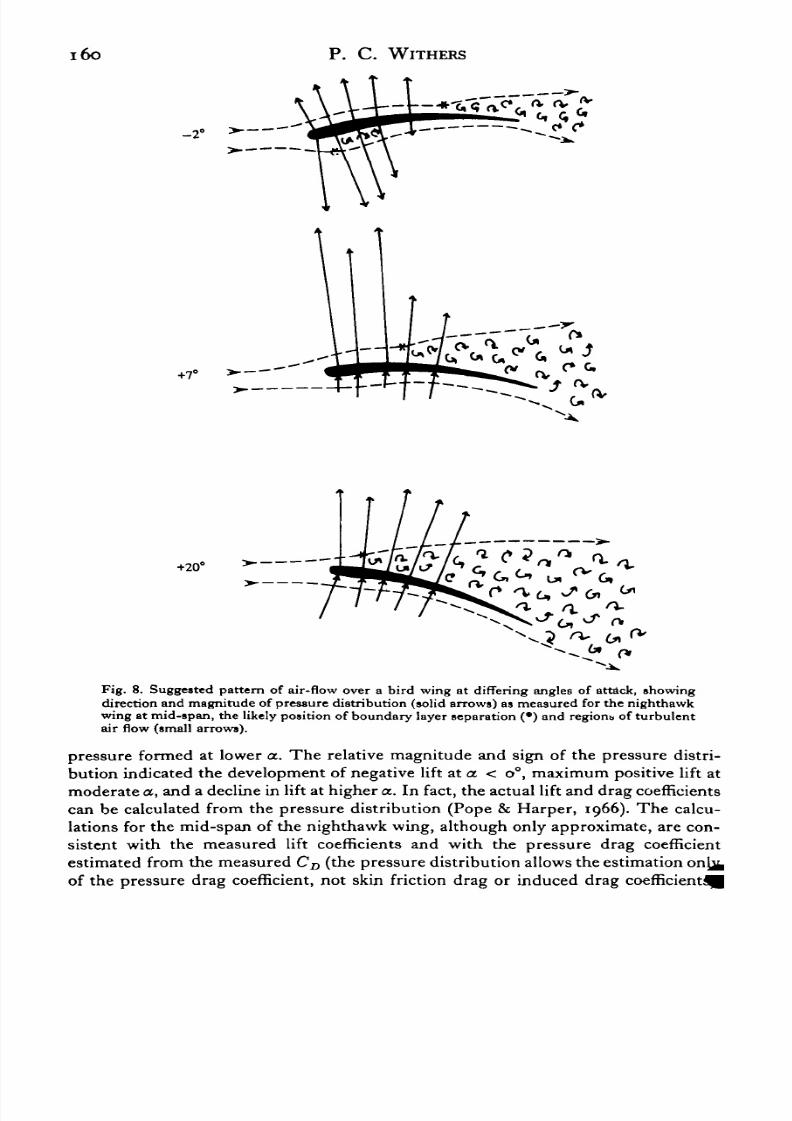
Fig. 8. Suggested pattern of air-flow over a bird wing at differing angles of attack, showingdirection and magnitude of pressure distribution (solid arrows) as measured for the nighthawkwing at mid-span, the likely position of boundary layer separation (•) and regions of turbulentair flow (small arrows).
pressure formed at lower a. The relative magnitude and sign of the pressure distri-bution indicated the development of negative lift ata. < o°, maximum positive lift at
moderate a, and a decline in lift at higher a. In fact, the actual lift and drag coefficientscan be calculated from the pressure distribution (Pope & Harper, 1966). The calcu-lations for the mid-span of the nighthawk wing, although only approximate, are con-sistent with the measured lift coefficients and with the pressure drag coefficientestimated from the measuredCD (the pressure distribution allows the estimation onjjfcof the pressure drag coefficient, not skin friction drag or induced drag coefficient^

8/6/2019 Bird Wings
http://slidepdf.com/reader/full/bird-wings 19/20

8/6/2019 Bird Wings
http://slidepdf.com/reader/full/bird-wings 20/20
162 P . C. WITHERS
NACHTIGALL, W. (1977). Zur Bedeutung der Reynoldszahl und der damit zusammenhangendSPstromungsmechanischen Phanomene in der Schwimmphysiologie und Flugbiophysik.Fortschr.Zool. 24, 13-56.
NACHTIGALL, W. (1979). Der Taubenflugel in Gleitflugstellung; Geometrische Kenngroflen derFlugelprofile und Luftkrafterzeugung.J. Ornithol. iao, 30-40.
NACHTIGALL, W. & KEMPF, B. (1971). Vergleichende untersuchungen zur flugbiologischen Funktiondes Daumenfittichs (Alula tpuria) bei Vogeln. I. Der Daumenfittich als Hochauftriebserzeuger.Z.Vergl. Phytiol. 71, 326-341.
NORBERG, U. M. (1975). Hovering flight in the pied flycatcher(Ficedula hypoleuca). In Swimming andFlying in Nature (ed. T. Y.-T. Wu, C. J. Brokaw and C. Brennen). New York: Plenum Press.
NORBERG, U. M. (1976). Aerodynamics, kinematics, and energetics of horizontal flapping flight in thelonged-eared bat Pleeotus auritta.J. exp. Biol. 65, 797-212.
PENNYCUICK, C. J. (1969). The mechanics of bird migration.Ibis 114, 178-218.PENNYCUICK,C. J. (1975). Mechanics of flight. InAvian Biology (ed. D. S. Fam er, J. R. King and K. C.
Parkes), pp. 1076. New York: Academic Press.POOLE, E. L. (1938). Weights and wing area of 143 species of Nor th American bird s.Auk 55, 511-517.POPE, A. & HARPER, J. J. (1966). Low Speed Wind Tunnel Testing.New York: Wiley.RAYNER, J. M. V. (1979). A new approach to animal flight mechanics.J. exp. Biol. 8o, 17-54.
REDDIG, E. (1978). Der Ausdrucksflug der Bekassine(Capella gallinago gallinago). J. Ornithol. 119,357-387-
SCHLICTING, H. (1966). Boundary Layer Theory.New York: McGraw-Hill.TUCKER, V. A. (1968). Respiratory exchange and evaporative water loss in the flying budgerigar.J. exp.
Biol. 48, 67-87.TUCKER, V. A. (1972). Metabolism during flight in the laughing gull,LOTUS atricilla. Am. J. Physiol.
34, 841-846.TUCKER, V. A. (1973). Bird metabolism during flight: evaluation of a theory.J. exp. Biol. 58, 689-709.TUCKER, V. A. & PARROTT, G. C. (1970). Aerodynamics of gliding flight in a falcon and other birds.J.
exp. Biol. 5a, 345-367-VOOEL, S. (1966). Flight in Drosophilia. II I. Aerodynamic characteristics of fly wings and wing models.
J. exp. Biol. 46, 431-443.
VON MISES, R. (1959). Theory of Flight. New York: Dover Publications.WEIS-FOGH, T . (1973). Quick estimates of flight fitness in hovering animals, including novel mechanismsfor lift production.J. exp. Biol. 59, 169-230.
WEIS-FOGH, T. (1976). Energetics and aerodynamics of flapping flight: a synthesis. InInsect Flight(ed. R. C. Rainey). Blackwell Scientific Publ.Symp. Royal Ent. Soc.7, 48-72.