Bioteknologi| vol. 14| no. 1 May2017| ISSN: 0216 6887 E ...
28
| Bioteknologi | vol. 14 | no. 1 | May 2017| | ISSN: 0216‐6887 | E‐ISSN: 2301‐8658 | Microbiology photo by Cappucciono‐Sherman
Transcript of Bioteknologi| vol. 14| no. 1 May2017| ISSN: 0216 6887 E ...
| Bioteknologi | vol. 14 | no. 1 | May 2017|| ISSN: 0216‐6887 | E‐ISSN: 2301‐8658 |
Microbiolog
y ph
oto by
Cap
pucciono
‐She
rman
| Bioteknologi | vol. 14 | no. 1 | May 2017|
ONLINE
http://smujo.id/bbs
p-ISSN 0216-6887
e-ISSN
2301-8658
PUBLISHER Society for Indonesian Biodiversity
CO-PUBLISHER
Universitas Sebelas Maret, Surakarta, Indonesia
OFFICE ADDRESS Department of Biology, Faculty of Mathematics and Natural Sciences, Universitas Sebelas Maret.
Jl. Ir. Sutami 36A Surakarta 57126, Central Java, Indonesia. Tel./Fax.: +62-271-663375, email: [email protected], [email protected]
PERIOD OF ISSUANCE
May, November
EDITOR-IN-CHIEF Suranto – Universitas Sebelas Maret, Surakarta, Indonesia
MANAGING EDITOR
Ari Pitoyo – Universitas Sebelas Maret, Surakarta, Indonesia
ASSOCIATE EDITOR Ahmad Dwi Setyawan – Universitas Sebelas Maret, Surakarta, Indonesia
EDITORIAL BOARD Artini Pangastuti – Universitas Sebelas Maret, Surakarta, Indonesia
Asish Kumar Parida – CSIR-Central Salt & Marine Chemicals Research Institute, Bhavnagar, India Brijmohan Singh Bhau – CSIR-North-East Institute of Science & Technology (CSIR-NEIST), Jorhat, Assam, India
Ghulam Nabi – Institute of Hydrobiology, the Chinese Academy of Sciences, Wuhan, China Heru Kuswantoro – Indonesian Legumes and Tuber Crops Research Institute (ILETRI), Malang, Indonesia
Indrastuti A. Rumanti – Indonesian Center for Rice Research (ICRR), Sukamandi, Subang, Indonesia Mallappa Kumara Swamy – Universiti Putra Malaysia, Malaysia
Martin Mkandawire – Cape Breton University, Nova Scotia, Canada Megga Ratnasari Pikoli – Universitas Islam Negeri (UIN) Syarif Hidayatullah Jakarta, Indonesia
Mohammed Arifullah – Universiti Malaysia Kelantan, Jeli, Malaysia Saifeldin A. F. El-Nagerabi – College of Arts and Sciences, Nizwa University, Nizwa, Oman
Yosep Seran Mau – Universitas Nusa Cendana, Kupang, Indonesia
Society for Indonesian Biodiversity
Universitas Sebelas Maret Surakarta, Indonesia
BIOTEKNOLOGI ISSN: 0216-6887 Volume 14, Number 1, May 2017 E-ISSN: 2301-8658 Pages: 1-8 DOI: 10.13057/biotek/c140101
Antifungal evaluation of some leaves extracts and fungicide against Fusarium oxysporum f.sp. lycopersici causal agent wilt of tomato
AMANI OSMAN ABDALAL OSMAN, IBRAHIM SAEED MOHAMED♥ Department of Plant Protection, College of Graduate Studies, Sudan University of Science and Technology, Shambat, Khartoum, Sudan. ♥email:
Manuscript received: 12 September 2016. Revision accepted: 11 April 2017.
Abstract. Osman AOA, Mohamed IS. 2017. Antifungal evaluation of some leaves extracts and fungicide against Fusarium oxysporum f.sp. lycopersici causal agent wilt of tomato. Bioteknologi 14: 1-8. Fusarium-wilt caused a serious attack in tomato, and it considers as a crop threatening disease of the worldwide. The research was conducted to study the anti fungal activity of various aqueous leaves extracts, i.e., peppermint, sweet basil plants and river red gum, beside fungicide Revus top® on the growth of the fungi Fusarium oxysporum f.sp. lycopersici, a causal agent of wilt in tomato. In addition to untreated-control, the experiment took three levels concentration for each aqueous plant extracts, i.e., 25, 50 and 100% and fungicide to be applied in tomato and investigated their inhibitory effects in retarding the fungal growth percentage. The result revealed that despite the inhibitory effect of fungicide against the fungal growth was more dominant which range from 83.2% to 100% (no growth was recorded), all level concentration of aqueous leaves extracts of the three test plants have significantly inhibited the growth of Fusarium test compared to control treatment. Over the course of the experiment, aqueous extracts of river red gum exposed relatively high inhibition zone (44.1, 53.1 and 53.1%) followed by sweet basil (36.8, 51.5, and 54.4%) and peppermint aqueous extract as well (35.5, 39.6 and 39.6%) respectively. There is a common preference that the highest concentration of the plant extracts (peppermint, sweet basil, and river red gum 100%) and fungicide (100%) gave significantly highest inhibition zones percent (41.9%, 48.5%, 39.3%, and 99.3%) respectively compared to the untreated control. The results showed that the increase of the dosage of aqueous leaf extracts would consistently increase their antifungal activity. Apparently, the test fungus differs in its response to the different concentrations, but on the whole, growth inhibition increased with the concentration. The current results were considered promising and encouraging to carry out a phytochemicals analysis of different parts of river red gum plant using different solvents so to determine the bioactive ingredient in each of these parts.
Keywords: Antifungal, plants extracts, fungicide, Fusarium oxysporum, tomato wilt
INTRODUCTION
Tomato (Lycopersicon esculentum Mill.), a member of the family Solanaceae is an important crop plant in providing human nutrition. The plant is considered originated from South America, and it distributed to Europe in the 16 th century, then widespread around the globe (Rick 1977). Like other Solanaceae members such as potato, eggplant, pepper, tobacco, tomato etc., positioned as an important cultivated-crop plant by supplying essential amino acid, vitamins, and minerals (Sainju et al. 2003). Regarding it rich in vitamin C content (Kanyomeka and Shivute 2005) and antioxidant substances such as lycopene, the tomato has also been believed as important fruit for preventing and combating cancers (Agarwal and Rao 2000). The pleasant flavor, its nutritive value, easy to cultivate, and the ability to fruit in a broad range environment are the reasonable factors positioning tomato as a popular vegetable plant in many countries. The estimated annual production of tomato was 95 million Mt globally (FAO 2002).
Sudan is home for tomato cultivation, and the farm occupies an area exceeds 36540 hectares. Under good irrigation, the area has supplied tons of tomato per hectare throughout a year and gave significant benefit for local
consumption and export purposes (AOAD 2007; Dawelbeit et al. 2010).
The promising value of tomato was hampered by the fact that the crop was threatening by several diseases. These conditions have given a negative impact on the growth and the total production worldwide. Among these, the wilt caused by pathogenic fungi, Fusarium, remain challenging task in term of best management to overcome the disease (Rick 1976; Agrios 2000; Srinon et al. 2006). Fusarium oxysporum f.sp. lycopersici (Sacc.) W. is a fungus specifically infect tomato plant and gave a significant loss of the global production yield (Rick 1979; Cal et al. 2004; Srinon et al. 2006).
In Sudan, among the diseases known limiting the production of tomato, the wilt caused by Fusarium oxysporum f.sp. lycopersici is the most affecting one (Bhatia et al. 2004). Previous reported indicated that the disease is more severe for tomato planted in the traditional production areas characterized by the planting system on which the plant is grown on stored soil moisture after the flood waters of the Nile River subside.
Fusarium wilt of tomato has been managed primarily by the use of resistant varieties (Jalali and Chand 1992), but a breakdown in resistance of these varieties due to the evolution of virulent races of the pathogen have undermined their importance in recent years (Haware and
B IOTEKNOLOGI 14 (1): 1-8, May 2017
2
Nene 1982; Jiménez-Díaz et al. 1993). In fact, numerous strategies have been proposed to control this fungal pathogen (Biondi et al. 2004; Ahmed 2011). Methods like solarization, disinfection, seed treatment with synthetic fungicides, crop rotation and mixed cropping were also in use (Sullivan 2004). However, management of seed-borne and soil-borne diseases such as wilt caused by Fusarium species has remained problematic (Haware and Kannaiyan 1992; Rao and Balachadran 2002).
Recently, many efforts by recognizing antimicrobial compounds in higher plants gave promising strategies in combating plant pathogenic diseases. Biodegradability and selective in the toxicity of such compounds are considered valuable properties for controlling some plant diseases (Schmutterer 2002).
This study was undertaken to focus on the investigation of the potentiality of higher plant extracts and synthetic fungicides for management of Fusarium wilt of tomato caused by Fusarium oxysporum f.sp. lycopersici, under laboratory conditions, to formulate promising disease management approach with following objectives: (i) To explore the antifungal potential of some higher plants aqueous crude extract against F. oxysporum f.sp. lycopersici. (ii) To evaluate the effect of systemic fungicide on fungal growth. (iii) To develop promising disease control components against Fusarium wilt of tomato.
MATERIALS AND METHODS
Experimental site This study was conducted under laboratory conditions
at Plant Pathology Department, College of Agricultural Studies “Shambat”, Sudan University of Science and Technology (SUST) within the period January to March 2015, to evaluate the antifungal activity of sweet basil, peppermint, and River red gum (Table 1) leaves aqueous extracts and efficacy of fungicide, Revus top®, against Fusarium oxysporum f.sp. lycopersici.
Fungal inoculum Random samples were collected from roots and stems
of infected tomatoes plants (Lycopersicon esculentum Mill.) in fields at Wad RamLi area. Secured samples were put in paper bags and brought to the laboratory where they kept in the refrigerator for further investigations.
Isolation of the pathogen from tomato Isolation was done from diseased roots and stem of
infected tomato plant showing typical symptoms of Fusarium wilts. They were then cut into pieces of 0.5 to 1 cm, washed under tap water for about 5 minutes to remove soil particles. The washed pieces were dipped in 70% ethyl alcohol (5% concentration) for 2 minutes and rinsed three times in changes of sterilized distilled water and dried on sterilized filter paper. The sterilized sections were then plated at the rate of 6 sections per plate on potato dextrose agar (PDA) medium.
Table 1. List of plant species tested for antifungal activity Name of plant Family Sweet basil (Ocimum basilicum L.) Lamiaceae Peppermint (Mentha piperita L.) Lamiaceae River red gum (Eucalyptus camaldulensis Dehnh.) Myrtaceae
Identification of pathogen The petri dishes were incubated at 25oC. After
incubation for 7 days, growing fungus was sub-cultured on PDA medium for further purification of the fungus. Furthermore, Compound microscopic examinations were carried out for Mycelia and conidia structure based on the method of (Booth key 1971) to confirm that the fungus is Fusarium oxysporum f.sp. lycopersici. Standard books and research papers were also consulted during the examination of this fungus (Aneja 2004; Rifai 1969; Barnet and Hunter 1999). The purified Isolates were maintained on PDA medium for further studies.
Preparations Preparation of Fusarium oxysporium inoculum
Using a cork-borer (1 cm), agar plugs were taken from the actively growing region of the mycelial growth for sub-culturing in other sterilized Petri dishes containing PDA medium and left for seven days under fluorescent light at the room temperature. From these plates pure cultures of Fusarium oxysporum f.sp. lycopersici isolates were used for the experiment (Rampersad 2005).
Aqueous extract preparation Sweet basil and River red gum leaves were collected
from Shambat area where peppermint was obtained from Omdurman Market. All samples were brought to the laboratory where they were shade dried. The samples were freed from foreign materials like stones, sand, and dust, before being kept in the laboratory for further investigation. The leaves were then milled into fine powder after previously washed with water and dried. The powdered samples were then weighted separately (25, 50 and 100 g) and placed in 75, 50 and 100 mL of sterilized distilled water respectively and placed on a shaker for 24 hrs. The extracts were then filtered overnight to obtain the concentrations 100%, 50%, and 25%.
Preparation of Revus top® fungicides The chemical tested was Revus top® fungicide. Two
mL was dissolved in 100 mL of sterilized distilled water and the final concentration of 25, 50 and 100 ppm was obtained by serial dilution test.
Inhibition of Fusarium growth Inhibition zone technique was used in this study (Rao
and Srivastava 1994). The PDA medium was amended with the required concentration from sweet basil, River red gum, peppermint and fungicide Revus top® (r) before being solidified in a conical flask of 250 mL containing 100 mL of PDA medium, agitated and poured 25 mL into each
OSMAN & MOHAMED – Antifungal and fungicide of some plants extracts
3
sterilized Petri dish. Three plates were assigned for each concentration and left to solidify. The other three plates with PDA medium were served as control.
Each solidified medium was then inoculated centrally by a fungal growth disc cut by a sterile cork-borer (5 mm) from an edge of an actively growing culture of the fungus Fusarium oxysporum f.sp. lycopersici grown on PDA as described above. The inoculated Petri dishes were then incubated at room temperature and the radial growth was measured every two days. All treatments were done in triplicates and were arranged in a Complete Randomized Design.
Calculation The diameter of fungal radial growth was measured for
every 48 hours by taking the average of two crossed dimensions for each disc in the Petri dish. The radial growth was then calculated as a percentage from the diameter (9.0 cm) of the glass Petri dish. The effect of each extract concentration on linear fungal growth was calculated as a percentage of inhibition in diameter of fungal growth:
% inhibition = dc-dt × 100 dc Where: dc = Average increase in mycelial growth in control dt = Average increase in mycelial growth in treatment
Statistical analyses The obtained data were statistically analyzed according
to the analysis of variance (ANOVA);-Duncan's Multiple Range Test was used for mean separation using SAS software for windows version 9.
RESULTS AND DISCUSSION
This study was conducted under laboratory conditions at Plant Protection Department, College of Agricultural Studies “Shambat”, Sudan University of Science and Technology within the period January to March 2015, to evaluate the antifungal activity of sweet basil, peppermint and River red gum leaves aqueous extracts and efficacy of fungicide, Revus top®, against Fusarium oxysporum f.sp. lycopersici.
Effect of different concentrations two days after inoculation
The results (Table 2) showed that the leaves aqueous extracts of all plants tested and fungicide exhibited an inhibitory effect on the fungal growth after 2 days from inoculation. The percentage inhibition ranged from 5.9% at 25% concentration of River Red Gum to 100% inhibition achieved by 50 and 100% concentrations of fungicide. Furthermore, the percentages fungal growth inhibition was significantly high compared to the control.
Among plant extracts, sweet basil aqueous extract at all concentrations (25, 50, and 100%) gave the highest inhibition of mycelial growth (31.9, 39.9 and 51.7%)
followed in descending order by River red gum which gave reduction in linear growth of the fungus as (5.9, 41.3 and 43.5%) at the three concentrations (25, 50, and 100%) respectively and the lowest reduction (15.5, 24.6 and 27.4%) was obtained by peppermint at the three concentrations (Table 2). Moreover, the fungicide especially at 50 and 100% concentration demonstrated 100% inhibition. However, the suppressing effect of fungicide was more pronounced (83.2, 100 and 100%) at all concentrations tested than other treatments.
Effect of different concentrations four days after inoculation
In day four after inoculation, all plant extracts concentrations as well as that of the fungicide were invariably continued exhibiting suppressing effects against the fungal growth. However, all concentrations of the fungicide (25, 50, and 100%) demonstrated the significantly highest inhibition zones percent (86.1, 92.5 and 99.3%) respectively followed by sweet basil which gave 22.7, 42.8 and 48.5 and the lowest inhibition zone percent was given by Eucalyptus at 25 and 50% concentrations (22.4 and 39.3) . Moreover the inhibitory effect from all concentrations tested was significantly different from control (Table 3).
Effect of leaves aqueous extracts six days after inoculation
After six days from inoculation the results (Table 4) showed that extracts of all the plants tested as well as the fungicide proved to be effective in suppressing the fungal growth. In fact, all tested concentrations of peppermint, sweet basil, River red gum and fungicide continued inducing a significant inhibition zones percentage against test fungus compared to control (Table 4). Meanwhile, the River red gum aqueous extract at all concentrations tested (25, 50, and 100%) gave relatively more inhibitory effect (44.1, 53.1 and 53.1%) than sweet basil (36.8, 51.5 and 54.4%) and peppermint aqueous extract as well (35.5, 39.6 and 39.6%) respectively. Obviously, the test organism differs in its response to the different concentrations but on the whole, growth inhibition increased with increasing concentration. This inhibitory effect from all concentrations was significantly different from control.
Effect of leaves aqueous extracts eight days after inoculation
After eight days from inoculation the results (Table 5) showed that extracts of all the plants tested as well as the fungicide maintained their suppressing effect on the fungal growth. This suppressing effect of all tested concentrations of peppermint, sweet basil, River red gum and fungicide was significantly higher than the control (Table 5). However, among all treatments, the inhibitory effect of the fungicide at all concentrations was more pronouncing than others. Moreover, the assessment of the fungicide effect on fungal growth after eight days from inoculation showed a concentration dependant differential inhibition (Table 5) where the percentage inhibition increased with increasing concentration.
B IOTEKNOLOGI 14 (1): 1-8, May 2017
4
Discussion Tomato (Lycopersicon esculentum Mill.) is considered
as one of the most important and popular vegetable in many countries. The global production of tomatoes doubled three times in the last 4 decades (FAO 2006). This is because of its acceptable flavor, nutritive value and ability to fruit in a wide range of environments and the relative ease with which it can be cultivated (Suarez et al. 2007). Many diseases affect tomatoes during the growing season, both in greenhouse and field. Among these are Fusarium wilt disease, caused by pathogenic formae speciales of the soil-inhabiting fungus; Fusarium oxysporum f.sp lycopersici. In fact, wilt of tomato is one of the most economically
important diseases world-wide (Rick 1979; Cal et al. 2004; Srinon et al. 2006).This pathogenic fungus remains to be a challenging task in terms of management (Rick 1976; Agrios 2005; Srinon et al. 2006).
In Sudan tomato is becoming increasingly important for local consumption and for export. It is cultivated throughout the year under irrigation in an area that exceeds 36540 hectares with an average yield of tons per hectare (AOAD 2007; Dawelbeit et al. 2010). Likewise, in Sudan, several diseases are known to limit production of tomato, of which Fusarium wilt caused by (Fusarium oxysporum f.sp. lycopersici) is one of the most important (Bhatia et al. 2004).
Table 2. Effect of different concentrations of plants leaves aqueous extracts and fungicide on the linear growth of Fusarium oxysporum f.sp. lycopersici in vitro two days after inoculation
Products Inhibition zone (%) Plant extract Concentrations R1 R2 R3 Mean
Peppermint 25% 28.5 (5.4) 10.3 (3.3) 7.6 (2.8) 15.5 (3.8)ef 50% 14.2 (3.8) 17.2 (4.2) 42.3 (6.5) 24.6 (4.8)de 100% 46 (6.8) 24.1 (5) 11.5 (3.5) 27.4 (5.1)de Sweet basil 25% 28.5 (5.4) 17.2 (4.2) 50 (7.1) 31.9 (5.6)de 50% 57.1 (7.6) 24.1 (5) 38.4 (6.2) 39.9 (6.3)cd 100% 39.2 (7.6) 62 (7.9) 53.8 (7.4) 51.7 (7.6)bc River red gum 25% 0 (0.07) 13.7 (3.8) 3.8 (2.1) 5.9 (2.2)fg 50% 39.2 (6.3) 34.4 (5.9) 50 (7.1) 41.3 (6.4)cd 100% 42.8 (6.6) 41.3 (6.5) 46.1 (6.8) 43.5 (6.7)cd Fungicide 25% 92.8 (9.7) 75.8 (8.7) 80.7 (9) 83.2 (9.1)ab 50% 100 (10) 100 (10) 100 (10) 100 (10.0)a 100% 100 (10) 100 (10) 100 (10) 100 (10.0)a Control 0 (0.7) 0 (0.7) 0 (0.7) 0.0 (0.7)g C.V. (%) 17.03 SE± 0.46 LSD 1.725 Note: Means followed by the same letter are not significant different according to Duncan’s multiple range (P< 0.05). Data in parentheses transformed using square root transformation ( ) before analysis. Table 3. Effect of leaves aqueous extracts of sweet basil, peppermint, river red gum and fungicide Revus top® on the linear growth of Fusarium oxysporum f.sp. lycopersici in vitro four days after inoculation
Treatment Inhibition zone (%) Plant extract Concentration R1 R2 R3 Mean
Peppermint 25% 38.3 (6.2) 24.4 (5) 61.5 (7.9) 41.5 (6.4)bc 50% 45 (6.7) 42.8 (6.6) 36.5 (6.1) 41.5 (6.5)bc 100% 53.3 (7.3) 20.4 (4.6) 51.9 (7.2) 41.9 (6.4)bc Sweet basil 25% 33.3 (5.3) 2 (1.6) 32.6 (5.8) 22.7 (4.2)c 50% 53.3 (7.3) 32.6 (5.8) 42.3 (6.5) 42.8 (6.5)bc 100% 55 (7.4) 34.6 (5.9) 55.7 (7.5) 48.5 (6.9)b River red gum 25% 38.3 (6.2) 2 (1.6) 26.9 (5.2) 22.4 (4.3)c
50% 40 (6.4) 20.4 (4.6) 50 (7.1) 36.8 (6)bc 100% 56.6 (7.6) 28.5 (5.4) 32.6 (5.8) 39.3 (6.2)bc Fungicide 25% 90 (9.5) 83.6 (9.2) 84.6 (9.2) 86.1 (a 50% 93.3 (9.7) 91.8 (9.6) 92.3 (9.6) 92.5 a 100% 100 (10) 97.9 (9.9) 100 (10) 99.3 a Control 0 (0.7) 0 (0.7) 0 (0.7) 0 (0.7) d C.V. (%) 19.71 SE± 0.42 LSD 2.120 Note: Means followed by the same letter are not significant different according to Duncan’s multiple range (P< 0.05). Data in parentheses transformed using square root transformation ( ) before analysis.
OSMAN & MOHAMED – Antifungal and fungicide of some plants extracts
5
Table 4. Effect of leaves aqueous extracts of sweet basil, peppermint, River red gum and fungicide Revuse top on the linear growth of Fusarium oxysporum f.sp. lycopersici in vitro six days after inoculation.
Treatments Inhibition zone (%) Plant extract Concentrations R1 R2 R3 Mean
25% 40.3 (6.4) 16.6 (4.1) 49.5 (7.1) 35.5 (5.8) d Peppermint 50% 53.8 (7.4) 34.3 (5.9) 30.6 (5.6) 39.6 (6.3) bcd 100% 25.9 (5.1) 35.2 (6) 58.4 (7.7) 39.9 (6.2) bcd 25% 41.3 (6.5) 35.2 (6) 33.6 (5.8) 36.8 (6.1) cd Sweet basil 50% 51.9 (7.2) 48 (7) 54.4 (7.4) 51.5 (7.2) bc 100% 55.7 (7.5) 54.9 (7.4) 53.4 (7.3) 54.7 (7.4) b 25% 49 (7) 43.1 (6.6) 40.5 (6.4) 44.3 (6.6) bcd River red gum 50% 55.7 (7.5) 50.9 (7.2) 52.4 (7.3) 53.1 (7.3) bc 100% 55.7 (7.5) 51.9 (7.2) 51.4 (7.2) 53.1 (7.3) bc 25% 94.2 (9.7) 92.1 (9.6) 92 (9.6) 92.8 (9.6) a Fungicide 50% 92.3 (9.6) 96 (9.8) 92 (9.6) 93.5 (9.6) a 100% 99 (10) 100 (10) 100 (10) 99.7 (10) a Control 0 (0.7) 0 (0.7) 0 (0.7) 0 (0.7)e C.V. (%) 13.04 SE± 0.40 LSD 1.090 Note: Means followed by the same letter are not significantly different according to Duncan’s multiple range (P< 0.05). Data in parentheses transformed using square root transformation ( ) before analysis
Table 5. Effect of different concentrations of plants leaves aqueous extracts and fungicide on the linear growth of Fusarium oxysporum f.sp. lycopersici in vitro eight days after inoculation
Treatments Inhibition zone (%) Plant extract Concentrations R1 R2 R3 Mean
Peppermint 25% 38.2 (6.2) 19.4 (4.5) 53.3 (7.3) 37.0 (6) c 50% 21.9 (4.7) 38.8 (6.3) 51.8 (7.2) 37.5 (6) c 100% 58.5 (7.7) 49.2 (7.1) 40.7 (6.4) 49.5 (7) bc Sweet basil 25% 39.8 (6.4) 40.2 (6.4) 41.4 (6.5) 40.5 (6.4) c 50% 49.5 (7.1) 46.2 (6.8) 46.6 (6.9) 47.5 (6.9) bc 100% 54.4 (7.4) 58.2 (7.7) 57 (7.6) 56.6 (7.5) b River red gum 25% 38.2 (6.2) 41 (6.4) 40.7 (6.4) 40.0 (6.2) c 50% 36.5 (6.1) 42.5 (6.6) 41.4 (6.5) 40.2 (6.4) c 100% 43 (6.6) 41 (6.4) 45.1 (6.8) 43.1 (6.6) bc Fungicide 25% 95.1 (9.8) 94 (9.7) 94 (9.7) 94.4 (9.7) a 50% 93.4 (9.7) 97 (9.9) 94 (9.7) 94.9 (9.7) a 100% 99.1 (10) 100 (10) 100 (10) 99.7 (10) a Control 0 (0.7) 0 (0.7) 0 (0.7) 0 (0.7)d C.V. (%) 8.25 SE± 0.38 LSD 0.9553 Note: Means followed by the same letter are not significant different according to Duncan’s multiple range (P< 0.05). Data in parentheses transformed using square root transformation ( ) before analysis
A number of research findings have presented strategies
to control this fungal pathogen ( (Haware and Nene 1982; Jiménez-Díaz et al. 1993; Biondi et al. 2004; Ahmed 2011). However, management of seed-borne and soil-borne diseases such as tomato wilt caused by Fusarium oxysporum f.sp. lycopersici has always been problematic (Rao and Balachadran 2002). Generally, use of synthetic fungicides considerably reduce wilt incidence in tomato but their use is costly as well as environmentally undesirable (Song and Goodman 2001). Moreover, the use of resistant varieties is faced with breakdown of resistance due to high pathogenic variability in the pathogen population (Kutama et al. 2011; 2013). In this context, the searches for an eco-
friendly way of managing Fusarium wilt in tomato which offers an alternative to fungicides is highly demanding.
Fortunately, progress achieved in recognizing antimicrobial compounds in higher plants gave more promises in combating plant pathogenic diseases. Such compounds, being biodegradable and selective in their toxicity, are considered valuable for controlling some plant diseases (Schmutterer 2002). In fact, higher plants with biologically active secondary metabolites are extremely abundant where over 80% of all known Alkaloids, Terpenoid, Phenols and other secondary metabolite were produced from them (Siddig 1993; Newman et al. 2000).
B IOTEKNOLOGI 14 (1): 1-8, May 2017
6
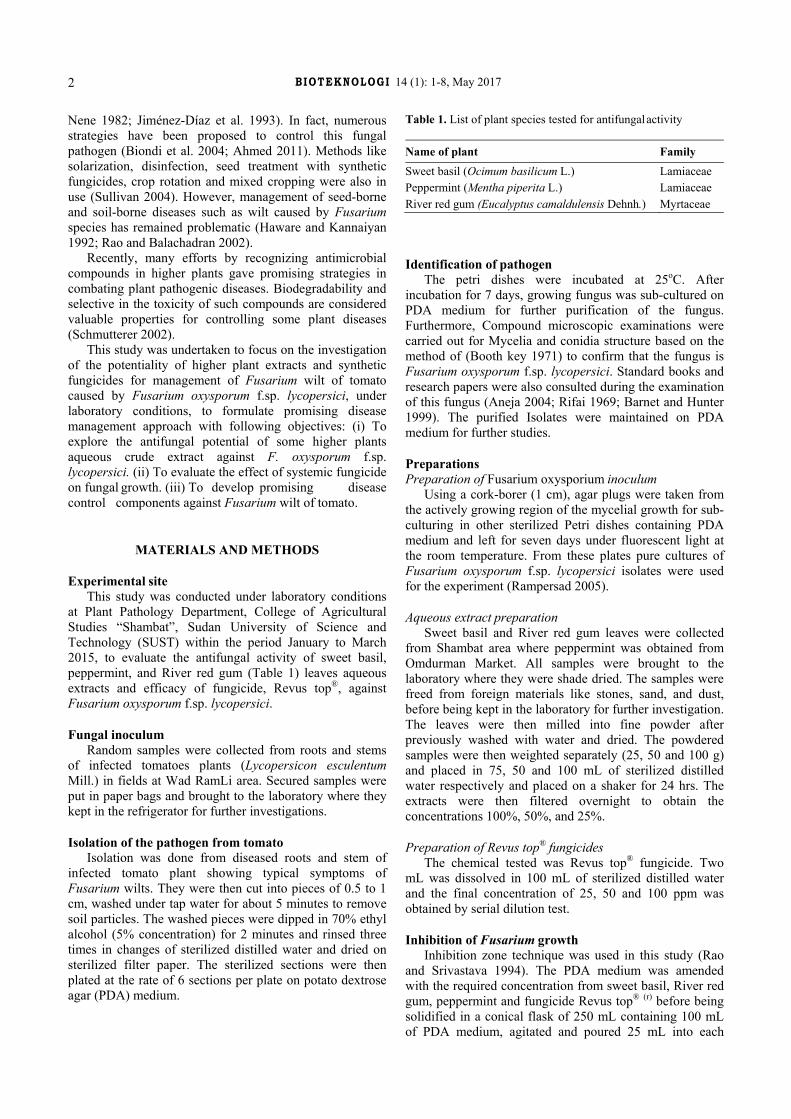
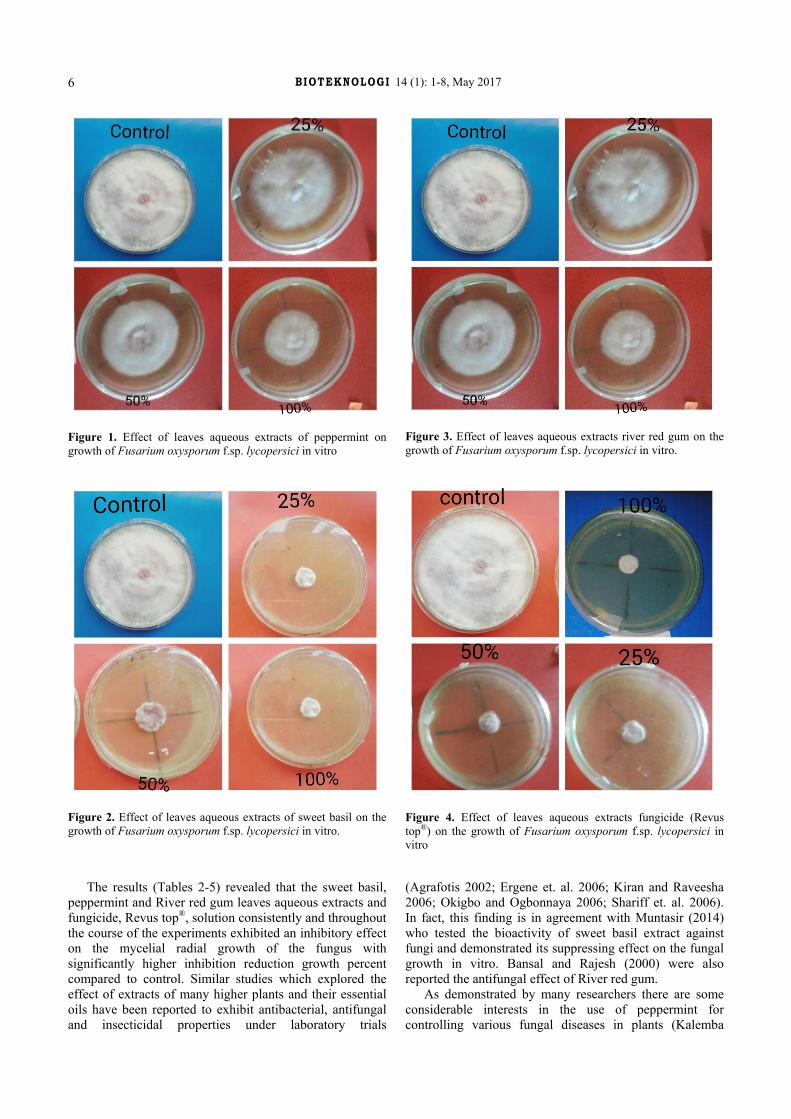
Figure 1. Effect of leaves aqueous extracts of peppermint on growth of Fusarium oxysporum f.sp. lycopersici in vitro
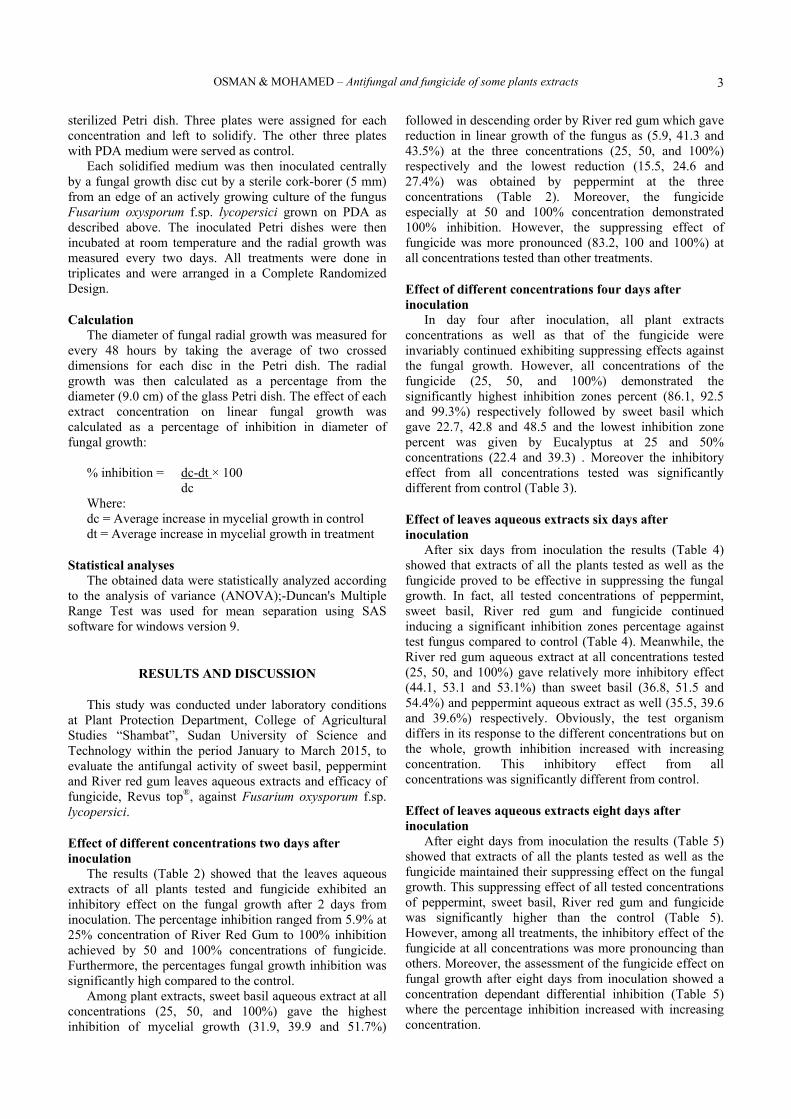
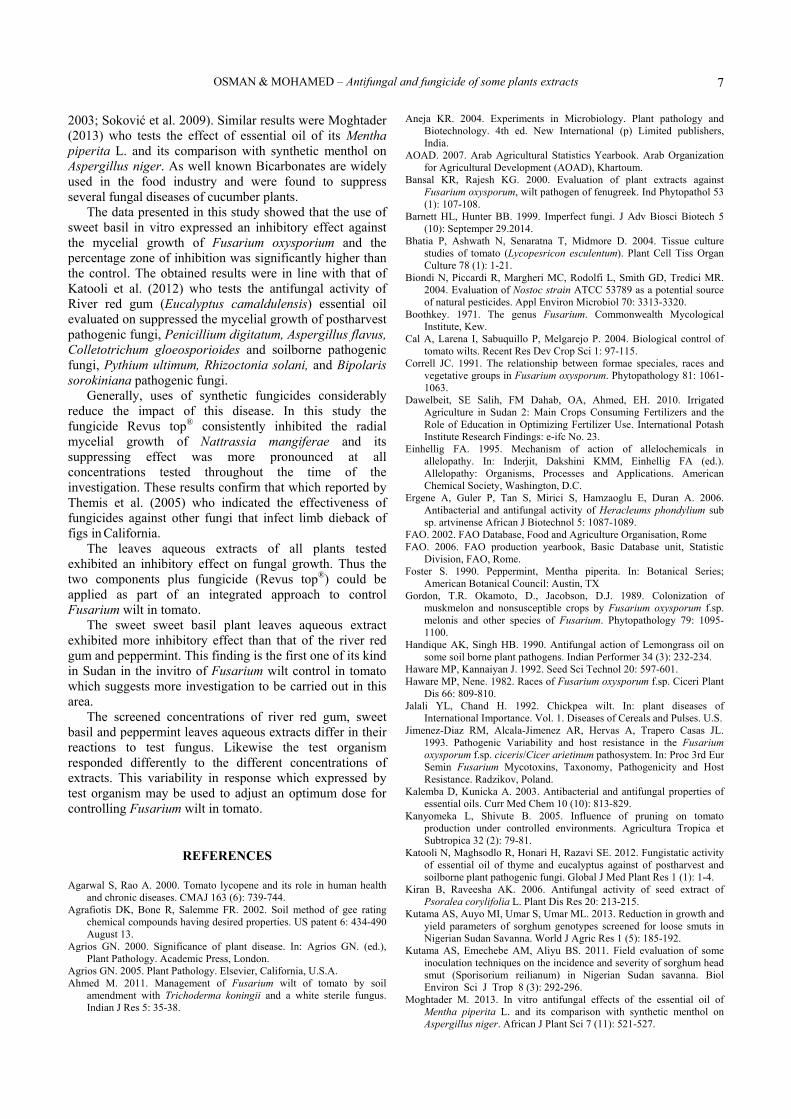
Figure 2. Effect of leaves aqueous extracts of sweet basil on the growth of Fusarium oxysporum f.sp. lycopersici in vitro.
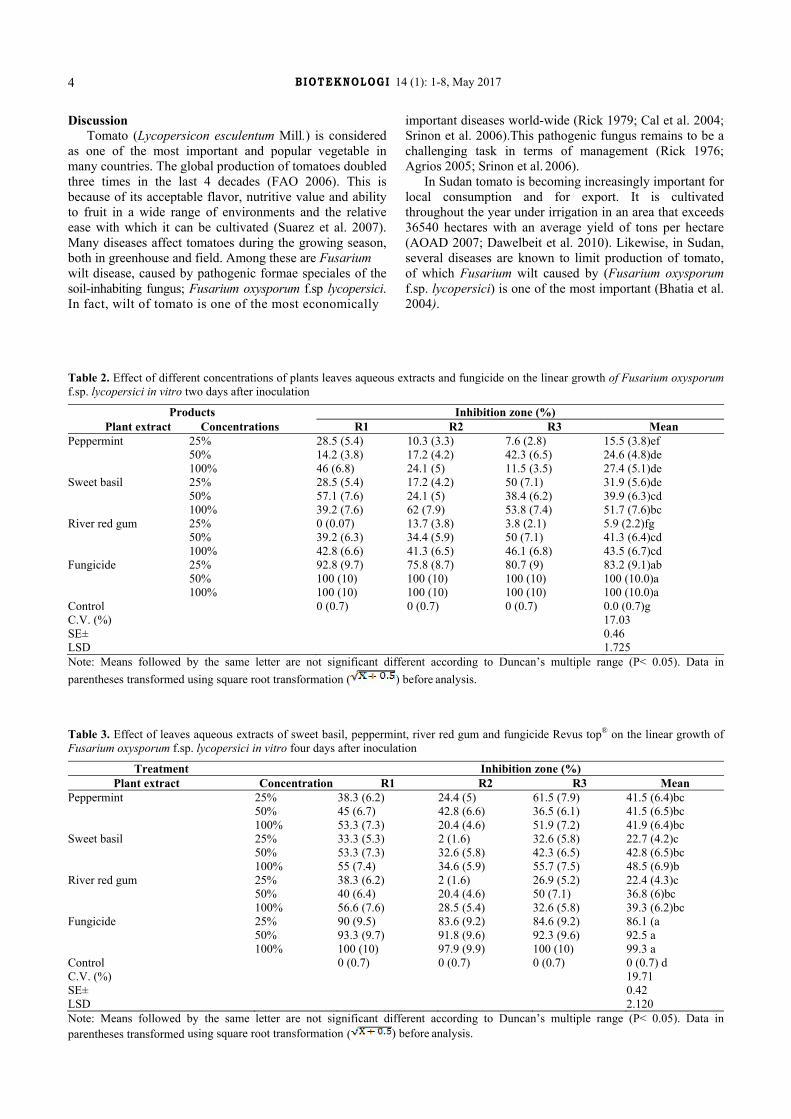
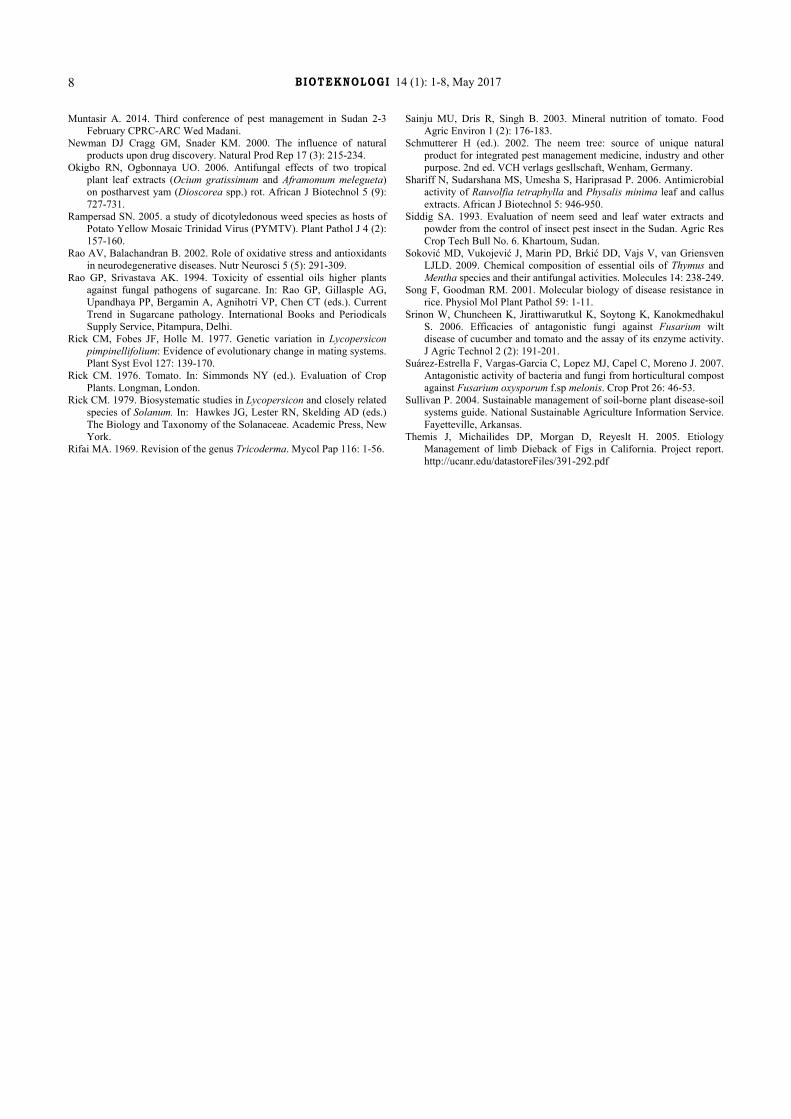
Figure 3. Effect of leaves aqueous extracts river red gum on the growth of Fusarium oxysporum f.sp. lycopersici in vitro.
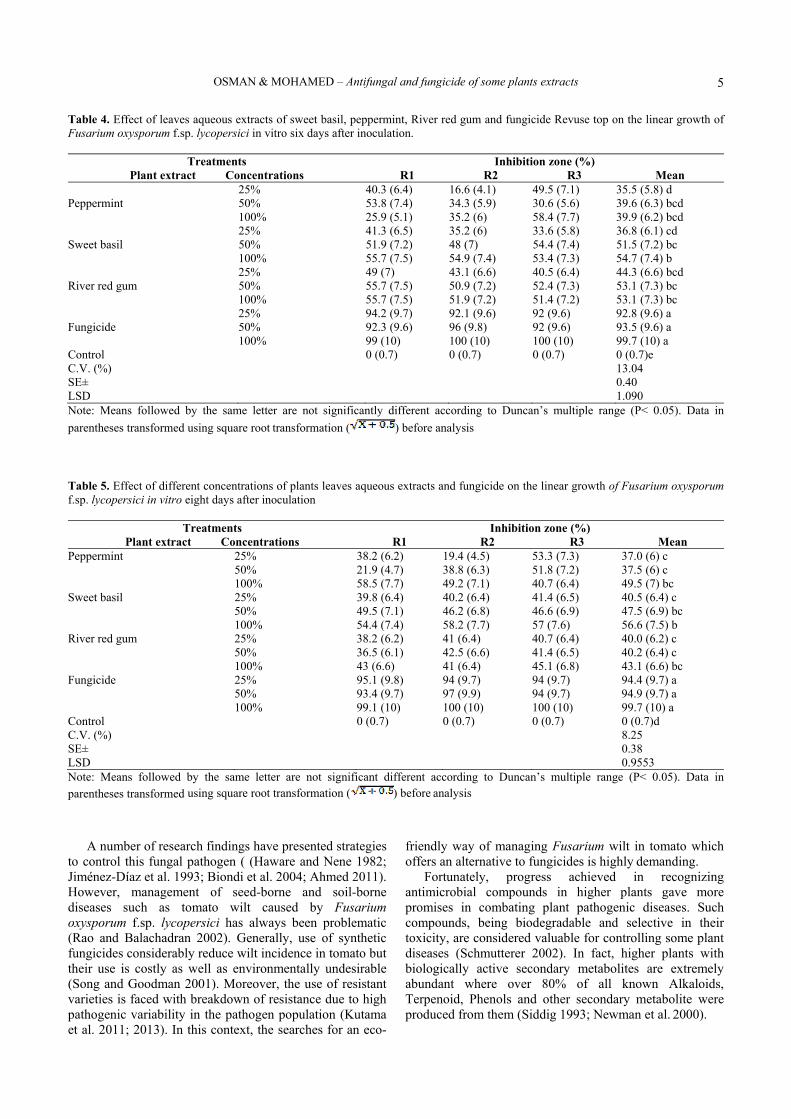
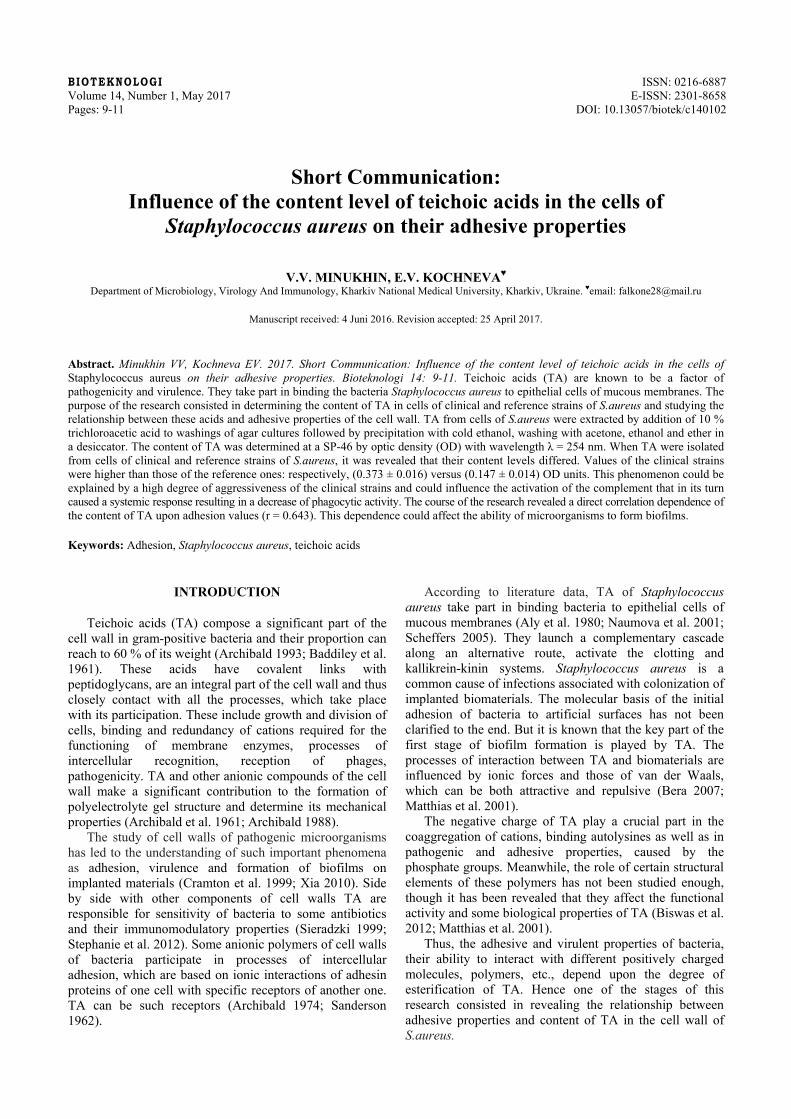
Figure 4. Effect of leaves aqueous extracts fungicide (Revus top®) on the growth of Fusarium oxysporum f.sp. lycopersici in vitro
The results (Tables 2-5) revealed that the sweet basil, peppermint and River red gum leaves aqueous extracts and fungicide, Revus top®, solution consistently and throughout the course of the experiments exhibited an inhibitory effect on the mycelial radial growth of the fungus with significantly higher inhibition reduction growth percent compared to control. Similar studies which explored the effect of extracts of many higher plants and their essential oils have been reported to exhibit antibacterial, antifungal and insecticidal properties under laboratory trials
(Agrafotis 2002; Ergene et. al. 2006; Kiran and Raveesha 2006; Okigbo and Ogbonnaya 2006; Shariff et. al. 2006). In fact, this finding is in agreement with Muntasir (2014) who tested the bioactivity of sweet basil extract against fungi and demonstrated its suppressing effect on the fungal growth in vitro. Bansal and Rajesh (2000) were also reported the antifungal effect of River red gum.
As demonstrated by many researchers there are some considerable interests in the use of peppermint for controlling various fungal diseases in plants (Kalemba
OSMAN & MOHAMED – Antifungal and fungicide of some plants extracts
7
2003; Soković et al. 2009). Similar results were Moghtader (2013) who tests the effect of essential oil of its Mentha piperita L. and its comparison with synthetic menthol on Aspergillus niger. As well known Bicarbonates are widely used in the food industry and were found to suppress several fungal diseases of cucumber plants.
The data presented in this study showed that the use of sweet basil in vitro expressed an inhibitory effect against the mycelial growth of Fusarium oxysporium and the percentage zone of inhibition was significantly higher than the control. The obtained results were in line with that of Katooli et al. (2012) who tests the antifungal activity of River red gum (Eucalyptus camaldulensis) essential oil evaluated on suppressed the mycelial growth of postharvest pathogenic fungi, Penicillium digitatum, Aspergillus flavus, Colletotrichum gloeosporioides and soilborne pathogenic fungi, Pythium ultimum, Rhizoctonia solani, and Bipolaris sorokiniana pathogenic fungi.
Generally, uses of synthetic fungicides considerably reduce the impact of this disease. In this study the fungicide Revus top® consistently inhibited the radial mycelial growth of Nattrassia mangiferae and its suppressing effect was more pronounced at all concentrations tested throughout the time of the investigation. These results confirm that which reported by Themis et al. (2005) who indicated the effectiveness of fungicides against other fungi that infect limb dieback of figs in California.
The leaves aqueous extracts of all plants tested exhibited an inhibitory effect on fungal growth. Thus the two components plus fungicide (Revus top®) could be applied as part of an integrated approach to control Fusarium wilt in tomato.
The sweet sweet basil plant leaves aqueous extract exhibited more inhibitory effect than that of the river red gum and peppermint. This finding is the first one of its kind in Sudan in the invitro of Fusarium wilt control in tomato which suggests more investigation to be carried out in this area.
The screened concentrations of river red gum, sweet basil and peppermint leaves aqueous extracts differ in their reactions to test fungus. Likewise the test organism responded differently to the different concentrations of extracts. This variability in response which expressed by test organism may be used to adjust an optimum dose for controlling Fusarium wilt in tomato.
REFERENCES
Agarwal S, Rao A. 2000. Tomato lycopene and its role in human health and chronic diseases. CMAJ 163 (6): 739-744.
Agrafiotis DK, Bone R, Salemme FR. 2002. Soil method of gee rating chemical compounds having desired properties. US patent 6: 434-490 August 13.
Agrios GN. 2000. Significance of plant disease. In: Agrios GN. (ed.), Plant Pathology. Academic Press, London.
Agrios GN. 2005. Plant Pathology. Elsevier, California, U.S.A. Ahmed M. 2011. Management of Fusarium wilt of tomato by soil
amendment with Trichoderma koningii and a white sterile fungus. Indian J Res 5: 35-38.
Aneja KR. 2004. Experiments in Microbiology. Plant pathology and Biotechnology. 4th ed. New International (p) Limited publishers, India.
AOAD. 2007. Arab Agricultural Statistics Yearbook. Arab Organization for Agricultural Development (AOAD), Khartoum.
Bansal KR, Rajesh KG. 2000. Evaluation of plant extracts against Fusarium oxysporum, wilt pathogen of fenugreek. Ind Phytopathol 53 (1): 107-108.
Barnett HL, Hunter BB. 1999. Imperfect fungi. J Adv Biosci Biotech 5 (10): Septemper 29.2014.
Bhatia P, Ashwath N, Senaratna T, Midmore D. 2004. Tissue culture studies of tomato (Lycopesricon esculentum). Plant Cell Tiss Organ Culture 78 (1): 1-21.
Biondi N, Piccardi R, Margheri MC, Rodolfi L, Smith GD, Tredici MR. 2004. Evaluation of Nostoc strain ATCC 53789 as a potential source of natural pesticides. Appl Environ Microbiol 70: 3313-3320.
Boothkey. 1971. The genus Fusarium. Commonwealth Mycological Institute, Kew.
Cal A, Larena I, Sabuquillo P, Melgarejo P. 2004. Biological control of tomato wilts. Recent Res Dev Crop Sci 1: 97-115.
Correll JC. 1991. The relationship between formae speciales, races and vegetative groups in Fusarium oxysporum. Phytopathology 81: 1061-1063.
Dawelbeit, SE Salih, FM Dahab, OA, Ahmed, EH. 2010. Irrigated Agriculture in Sudan 2: Main Crops Consuming Fertilizers and the Role of Education in Optimizing Fertilizer Use. International Potash Institute Research Findings: e-ifc No. 23.
Einhellig FA. 1995. Mechanism of action of allelochemicals in allelopathy. In: Inderjit, Dakshini KMM, Einhellig FA (ed.). Allelopathy: Organisms, Processes and Applications. American Chemical Society, Washington, D.C.
Ergene A, Guler P, Tan S, Mirici S, Hamzaoglu E, Duran A. 2006. Antibacterial and antifungal activity of Heracleums phondylium sub sp. artvinense African J Biotechnol 5: 1087-1089.
FAO. 2002. FAO Database, Food and Agriculture Organisation, Rome FAO. 2006. FAO production yearbook, Basic Database unit, Statistic
Division, FAO, Rome. Foster S. 1990. Peppermint, Mentha piperita. In: Botanical Series;
American Botanical Council: Austin, TX Gordon, T.R. Okamoto, D., Jacobson, D.J. 1989. Colonization of
muskmelon and nonsusceptible crops by Fusarium oxysporum f.sp. melonis and other species of Fusarium. Phytopathology 79: 1095-1100.
Handique AK, Singh HB. 1990. Antifungal action of Lemongrass oil on some soil borne plant pathogens. Indian Performer 34 (3): 232-234.
Haware MP, Kannaiyan J. 1992. Seed Sci Technol 20: 597-601. Haware MP, Nene. 1982. Races of Fusarium oxysporum f.sp. Ciceri Plant
Dis 66: 809-810. Jalali YL, Chand H. 1992. Chickpea wilt. In: plant diseases of
International Importance. Vol. 1. Diseases of Cereals and Pulses. U.S. Jimenez-Diaz RM, Alcala-Jimenez AR, Hervas A, Trapero Casas JL.
1993. Pathogenic Variability and host resistance in the Fusarium oxysporum f.sp. ciceris/Cicer arietinum pathosystem. In: Proc 3rd Eur Semin Fusarium Mycotoxins, Taxonomy, Pathogenicity and Host Resistance. Radzikov, Poland.
Kalemba D, Kunicka A. 2003. Antibacterial and antifungal properties of essential oils. Curr Med Chem 10 (10): 813-829.
Kanyomeka L, Shivute B. 2005. Influence of pruning on tomato production under controlled environments. Agricultura Tropica et Subtropica 32 (2): 79-81.
Katooli N, Maghsodlo R, Honari H, Razavi SE. 2012. Fungistatic activity of essential oil of thyme and eucalyptus against of postharvest and soilborne plant pathogenic fungi. Global J Med Plant Res 1 (1): 1-4.
Kiran B, Raveesha AK. 2006. Antifungal activity of seed extract of Psoralea corylifolia L. Plant Dis Res 20: 213-215.
Kutama AS, Auyo MI, Umar S, Umar ML. 2013. Reduction in growth and yield parameters of sorghum genotypes screened for loose smuts in Nigerian Sudan Savanna. World J Agric Res 1 (5): 185-192.
Kutama AS, Emechebe AM, Aliyu BS. 2011. Field evaluation of some inoculation techniques on the incidence and severity of sorghum head smut (Sporisorium reilianum) in Nigerian Sudan savanna. Biol Environ Sci J Trop 8 (3): 292-296.
Moghtader M. 2013. In vitro antifungal effects of the essential oil of Mentha piperita L. and its comparison with synthetic menthol on Aspergillus niger. African J Plant Sci 7 (11): 521-527.
B IOTEKNOLOGI 14 (1): 1-8, May 2017
8
Muntasir A. 2014. Third conference of pest management in Sudan 2-3 February CPRC-ARC Wed Madani.
Newman DJ Cragg GM, Snader KM. 2000. The influence of natural products upon drug discovery. Natural Prod Rep 17 (3): 215-234.
Okigbo RN, Ogbonnaya UO. 2006. Antifungal effects of two tropical plant leaf extracts (Ocium gratissimum and Aframomum melegueta) on postharvest yam (Dioscorea spp.) rot. African J Biotechnol 5 (9): 727-731.
Rampersad SN. 2005. a study of dicotyledonous weed species as hosts of Potato Yellow Mosaic Trinidad Virus (PYMTV). Plant Pathol J 4 (2): 157-160.
Rao AV, Balachandran B. 2002. Role of oxidative stress and antioxidants in neurodegenerative diseases. Nutr Neurosci 5 (5): 291-309.
Rao GP, Srivastava AK. 1994. Toxicity of essential oils higher plants against fungal pathogens of sugarcane. In: Rao GP, Gillasple AG, Upandhaya PP, Bergamin A, Agnihotri VP, Chen CT (eds.). Current Trend in Sugarcane pathology. International Books and Periodicals Supply Service, Pitampura, Delhi.
Rick CM, Fobes JF, Holle M. 1977. Genetic variation in Lycopersicon pimpinellifolium: Evidence of evolutionary change in mating systems. Plant Syst Evol 127: 139-170.
Rick CM. 1976. Tomato. In: Simmonds NY (ed.). Evaluation of Crop Plants. Longman, London.
Rick CM. 1979. Biosystematic studies in Lycopersicon and closely related species of Solanum. In: Hawkes JG, Lester RN, Skelding AD (eds.) The Biology and Taxonomy of the Solanaceae. Academic Press, New York.
Rifai MA. 1969. Revision of the genus Tricoderma. Mycol Pap 116: 1-56.
Sainju MU, Dris R, Singh B. 2003. Mineral nutrition of tomato. Food Agric Environ 1 (2): 176-183.
Schmutterer H (ed.). 2002. The neem tree: source of unique natural product for integrated pest management medicine, industry and other purpose. 2nd
ed. VCH verlags gesllschaft, Wenham, Germany.
Shariff N, Sudarshana MS, Umesha S, Hariprasad P. 2006. Antimicrobial activity of Rauvolfia tetraphylla and Physalis minima leaf and callus extracts. African J Biotechnol 5: 946-950.
Siddig SA. 1993. Evaluation of neem seed and leaf water extracts and powder from the control of insect pest insect in the Sudan. Agric Res Crop Tech Bull No. 6. Khartoum, Sudan.
Soković MD, Vukojević J, Marin PD, Brkić DD, Vajs V, van Griensven LJLD. 2009. Chemical composition of essential oils of Thymus and Mentha species and their antifungal activities. Molecules 14: 238-249.
Song F, Goodman RM. 2001. Molecular biology of disease resistance in rice. Physiol Mol Plant Pathol 59: 1-11.
Srinon W, Chuncheen K, Jirattiwarutkul K, Soytong K, Kanokmedhakul S. 2006. Efficacies of antagonistic fungi against Fusarium wilt disease of cucumber and tomato and the assay of its enzyme activity. J Agric Technol 2 (2): 191-201.
Suárez-Estrella F, Vargas-Garcia C, Lopez MJ, Capel C, Moreno J. 2007. Antagonistic activity of bacteria and fungi from horticultural compost against Fusarium oxysporum f.sp melonis. Crop Prot 26: 46-53.
Sullivan P. 2004. Sustainable management of soil-borne plant disease-soil systems guide. National Sustainable Agriculture Information Service. Fayetteville, Arkansas.
Themis J, Michailides DP, Morgan D, Reyeslt H. 2005. Etiology Management of limb Dieback of Figs in California. Project report. http://ucanr.edu/datastoreFiles/391-292.pdf
BIOTEKNOLOGI ISSN: 0216-6887 Volume 14, Number 1, May 2017 E-ISSN: 2301-8658 Pages: 9-11 DOI: 10.13057/biotek/c140102
Short Communication: Influence of the content level of teichoic acids in the cells of
Staphylococcus aureus on their adhesive properties
V.V. МINUKHIN, E.V. KOCHNEVA♥ Department of Microbiology, Virology And Immunology, Kharkiv National Medical University, Kharkiv, Ukraine. ♥email: [email protected]
Manuscript received: 4 Juni 2016. Revision accepted: 25 April 2017.
Abstract. Мinukhin VV, Kochneva EV. 2017. Short Communication: Influence of the content level of teichoic acids in the cells of Staphylococcus aureus on their adhesive properties. Bioteknologi 14: 9-11. Teichoic acids (TA) are known to be a factor of pathogenicity and virulence. They take part in binding the bacteria Staphylococcus aureus to epithelial cells of mucous membranes. The purpose of the research consisted in determining the content of TA in cells of clinical and reference strains of S.aureus and studying the relationship between these acids and adhesive properties of the cell wall. TA from cells of S.аurеus were extracted by addition of 10 % trichloroacetic acid to washings of agar cultures followed by precipitation with cold ethanol, washing with acetone, ethanol and ether in a desiccator. The content of TA was determined at a SP-46 by optic density (OD) with wavelength λ = 254 nm. When TA were isolated from cells of clinical and reference strains of S.аurеus, it was revealed that their content levels differed. Values of the clinical strains were higher than those of the reference ones: respectively, (0.373 ± 0.016) versus (0.147 ± 0.014) OD units. This phenomenon could be explained by a high degree of aggressiveness of the clinical strains and could influence the activation of the complement that in its turn caused a systemic response resulting in a decrease of phagocytic activity. The course of the research revealed a direct correlation dependence of the content of TA upon adhesion values (r = 0.643). This dependence could affect the ability of microorganisms to form biofilms.
Keywords: Adhesion, Staphylococcus aureus, teichoic acids
INTRODUCTION
Teichoic acids (TA) compose a significant part of the cell wall in gram-positive bacteria and their proportion can reach to 60 % of its weight (Archibald 1993; Baddiley еt аl. 1961). These acids have covalent links with peptidoglycans, are an integral part of the cell wall and thus closely contact with all the processes, which take place with its participation. These include growth and division of cells, binding and redundancy of cations required for the functioning of membrane enzymes, processes of intercellular recognition, reception of phages, pathogenicity. TA and other anionic compounds of the cell wall make a significant contribution to the formation of polyelectrolyte gel structure and determine its mechanical properties (Archibald еt аl. 1961; Archibald 1988).
The study of cell walls of pathogenic microorganisms has led to the understanding of such important phenomena as adhesion, virulence and formation of biofilms on implanted materials (Cramton et al. 1999; Xia 2010). Side by side with other components of cell walls TA are responsible for sensitivity of bacteria to some antibiotics and their immunomodulatory properties (Sieradzki 1999; Stephanie еt аl. 2012). Some anionic polymers of cell walls of bacteria participate in processes of intercellular adhesion, which are based on ionic interactions of adhesin proteins of one cell with specific receptors of another one. TA can be such receptors (Archibald 1974; Sanderson 1962).
According to literature data, TA of Staphylococcus aureus take part in binding bacteria to epithelial cells of mucous membranes (Aly еt аl. 1980; Naumova еt аl. 2001; Scheffers 2005). They launch a complementary cascade along an alternative route, activate the clotting and kallikrein-kinin systems. Staphylococcus aureus is a common cause of infections associated with colonization of implanted biomaterials. The molecular basis of the initial adhesion of bacteria to artificial surfaces has not been clarified to the end. But it is known that the key part of the first stage of biofilm formation is played by TA. The processes of interaction between TA and biomaterials are influenced by ionic forces and those of van der Waals, which can be both attractive and repulsive (Bera 2007; Matthias еt аl. 2001).
The negative charge of TA play a crucial part in the coaggregation of cations, binding autolysines as well as in pathogenic and adhesive properties, caused by the phosphate groups. Meanwhile, the role of certain structural elements of these polymers has not been studied enough, though it has been revealed that they affect the functional activity and some biological properties of TA (Biswas et al. 2012; Matthias еt аl. 2001).
Thus, the adhesive and virulent properties of bacteria, their ability to interact with different positively charged molecules, polymers, etc., depend upon the degree of esterification of TA. Hence one of the stages of this research consisted in revealing the relationship between adhesive properties and content of TA in the cell wall of S.aureus.
B IOTEKNOLOGI 14 (1): 9-11, May 2017
10
The objective of this research was to determine the content of TA in cells of clinical and reference strains of S.aureus and study the relationship between these acids and adhesive properties of the cell wall.
MATERIALS AND METHODS
The research used 55 clinical strains isolated from patients with different pyoinflammatory infections and four reference strains (АТСС 25923) as the control group. In order to make the study more informative, the strains were divided into four groups. The first group is strains isolated from a purulent discharge of wounds in acute inflammatory processes (abscess, gangrene, acute purulent periostitis, phlegmon, acute appendicitis, acute hydradenitis, acute mastitis). The second group is strains isolated from a purulent discharge of wounds in protracted inflammatory processes (furunculosis, carbuncle, infected wounds, panaritium, atheroma, haematoma, erysipelas, bartolinitis). The third group is strains isolated from mucus of the fauces and nose during an examination for carriage. The remaining is reference strains АТСС 25923 of the control group.
Pure cultures were isolated in compliance with standard methods (MacFaddin 2000; David et al. 2004; Murray et al. 2011).
TA from cells of S. аurеus were extracted by addition of 10 % trichloroacetic acid to washings of agar cultures followed by precipitation with cold ethanol, washing with acetone, ethanol, and ether in a desiccator. The content of TA was determined at an SP-46 by optic density (OD) with wavelength λ = 254 nm.
RESULTS AND DISCUSSION
The results of this study showed that the values of TA content in S. аurеus in clinical and reference strains differed reliably (p < 0.05) (Table 1).
The values of average optical density were (0.542 ± 0.016) OD units in the 1st group and (0.147 ± 0.014) in the 4th one, thereby making a statistical difference. The values in the 2nd and 3rd groups were less versus the 1st one, but higher than in the reference strains. The values for these groups were, respectively, (0.381 ± 0.019) and (0.196 ± 0.013) OD units.
Thus, it was revealed that the content of TA in cells of S. аureus was higher in clinical isolates versus the reference strains, which might be caused by the degree of their aggressiveness and influenced the course of an infectious disease.
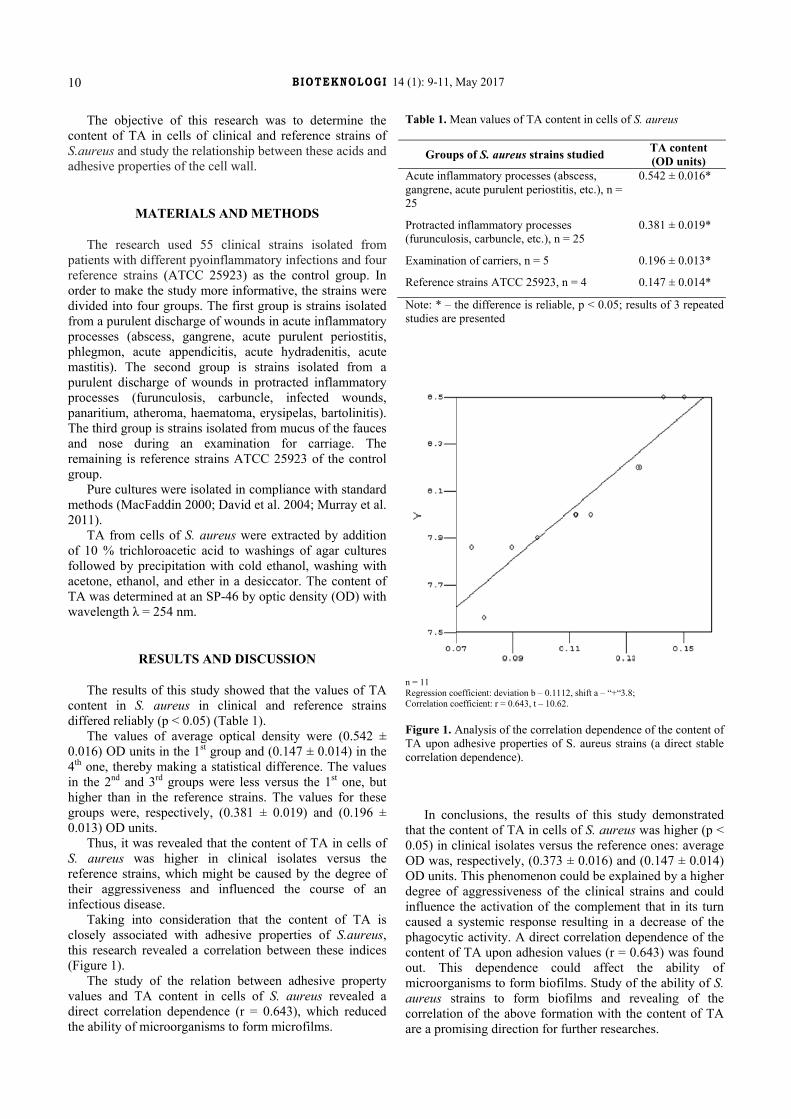
Taking into consideration that the content of TA is closely associated with adhesive properties of S.аureus, this research revealed a correlation between these indices (Figure 1).
The study of the relation between adhesive property values and TA content in cells of S. аureus revealed a direct correlation dependence (r = 0.643), which reduced the ability of microorganisms to form microfilms.
Table 1. Mean values of TA content in cells of S. аureus
Groups of S. aureus strains studied TA content (OD units)
Acute inflammatory processes (abscess, gangrene, acute purulent periostitis, etc.), n = 25
0.542 ± 0.016*
Protracted inflammatory processes (furunculosis, carbuncle, etc.), n = 25
0.381 ± 0.019*
Examination of carriers, n = 5 0.196 ± 0.013*
Reference strains АТСС 25923, n = 4 0.147 ± 0.014*
Note: * – the difference is reliable, р < 0.05; results of 3 repeated studies are presented
n = 11 Regression coefficient: deviation b – 0.1112, shift a – “+“3.8; Correlation coefficient: r = 0.643, t – 10.62. Figure 1. Analysis of the correlation dependence of the content of TA upon adhesive properties of S. aureus strains (a direct stable correlation dependence).
In conclusions, the results of this study demonstrated
that the content of TA in cells of S. aureus was higher (р < 0.05) in clinical isolates versus the reference ones: average OD was, respectively, (0.373 ± 0.016) and (0.147 ± 0.014) OD units. This phenomenon could be explained by a higher degree of aggressiveness of the clinical strains and could influence the activation of the complement that in its turn caused a systemic response resulting in a decrease of the phagocytic activity. A direct correlation dependence of the content of TA upon adhesion values (r = 0.643) was found out. This dependence could affect the ability of microorganisms to form biofilms. Study of the ability of S. aureus strains to form biofilms and revealing of the correlation of the above formation with the content of TA are a promising direction for further researches.
МINUKHIN & KOCHNEVA – Teichoic acids in Staphylococcus aureus
11
REFERENCES
Aly R, Shinefield HR, Litz C, еt аl. 1980. Role of teichoic acid in the binding of Staphylococcus aureus to nasal epithelial cells J Infect Dis 141 (4): 463-465.
Archibald AR, Amstrong JJ, Baddiley J еt аl. 1961. Teichoic acids and the structure of bacterial cell wall. Nature 24: 570-572.
Archibald AR. 1974. The structure, biosynthesis and function of teichoic acid. Adv Microb Physiol 11: 53-59.
Archibald AR. 1988. Bacterial Cell Wall Structure and the Ionic Environment. Bath University Press. 47: 159-173.
Archibald AR. 1993. Cell wall structure, synthesis, and turnover. American Society for Microbiology, Washington D.C.
Baddiley J, Davison AL. 1961. The occurrence and location of teichoic acids in lactobacilli. J Gen Microbiol 24: 295-299.
Bera A. 2007. Influence of wall teichoic acid on lysozyme resistance in Staphylococcus aureus. J Bacteriol 189: 280-283.
Biswas R, Martinez RE, Göhring N et al. 2012. Proton-binding capacity of Staphylococcus aureus wall teichoic acid and its role in controlling autolysin activity. PLoS One 7 (7): e41415. DOI: 10.1371/journal.pone.0041415.
Cramton SE, Gerke C, Schnell NF et al. 1999. The intercellular adhesin (ica) locus is present in Staphylococcus aureus and is required for biofilm formation. Infect Immun 67: 5427-5433.
David KW, Robert SL, Liana RM et al. 2004. Detection of Methicillin-resistant Staphylococcus aureus directly from nasal swab specimens by a real-time PCR assay. J Clin Microbiol 42 (12): 5578-5581.
MacFaddin JF. 2000. Biochemical Tests for Identification of Medical Bacteria, 3rd ed. Lipincott Williams & Wilkins, Philadelphia, PA.
Matthias G, Sarah EC, Friedrich G еt аl. 2001. Key role of teichoic acid net charge in Staphylococcus aureus colonization of artificial surfaces. Infect. Immun. 69 (5): 3423-3426.
Murray PR et al. 2011. Manual of Clinical Microbiology, 10th ed. American Society for Microbiology, Washington, D.C.
Naumova IB, Shashkov AS, Tul'skaya EM еt аl. 2001. Cell wall teichoic acids: structural diversity, species specificity in the genus Nocardiopsis, and chemotaxonomic perspective. FEMS Microbiol Rev 25 (3): 269-284.
Sanderson AR, Strominger JL, Nathenson SG. 1962. Chemical structure of teichoic acid from Staphylococcus aureus, strain Copenhagen. J Biol Chem 237 (12): 3603-3613.
Scheffers DJ, Pinho MG. 2005. Bacterial cell wall synthesis: new insights from localization studies. Microbiol Mol Biol Rev 69: 585-607.
Schlag M. 2010. Role of staphylococcal wall teichoic acid in targeting the major autolysin Atl Mol Microbiol 75: 864-873.
Sieradzki K, Tomasz A. 1999. Gradual alterations in cell wall structure and metabolism in vancomycin-resistant mutants of Staphylococcus aureus. J Bacteriol 181: 7566-7570.
Stephanie B, Guoqing X, Lyly G еt аl. 2012. Methicillin resistance in Staphylococcus aureus requires glycosylated wall teichoic acids. Proc Natl Acad Sci U S A 109 (46): 18909-18914.
Xia G, Kohler T, Peschel A. 2010. The wall teichoic acid and lipoteichoic acid polymers of Staphylococcus aureus. Int J Med Microbiol 300: 148-154.
BIOTEKNOLOGI ISSN: 0216-6887 Volume 14, Number 1, May 2017 E-ISSN: 2301-8658 Pages: 12-15 DOI: 10.13057/biotek/c140103
Identification of structural and elemental composition of Cassia obtusifolia
ABDALLAH YOUSIF ADAM AHMED1,♥, ALI A. S. MAROUF2,♥♥ 1 Collage of Education, Geneina University, Khartoum. ♥email: [email protected]
2 Institute of Laser, Sudan University of Science and Technology, Khartoum. ♥♥email: [email protected], [email protected]
Manuscript received: 31 December 2016. Revision accepted: 6 April 2017.
Abstract. Ahmed AYA, Marouf AAS. 2017. Identification of structural and elemental composition of Cassia obtusifolia. Bioteknologi 14: 12-15. Kawal is a dried fermentation product of the sicklepod (Cassia obtusifolia) leaves. The people of Sudan and Chad used kawal as a meat substitute. In this study, kawal was obtained from Forbranga western of Darfour as a powder. The objective of this study was identification the chemical compositions of the Kawal. FTIR spectrum and atomic absorption spectrophotometer methods were used. In FTIR experimental procedure, the sample was used as a dried powder. While for the atomic absorption and inductively coupled plasma the sample was used after combustion for extracting the minerals (K, P, Na, Mg, Ca, Zn and Fe). The investigations with FTIR showed that the Fermented leaves of C obtusifolia (Kawal) consisted of several types of molecular functional groups: alkyl halide, alkene, a nitro functional group, aromatic, carbonyl, alcohol, esters, ether, and acid and amides. Minerals content in the samples were identified About 2.50% was found is the presence of calcium and the other minerals as Mg 0.66%, P 0.393%, Na 0.165% and K about 1.595%. Moreover, for extracting the Iron (Fe) and Zinc (Zn) minerals of fermented cassia leaves the atomic absorption spectrophotometer was used and found that Zn was 0.665mg/L and Fe consist of the value 15.6411mg/L.
Keywords: Cassia obtusifolia, fermented leaves, spectroscopic
INTRODUCTION
Cassia obtusifolia (Leguminosae), also known as sicklepod is a plant grew wild in Africa, and it found in wastelands in the rainy season. The people from western part of Sudan and Eastern part of Chad take benefit from the plant due to its leaves can be fermented to become protein-rich food, kawal. Considering as an alternative source for meat or meat extender, kawal have a significant role in providing protein source during famine years, probably protected many children against kwashiorkor. However, like today, because of its pungent, fetid odor that lingers on the fingers for hours, kawal was refused by the elite who consider it unfit for modern social life (Algadi and Yousif 2015).
Study of the nutritional quality of C. obtusifolia leaves and kawal (their chemical composition, protein fractions, in vitro protein digestibility, amino acid contents, mineral content, phytic acid, tannin and total polyphenol of cassia leaves) revealed that fermentation in the kawal processing has resulted in the increase of in vitro protein digestibility, fat, protein and ash content and a decrease in fiber content. (Algadi and Yousif, 2015; Algadi, 2008). Moreover, previous studies by Nuha et al. (2010) also indicated the changes in the chemical composition, anti-nutrients and extractable minerals among the green leaves, kawal and cooked leaves of Cassia. Their samples were as a dry powder. They found that the protein and ash contents increased after cooked, the total energy of the both samples were decreased after fermentation process and cooked. Furthermore, anti-nutritional factors (tannin, phytate, total
polyphenols) also decreased in the treated samples, but there is an increase in the total major minerals. Total polyphenols by using spectrophotometer method by Price and Bulter (1977), minerals composition by Chapman and Pratt (1982) and HCl extractability by using Chauhan and Mahjan (1988).
Mbaiguinam et al. (2005) studied the chemical components of kawal and found aliphatic acids, and they identified as hexanoic acid (27‰), butyric acid (10.4‰), and valeric acid (6.3‰) by using laser amounts of p-ethylphenol and p-methyl phenol. They also found a higher portion of protein fraction of the crude leaves i.e. 20.2‰ compare to fermented leaves (kawal) 12.9‰. They used dried samples and used gas chromatography and gas chromatography-mass spectrometry (GC/MS) for analyzing volatiles compounds. For amino acid analysis, the kawal and leaves were hydrolyzed under nitrogen and HCl vapor by using pico-tag work and followed by chromatography for Amino acids identification. The objectives of this study were spectroscopic studies for the dry fermented C. obtusifolia leaves.
MATERIALS AND METHODS
Materials The fermented leaves of Cassia obtusifolia or kawal
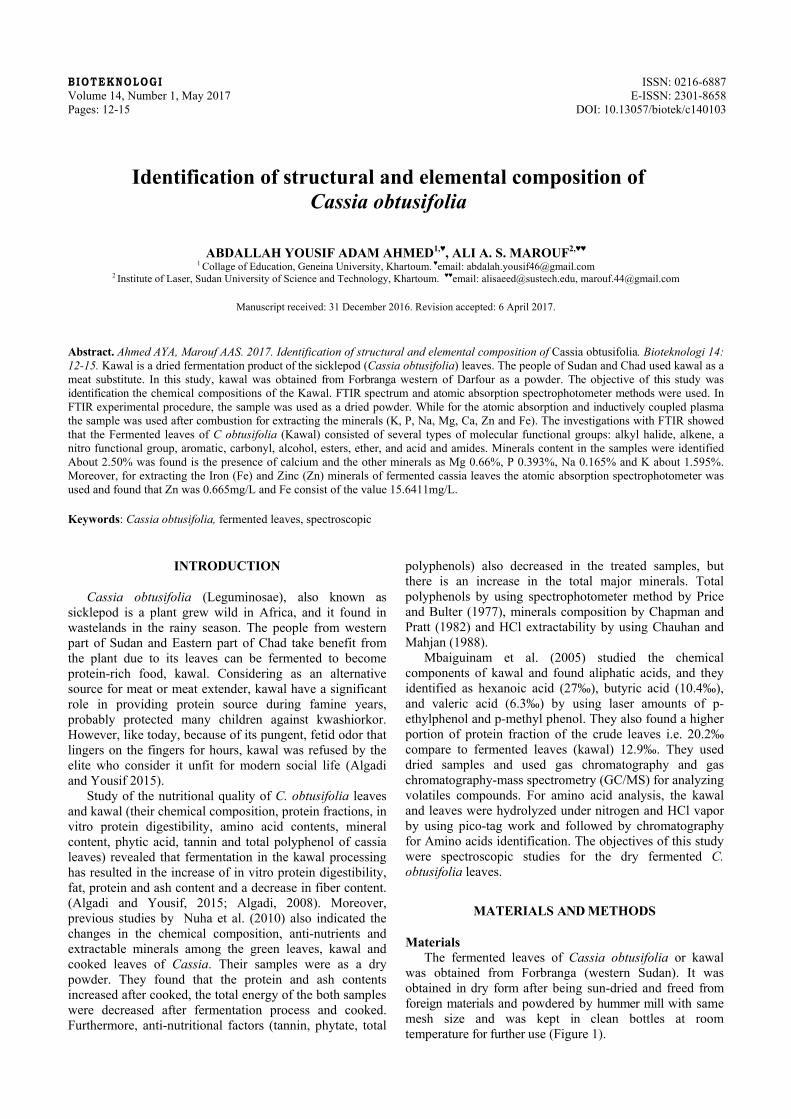
was obtained from Forbranga (western Sudan). It was obtained in dry form after being sun-dried and freed from foreign materials and powdered by hummer mill with same mesh size and was kept in clean bottles at room temperature for further use (Figure 1).
AHMED & MAROUF – Chemical constituent of dry fermented leaves of Cassia obtusifolia
13
Figure 1. Sun-dried powder of kawal (Cassia obtusifolia)
Methods Sample was analyzed at room temperature. To identify
the presence of certain functional groups in the sampleIR spectrum was recorded on Fourier transformer spectrometer FTIR-8400 spectrophotometer (Shimadzu, Kyoto, Japan). For further analysis, the atomic absorption spectrophotometer (model AA-6800, Shimadzu) was used to identify the mineral contents (Ca, Na, K, Mg, P, Zn and Fe)composition of the sample.
FTIR analysis In this experiment 100mg from potassium bromide
(KBr) was used additionally to 1 mg sample of the dry powder kawal. Furthermore, KBR and the sample were mixed until became a mixture. The mixture samples were compressed after put them on the piston and then applied to Fourier transformer spectrometer device for detection of mineral contents of fermented cassia leaves.
Digestion method Ca, Na, K, Mg and P digestion method was applied to
prepare the sample for spectroscopy analysis. The sample was digested in HNO3/HCl4 and elements were detected by inductively coupled plasma spectroscopy (ICPS). Heater, test tube, and flasks were used as apparatus. 2g of the sample was weighed into test tubes, 8 mL HNO3 was added to the test tubes and covered them with glass ball and left it to stand for overnight, another HNO3 produces fumes was added preferably was did it in the chamber, 3 mL of HClO4 acid was added and heated slowly until almost dry. Moreover, then glass ball was removed and heated strongly until white fumes disappeared, tubes were cooled and 5 mL of 0.1N HCl was added and boiled gently for 30 minutes after left it for cooling the solution was transferred into the 50 mL flask. The tubes were rinsed with 10 mL of 0.1N HCl and boiled gently for 10 minutes, the solution was
poured into the previously flask and filled it to 50 mL mark with 0.1N HCl, the ICP readings were recorded.
Atomic Spectroscopic Method For analyzing of Iron and Zn the atomic spectroscopy
method was used after combustion the sample. The optics parameters were set in following specification: lamp current low (Am) (12 and 8), wavelength (nm) 248.3 and 213.9, slid width (nm) (0.2 and 0.5) and lamp mode BGC-D2. The atomizer/gas-flow was set up as follow: fuel gas flow rate (L/min) (2.2 and 2), flame type Air-C2H2, burner height (mm) (9 and 7), burner lateral pos (pulse) 0 and burner angle (degree) 0.and measurements parameters are: order first, zero intercept no, unit mg/L, repetition sequence SM-M-M-…., pre-spray time (sec) 3, integration time (sec) 5 and response time 1.
RESULTS AND DISCUSSIONS
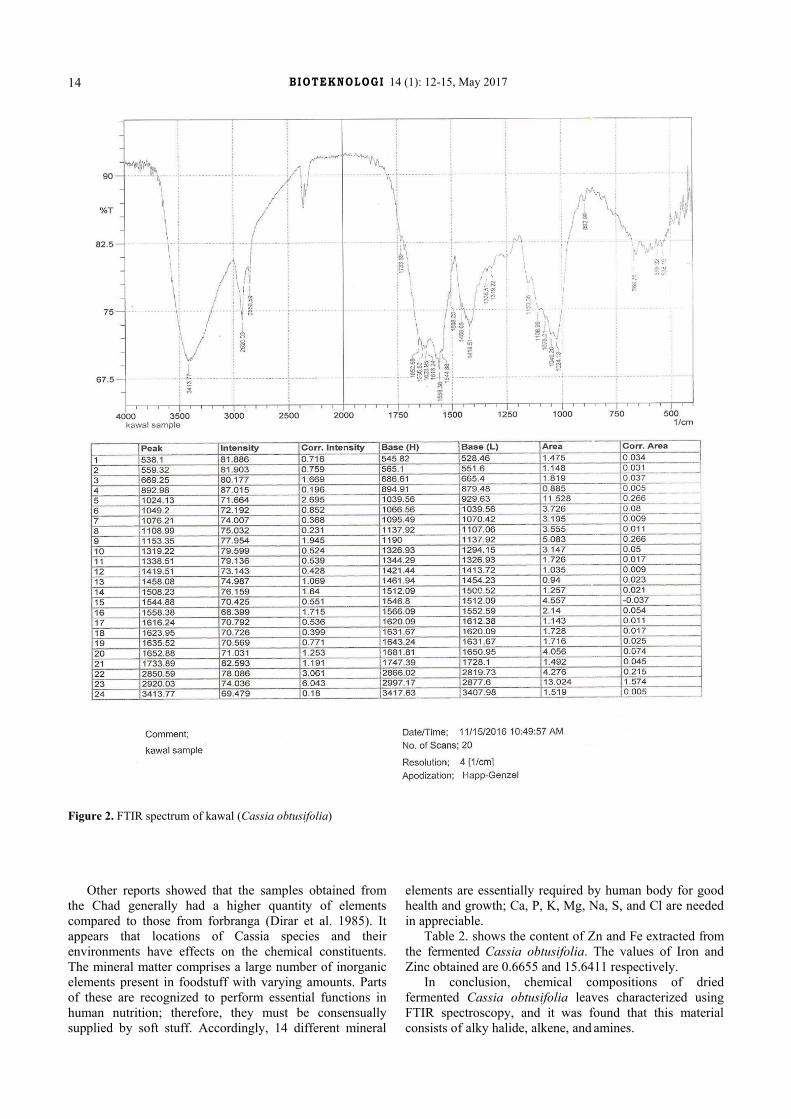
FTIR spectrum of fermented cassia obtusifolia leaves revealed several regions of frequencies that leads to identifying of molecule group. Chemical compositions of fermented kawal is shown in Figure 2. Kawal was found consist of several types of molecules with three functional groups. On the alkyl-halide functional group was found C-Br which has strong intensity vibration stretch, C-CL with strong intensity of stretching moves, and C-F molecular with the same prescriptions. While the alkene functional group consist of C-H with bending strong mode of vibration, the two-C-H alkenes have bending mode of vibration, but their intensity is variable, the three C=C alkenes have variable intensity with stretch motion and the two C-H with the strong stretch mode of vibration.
The absorption frequencies also identified N-O which belong to nitro functional group with stretch vibration mode and strong intensity. The C=C is an aromatic molecule, stretch mode and its intensity is medium weak or multiple bands. C=O is carbonyl with strong stretch. O-H is alcohol structure which has stretch, H-bonded vibration and strong broad intensity. The two C-O are esters function group with stretch vibration mode and two bonds or more intensity. The ether C-O with the same descriptions of ester. The acid C-O stretch strong intensity of vibration. Lastly, the two N-H amides have bending modes of vibrations and their intensity are medium (Silverstein et al. 2014).
The minerals (calcium, magnesium, phosphorus, sodium, and potassium) of kawal is reported in Table 1. Calcium and Potassium have relatively high proportion compared to other minerals. About 2.50% was found as Calcium and the other minerals, magnesium 0.66%, phosphorus 0.396%, sodium 0.165% and potassium about 1.595%. These results indicated the fermented leaves of C. obtusifolia contain the major elements needed by the human body (Table 1).
B IOTEKNOLOGI 14 (1): 12-15, May 2017
14
Figure 2. FTIR spectrum of kawal (Cassia obtusifolia)
Other reports showed that the samples obtained from
the Chad generally had a higher quantity of elements compared to those from forbranga (Dirar et al. 1985). It appears that locations of Cassia species and their environments have effects on the chemical constituents. The mineral matter comprises a large number of inorganic elements present in foodstuff with varying amounts. Parts of these are recognized to perform essential functions in human nutrition; therefore, they must be consensually supplied by soft stuff. Accordingly, 14 different mineral
elements are essentially required by human body for good health and growth; Ca, P, K, Mg, Na, S, and Cl are needed in appreciable.
Table 2. shows the content of Zn and Fe extracted from the fermented Cassia obtusifolia. The values of Iron and Zinc obtained are 0.6655 and 15.6411 respectively.
In conclusion, chemical compositions of dried fermented Cassia obtusifolia leaves characterized using FTIR spectroscopy, and it was found that this material consists of alky halide, alkene, and amines.
AHMED & MAROUF – Chemical constituent of dry fermented leaves of Cassia obtusifolia
15
Table 1. Mineral elements contents of kawal The element Amount of kawal Calcium 2.50% Magnesium 0.66% Phosphorus 0.396% Sodium 0.165% Potassium 1.595% Table 2. Content of Zn and Fe of sample Mg/L Mineral Content (mg/L) Zn 0.6655 Fe 15.6411
REFERENCES
Algadi MZ, Yousif NE. 2015. Anti-nutritional factors of green leaves of Cassia obtusifolia and Kawal. J Food Process Technol 6:483. doi: 10.4172/2157-7110.1000483
Algadi MZAO. 2008. The Effect of Fermentation on Nutritional Quality of Cassia obtusifolia Leaves (kawal). Department of Food Science and Technology Faculty of Agriculture University of Khartoum, Khartoum.
AOCS. 2009. Official Methods and Recommended Practices of the American Oil Chemists’ Society. 6th ed. American Oil Chemists’ Society, Champaign, Illinois, USA.
Chapman HD, Pratt FP. 1982. Determination of minerals by titration method. Methods of Analysis for Soils, Plants and Water. 2nd ed. Chapman and Hall, Oakland, CA
Chauhan BM, Mahjan H. 1988. Effect of natural fermentation on the extractability of minerals from pearl millet flour. J Food Sci 53: 1576-1577.
Dirar HA, Harper DB, Collins MA. 1985. Biochemical and microbiological studies on Kawal, a meat substitute derived by fermentation of Cassia obtusifolia leaves. J Sci Food Agric 63: 881-892.
Duke JK. 1981. Handbook of Legumes of World Economic Importance. Plenum Press, New York.
Mbaiguinam M, Mahmout Y, Tarkodjiel M, Delobel B, Bessiere J-M. 2005. Constituents of Kawal, fermented Cassia obtusifolia leaves, a traditional food from Chad. Afr J Biotechnol 4 (10): 1080-1083.
Nuha MO, Isam AMA, Elfadil EB. 2010. Chemical composition, antinutrients and extractable minerals of Sicklepod (Cassia obtusifolia) leaves as influenced by fermentation and cooking. Intl Food Res J 17: 775-785.
Price ML, Butler LG. 1977. Rapid visual estimation and spectrophotometric determination of tannin content of sorghum grain. J Agric Food Chem 25: 1268-1273.
Saunders RM, Conner MA, Booth AN, Bickott EM, Kohler GO. 1973. Measurements of digestibility of altalta proteins concentrate by in vivo and in vitro methods. J Nutr 103: 530-535.
Silverstein RM, Webster FX, Kiemle DJ, Bryce DL. 2014. Spectrometric Identification of Organic Compounds, 8th ed. John Wiley and Sons, New York.
Wheeler EL, Ferrel RE. 1971. A method for phytic acid determination in wheat and wheat fractions. Cereal Chem 48: 312-320.
BIOTEKNOLOGI ISSN: 0216-6887 Volume 14, Number 1, May 2017 E-ISSN: 2301-8658 Pages: 16-18 DOI: 10.13057/biotek/c140104
Short Communication: Inhibitory effect of Sapindus rarak ethyl acetate extract on
Staphylococcus aureus
YUSIANTI SILVIANI Akademi Analis Kesehatan Nasional. Jl. Yos Sudarso No.338, Serengan, Surakarta 57155,Central Java, Indonesia. Tel.: +62-271-644958, ♥email:
Manuscript received: 6 March 2017. Revision accepted: 26 April 2017.
Abstract. Silviani S. 2017. Short Communication: Inhibitory effect of Sapindus rarak ethyl acetate extract on Staphylococcus aureus. Bioteknologi 14: xxxx. The research aimed to know the Minimum Inhibitory Concentration (MIC), the Minimum Killing Concentration (MKC) and the inhibitory fungal zone of Sapindus rarak - ethyl acetate extract on Staphylococcus aureus. The research used an experimental descriptive design by using controlled post-test approach by measuring the value of MIC, MKC and the inhibitory fungal zone. This research was performed in 2016 at the Bacteriology Laboratory of Akademi Analis Kesehatan Nasional (Academy of National Health Analist) by using dilution method and diffusion disc. The result of this research showed that the value of MIC was not able to be concluded, the value of MKC was 80% and the greatest inhibitory effect zone achieved at 100% concentration was 10.3 mm. The ethyl acetate extract claimed medium to strong inhibitory effect on Staphylococcus aureus.
Keywords: Inhibitory effect, Staphylococcus aureus, ethyl acetate extract, MIC, MKC
INTRODUCTION
Indonesia is rich in natural resources which provide benefit for human health. Sapinus rarak (Sapindaceae), because of its chemical content like alkaloid, tannin, polyphenol, flavonoid, and saponin has believed as a useful bio-resource with antibacterial potentialities (Silviani and Puspitaningrum 2015). The plant, that local people used as batik washing material are available in high abundance in this country.
Acne is a blockage of skin and hair oil gland channel marked by skin inflammation. (Rahmi et al. 2015). Acne is familiar to society especially to teenagers and might cause psychological problem (Uhlenhake et al. 2010). Eighty-five percent of acne cases belong to females of age 14-17 years and males of age 16-19 years (Hasan et al. 2015).
Staphylococcus aureus inflicts acnes by invading hair follicle tissue, multiplies and causes necrosis (Razak et al. 2013). In some countries, the bacteria has recognized resistant to penicillin group including methicillin (Hilda et al. 2015). Khusnan et al. (2016) state that S. aureus is resistant to penicillin 78%, doxycycline 56%, gentamicin 26%, tetracycline 22%, erythromycin 13% and methicillin 9%. Morell and Balkin (2011) state that there is a higher resistance of S. aureus to antibiotic from 2% to 64% in 2004. Recently, natural bioresources are chosen by people as one of the alternatives to prevent resistance and minimize the side effect (Fatisa 2013).
Based on the above situation, this research was performed to explore the antibacterial properties of S. rarak
against S. aureus base on the value of Minimum Inhibitory Concentration (MIC), Minimum Killing Concentration (MKC) and the diffusion disc.
MATERIALS AND METHODS
Material Material used in this research was fresh fruit of
Sapindus rarak obtained from Sky Argo Distributor in Solo, while the S. aureus isolate was obtained from agents with acnes. This research was performed by using experimental analytical design and controlled post-test approach. Quota sampling was the technique chosen.
Extraction preparation Brown S. rarak fruit having diameter 2 cm were
chosen. The fruit were cleaned and the seeds were taken out, and then dried. Dried S. rarak were meshed using a 20 mesh sieve and kept in a closed container (Samsuharto 2010).
Making ethyl acetate extract Ethyl Acetate Extraction was done by using maceration
method. Maceration is a process of extracting simplicia by shaking or stirring with ethyl acetate solvent in room-temperature for 5 days. Then, the extract was obtained after filtration and evaporation of ethyl acetate solution until a constant weight. The ethyl acetate extract was then tested by using qualitative phytochemical test.
SILVIANI et al. – Sapindus rarak inhibitory on Staphylococcus aureus
17
Checking the Minimum Inhibitory Concentration As much as 1 ml Nutrient Broth was added into 8 test
tubes. Tubes 1-6 were set for concentration sample of 75% to 100% , tube 7 was set for positive control and tube 8 was for negative control. A suspension of 1 ml bacteria, adjusted to Mc Farland standard no 0.5 which had been diluted 100X, was then added to each of the tubes, number 1-8. Tubes number 1-7 were filled with S. rarak ethyl acetate extract with varied concentration and tube number 8 was filled with S. rarak ethyl acetate extract of 100% concentration. Incubate all tubes at 370 C for 24 hours. Notice the turbidity of each tube.
Checking the Minimum Killing Concentration Inoculate as much as 36 ose (1 mm diameter) of each
tube to Nutrient Agar Plate media by streaking. Incubate all tubes at 370 C for 24 hours. Note the colony growth in every plate.
Checking Diffusion Disc Inoculate bacterial suspension with density 1.0 x 10⁸
CFU/ml into Nutrient Agar plate evenly. Then set the blank disc that had been filled with S. rarak ethyl acetate extract. Incubate all tubes at 370 C for 24 hours (CLSI 2006)
RESULTS AND DISCUSSION
The phytochemical test of ethyl acetate extract was shown in Table 1. Based on Table 1, it was confirmed that S. rarak - ethyl acetate extract has antibacterial properties as indicated by its secondary metabolites substances or active materials.
Table 2 revealed that the value of MIC could not be concluded because there was turbidity in S. rarak extract control, thus the turbidity in the concentration treatment might result from S. rarak - ethyl acetate extract.
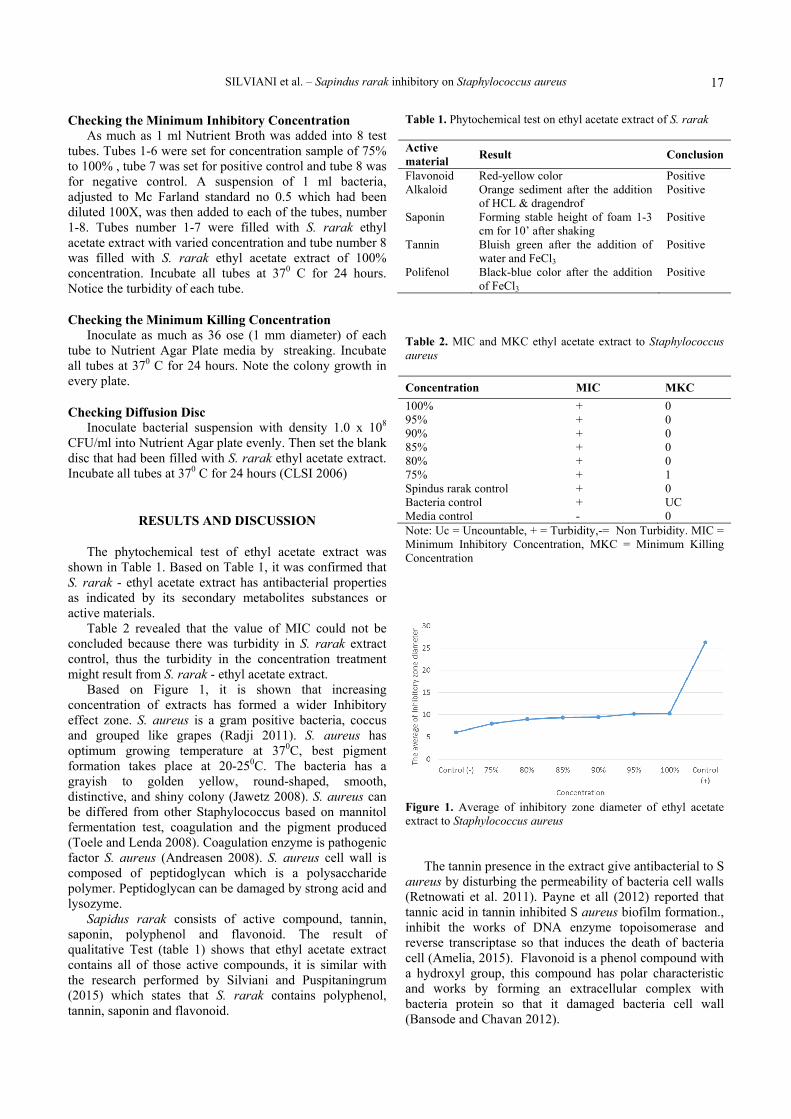
Based on Figure 1, it is shown that increasing concentration of extracts has formed a wider Inhibitory effect zone. S. aureus is a gram positive bacteria, coccus and grouped like grapes (Radji 2011). S. aureus has optimum growing temperature at 370C, best pigment formation takes place at 20-250C. The bacteria has a grayish to golden yellow, round-shaped, smooth, distinctive, and shiny colony (Jawetz 2008). S. aureus can be differed from other Staphylococcus based on mannitol fermentation test, coagulation and the pigment produced (Toele and Lenda 2008). Coagulation enzyme is pathogenic factor S. aureus (Andreasen 2008). S. aureus cell wall is composed of peptidoglycan which is a polysaccharide polymer. Peptidoglycan can be damaged by strong acid and lysozyme.
Sapidus rarak consists of active compound, tannin, saponin, polyphenol and flavonoid. The result of qualitative Test (table 1) shows that ethyl acetate extract contains all of those active compounds, it is similar with the research performed by Silviani and Puspitaningrum (2015) which states that S. rarak contains polyphenol, tannin, saponin and flavonoid.
Table 1. Phytochemical test on ethyl acetate extract of S. rarak Active material Result Conclusion
Flavonoid Red-yellow color Positive Alkaloid Orange sediment after the addition
of HCL & dragendrof Positive
Saponin Forming stable height of foam 1-3 cm for 10’ after shaking
Positive
Tannin Bluish green after the addition of water and FeCl3
Positive
Polifenol Black-blue color after the addition of FeCl3
Positive
Table 2. MIC and MKC ethyl acetate extract to Staphylococcus aureus Concentration MIC MKC 100% + 0 95% + 0 90% + 0 85% + 0 80% + 0 75% + 1 Spindus rarak control + 0 Bacteria control + UC Media control - 0 Note: Uc = Uncountable, + = Turbidity,-= Non Turbidity. MIC = Minimum Inhibitory Concentration, MKC = Minimum Killing Concentration
Figure 1. Average of inhibitory zone diameter of ethyl acetate extract to Staphylococcus aureus
The tannin presence in the extract give antibacterial to S
aureus by disturbing the permeability of bacteria cell walls (Retnowati et al. 2011). Payne et all (2012) reported that tannic acid in tannin inhibited S aureus biofilm formation., inhibit the works of DNA enzyme topoisomerase and reverse transcriptase so that induces the death of bacteria cell (Amelia, 2015). Flavonoid is a phenol compound with a hydroxyl group, this compound has polar characteristic and works by forming an extracellular complex with bacteria protein so that it damaged bacteria cell wall (Bansode and Chavan 2012).
B IOTEKNOLOGI 14 (1): xxx, May 2017
18
Alkaloid works as antibacterial substance by disturbing the forming layers of bacteria cell wall, especially on peptidoglycan site. (Paju 2013). The Inhibition of the cell wall formation causes the death of bacteria. Tannin and flavonoid compounds are mostly drawn by using ethyl acetate solvent. Because of ethyl acetate is semi-polar solvent, tannin and flavonoid concentration are higher in ethyl acetate than in any other extracts (Tanaya et al. 2015).
The result of S. rarak - ethyl acetate extract diffusion disc to S. aureus (Figure 1) could not be compared to control ( + ), that is ciprofloxacin. As previously mentioned by Davis and Stouts (1971) that antibacterial inhibitory level of natural material can be classify into 4 categories, they are: weak if the inhibitory level is ≤ 5 mm, medium if the inhibitory level is 5-10 mm, strong if the inhibitory level is 10-19 mm, and very strong if the inhibitory level established is more than 20 mm. In this research, the inhibitory zone of ethyl acetate extract was medium to strong. 80% extract concentration resulted medium inhibitory level, 85%-100% concentration resulted strong inhibitory level.
The result supports the earlier report by Marsa’s (2010) which stated that S. rarak extract was able to inhibit the growing of Enterococcus faecalis, while Silviani and Puspitaningrum (2015) stated that both ethanol and ethyl acetate extracts were able to inhibit enterophatogenic Escherichia coli and enterotoxigenic E. coli.
Conclusions drawn from this research are: (i) MIC of ethyl acetate extract to S. aureus could not be concluded. (ii) MKC of ethyl acetate extract to S. aureus was 80%. (iii) The greatest Inhibitory Zone formed was 10.3 mm for 100% concentration. Some suggestion for further researches including fractionation test and toxicity tests should be done to active compound of any extracts.
REFERENCES
Amelia F. 2015. Penentuan jenis tanin dan penetapan kadar tanin dari buah bungur muda (Lagerstroemia speciosa Pers.) secara spektrofotometri dan permanganometri. Jurnal Ilmiah Mahasiswa Universitas Surabaya 4 (2): 1-20. [Indonesian]
Andreasen CB. 2008. Staphylococcosis. In: Saif YM, Fadly AM, McDougald NLK, Swayne DE (eds). Diseases of Poultry. 12th ed. Blackwell, New York.
Bansode DS, Chavan MD. 2012. Studies of antimicrobial activitiy and phitochemical analysis of citrus fruit juices against selected enteric phatogens. Intl Res J Pharmacy 3 (11): 122-126.
CLSI. 2006. Metods for Dilution Antimicrobial Susceptibility Test for Bacteria Grow Aerobically: Approved Standart-Seventh edition. CLSI, West Valley Road, USA.
Davis WW, Stout TR. 1971. Disc Plate Method Of Microbiological Antibiotic Essay. J Microbiol 22 (4): 669-665.
Fatisa Y. 2013. Daya antibakteri ekstrak kulit dan biji buah pulasan (Nephelium mutabile) terhadap Staphylococcus aureus dan Escherichia coli secara in vitro. Jurnal Peternakan 10 (1): 31-38. [Indonesian]
Hasan SH, Kapel B, Rompas SS. 2015. Hubungan pola makan dengan kejadian acne vulgaris pada mahasiswa semester V (lima) di Program Studi Ilmu Keperawatan Fakultas Kedokteran Universitas Sam Ratulangi Manado. E-journal Keperawatan 3 (1): 1-8. [Indonesian]
Jawetz E Melnick JL, Adelberg EA. 2008. Mikrobiologi Kedokteran. Edisi 23. Penerbit Buku Kedokteran EGC, Jakarta. [Indonesian]
Khusnan, Kusmanto D, Slipranata S. 2016. Resistensi antibiotik dan deteksi gen pengode methicilin resistant Staphylococcus aureus (MRSA) isolat broiler di wilayah Yogyakarta. Jurnal Kedokteran Hewan 10 (1) : 13-16. [Indonesian]
Marsa RD. 2010. Efek Antibakteri Ekstrak Lerak dalam Pelarut Etanol terhadap Enterococcus faecalis (secara Invitro). (Skripsi). Universitas Sumatra Utara, Medan. [Indonesian]
Morell EA, Balkin D.M. 2011. Methicillin-Resistant Staphylococcus aureus: A pervasive pathogen highlights the need for new antimicrobial development. Yale J Bio Med 83 (4): 223-233.
Paju N, Yamlean P V J, Kojong N. 2013. Uji efektivitas salep ekstrak daun binahong (Anredera cordifolia (Ten.) Steenis) pada kelinci (Oryctolagus cuniculus) yang terinfeksi bakteri Staphylococcus aureus. Jurnal Ilmiah Farmasi-UNSRAT 2 (1): 51-61. [Indonesian]
Payne D.E, Martin N.R, Parzych K.R, Rickard A.H, Underwood A, Boles, B.R. 2012. Tannic Acid Inhibits Staphylococcus aureus Surface Colonization in a n IsaA-Dependent Manner. J Assoc Soc Microbiol 81 (2): 496-504.
Radji M. 2011. Buku Ajar Mikrobiologi: Panduan Mahasiswa Farmasi dan Kedokteran. EGC, Jakarta. [Indonesian]
Razak A, Djamal A, Revilla G. 2013. Uji daya hambat air perasan buah jeruk nipis (Citrus aurantifolia) terhadap pertumbuhan bakteri Staphylococcus aureus secara in vitro. Jurnal Kesehatan Andalas 2(1): 5-8.
Retnowati Y, Bialangi N, Posangi N.W. 2011. Pertumbuhan Bakteri Staphylococcus aureus Pada Media Yang Diekspos dengan Infus Daun Sambiloto (Andrographis paniculata) . Jurnal Saintek 6 (2): 1-10. [Indonesian]
Silviani Y, Puspitaningrum A. 2015. Uji Efektivitas ekstrak etil asetat dan etanol buah lerak (Sapindus rarak) terhadap pertumbuhan enterophatogenic Escherichia coli dan enterotoxigenic Escherichia coli. Jurnal Biomedika 8 (1): 2-5. [Indonesian]
Tanaya V, Retnowati R, Suratmo. 2015. Fraksi semi polar dari daun mangga kasturi (Mangifera casturi Kosterm). Kimia Student Journal 1 (1): 778-784. [Indonesian]
Toele N.N, Lenda. 2014. Identifikasi dan karakteristik Staphylococcus sp. dan Streptococcus sp.dari infeksi ovarium pada ayam petelur komersial. Jurnal Ilmu Ternak 1 (7): 32-37: 778-784. [Indonesian]
Udarno L. 2009. Lerak (Sapindus rarak) tanaman industri pengganti sabun. Warta Penelitian dan Pengembangan Tanaman Industri 2 (15). Badan Penelitian dan Pengembangan Perkebunan, Bogor. [Indonesian]
Uhlenhake E, Yentzer BA, Feldman SR (2010). Acne vulgaris and depression: a retrospective examination. J Cosmet Dermatol 9 (1): 59-53.
BIOTEKNOLOGI ISSN: 0216-6887 Volume 14, Number 1, May 2017 E-ISSN: 2301-8658 Pages: 19-23 DOI: 10.13057/biotek/c140105
Bioethanol production from rice and corn husks after enzymatic and microbes hydrolysis and yeast fermentation
TJAHJADI PURWOKO♥, SITI LUSI ARUM SARI, EDWI MAHADJOENO, SUNARTO Department of Biology, Faculty of Mathematics and Natural Sciences, Universitas Sebelas Maret. Jl. Ir. Sutami 36A Surakarta 57 126, Central Java,
Indonesia. Tel./Fax. +62-271-663375, ♥email: [email protected]
Manuscript received: 3 November 2016. Revision accepted: 26 April 2017.
Abstract. Purwoko Tj, Sari SLA, Mahadjoeno E, Sunarto. 2017. Bioethanol production from rice and corn husks after enzymatic and microbes hydrolysis and yeast fermentation. Bioteknologi 14: 19-23. Bioethanol is a renewable resource that can be produced from fermented cellulosic biomass. The use of lignocellulosic materials from agricultural wastes provides a low-cost fermentative substrate. Lignocellulosic ethanol production involves acid or enzymatic hydrolysis. The enzymatic hydrolysis is high cost however in environmental issue this step is favorable. The purpose of this research was to compare bioethanol production after microbes and cellulosic enzymes hydrolysis following yeast Saccharomyces cerevisiae fermentation from rice and corn husks.The rice and corn husks (1 kg) were each suspended into water until the volumes reached 5 L. The sample mixtures were treated with 2.5 mg/L cellulases, 5 g/L multienzymes, and 5 mL/L EM4 respectively. The mixtures were stirred for 24 hours at pH 5.7 and 35°C. After hydrolysis, the samples (100 mL) were treated by 1, 2, and 3 % w/v Baker’s yeasts. The samples were fermented at incubator shaking for 6 days at 30°C, 90 rpm, and pH 6.5. Sugar concentrations were determined by dinitrosalicylic acid (DNS) colorimetric method. Bioethanol productions and specific gravity method and then compared to IAOC Ethanol Table. Sugar concentrations and bioethanol production after multienzymes hydrolysis of rice and corn husks were 6.54-6.81 mg/mL and 3.17-3.54 mg/mL, respectively. Sugar concentrations of rice and corn husks after multienzymes hydrolysis treatment was higher than EM4 and cellulases hydrolysis treatments. Therefore bioethanol productions of rice and corn husks after multienzymes hydrolysis and yeasts after 2 days fermentation were higher than the others.
Keywords: Bioethanol, corn husk, multienzymes, rice husk, sugar concentration
INTRODUCTION
Energy crisis and increased environmental awareness emerge a need for more sources of renewable, the green energy around the world. Bioethanol can be produced through fermentation of sugars. Worldwide interest in the utilization of bioethanol as an energy source has its concern on the efficiency and cost of industrial processes for bioethanol production. Even though the fermentative process of bioethanol production is well known, the production costs are still the important factor for the wide use of bioethanol as a fuel. Therefore, development of fermentation processes using cheap carbon sources is important for commercial scale production.
Bioethanol is a renewable resource that can be produced from fermented cellulosic biomass. Bioethanol does not add to a net-CO atmospheric increase. Thus there is no contribution to global warming. Combustion of ethanol results in relatively low emissions of volatile organic compounds, carbon monoxide and nitrogen oxides (Park et al. 2010), therefore can reduce greenhouse gasses. However applying bioethanol on gasoline engine needed some modification (Hassan and Kalam 2013). Cost reduction is still essential for large deployment of this new technology. Since the cost of the traditionally used (sugar and starch-containing) raw materials represent the major part of the total production cost (Robelo et al. 2011). Using less valuable materials, like agricultural waste, could
reduce the expense significantly. The use of lignocellulosic materials from agricultural
wastes provides a low-cost fermentative substrate. Using agricultural waste as lignocellulosic feedstocks for bioethanol production was greatly promising. One of the advantages of the use of lignocellulosic biomass is not interfering food production. This implies the production of bioethanol without the need of employing extensions of cultivable land for cropping sugar cane, rice or corn exclusively dedicated to the biofuel production. The development of an innovative waste management approach is focused on uses agricultural and industrial waste as cheap substrates. The production of bioethanol by yeast-based sugar fermentation has already been commercially established. Crops wastes are of great interest to reduce the costs of bioethanol production process. Rice and corn are the popular crops in Asia country, including Indonesia. It is essential to hydrolyze lignocellulosic materials before fermentation, because yeast can not use lignocelluloses directly into bioethanol.
Lignocellulosic materials of rice and corn are rice straw and husk and corn cobs and husk. Cellulose and hemicellulose, which are the principal biodegradable carbohydrate components of the husks, are found together with lignin in an intense cross-linked, rigid lignocellulose complex (Chan 2014). Most reports on lignocellulosic ethanol production, involve acid or enzymatic hydrolysis. The enzymatic hydrolysis is high cost however in
B IOTEKNOLOGI 14 (1): 19-23, May 2017
20
environmental issue this step is favorable. Commercial enzymes that apply in poultry can reduce the cost. Moreover, microbes that have cellulolytic activity can also reduce the cost. The objective of this research was to compare bioethanol production after microbes and cellulosic enzymes hydrolysis following yeast Saccharomyces cerevisiae fermentation from rice and corn husks.
MATERIALS AND METHODS
The rice and corn husks are obtained from the farmers at Karanganyar region of Central Java, Indonesia. Baker's yeasts [Fermipan] and microbes [EM4] are obtained from a retail store at Surakarta City (Solo) of Central Java, Indonesia. The enzymes are cellulases and multienzymes [Naturzime] are obtained from Sukahan, China and Macco Organique Inc., Canada, respectively.
Sample preparation The rice and corn husks were sun-drying for 7 days.
After drying, the husks were grounded. The ground samples were stored at room temperature (± 30°C), and the room humidity was controlled at 50-60% by silica gel. Each husks ground samples were treated by hydrolysis and followed by yeasts fermentation.
Sample hydrolysis The ground samples (1000 grams) were suspended in
water until the volumes reached 5 L and mixed until getting a slurry sample. The slurry samples were divided into three samples (1.5 L each). After sterilization by autoclaves (121°C, 15 min), then the slurry samples were treated with 2.5 mg/L cellulases (50 IU), 5g/L multienzymes (50 IU xylanases) and 5 mL/L EM4 respectively. The mixtures were stirred for 24 hours at pH 5.7 and 35°C. After 24 hours, the mixtures were filtered and stored in a refrigerator at 4-6°C prior yeast fermentation.
Yeast fermentation The three hydrolysis samples (500 mL each) from
hydrolysis were sterilized by autoclaves (121°C, 15 min). After cooling, the samples were treated by 1, 2, and 3 % w/v Baker’s yeasts. The samples were fermented at incubator shaking [Thermo Scientific] for 6 days at 30°C, 90 rpm, and pH 6.5.
Sugar determination The hydrolysis samples from cellulosic enzymes,
Naturzime, and EM4 treatments were determined the sugar concentrations by dinitrosalicylic acid (DNS) colorimetric method. The samples of two, four, and six fermentation days from each hydrolysis treatment previously were also determined the reducing sugar by DNS method.
Ethanol determination The fermentation samples at two, four, and six
fermentation days each treatment were determined the ethanol by specific gravity methods. The samples (50 mL)
were distilled using rotary evaporator until the distillate samples were reached 10 mL. The distillate samples (10 mL) are measured its specific gravity at 20°C and converted into bioethanol concentrations by IAOC Ethanol Table. The bioethanol concentrations of fermentation samples were calculated as 20% of bioethanol concentrations of distilled samples.
Data analysis Data were analyzed using Anova with 95% confidence
level. Reducing sugar from hydrolysis samples were analyzed by 2 ways Anova with reducing sugar before hydrolysis as covariates. Reducing sugar and bioethanol data from fermentation samples were analyzed 4 ways Anova.
RESULTS AND DISCUSSION
This research was used enzymatic hydrolysis of rice and corn husks from microbes (EM4), commercial multienzymes and cellulases. The EM4 is microbe consortium that usually applied on composting or feed fermentation. The microbes in EM4 are Rhodopseudomonas palustris, Lactobacillus casei, and Saccharomyces cerevisiae. R. palustris is a photosynthetic gram-negative bacterium and found in wastewaters. R. palustris could grow on green-plant derived compounds and can metabolize lignocellulosic and acids as well as aromatic compounds. Lactobacillus casei is found in the human intestine and mouth. The most common application of L. casei is industrial, especially for dairy production and probiotics for humans and animals. In the past few years, L. casei has azoreductase activity. It means they could degrade azo-bonds completely (Seesuriyachan et al. 2007). Saccharomyces cerevisiae is a species of yeast. It has been instrumental to winemaking, baking, and brewing. Yeast cells are found primarily in ripe fruits such as grapes. It is the microbe behind the most common type of fermentation.
Multienzymes are enzymes that use as for increasing food digestion in poultry (Abudabos 2010). Multienzymes is consist of galactosidases, galactomannases, xylanases, beta glucanases, amylases, proteases, and phosphatases. Galactosidases, galactomannases, xylanases, beta glucanases and amylases are enzymes that catalyze the polysaccharides hydrolysis of galactosides, galactomannans, xylans, glucans and starch respectively into simple sugars. Proteases are enzymes that hydrolysis of protein, meanwhile phosphatases removes phosphate group.
Cellulases are enzymes produced chiefly by fungi, bacteria, and protozoans that catalyze cellulolysis, the decomposition of cellulose and some related polysaccharides. Cellulases break down the cellulose molecule into simple sugars. There are five general types of cellulases based on the type of reaction catalyzed, endo cellulases, exocellulases, cellubioses, oxidative cellulases and cellulose phosphorylases.
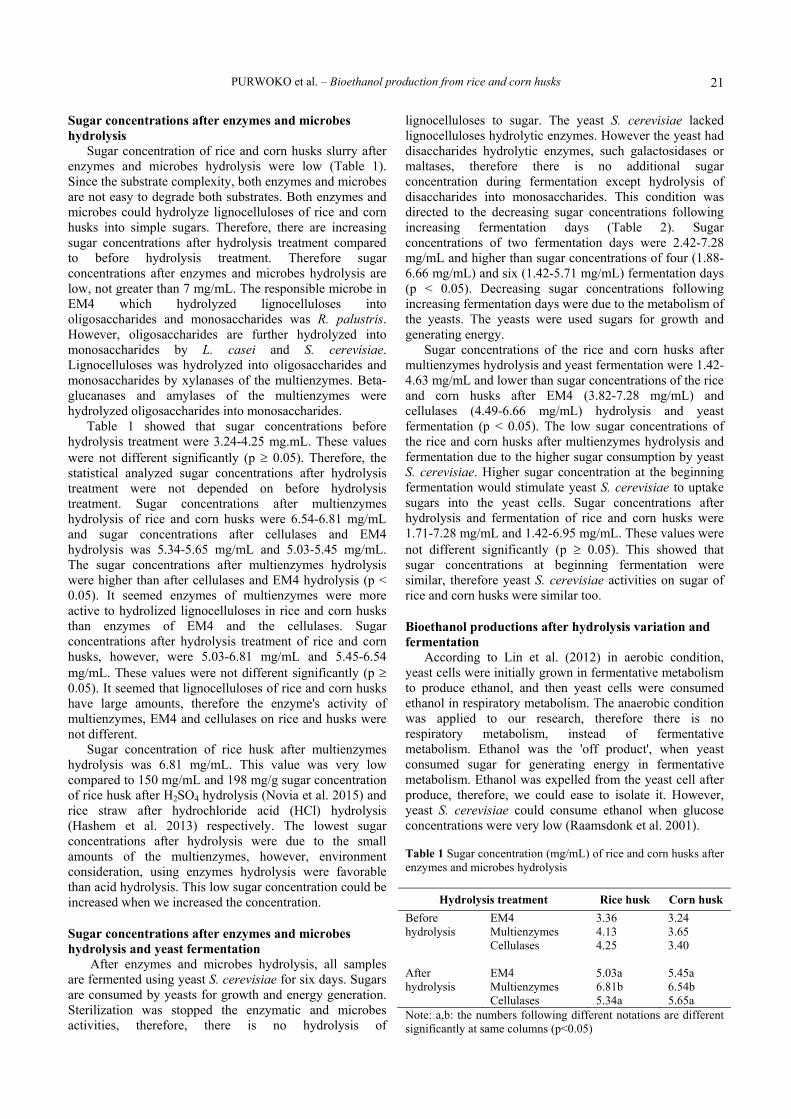
PURWOKO et al. – Bioethanol production from rice and corn husks
21
Sugar concentrations after enzymes and microbes hydrolysis
Sugar concentration of rice and corn husks slurry after enzymes and microbes hydrolysis were low (Table 1). Since the substrate complexity, both enzymes and microbes are not easy to degrade both substrates. Both enzymes and microbes could hydrolyze lignocelluloses of rice and corn husks into simple sugars. Therefore, there are increasing sugar concentrations after hydrolysis treatment compared to before hydrolysis treatment. Therefore sugar concentrations after enzymes and microbes hydrolysis are low, not greater than 7 mg/mL. The responsible microbe in EM4 which hydrolyzed lignocelluloses into oligosaccharides and monosaccharides was R. palustris. However, oligosaccharides are further hydrolyzed into monosaccharides by L. casei and S. cerevisiae. Lignocelluloses was hydrolyzed into oligosaccharides and monosaccharides by xylanases of the multienzymes. Beta-glucanases and amylases of the multienzymes were hydrolyzed oligosaccharides into monosaccharides.
Table 1 showed that sugar concentrations before hydrolysis treatment were 3.24-4.25 mg.mL. These values were not different significantly (p ≥ 0.05). Therefore, the statistical analyzed sugar concentrations after hydrolysis treatment were not depended on before hydrolysis treatment. Sugar concentrations after multienzymes hydrolysis of rice and corn husks were 6.54-6.81 mg/mL and sugar concentrations after cellulases and EM4 hydrolysis was 5.34-5.65 mg/mL and 5.03-5.45 mg/mL. The sugar concentrations after multienzymes hydrolysis were higher than after cellulases and EM4 hydrolysis (p < 0.05). It seemed enzymes of multienzymes were more active to hydrolized lignocelluloses in rice and corn husks than enzymes of EM4 and the cellulases. Sugar concentrations after hydrolysis treatment of rice and corn husks, however, were 5.03-6.81 mg/mL and 5.45-6.54 mg/mL. These values were not different significantly (p ≥ 0.05). It seemed that lignocelluloses of rice and corn husks have large amounts, therefore the enzyme's activity of multienzymes, EM4 and cellulases on rice and husks were not different.
Sugar concentration of rice husk after multienzymes hydrolysis was 6.81 mg/mL. This value was very low compared to 150 mg/mL and 198 mg/g sugar concentration of rice husk after H2SO4 hydrolysis (Novia et al. 2015) and rice straw after hydrochloride acid (HCl) hydrolysis (Hashem et al. 2013) respectively. The lowest sugar concentrations after hydrolysis were due to the small amounts of the multienzymes, however, environment consideration, using enzymes hydrolysis were favorable than acid hydrolysis. This low sugar concentration could be increased when we increased the concentration.
Sugar concentrations after enzymes and microbes hydrolysis and yeast fermentation
After enzymes and microbes hydrolysis, all samples are fermented using yeast S. cerevisiae for six days. Sugars are consumed by yeasts for growth and energy generation. Sterilization was stopped the enzymatic and microbes activities, therefore, there is no hydrolysis of
lignocelluloses to sugar. The yeast S. cerevisiae lacked lignocelluloses hydrolytic enzymes. However the yeast had disaccharides hydrolytic enzymes, such galactosidases or maltases, therefore there is no additional sugar concentration during fermentation except hydrolysis of disaccharides into monosaccharides. This condition was directed to the decreasing sugar concentrations following increasing fermentation days (Table 2). Sugar concentrations of two fermentation days were 2.42-7.28 mg/mL and higher than sugar concentrations of four (1.88-6.66 mg/mL) and six (1.42-5.71 mg/mL) fermentation days (p < 0.05). Decreasing sugar concentrations following increasing fermentation days were due to the metabolism of the yeasts. The yeasts were used sugars for growth and generating energy.
Sugar concentrations of the rice and corn husks after multienzymes hydrolysis and yeast fermentation were 1.42-4.63 mg/mL and lower than sugar concentrations of the rice and corn husks after EM4 (3.82-7.28 mg/mL) and cellulases (4.49-6.66 mg/mL) hydrolysis and yeast fermentation (p < 0.05). The low sugar concentrations of the rice and corn husks after multienzymes hydrolysis and fermentation due to the higher sugar consumption by yeast S. cerevisiae. Higher sugar concentration at the beginning fermentation would stimulate yeast S. cerevisiae to uptake sugars into the yeast cells. Sugar concentrations after hydrolysis and fermentation of rice and corn husks were 1.71-7.28 mg/mL and 1.42-6.95 mg/mL. These values were not different significantly (p ≥ 0.05). This showed that sugar concentrations at beginning fermentation were similar, therefore yeast S. cerevisiae activities on sugar of rice and corn husks were similar too.
Bioethanol productions after hydrolysis variation and fermentation
According to Lin et al. (2012) in aerobic condition, yeast cells were initially grown in fermentative metabolism to produce ethanol, and then yeast cells were consumed ethanol in respiratory metabolism. The anaerobic condition was applied to our research, therefore there is no respiratory metabolism, instead of fermentative metabolism. Ethanol was the 'off product', when yeast consumed sugar for generating energy in fermentative metabolism. Ethanol was expelled from the yeast cell after produce, therefore, we could ease to isolate it. However, yeast S. cerevisiae could consume ethanol when glucose concentrations were very low (Raamsdonk et al. 2001). Table 1 Sugar concentration (mg/mL) of rice and corn husks after enzymes and microbes hydrolysis
Hydrolysis treatment Rice husk Corn husk Before hydrolysis
EM4 Multienzymes Cellulases
3.36 4.13 4.25
3.24 3.65 3.40
After hydrolysis
EM4 Multienzymes Cellulases
5.03a 6.81b 5.34a
5.45a 6.54b 5.65a
Note: a,b: the numbers following different notations are different significantly at same columns (p<0.05)
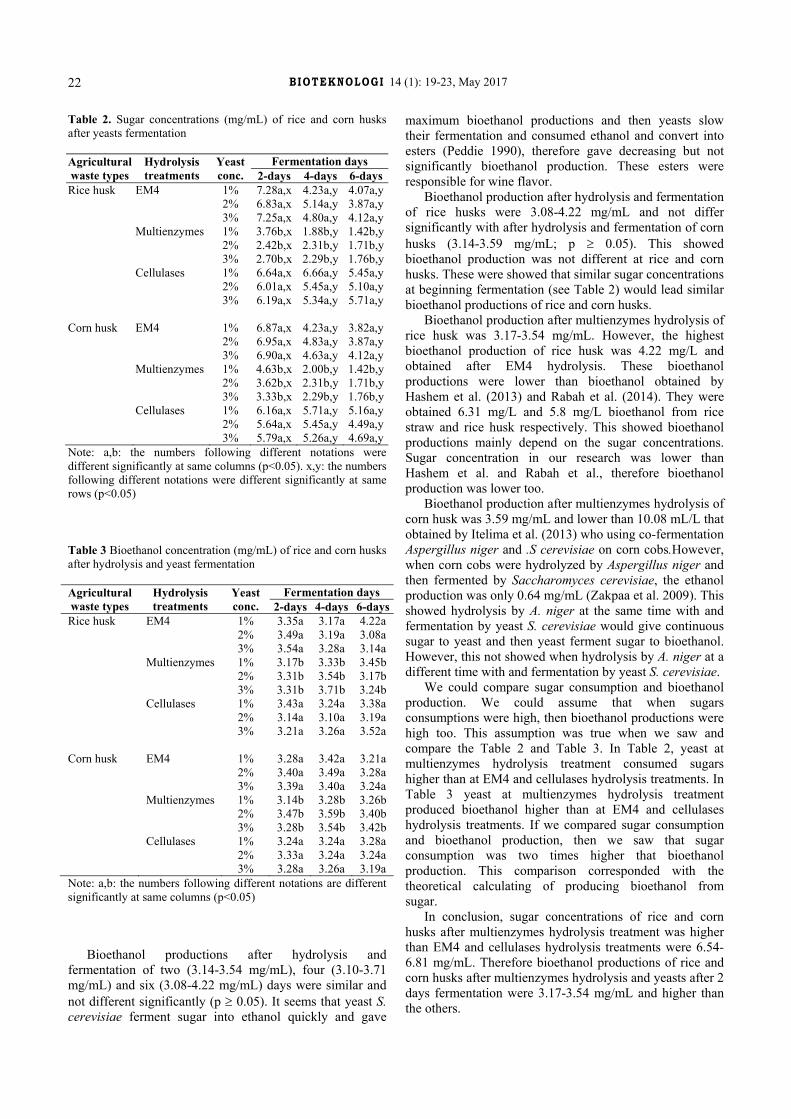
B IOTEKNOLOGI 14 (1): 19-23, May 2017
22
Table 2. Sugar concentrations (mg/mL) of rice and corn husks after yeasts fermentation Agricultural waste types
Hydrolysis treatments
Yeastconc.
Fermentation days 2-days 4-days 6-days
Rice husk EM4 1% 7.28a,x 4.23a,y 4.07a,y 2% 6.83a,x 5.14a,y 3.87a,y 3% 7.25a,x 4.80a,y 4.12a,y Multienzymes 1% 3.76b,x 1.88b,y 1.42b,y 2% 2.42b,x 2.31b,y 1.71b,y 3% 2.70b,x 2.29b,y 1.76b,y Cellulases 1% 6.64a,x 6.66a,y 5.45a,y 2% 6.01a,x 5.45a,y 5.10a,y 3% 6.19a,x 5.34a,y 5.71a,y Corn husk EM4 1% 6.87a,x 4.23a,y 3.82a,y 2% 6.95a,x 4.83a,y 3.87a,y 3% 6.90a,x 4.63a,y 4.12a,y Multienzymes 1% 4.63b,x 2.00b,y 1.42b,y 2% 3.62b,x 2.31b,y 1.71b,y 3% 3.33b,x 2.29b,y 1.76b,y Cellulases 1% 6.16a,x 5.71a,y 5.16a,y 2% 5.64a,x 5.45a,y 4.49a,y 3% 5.79a,x 5.26a,y 4.69a,yNote: a,b: the numbers following different notations were different significantly at same columns (p<0.05). x,y: the numbers following different notations were different significantly at same rows (p<0.05)
Table 3 Bioethanol concentration (mg/mL) of rice and corn husks after hydrolysis and yeast fermentation Agricultural waste types
Hydrolysis treatments
Yeast conc.
Fermentation days 2-days 4-days 6-days
Rice husk EM4 1% 3.35a 3.17a 4.22a 2% 3.49a 3.19a 3.08a 3% 3.54a 3.28a 3.14a Multienzymes 1% 3.17b 3.33b 3.45b 2% 3.31b 3.54b 3.17b 3% 3.31b 3.71b 3.24b Cellulases 1% 3.43a 3.24a 3.38a 2% 3.14a 3.10a 3.19a 3% 3.21a 3.26a 3.52a Corn husk EM4 1% 3.28a 3.42a 3.21a 2% 3.40a 3.49a 3.28a 3% 3.39a 3.40a 3.24a Multienzymes 1% 3.14b 3.28b 3.26b 2% 3.47b 3.59b 3.40b 3% 3.28b 3.54b 3.42b Cellulases 1% 3.24a 3.24a 3.28a 2% 3.33a 3.24a 3.24a 3% 3.28a 3.26a 3.19a Note: a,b: the numbers following different notations are different significantly at same columns (p<0.05)
Bioethanol productions after hydrolysis and
fermentation of two (3.14-3.54 mg/mL), four (3.10-3.71 mg/mL) and six (3.08-4.22 mg/mL) days were similar and not different significantly (p ≥ 0.05). It seems that yeast S. cerevisiae ferment sugar into ethanol quickly and gave
maximum bioethanol productions and then yeasts slow their fermentation and consumed ethanol and convert into esters (Peddie 1990), therefore gave decreasing but not significantly bioethanol production. These esters were responsible for wine flavor.
Bioethanol production after hydrolysis and fermentation of rice husks were 3.08-4.22 mg/mL and not differ significantly with after hydrolysis and fermentation of corn husks (3.14-3.59 mg/mL; p ≥ 0.05). This showed bioethanol production was not different at rice and corn husks. These were showed that similar sugar concentrations at beginning fermentation (see Table 2) would lead similar bioethanol productions of rice and corn husks.
Bioethanol production after multienzymes hydrolysis of rice husk was 3.17-3.54 mg/mL. However, the highest bioethanol production of rice husk was 4.22 mg/L and obtained after EM4 hydrolysis. These bioethanol productions were lower than bioethanol obtained by Hashem et al. (2013) and Rabah et al. (2014). They were obtained 6.31 mg/L and 5.8 mg/L bioethanol from rice straw and rice husk respectively. This showed bioethanol productions mainly depend on the sugar concentrations. Sugar concentration in our research was lower than Hashem et al. and Rabah et al., therefore bioethanol production was lower too.
Bioethanol production after multienzymes hydrolysis of corn husk was 3.59 mg/mL and lower than 10.08 mL/L that obtained by Itelima et al. (2013) who using co-fermentation Aspergillus niger and .S cerevisiae on corn cobs.However, when corn cobs were hydrolyzed by Aspergillus niger and then fermented by Saccharomyces cerevisiae, the ethanol production was only 0.64 mg/mL (Zakpaa et al. 2009). This showed hydrolysis by A. niger at the same time with and fermentation by yeast S. cerevisiae would give continuous sugar to yeast and then yeast ferment sugar to bioethanol. However, this not showed when hydrolysis by A. niger at a different time with and fermentation by yeast S. cerevisiae.
We could compare sugar consumption and bioethanol production. We could assume that when sugars consumptions were high, then bioethanol productions were high too. This assumption was true when we saw and compare the Table 2 and Table 3. In Table 2, yeast at multienzymes hydrolysis treatment consumed sugars higher than at EM4 and cellulases hydrolysis treatments. In Table 3 yeast at multienzymes hydrolysis treatment produced bioethanol higher than at EM4 and cellulases hydrolysis treatments. If we compared sugar consumption and bioethanol production, then we saw that sugar consumption was two times higher that bioethanol production. This comparison corresponded with the theoretical calculating of producing bioethanol from sugar.
In conclusion, sugar concentrations of rice and corn husks after multienzymes hydrolysis treatment was higher than EM4 and cellulases hydrolysis treatments were 6.54-6.81 mg/mL. Therefore bioethanol productions of rice and corn husks after multienzymes hydrolysis and yeasts after 2 days fermentation were 3.17-3.54 mg/mL and higher than the others.
PURWOKO et al. – Bioethanol production from rice and corn husks
23
ACKNOWLEDGEMENTS
This research was sponsored by Hibah Peneliti Utama sebagai Rujukan Hibah Maintenance Research Group UNS 2016.
REFERENCES
Abudabos A. 2010. Enzyme supplementation of corn-soybean meal diets improves performance in broiler chicken. Intl J Poultry Sci 9: 292-297.
Chen H. 2014. Biotechnology of lignocellulose: theory and practice. Chemical Industry Press, Beijing.
Hashem M, Ali EH, Abdel-Basset R. 2013. Recycling rice straw into biofuel ethanol by Saccharomyces cerevisiae and Pichia guilliermondii. J Agric Sci Technol 15: 709-721.
Hassan MH, Kalam MA. 2013. An overview of biofuel as a renewable energy source: development and challenges. Procedia Engineer 56: 39-53.
Itelima J, Ogbonna A, Pandukur S, Egbere J, Salami A. 2013. Simultaneous saccharification and fermentation of corn cobs to bio-ethanol by co-culture of Aspergillus niger and Saccharomyces cerevisiae. Intl J Environ Sci Dev 4: 239-242.
Lin Y, Zhang W, Li C, Sakakibara K, Tanaka S, Kong H. 2012. Factors affecting ethanol fermentation using Saccharomyces cerevisiae BY4742. Biomass Bioenerg 30: 1-7.
Novia, Utami I, Windiyati L. 2014. Pembuatan bioetanol dari sekam padi menggunakan kombinasi soaking in aqueous ammonia (saa) pretreatment - acid pretreatment - hidrolisis - fermentasi. Teknik Kimia 20: 46-53. [Indonesian]
Park I, Kim I, Kang K, Sohn H, Rhee I, Jin I, Jang H. 2010. Cellulose ethanol production from waste newsprint by simultaneous saccharification and fermentation using Saccharomyces cerevisiae KNU5377. Process Biochem 45: 487-492.
Peddie HAB.1990. Ester formation in brewery fermentations. J Inst Brew 96: 327-331.
Rabah AB, Oyeleke SB, Manga SB, Gusau LH. 2014. Utilization of rice husks and groundnut shells for bioethanol production. Intl J Environ Sci Dev 5: 367-369.
Rabelo SC, Carrere H, Maciel-Filho R, Costa AC. 2011. Production of bioethanol, methane and heat from sugarcane bagasse in a biorefinery concept. Bioresour Technol 102: 7887-7895.
Raamsdonk LM, Diderich JA, Kuiper A, Gaalen MV, Kruckberg AL, Berden JA, Dam KV. 2001. Co-consumption of sugars or ethanol and glucose in a Saccharomyces cerevisiae strain deleted in the HXK2 gene. Yeasts 18: 1023-1033.
Seesuriyachan P, Takenaka S, Kuntiya A, Klayraung S, Murakami S, Aoki K. 2007. Metabolism of azo dyes by Lactobacillus casei TISTR 1500 and effects of various factors on decolorization. Water Resour 41: 985-992.
Zakpaa HD, Mak-Mensah EE, Johnson FS. 2009. Production of bio-ethanol from corncobs using Aspergillus niger and Saccharomyces cerevisiae in simultaneous saccharification and fermentation. African J Biotechnol 8: 3018-3022.

THIS PAGE INTENTIONALLY LEFT BLANK
GUIDANCE FOR AUTHORS
Aims and Scope Bioteknologi or Biotechnological Studies encourages submission of manuscripts dealing with all aspects of biotechnology that emphasize issues germane to improve human life, includes cell biochemistry, enzymes and proteins, applied genetics and molecular biotechnology, genomics and proteomics, applied microbiology and cell physiology, environmental biotechnology, improvement of crop productivity, public health and waste management, as as well as product formation and manipulation of biological processes for use in the agricultural, pharmaceutical biotechnology and allied industries.
Article types The journal seeks original full-length research papers, reviews, and short communication. Manuscript of original research should be written in no more than 8,000 words (including tables and picture), or proportional with articles in this publication number. Review articles will be accommodated, while, short communication should be written at least 2,000 words, except for pre-study.
Submission The journal only accepts online submission through system or email to the editors at [email protected] (until the end of 2017). Submitted manuscripts should be the original works of the author(s). The manuscript must be accompanied by a cover letter containing the article title, the first name and last name of all the authors, a paragraph describing the claimed novelty of the findings versus current knowledge. Submission of a manuscript implies that the submitted work has not been published before (except as part of a thesis or report, or abstract); and is not being considered for publication elsewhere. When a manuscript written by a group, all authors should read and approve the final version of the submitted manuscript and its revision; and agree the submission of manuscripts for this journal. All authors should have made substantial contributions to the concept and design of the research, acquisition of the data and its analysis; drafting of the manuscript and correcting of the revision. All authors must be responsible for the quality, accuracy, and ethics of the work.
Acceptance The only articles written in English (U.S. English) are accepted for publication. Manuscripts will be reviewed by editors and invited reviewers (double blind review) according to their disciplines. Authors will generally be notified of acceptance, rejection, or need for revision within 1 to 2 months of receipt. The manuscript is rejected if the content does not in line with the journal scope, does not meet the standard quality, inappropriate format, complicated grammar, dishonesty (i.e. plagiarism, duplicate publications, fabrication of data, citations manipulation, etc.), or ignoring correspondence in three months. The primary criteria for publication are scientific quality and biodiversity significance. Uncorrected proofs will be sent to the corresponding author as .doc or .rtf files for checking and correcting of typographical errors. To avoid delay in publication, corrected proofs should be returned in 7 days. The accepted papers will be published online in a chronological order at any time, but printed in May and November.
Ethics Author(s) must obedient to the law and/or ethics in treating the object of research and pay attention to the legality of material sources and intellectual property rights.
Copyright If and when the manuscript is accepted for publication, the author(s) still hold the copyright and retain publishing rights without restrictions. Authors or others are allowed to multiply article as long as not for commercial purposes. For the new invention, authors are suggested to manage its patent before published.
Open access The journal is committed to free-open access that does not charge readers or their institutions for access. Readers are entitled to read, download, copy, distribute, print, search, or link to the full texts of articles, as long as not for commercial purposes. The license type is CC-BY-NC-SA.
A charge The journal is committed to free of charge for submission and publication of non-institutional funded research (waiver).
Reprints The sample journal reprint is only available by special request. Additional copies may be purchased when ordering by sending back the uncorrected proofs by email.
Manuscript preparation Manuscript is typed on A4 (210x297 mm2) paper size, in a single column, single space, 10-point (10 pt) Times New Roman font. The margin text is 3 cm from the top, 2 cm from the bottom, and 1.8 cm from the left and right. Smaller lettering size can be applied in presenting table and figure (9 pt). Word processing program or additional software can be used, however, it must be PC compatible and Microsoft Word based (.doc or .rtf; not .docx). Scientific names of species (incl. subspecies, variety, etc.) should be written in italic, except for italic sentence. Scientific name (genera, species, author), and cultivar or strain should be mentioned completely for the first time mentioning it in the body text, especially for taxonomic manuscripts. Name of genera can be shortened after first mentioning, except generating confusion. Name of the author can be eliminated after first mentioning. For example, Rhizopus oryzae L. UICC 524, hereinafter can be written as R. oryzae UICC 524. Using trivial name should be avoided, otherwise generating confusion. Biochemical and chemical nomenclature should follow the order of the IUPAC - IUB. For DNA sequence, it is better used Courier New font. Symbols of standard chemical and abbreviation of chemistry name can be applied for common and clear used, for example, completely written butilic hydroxyl toluene (BHT) to be BHT herein after. Metric measurement use IS denomination, usage other system should follow the value of equivalent with the denomination of IS first mentioning. Abbreviations set of, like g, mg, mL,
etc. do not follow by dot. Minus index (m-2, L-1, h-1) suggested to be used, except in things like "per-plant" or "per-plot". Equation of mathematics does not always can be written down in one column with text, in that case can be written separately. Number one to ten are expressed with words, except if it relates to measurement, while values above them written in number, except in early sentence. The fraction should be expressed in decimal. In the text, it should be used "%" rather than "percent". Avoid expressing ideas with complicated sentence and verbiage, and used efficient and effective sentence.
Title of the article should be written in compact, clear, and informative sentence, preferably not more than 20 words. Name of author(s) should be completely written. Name and institution address should also be completely written with street name and number (location), postal code, telephone number (O), facsimile number (O), and personal email address. For Indonesian universities, use local name. Manuscript written by a group, author for correspondence along with address is required. First page of the manuscript is used for writing above information.
Abstract should not be more than 200 words. Keywords is about five words, covering scientific and local name (if any), research theme, and special methods which used; and sorted from A to Z. All important abbreviations must be defined at their first mention. Running title is about five words. Introduction is about 400-600 words, covering the background and aims of the research. Materials and Methods should emphasize on the procedures and data analysis. Results and Discussion should be written as a series of connecting sentences, however, for manuscript with long discussion should be divided into subtitles. Thorough discussion represents the causal effect mainly explains for why and how the results of the research were taken place, and do not only re-express the mentioned results in the form of sentences. Concluding sentence should be given at the end of the discussion. Acknowledgments are expressed in a brief; all sources of institutional, private and corporate financial support for the work must be fully acknowledged, and any potential conflicts of interest are noted.
Figures and Tables of maximum of three pages should be clearly presented. Title of a picture is written down below the picture, while title of a table is written above the table. Colored figures can only be accepted if the information in the manuscript can lose without those images; chart is preferred to use black and white images. Author could consign any picture or photo for the front cover, although it does not print in the manuscript. All images property of others should be mentioned source. There is no appendix, all data or data analysis are incorporated into Results and Discussions. For broad data, it can be displayed on the website as a supplement.
References Author-year citations are required. In the text give the authors name followed by the year of publication and arrange from oldest to newest and from A to Z. In citing an article written by two authors, both of them should be mentioned, however, for three and more authors only the first author is mentioned followed by et al., for example: Saharjo and Nurhayati (2006) or (Boonkerd 2003a, b, c; Sugiyarto 2004; El-Bana and Nijs 2005; Balagadde et al. 2008; Webb et al. 2008). Extent citation as shown with word "cit" should be avoided. Reference to unpublished data and personal communication should not appear in the list but should be cited in the text only (e.g., Rifai MA 2007, pers. com. (personal communication); Setyawan AD 2007, unpublished data). In the reference list, the references should be listed in an alphabetical order (better, if only 20 for research papers). Names of journals should be abbreviated. Always use the standard abbreviation of a journal's name according to the ISSN List of Title Word Abbreviations (www.issn.org/2-22661-LTWA-online.php). The following examples are for guidance. Journal: Saharjo BH, Nurhayati AD. 2006. Domination and composition structure change at hemic
peat natural regeneration following burning; a case study in Pelalawan, Riau Province. Biodiversitas 7: 154-158.
Book: Rai MK, Carpinella C. 2006. Naturally Occurring Bioactive Compounds. Elsevier,
Amsterdam. Chapter in book: Webb CO, Cannon CH, Davies SJ. 2008. Ecological organization, biogeography, and the
phylogenetic structure of rainforest tree communities. In: Carson W, Schnitzer S (eds) Tropical Forest Community Ecology. Wiley-Blackwell, New York.
Abstract: Assaeed AM. 2007. Seed production and dispersal of Rhazya stricta. 50th Annual
Symposium of the International Association for Vegetation Science, Swansea, UK, 23-27 July 2007.
Proceeding: Alikodra HS. 2000. Biodiversity for development of local autonomous government. In:
Setyawan AD, Sutarno (eds.) Toward Mount Lawu National Park; Proceeding of National Seminary and Workshop on Biodiversity Conservation to Protect and Save Germplasm in Java Island. Universitas Sebelas Maret, Surakarta, 17-20 July 2000. [Indonesian]
Thesis, Dissertation: Sugiyarto. 2004. Soil Macro-invertebrates Diversity and Inter-Cropping Plants Productivity in
Agroforestry System based on Sengon. [Dissertation]. Universitas Brawijaya, Malang. [Indonesian]
Information from internet: Balagadde FK, Song H, Ozaki J, Collins CH, Barnet M, Arnold FH, Quake SR, You L.
2008. A synthetic Escherichia coli predator-prey ecosystem. Mol Syst Biol 4: 187. www.molecularsystemsbiology.com. DOI:10.1038/msb.2008.24
| Bioteknologi | vol. 14 | no. 1 | May 2017 | ISSN: 0216‐6887 | E‐ISSN: 2301‐8658 | Antifungal evaluation of some leaves extracts and fungicide against Fusarium oxysporum f.sp. lycopersici causal agent wilt of tomato AMANI OSMAN ABDALAL OSMAN, IBRAHIM SAEED MOHAMED
1-8
Short Communication: Influence of the content level of teichoic acids in the cells of Staphylococcus aureus on their adhesive properties V.V. МINUKHIN, E.V. KOCHNEVA
9-11
Identification of structural and elemental composition of Cassia obtusifolia ABDALLAH YOUSIF ADAM AHMED, ALI A. S. MAROUF
12-15
Short Communication: Inhibitory effect of Sapindus rarak ethyl acetate extract on Staphylococcus aureus YUSIANTI SILVIANI
16-18
Bioethanol production from rice and corn husks after enzymatic and microbes hydrolysis and yeast fermentation TJAHJADI PURWOKO, SITI LUSI ARUM SARI, EDWI MAHADJOENO, SUNARTO
19-23
Published semiannually PRINTED IN INDONESIA
E-ISSN: xxxx-xxxx