BIOMONITORING NETWORK REPORT OF - St....
12
1 BIOMONITORING NETWORK REPORT OF WAHDIENGLIENG STREAM ST. ANTHONY’S COLLEGE SHILLONG, MEGHALAYA, INDIA 2014
Transcript of BIOMONITORING NETWORK REPORT OF - St....
1
BIOMONITORING NETWORK
REPORT OF
WAHDIENGLIENG STREAM
ST. ANTHONY’S COLLEGE
SHILLONG, MEGHALAYA, INDIA
2014

2
The Biomonitoring Network is an outcome of the training program on “Capacity Building
for Freshwater Ecosystem Conservation in Northeastern India” organized by Shillong
College, Shillong on 14th
– 21st July 2014, in collaboration with Rufford Foundation for
Nature Conservation (UK), Global Water for Sustainability Program, Florida
International University (USA) and Foundation for Ecological Research, Advocacy and
Learning (FERAL), Pondicherry, India. The participants of the training program included
students and teachers from different colleges of Shillong, Meghalaya. During the training, the
participants were taught how to assess and monitor the quality of water in the stream or river
based on the presence of macroinvertebrates and also on the physico-chemical parameters. At
the end of the training, it was decided that each college will adopt one stream in and around
Shillong city and monitor the water quality of that particular water body. Dr. Sonali Saha
who is the Co-Principal Investigator and Coordinator of Science Programs, Touro College,
South, Miami Beach, Florida, USA, and who was the main instructor during the training
program is heading the Network. She wrote a letter to all the Principals of the colleges in
Shillong, requesting them to be part of the Biomonitoring Network. As a result of the
initiative of Dr. Sonali Saha and also of Dr. Bashida Massar of the Department of Zoology St.
Anthony’s college who attended the training program, a team is set up in the college in
August 2014 with the following as members:
St. Anthony’s College Biomonitoring Network Team
Name Designation Department
Dr. Bashida Massar Assistant Professor Zoology
Mr. Rupak Nath Assistant Professor Fishery Science
Ms. Ebelmon Nongbri Assistant Professor Botany
Ms. Dawanlangki Shadap B.Sc. Third year Student Zoology
Ms. Sumera Sangma B.Sc. third year Student Zoology
Ms. Ibalarisha Donshiew B.Sc. second year student Fishery Science
Mr. Mayborn Dkhar B.Sc. second year student Fishery Science
Mr. Friendly Majhong B.Sc. second year student Fishery Science
St. Anthony’s College Biomonitoring Network Team adopts Wahdienglieng, a small stream in Risa
Colony, Shillong near Zoological Survey of India (ZSI).

3
Biomonitoring of Wahdienglieng stream, Shillong, Meghalaya,
India
Rationale: Aquatic insects vary in their sensitivity to changes in water flow and quality; the
more sensitive organisms are thus good indicators of water quality and watershed ecosystem
health. Flow alterations and soil erosion can lead to the disappearance of many insect groups.
By knowing what insect communities exist in pristine streams in Meghalaya, one can infer
the condition of other streams in the region.
Aim: To monitor the quality of a stream or river
Objectives: This project has to meet the following objectives:
Introduce students to the concept of biological monitoring of water quality, based
on the presence, abundance and diversity of aquatic macroinvertebrates (insect
larvae and other taxa).
To create a field guide of aquatic invertebrates in Meghalaya over a year (July
2014-June 2015), for identification at the order level and further levels (family,
genus if possible).
To be part of the biomonitoring network of faculty and students from various
institutions in the region.
Report on field survey (22.08.2014)
Study Site
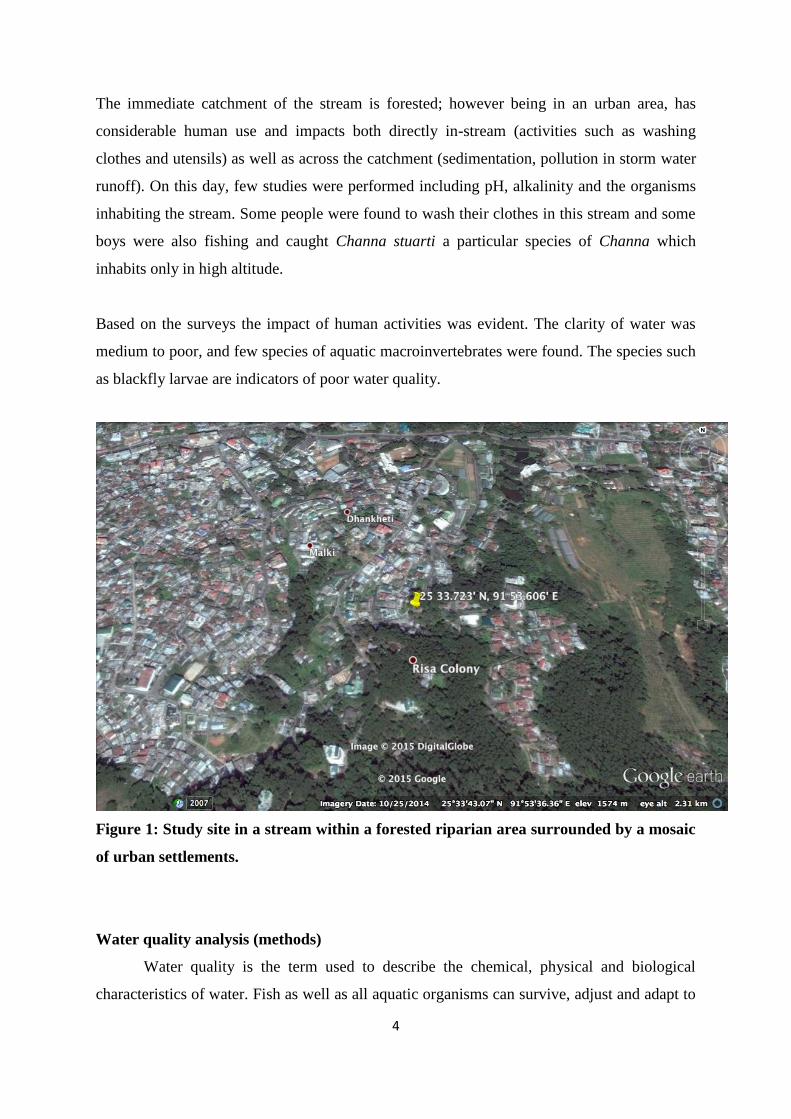
We selected Wahdienglieng stream as the study site, and conducted surveys of
macroinvertebrate diversity and abundances in conjunction with water quality monitoring
during the monsoon and early winter season. Wahdienglieng is about 2 km from St.
Anthony’s college, Shillong (Fig. 1; N - 250 33.723
', E - 91
0 53. 606
'), located at the
elevation of 1515 m to 1520 m asl.
4
The immediate catchment of the stream is forested; however being in an urban area, has
considerable human use and impacts both directly in-stream (activities such as washing
clothes and utensils) as well as across the catchment (sedimentation, pollution in storm water
runoff). On this day, few studies were performed including pH, alkalinity and the organisms
inhabiting the stream. Some people were found to wash their clothes in this stream and some
boys were also fishing and caught Channa stuarti a particular species of Channa which
inhabits only in high altitude.
Based on the surveys the impact of human activities was evident. The clarity of water was
medium to poor, and few species of aquatic macroinvertebrates were found. The species such
as blackfly larvae are indicators of poor water quality.
Figure 1: Study site in a stream within a forested riparian area surrounded by a mosaic
of urban settlements.
Water quality analysis (methods)
Water quality is the term used to describe the chemical, physical and biological
characteristics of water. Fish as well as all aquatic organisms can survive, adjust and adapt to

5
some fluctuations in the water quality, but they suffer and die once the limits have been
crossed. Therefore, it is important to assess the prevailing quality of the water in the study
area.
Collection of water samples
Water samples were collected from the lake (pollution-exposed) and control water
body in sterilized plastic containers having a capacity of 5 litres and brought to the laboratory
for analysis of different parameters. Both physical and chemical parameters were analyzed.
The method of water collection was done as per the Standard methods for the examination of
water and wastewater, American Public Health Association (APHA), 1992.
Hydrogen Ion Concentration (pH)
pH is a measure of the acidity and alkalinity of the water. It is measured by using pH
universal indicator solution (pH 4 - 10) and pH meter. Water was taken in a test tube and few
drops of the pH indicator were added. The colour produced is compared with the standard
colour and the pH was recorded. Readymade buffers were used for setting the pH meter and
then the measurement of samples were calibrated out and recorded (Verma and Srivastava,
1996).
Dissolved Oxygen (DO)
Dissolved oxygen is the amount of gaseous oxygen dissolved in an aqueous solution
and is expressed as a concentration in terms of milligrams per litre (mg/L). Dissolved oxygen
is determined by Winkler’s Iodometric method (Verma and Srivastava, 1996). Water samples
were collected in 250 ml glass Biological Oxygen Demand (BOD) stoppered bottle up to the
brim. During collection of samples, precautions were taken not to allow any kind of air
bubbles to enter inside the bottle. 1 ml each of MnSO4 and alkaline KI solutions were added
to the sample very carefully by the side of the bottle. Two separate pipettes were used for the
reagents. The bottle was closed with the stopper and mixed by inverting several times. A
brownish-orange cloud of precipitate appeared. When this precipitate has settled to the
bottom, the sample was mixed by turning it upside down several times and let it settle again.
1 ml of concentrated sulfuric acid via a pipette held just above the surface of the sample was
added and shaken well to dissolve the precipitate. 25 ml of the content of the bottle was
carefully transferred to the conical flask for titration. The content was titrated against sodium

6
thiosulphate solution using starch as an indicator. At the end point, initial dark blue colour
became colourless.
Calculation:
8 x Volume of Titrant used x 1000 x Strength of Titrant
DO (mg/L) =
Volume of sample taken
Free Carbon Dioxide
Free carbon dioxide was determined following the APHA standard method (1992). 50
ml of the water sample was taken in a beaker and 2 - 3 drops of phenolphthalein indicator
was added to it. Since no pink colour developed, the solution was titrated against 0.045 N
Sodium carbonate solution till a faint permanent pink colour appears and the reading was
recorded.
Calculation:
Volume of Titrant used x 1000
Free CO2 (mg/L) =
Volume of sample taken
Alkalinity
Alkalinity of the water was determined following APHA standard method (1992). 50
ml of the water sample was taken in the conical flask and to it 2-3 drops of phenolphthalein
indicator was added. 2 - 3 drops of methyl orange indicator was then added and the solution
turned yellowish in colour. It was then titrated with 0.02 N H2SO4 till the yellow colour
turned orange and the reading was recorded.
Calculations:
Volume of Titrant used x 1000
Alkalinity (mg/L) =
Volume of sample taken
STUDY FINDINGS
Temperature
Seasonal temperature fluctuations are evident in the measurements, with water
temperature varying from 19 C in the monsoon season to 10 C in winter.

7
Width of stream
Stream dimensions did not vary across the seasons. On average the stream was 3 m
wide and 0.5 m deep, 0.4 – 0.6 m.
Size of rock boulders: 0.4 – 0.7 m length or diameter
Water Turbidity (Transparency of water in column using Secchi Disk):
Point of appearing (D1); Point of disappearing (D2)
Spot 1: D1 = 13 cm; D2 = 13.1 cm
Spot 2: D1 = 10 cm; D2 = 13.5 cm
Spot 3: D1 = 7 cm; D2 = 13.2 cm
Transparency = (D1 + D2) / 2, Turbidity when expressed as NTU was 90,
suggesting that water is quite murky.
Stream Velocity (using Float method):
Stream velocity was 40 cm s-1
in the monsoons, and was not measured in the winter.
Macroinvertebrates:
We mainly found Blackfly larvae (many of them under the stones). Flatworms
commonly called planarians are also found under some stones. In addition there were
caddisfly, mayfly larvae and water penny beetle under some stones.
Hydrogen ion concentration (pH)
The pH values were comparable across the seasons and were found to be steady
around 7 to 7.5 (Table 1).
Dissolved Oxygen (DO)
Dissolved oxygen was correlated with temperature, and greater concentration of DO
was recorded in winter (14-16 mg L-1
) compared to monsoons (6.4 – 8 mg L-1
)(Table 1).
Free carbon dioxide
Concentration of freeCO2 was greater in winter than the monsoons 8 mg L-1
in
monsoons and 10 mg L-1
in winter (Table 1).
8
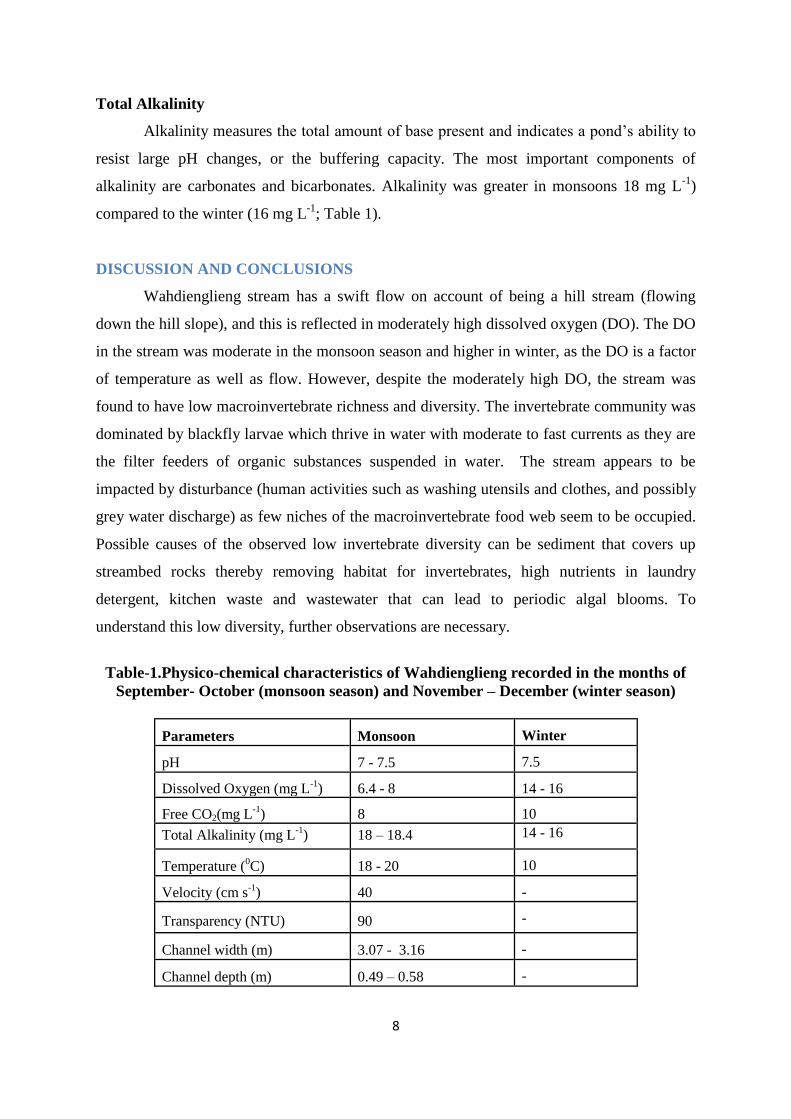
Total Alkalinity
Alkalinity measures the total amount of base present and indicates a pond’s ability to
resist large pH changes, or the buffering capacity. The most important components of
alkalinity are carbonates and bicarbonates. Alkalinity was greater in monsoons 18 mg L-1
)
compared to the winter (16 mg L-1
; Table 1).
DISCUSSION AND CONCLUSIONS
Wahdienglieng stream has a swift flow on account of being a hill stream (flowing
down the hill slope), and this is reflected in moderately high dissolved oxygen (DO). The DO
in the stream was moderate in the monsoon season and higher in winter, as the DO is a factor
of temperature as well as flow. However, despite the moderately high DO, the stream was
found to have low macroinvertebrate richness and diversity. The invertebrate community was
dominated by blackfly larvae which thrive in water with moderate to fast currents as they are
the filter feeders of organic substances suspended in water. The stream appears to be
impacted by disturbance (human activities such as washing utensils and clothes, and possibly
grey water discharge) as few niches of the macroinvertebrate food web seem to be occupied.
Possible causes of the observed low invertebrate diversity can be sediment that covers up
streambed rocks thereby removing habitat for invertebrates, high nutrients in laundry
detergent, kitchen waste and wastewater that can lead to periodic algal blooms. To
understand this low diversity, further observations are necessary.
Table-1.Physico-chemical characteristics of Wahdienglieng recorded in the months of
September- October (monsoon season) and November – December (winter season)
Parameters Monsoon Winter
pH 7 - 7.5 7.5
Dissolved Oxygen (mg L-1
) 6.4 - 8 14 - 16
Free CO2(mg L-1
) 8 10
Total Alkalinity (mg L-1
) 18 – 18.4 14 - 16
Temperature (0C) 18 - 20 10
Velocity (cm s-1
) 40 -
Transparency (NTU) 90 -
Channel width (m) 3.07 - 3.16 -
Channel depth (m) 0.49 – 0.58 -

9
Figure 2:Wahdienglieng stream in Risa Colony, Shillong
Figure 3: Activities going on in the stream by local people
10
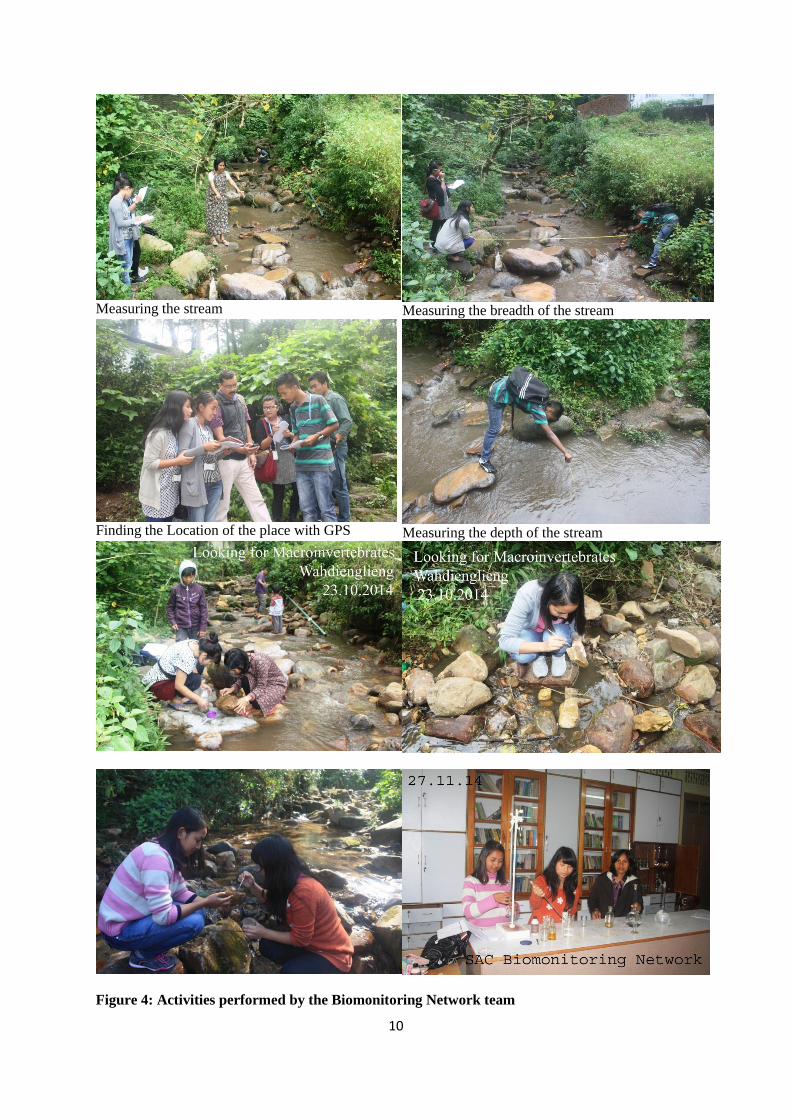
Measuring the stream
Measuring the breadth of the stream
Finding the Location of the place with GPS
Measuring the depth of the stream
Figure 4: Activities performed by the Biomonitoring Network team

11
Figure 5: Fauna of Wahdienglieng stream, Shillong

12
ACKNOWLEDGEMENT:
St. Anthony’s College Biomonitoring Network team is thankful to DBT-Star
College Scheme for sponsoring the project and to Dr. Sonali Saha for editing
the report.