Biogeochemistry of mineral–organic associations across …mkramer/publications/Kramer_2009... ·...
27
Biogeochemistry of mineral–organic associations across a long-term mineralogical soil gradient (0.3–4100 kyr), Hawaiian Islands Robert Mikutta a,g, * , Gabriele E. Schaumann b , Daniela Gildemeister b , Steeve Bonneville c , Marc G. Kramer d , Jon Chorover e , Oliver A. Chadwick f , Georg Guggenberger a,g a Soil Sciences, Martin Luther University Halle-Wittenberg, Weidenplan 14, 06108 Halle (Saale), Germany b Environmental and Soil Chemistry, University of Koblenz-Landau, Germany c School of Earth and Environment, University of Leeds, UK d Earth and Planetary Sciences, University of California, USA e Department of Soil, Water and Environmental Science, University of Arizona, USA f Department of Geography, University of California, USA g Institute of Soil Science, Leibniz University Hannover, Germany Received 14 August 2008; accepted in revised form 16 December 2008; available online 22 January 2009 Abstract Organic matter (OM) in mineral–organic associations (MOAs) represents a large fraction of carbon in terrestrial eco- systems which is considered stable against biodegradation. To assess the role of MOAs in carbon cycling, there is a need to better understand (i) the time-dependent biogeochemical evolution of MOAs in soil, (ii) the effect of the mineral com- position on the physico-chemical properties of attached OM, and (iii) the resulting consequences for the stabilization of OM. We studied the development of MOAs across a mineralogical soil gradient (0.3–4100 kyr) at the Hawaiian Islands that derived from basaltic tephra under comparable climatic and hydrological regimes. Mineral–organic associations were characterized using biomarker analyses of OM with chemolytic methods (lignin phenols, non-cellulosic carbohydrates) and wet chemical extractions, surface area/porosity measurements (N 2 at 77 K and CO 2 at 273 K), X-ray photoelectron spectroscopy (XPS), transmission electron microscopy (TEM), and differential scanning calorimetry (DSC). The results show that in the initial weathering stage (0.3 kyr), MOAs are mainly composed of primary, low-surface area minerals (olivine, pyroxene, feldspar) with small amounts of attached OM and lignin phenols but a large contribution of micro- bial-derived carbohydrates. As high-surface area, poorly crystalline (PC) minerals increase in abundance during the sec- ond weathering stage (20–400 kyr), the content of mineral-associated OM increased sharply, up to 290 mg C/g MOA, with lignin phenols being favored over carbohydrates in the association with minerals. In the third and final weathering stage (1400–4100 kyr), metastable PC phases transformed into well crystalline secondary Fe and Al (hydr)oxides and kaolin minerals that were associated with less OM overall, and depleted in both lignin and carbohydrate as a fraction of total OM. XPS, the N 2 pore volume data and OM–mineral volumetric ratios suggest that, in contrast to the endmem- ber sites where OM accumulated at the surfaces of larger mineral grains, topsoil MOAs of the 20–400-kyr sites are com- posed of a homogeneous admixture of small-sized PC minerals and OM, which originated from both adsorption and precipitation processes. The chemical composition of OM in surface-horizon MOAs, however, was largely controlled by the uniform source vegetation irrespective of the substrate age whereas in subsoil horizons, aromatic and carboxylic C correlated positively with oxalate-extractable Al and Si and CuCl 2 -extractable Al concentrations representing PC 0016-7037/$ - see front matter Ó 2009 Elsevier Ltd. All rights reserved. doi:10.1016/j.gca.2008.12.028 * Corresponding author. Address: Soil Sciences, Martin Luther University Halle-Wittenberg, Weidenplan 14, Halle, 06108 Saale, Germany. E-mail address: [email protected] (R. Mikutta). www.elsevier.com/locate/gca Available online at www.sciencedirect.com Geochimica et Cosmochimica Acta 73 (2009) 2034–2060
Transcript of Biogeochemistry of mineral–organic associations across …mkramer/publications/Kramer_2009... ·...
Available online at www.sciencedirect.com
www.elsevier.com/locate/gca
Geochimica et Cosmochimica Acta 73 (2009) 2034–2060
Biogeochemistry of mineral–organic associations acrossa long-term mineralogical soil gradient (0.3–4100 kyr),
Hawaiian Islands
Robert Mikutta a,g,*, Gabriele E. Schaumann b, Daniela Gildemeister b,Steeve Bonneville c, Marc G. Kramer d, Jon Chorover e, Oliver A. Chadwick f,
Georg Guggenberger a,g
a Soil Sciences, Martin Luther University Halle-Wittenberg, Weidenplan 14, 06108 Halle (Saale), Germanyb Environmental and Soil Chemistry, University of Koblenz-Landau, Germany
c School of Earth and Environment, University of Leeds, UKd Earth and Planetary Sciences, University of California, USA
e Department of Soil, Water and Environmental Science, University of Arizona, USAf Department of Geography, University of California, USA
g Institute of Soil Science, Leibniz University Hannover, Germany
Received 14 August 2008; accepted in revised form 16 December 2008; available online 22 January 2009
Abstract
Organic matter (OM) in mineral–organic associations (MOAs) represents a large fraction of carbon in terrestrial eco-systems which is considered stable against biodegradation. To assess the role of MOAs in carbon cycling, there is a needto better understand (i) the time-dependent biogeochemical evolution of MOAs in soil, (ii) the effect of the mineral com-position on the physico-chemical properties of attached OM, and (iii) the resulting consequences for the stabilization ofOM. We studied the development of MOAs across a mineralogical soil gradient (0.3–4100 kyr) at the Hawaiian Islandsthat derived from basaltic tephra under comparable climatic and hydrological regimes. Mineral–organic associations werecharacterized using biomarker analyses of OM with chemolytic methods (lignin phenols, non-cellulosic carbohydrates)and wet chemical extractions, surface area/porosity measurements (N2 at 77 K and CO2 at 273 K), X-ray photoelectronspectroscopy (XPS), transmission electron microscopy (TEM), and differential scanning calorimetry (DSC). The resultsshow that in the initial weathering stage (0.3 kyr), MOAs are mainly composed of primary, low-surface area minerals(olivine, pyroxene, feldspar) with small amounts of attached OM and lignin phenols but a large contribution of micro-bial-derived carbohydrates. As high-surface area, poorly crystalline (PC) minerals increase in abundance during the sec-ond weathering stage (20–400 kyr), the content of mineral-associated OM increased sharply, up to 290 mg C/g MOA,with lignin phenols being favored over carbohydrates in the association with minerals. In the third and final weatheringstage (1400–4100 kyr), metastable PC phases transformed into well crystalline secondary Fe and Al (hydr)oxides andkaolin minerals that were associated with less OM overall, and depleted in both lignin and carbohydrate as a fractionof total OM. XPS, the N2 pore volume data and OM–mineral volumetric ratios suggest that, in contrast to the endmem-ber sites where OM accumulated at the surfaces of larger mineral grains, topsoil MOAs of the 20–400-kyr sites are com-posed of a homogeneous admixture of small-sized PC minerals and OM, which originated from both adsorption andprecipitation processes. The chemical composition of OM in surface-horizon MOAs, however, was largely controlledby the uniform source vegetation irrespective of the substrate age whereas in subsoil horizons, aromatic and carboxylicC correlated positively with oxalate-extractable Al and Si and CuCl2-extractable Al concentrations representing PC
0016-7037/$ - see front matter � 2009 Elsevier Ltd. All rights reserved.
doi:10.1016/j.gca.2008.12.028
* Corresponding author. Address: Soil Sciences, Martin Luther University Halle-Wittenberg, Weidenplan 14, Halle, 06108 Saale, Germany.E-mail address: [email protected] (R. Mikutta).
Evolution of mineral–organic associations upon substrate aging 2035
aluminosilicates and Al-organic complexes (r2 > 0.85). Additionally, XPS depth profiles suggest a zonal structure ofsorbed OM with aromatic carbons being enriched in the proximity of mineral surfaces and amide carbons (peptides/pro-teins) being located in outer regions of MOAs. Albeit the mineralogical and compositional changes of OM, the rigidityof mineral-associated OM as analyzed by DSC changed little over time. A significantly reduced side chain mobility ofsorbed OM was, however, observed in subsoil MOAs, which likely arose from stronger mineral–organic bindings. Inconclusion, our study shows that the properties of soil MOAs change substantially over time with different mineralassemblages favoring the association of different types of OM, which is further accentuated by a vertical gradient ofOM composition on mineral surfaces. Factors supporting the stabilization of sorbed OM were (i) the surface areaand reactivity of minerals (primary or secondary crystalline minerals versus PC secondary minerals), (ii) the associationof OM with micropores of PC minerals (via ‘sterically’ enhanced adsorption), (iii) the effective embedding of OM in ‘wellmixed’ arrays with PC minerals and monomeric/polymeric metal species, (iv) the inherent stability of acidic aromaticOM components, and (iv) an impaired segmental mobility of sorbed OM, which might increase its stability againstdesorption and microbial utilization.� 2009 Elsevier Ltd. All rights reserved.
1. INTRODUCTION
Up to >90% of a soil’s carbon inventory resides in inti-mate association with minerals (Baisden et al., 2002; Basile-Doelsch et al., 2007; Crow et al., 2007). Organic C (OC)bound to minerals is considered relatively stable (Tornet al., 1997, 2005; Keil et al., 1998; Kalbitz et al., 2005; Mi-kutta et al., 2006) and controls the long-term sequestrationof organic matter (OM) in terresrial and marine ecosystems.The ability of ecosystems to sequester atmospheric carbonthus depends on the partitioning of soil and sediment car-bon into more stable fractions (IPCC, 2001) such as min-eral–organic associations (MOAs).1 Organic matterstabilization by minerals has been envisioned as a combinedeffect of the chemical properties of mineral sorbents (sur-face area and charge) and the structural properties of theOM involved, with aromatic structures being most resistanttowards biodegradation (Kalbitz et al., 2005; Mikutta et al.,2007).
Most primary minerals in soils are in disequilibriumwith extrinsic environmental factors like the temperatureand hydrochemical regime. Thus, weathering triggers theformation of thermodynamically more stable mineralphases such as Fe and Al (hydr)oxides and aluminosilicateclay minerals. As a result, the inventory of clay and second-ary metal (hydr)oxides in soils can increase substantiallyover time spans of thousands of years (e.g., Harden, 1987;Masiello et al., 2004). Such mineralogical shifts affect theamount of soil OC stored (Torn et al., 1997; Brenneret al., 2001; Basile-Doelsch et al., 2007), but little is knownabout compositional variations of mineral-associated OM(MOM) in different mineralogical settings. Batch experi-ments reveal that OM often sorbs to minerals selectively
1 Abbreviations used: MOA, mineral–organic association; A-MOA and B-MOA, mineral–organic associations from A and Bhorizons, respectively; LSAG, long substrate age gradient; MOCand MN, mineral-associated organic carbon and total nitrogen;MOM, mineral-associated organic matter; OC, organic carbon;PC, poorly crystalline; SSA, specific surface area; TEM–EDS,Transmission electron microscopy–energy dispersive spectroscopy;XPS, X-ray photoelectron spectroscopy.
due to chemical and molecular size fractionation (Aufdenk-ampe et al., 2001; Chorover and Amistadi, 2001; Fenget al., 2005). In soils, Fe oxides exhibit a strong affinityfor highly oxidized aromatic, lignin-derived OC (Kaiseret al., 1997; Chorover and Amistadi, 2001; Mikutta et al.,2007), whereas river sediments and kaolinite were reportedto retain N-containing compounds selectively (Aufdenk-ampe et al., 2001). A mineralogical impact on OM compo-sition has also been tentatively suggested by analysis of OMcomposition (lignin, cutin and suberin acids) of mineralog-ically diverse density fractions of an Andic Dystrudept Ahorizon (Sollins et al., 2006). Straightforward evaluationof a mineralogical control can, however, be compromisedby the fact that MOM is subjected to in-situ microbialtransformations, which may mask the mineral-inducedchemical imprint (Keil et al., 1998). Most studies relatedto sorptive fractionation and differential stabilization ofOM at mineral surfaces have been conducted in sediments(Keil et al., 1998; Arnarson and Keil, 2001; Dickenset al., 2006; Arnarson and Keil, 2007), thus limiting ourunderstanding of long-term compositional changes ofMOM in soil environments.
Whereas the chemical composition of soil OM has beensubject to numerous studies, little is known about the time-dependent alteration of the physical properties of mineral-attached OM in natural environments. Soil OM undergoesstructural changes upon aging (Schaumann, 2006; Hurrassand Schaumann, 2007). Differential scanning calorimetryexperiments indicate a decrease in segmental mobility ofOM over time, likely as a result of water- or metal-mediatedcross-linkings between OM chains (Schaumann, 2005). Theflexibility of OM bound directly to mineral surfaces is ex-pected to decrease as more ligands are involved in mineralattachment, and as such, flexibility should depend on thetype of minerals present and on the amount and composi-tion of OM accumulated. Steric rearrangements of OM atmineral surfaces leading to the neoformation of organic–or-ganic (Collins et al., 1995) or organic–mineral bonds (Kai-ser et al., 2007) are thus supposed to confer a greaterstability to sorbed OM. In consequence, mineralogicalchanges over time affect mineral–OM interactions in at leastthree aspects: (i) by the development of reactive surfaces
2036 R. Mikutta et al. / Geochimica et Cosmochimica Acta 73 (2009) 2034–2060
that will enable OM to interact with minerals, (ii) by creat-ing conditions that allow for sorptive fractionation pro-cesses of OM, and (iii) by changing the physicalproperties of sorbed OM.
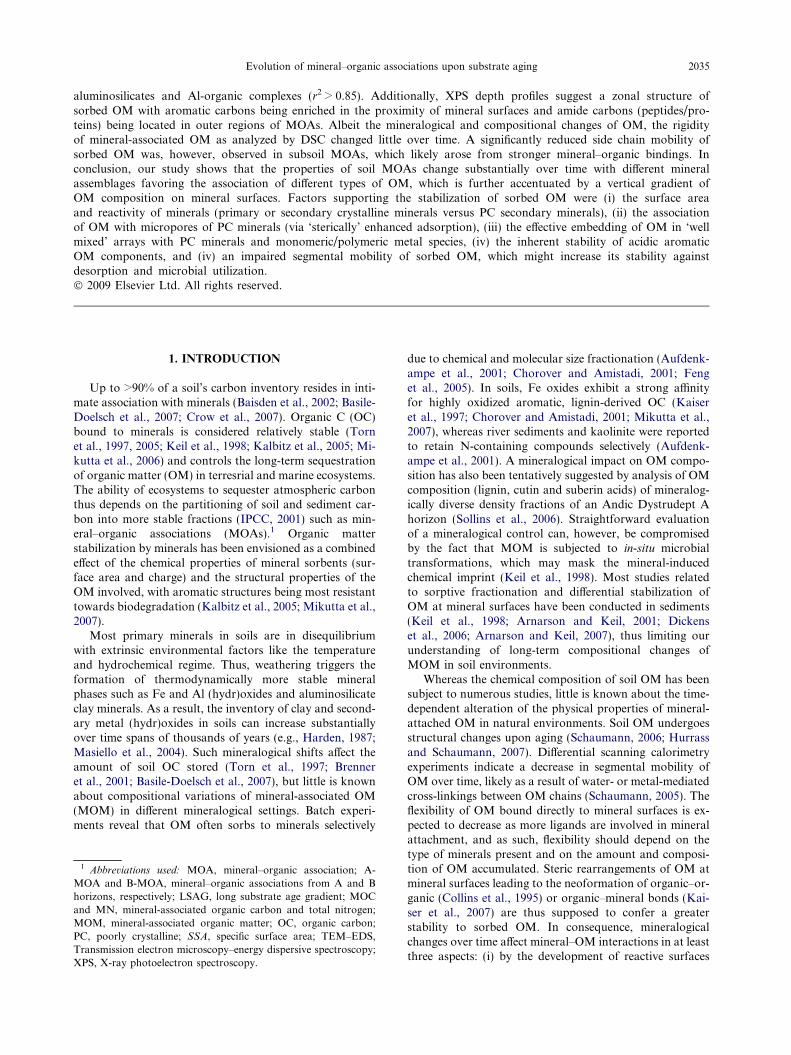
This study investigates the changing nature of mineral–organic associations during progressive basalt weathering(Pliocene to Holocene) in the Hawaiian archipelago. Wecomplement previous research on mineral–OM relation-ships in soils of this weathering gradient known as ‘longsubstrate age gradient’ (LSAG) where the transformationof mineral matter over 0.3–4100 kyr causes a differentialstorage of OM (Torn et al., 1997, 2005; Chorover et al.,2004; Vitousek, 2004). The main objective of this study isto examine the time-dependent formation and characteris-tics of MOAs and the consequences for the chemical andphysical properties of MOM, and thus to contribute tothe understanding of OM stabilization in soils. We hypoth-esize that the time-dependent transformation of primary sil-icates dominating in juvenile basaltic lava into more maturesecondary minerals is accompanied by distinct changes inthe physico-chemical properties of MOM. The LSAG ismost suitable to trace the impact of minerals because eachsite has a similar geological setting, climate, and plant spe-cies composition, but different soil mineral composition.The similar plant species assemblage at each site is criticalto the study because it minimizes the influence of primaryorganic resources on the chemical variability of MOM.Mineral–organic associations were isolated densiometrical-ly and examined along the LSAG according to three as-pects: (i) changes in mineralogical composition, surfacearea and porosity were elucidated by selective extractions,X-ray photoelectron spectroscopy (XPS), gas adsorption(N2 at 77 K and CO2 at 273 K), and transmission electronmicroscopy coupled with energy dispersive spectroscopy(TEM–EDS); (ii) the chemical transformation of OM in
Fig. 1. The Hawaiian archipelago an
MOAs was examined by XPS and molecular biomarkeranalyses (lignin phenols, non-cellulosic carbohydrates),and (iii) the alteration of the physical state of OM in MOAsover time was investigated by differential scanning calorim-etry (DSC).
2. MATERIALS AND METHODS
2.1. Study site and sample collection
Detailed descriptions of the geological, climatic and mor-phological settings of the LSAG sites are given in Vitousek(2004) and Chorover et al. (2004). All soils were formed frombasaltic materials composed primarily of tephra overlyinglava or a lava-ash mixture. Parent material age, measuredusing 14C and K/Ar radiometric techniques, ranges from0.3 to 4100 kyr (Fig. 1 and Table 1). The sites are located at1130–1500 m elevation above sea level with a mean annualtemperature of 289 K and a mean annual precipitation of2500 mm. At each site the montane rainforest is dominatedby Metrosideros polymorpha (>75%) while the subcanopiesare more diverse across the sites, including different nativetree ferns in the genus Cibotium. Soils of the six sites havebeen classified as (1) Thaptic Udivitrand (Thurston), (2–4)Aquic Hydrudand (Laupahoehoe, Kohala, Pololu), (5)Aquic Hapludand (Kolekole), and (6) Plinthic Kandiudox(Kokee) (Chorover et al., 2004). Source vegetation, organiclayers, and mineral A and B horizons (0–20; 10–100 cm; Ta-ble 1) were sampled in June 2007 analogous to the samplingscheme described in Chorover et al. (2004). Samples werecarefully mixed in the field, double packed in Ziploc bags,and stored in the laboratory coolers on blue ice. High prior-ity-shipping to Germany was accomplished at a temperature<278 K within four days. In the laboratory, soil samples wereimmediately pushed through a 2-mm sieve, roots, visible
d study sites (ESRI data base).
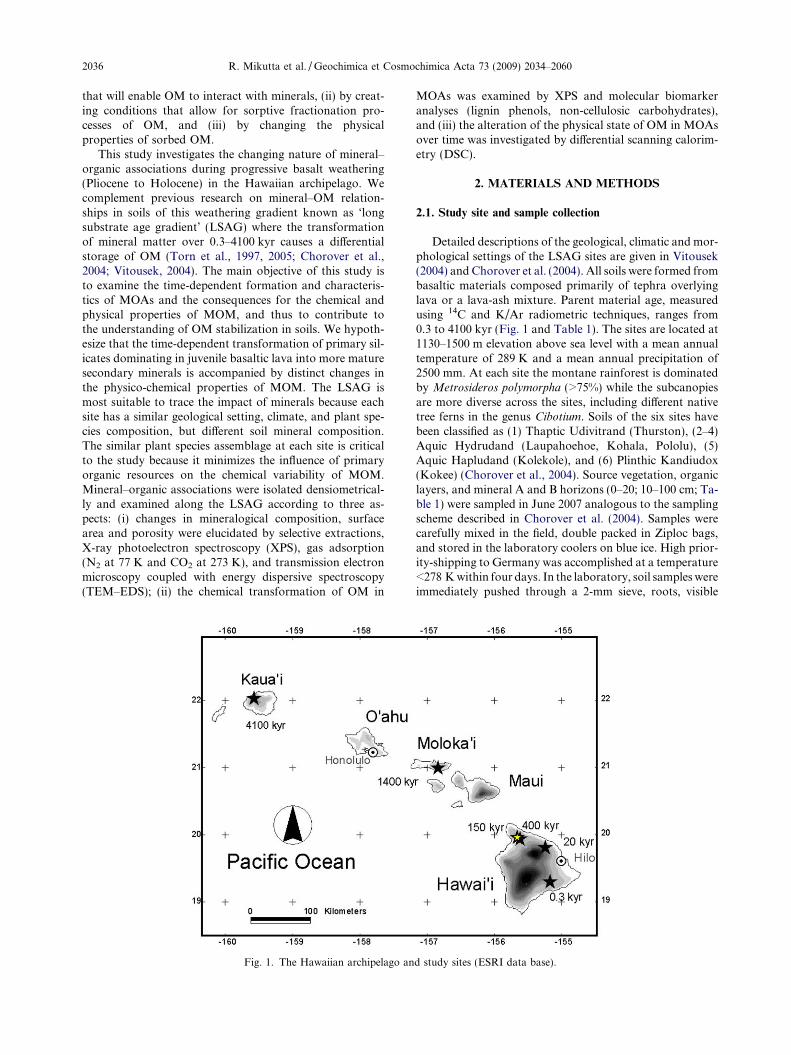
Table 1Site age, origin, sampling depth and pH of soils, and basic properties of isolated mineral–organic associations (MOAs) from A and B horizons of the long substrate age gradient.
Siteage
Island Depth Soil pH(H2O)
Absolutedensity(MOA)
MOCa MNa C/N MOCNaOHb XAD-
8cFedith
d Feoxd Feox/
Fedith
Aloxd AlCu
e Sioxd Clay mineral
compositionf
(kyr) cm (g/cm3) (mg/g) (mg/g) (%) (%) (mg/g) (mg/g) (mg/g) (mg/g) (mg/g)
A horizons
Thurston 0.3 Hawaii 2–9 5.5 2.9 18.7 (0.8) 2.3 (0.3) 8 70 56 5.0 4.3 0.9 2.6 1.5 0.8 P, F, aLaupahoehoe 20 Hawaii 0–10 4.1 2.4 177.5 (0.2) 9.9 (0.1) 18 47 66 153.6 84.2 0.5 3.3 0.9 0.3 F, A, m, qKohala 150 Hawaii 0–7 3.9 2.1 187.6 (0.1) 13.2 (0.1) 14 63 68 46.9 37.4 0.8 18.5 11.1 0.8 A, F, v, hiv, qPololu 400 Hawaii 0–10 3.9 1.8 290.4 (0.0) 19.4 (0.1 15 66 81 43.7 40.0 0.9 7.6 6.1 0.1 A, F, v, hiv, k, qKolekole 1400 Molokai 0–8 4.2 2.3 131.1 (0.1) 9.7 (0.1) 13 60 65 40.1 15.4 0.4 4.2 1.9 0.1 K, Gi, F, he, qKokee 4100 Kauai 0–16 4.8 3.2 40.0 (0.1) 2.8 (0.2) 14 74 49 241.3 4.4 0.0 0.4 0.2 0.0 K, Gi, Go, he
B horizons
Thurston 0.3 — 15–23 6.1 2.8 23.2 (0.1) 2.5 (0.1) 9 46 51 11.5 10.7 0.9 8.1 1.5 4.1 P, F, aLaupahoehoe 20 — 45–67 5.3 2.3 113.6 (0.1) 5.6 (0.2) 20 86 46 100.8 77.9 0.8 113.5 7.6 29.5 F, A, m, qKohala 150 — 41–60 4.0 2.1 120.6 (0.1) 4.4 (0.1) 27 92 37 15.4 16.9 1.1 137.8 15.9 44.7 A, F, hiv, qPololu 400 — 44–64 4.9 2.5 81.3 (0.0) 3.6 (0.2) 23 88 46 124.1 56.6 0.5 50.5 9.2 4.9 A, F, v, hiv, k, qKolekole 1400 — 30–49 4.9 2.6 19.9 (0.1) 2.0 (0.1) 10 100 29 53.3 14.4 0.3 14.0 2.4 2.0 K, Gi, f, he, q, mKokee 4100 — 50–100 5.2 3.1 12.1 (0.1) 1.6 (0.2) 7 75 21 143.9 2.3 0.0 2.1 0.4 0.1 K, Gi, Go, he, m
a MOC and MN = mineral-associated organic C and N.b Fraction of the mineral-associated OC extractable in 0.1 M NaOH.c Fraction of the NaOH-extractable OC that adsorbs to XAD-8 resin after acidification to pH 2.d Fedith = dithionite-extractable Fe; Feox, Alox, Siox = oxalate-extractable Fe, Al, Si.e AlCu = CuCl2-extractable Al.f Data compiled from Chorover et al. (2004): upper case letters indicate major constituents, lower case letters indicate minor constituents; P, plagioclase; A, short-range-ordered Al gels or
aluminosilicates (e.g., allophane); F, ferrihydrite; Q, quartz; V, vermiculite; HIV, hydroxyl-interlayered vermiculite; K, kaolin minerals (kaolinite and/or halloysite); Gi, gibbsite; He, hematite; Go,goethite; M, magnetite.
Evo
lutio
no
fm
ineral–o
rganic
associatio
ns
up
on
sub
strateagin
g2037
2038 R. Mikutta et al. / Geochimica et Cosmochimica Acta 73 (2009) 2034–2060
plant and animal remains were removed, and the materialwas stored field-moist in the dark at 277 K until use.
2.2. Density fractionation and chemical analyses
Density fractionation: Mineral–organic associations withq > 1.6 g/cm3 were obtained by suspending the field-moist(20–74 wt.% H2O), low-aggregated samples in sodium poly-tungstate (SPT) solution. Contaminant OC and N concen-trations in the original SPT salt were at the detection limit(�0.001% OC and �0.001% N). Briefly, between 31 and98 g field-moist soil (25 g dry weight after freeze-drying at0.3 mbar) were mixed with 125 mL SPT giving a final den-sity of 1.6 ± 0.01 g/cm3. Following vigorous agitation on ahorizontal shaker (300 rpm) for 30 min, the suspensionswere left to stand for 30 min and then centrifuged at4500g for 15 min. If dispersion was incomplete, the shakingperiod was extended. A 1.6-g/cm3 density cutoff was chosenbecause MOAs, e.g., those derived from coprecipitation ofOM with Al, can exhibit very low absolute densities (1.7 g/cm3) (Kaiser and Guggenberger, 2007a). Ultrasonic disper-sion was avoided because of the risk to transfer MOAs con-taining poorly crystalline (PC) minerals into the densityfraction <1.6 g/cm3 (Kaiser and Guggenberger, 2007a).The floating particulate OM was transferred on 0.7-lmglass microfibre filter (GF/F Whatman) and vacuum fil-tered. The procedure was repeated until no floating partic-ulate OM was observed. The particulate OM and MOAfractions were washed with distilled water to an electricconductivity of <50 dS/m. In some cases, colloids startedto disperse at �100 dS/m. Then further washing wasavoided. To prevent slow-freezing artefacts on surfaceproperties of MOAs, samples were shock-frozen in liquidN2 (77 K) and subsequently freeze-dried at 0.3 mbar.
Chemical analyses: Selective extractions of MOAs werecarried out in triplicate at 298 K in the dark using pre-driedsamples (0.3 mbar for 24 h) by (i) dithionite–citrate (Blake-more et al., 1987), (ii) oxalic oxalate (Blakemore et al.,1987), and (iii) copper(II) chloride (Juo and Kamprath,1979). Element concentrations in extraction solutions weremeasured by inductively coupled plasma atomic–emissionspectroscopy (ICP–AES, Jobin Yvon JY 70 plus, France)after calibration with element standards dissolved in therespective extraction matrices. Dithionite–citrate extract-able Fe represents non-silicate Fe, i.e., crystalline and PCFe (hydr)oxides; oxalate-extractable Fe, Al and Si derivefrom PC aluminosilicates, ferrihydrite/nanocrystalline goe-thite, and Al and Fe in organic complexes, whereas the dif-ference between dithionite–citrate and oxalate-extractableFe (Fedith–ox) is taken as a measure of the content of crys-talline Fe oxides. Copper(II) chloride-extractable Al mainlyrepresents organically complexed and exchangeable Al (Juoand Kamprath, 1979).
2.3. Organic carbon, total nitrogen, and extractability
The OC and total N content of finely ground and pre-dried samples were measured in triplicate by dry combus-tion at 1423 K using a Vario EL CNS analyzer (ElementarAnalysensysteme, Hanau, Germany). The extractability of
OC from MOAs was tested by treatment with a dilutedNaOH solution in N2 atmosphere. Briefly, 0.5 g of pre-dried MOAs were extracted three times with 20 mL of0.1 M NaOH (1/40 wt./vol.). After shaking for 24 h in thedark (250 rpm; 298 K), samples were centrifuged (20 min;10,000g), filtered through polyvinylidene fluoride syringefilters (<0.45 lm), and the amount of extracted OC wasanalyzed as non-purgeable OC by Pt-catalyzed oxidationat 993 K (Shimadzu TOC-V, Japan). The replicate variabil-ity of OC concentration was <2%. The contribution of aro-matic components in extracted OM, defined as‘hydrophobic’ OC, was estimated by XAD-8 fractionation(Aiken and Leenheer, 1993).
2.4. X-ray photoelectron spectroscopy (XPS)
Mineral–organic associations sieved to a size of<200 lm were analyzed in triplicate by XPS using a PHI5700 ESCA-System instrument (Physical Electronics,Chanhassen, USA). Pre-dried samples were pressure-mounted onto a conducting indium foil and inspected visu-ally using the instrument’s microscope to identify suitableareas without large mineral grains. This procedure was pri-marily important for the youngest sample (Thurston),which still contains larger primary mineral particles. Thensamples were excited with non-monochromated Al Ka radi-ation (Eexc = 1486.6 eV) at an incident angle of 45� and anelectron beam spot size of 800 lm (�500 lm2). Surfacecomposition analyses of MOAs up to a depth of �3–5 nmincluded a survey element scan and a high-resolution scanat the C1s edge. The bulk element composition of MOAswas revealed by scanning from 0 to 1100 eV using a pass en-ergy of 93.90 eV, a channel width of 0.4 eV/step, and a mea-sure time of 20 ms/step (exposition time = 10 min); in thehigh-resolution mode, MOAs were scanned at the C1s edgeusing a pass energy of 11.75 eV, a channel width of 0.1 eV/step and measure time of 100 ms/step (expositiontime = 30 min). Significant X-ray-induced alteration ofMOM that could cause false structural C assignments is ex-pected only for exposure times >30 min (Dengis et al., 1995;Zubavichus et al., 2004). Vacuum during measurementswas �3 � 10�9 mbar. Contamination rate by adventitiousC was estimated to be 0.1 atom%/h. Sample charging dur-ing analysis lead to peak shifts of 63 eV, which was cor-rected based on the maximum principal C1s sub-peakcentered at 285 eV. Data analysis was accomplished withthe instrument software package (Multipak V6.1A; Physi-cal Electronics) using manufacturer-based sensitivity fac-tors whereas graphics were generated using Unifit forWindows, Version 2008 (Hesse et al., 2003). Identificationof binding energies was done according to Moulder et al.(1992). The chemical composition of MOM was revealedby deconvoluting the C1s peak into sub-peaks by fittingGaussian–Lorentzian functions (85%/15%) that are as-signed to different C environments (NIST XPS database,Monteil-Rivera et al., 2000). The full-width-at-half-maxi-mum (FWHM) of fitted sub-peaks was allowed to vary be-tween 0 and 1.5. Additionally, we analyzed the chemicalcomposition of MOAs from A horizons along depth pro-files in one representative sample area (�500 lm2) immedi-
Evolution of mineral–organic associations upon substrate aging 2039
ately after sputtering with Ar+ ions for 15 min (t15) and30 min (t30), respectively [ion fluence = 1.6 � 1014/(cm2 s)].Thirty minutes were set as time limit for Ar+ gassing toavoid the reduction of C1s signals below that acceptablefor peak processing. Etching velocity was �1.4 nm/minfor pure SiO2. While the sputter efficiency for OM and min-erals differs and hence the actual sputter depth remains un-known, this procedure is appropriate to reveal shifts in thevertical composition of OM at particle surfaces (Amelunget al., 2002).
2.5. Surface area and porosity analyses
Gas adsorption and desorption was measured with aNova 4200 analyzer (Quantachrome Corp., BoyntonBeach, USA) using N2 and CO2 as adsorbates. For N2
adsorption, about 100–1000 mg of solid was weighed intothe sample cell to ensure sufficient surface area for analy-sis. Adsorbed water was removed by outgassing the sam-ple at 313 K and 10�3 mbar for 48 h. After re-weighing,N2 adsorption–desorption isotherms were recorded at77 K in the partial pressure region 2.5 � 10�3–0.99 P/P0
using 40 adsorption and 40 desorption points. P0 wasremeasured after every 20th adsorption/desorption pointto account for short-term alterations of atmospheric pres-sure. Thermal equilibration was 90 s, equilibration timewas set minimal 240 s and maximal 400 s, and pressuretolerance was 0.1 mm Hg. The specific surface area(SSA) was determined from the relative pressure rangeof 0.05–0.3 by the BET equation (Brunauer et al., 1938).In the BET model, the C constant expresses the energyof adsorption to a surface and relates to the net enthalpyof N2 adsorption (DHxs) as follows (Rouquerol et al.,1998; Mayer, 1999)
CBET � exp½ðDH ads � DH condÞ=RT � � expðDH xs=RT Þ ð1Þ
where DHads is the adsorption enthalpy of the gas directlyon the surface, DHcond is the enthalpy of gas condensation,R is the universal gas constant, and T is the temperature ofgas adsorption. The mineral SSA of MOAs still accessibleto N2 (SSAcorr) was estimated by correction of gas adsorp-tion data for OM contents according to:
SSAcorr ¼ SSA=ð1�MOM=1000Þ ð2Þ
where SSA denotes measured specific surface area values(m2/g), and MOM refers to the organic matter content(2 �MOC; mg/g). The volume of mesopores was deter-mined by the Barrett–Joyner–Halenda model (Barrettet al., 1951) using the adsorption leg of the isotherm; the to-tal pore volume was estimated at P/P0 = 0.99.
Carbon dioxide adsorption was performed at 273 K inan ice bath from 2 � 10�6 to 0.03 P/P0 using 38 adsorptionpoints. Outgassing and measuring conditions were equal tothe N2 adsorption experiment. Before determination of theweight of the water-free sample and to avoid contaminationwith CO2, the sample was backfilled with N2. For bothadsorbates, micropore volumes were determined by theDubinin–Radushkevich equation (Gregg and Sing, 1982).The absolute density of MOAs (Table 1), as required bythe instrument software, was measured in triplicate with a
He pycnometer (Micromeritics ACCUPyc 1330, Norcross,USA). The experimental error was 61%. All surface areaand porosity analyses were carried out at least in duplicate.
2.6. Transmission electron microscopy (TEM)
Before TEM analysis, MOA samples from A horizonswere suspended in methanol and sonicated for 5 min. Onedrop of the suspensions was placed onto a porous carbonfilm (Agar Scientific Ltd., Stansted, UK) on a Cu TEM gridand left to dry at room temperature for 5 min. Particleaggregates covering holes in the support film were imagedon a FEI CM200 instrument (FEI Company, Eindhoven,The Netherlands) equipped with a field-emission gun oper-ated at an acceleration voltage of 200 kV. Energy dispersiveX-ray spectroscopy (EDS) analyses were performed onMOA particles for areas of various size (20–200 nm) usinga UTW ISIS EDX analyzer with an ultrathin windowallowing detection of light elements (Oxford Instruments,United Kingdom).
2.7. Differential scanning calorimetry (DSC)
To characterize the degree of rigidity of MOM we usedDSC and determined the glass transition-like step transi-tion temperature (T*) of OM as a measure for the matrixrigidity (Hurrass and Schaumann, 2005; Schaumann andLeBoeuf, 2005). Three to six replicates of each sample(2–8 mg MOA) that were equilibrated for at least twoweeks at 293 K and 31% humidity were weighed into stan-dard Al pans. The pans were sealed hermetically prior tothe DSC experiment. Differential scanning calorimetryexperiments were performed using a DSC Q1000 calorim-eter (TA Instruments, Alzenau, Germany) with TZerotechnology� and a refrigerated cooling system, and N2
as a purge gas. The samples were abruptly cooled in theDSC instrument to 223 K and then heated at a rate of10 K/min from 223 K to 383 K and 403 K for samplesfrom A and B horizons, respectively. This first heating cy-cle was followed by a second abrupt cooling and a subse-quent heating cycle. The DSC data were analyzed usingUniversal Analysis software Version 4.1 (TA Instruments).Baseline correction was performed by subtracting the ther-mogram of the second heating cycle from that of the firstone to separate the non-reversing from the reversing ef-fects as discussed by Hurrass and Schaumann (2005).The glass transition-like step transition is indicated byan inflection point in the thermogram (Hurrass andSchaumann, 2005; Schaumann and LeBoeuf, 2005). Oper-ationally, three tangent lines were applied and T* was de-fined as the temperature at the curve inflection. In order toverify that transitions are solely due to OM, we also ana-lyzed the thermal behavior of a suite of pure minerals at31% humidity including 2-line ferrihydrite, allophane, goe-thite, PC Al(OH)3, gibbsite, vermiculite, and kaolinite(clay minerals <2 lm, Na+-saturated). We found no sig-nificant transition in the temperature range examined.Only ferrihydrite revealed a small transition at 363–373 K but neither the transition temperature nor the tran-
2040 R. Mikutta et al. / Geochimica et Cosmochimica Acta 73 (2009) 2034–2060
sition intensity in the MOA samples correlated with theferrihydrite content (�oxalate-extractable Fe), suggestingthat minerals do not significantly contribute to the ob-served step transitions.
2.8. Chemical analysis of mineral-associated organic matter
Lignin-derived phenols: Lignin-derived phenols werequantified in duplicate after CuO oxidation. Briefly, 25–500 mg of organic layer and MOA samples were mixed with15 mL 2 M NaOH, 50–100 mg Fe(NH4)2(SO4)2 6H2O, 250–500 mg CuO and 50 mg glucose and oxidized for 2 h at443 K (Amelung et al., 1999). The lignin-derived phenolswere extracted from the acidified solution (pH 1.8–2.2)using C18 solid-phase columns (Mallinckrodt Baker Corp.,Phillipsburg, NJ), eluted with ethyl acetate and derivatizedwith a 1:1 mixture of pyridine and N,O-bis(trimethyl-silyl)trifluoroacetamide. The derivatives were separatedand quantified using a gas chromatograph mass spectrom-eter (GCMS-QP 2010, Shimadzu Corp., Tokyo, Japan) anda SPB-5 fused silica column (30 m, 0.25 i.d., 0.25-lm film;Supelco, Bellefonte, PA). Injector temperature was 523 Kand the temperature programme included 373 K for1 min, 15 K/min to 523 K, 523 K for 10 min, 30 K/min to573 K, 573 K for 7 min. Helium was used as carrier gaswith a constant pressure of 1.1 bar. As internal recoverystandards, ethylvanillin was added prior to CuO oxidationand phenylacetic acid prior to derivatization. The recoveryof ethylvanillin from MOA samples averaged 92 ± 2%,those of litter samples averaged 100 ± 2%, and those of Osamples averaged 115 ± 2%. Cupric oxide treatment pro-duces a suite of phenolic monomers derived from intact lig-nin polymers (Benner et al., 1990) and its degradation andtransformation products (Guggenberger and Zech, 1994;Kaiser et al., 2004). The sum of the eight oxidation prod-ucts was taken to indicate lignin-derived OM (Kogel,1986): vanillyl (V) and syringyl (S) units were calculatedfrom the concentrations of their respective aldehydes, car-boxylic acids, and ketones: V =
P(vanillin + vanillic
acid + acetovanillone), S =P
(syringaldehyde + syringicacid + acetosyringone). Cinnamyl units (C) were derivedfrom the summed concentration of ferulic acid and p-cou-maric acid. Thus, the total content of lignin-derived phenols(K8) was determined by the sum of structural units:K8 =
P(V + S + C).
Non-cellulosic carbohydrates: Sugars were determined astheir corresponding oximes by gas chromatography afteracid hydrolysis of MOA samples (Amelung et al., 1996).Briefly, freeze-dried MOAs were weighed into 25-mLhydrolysis flasks (corresponding to 5–10 mg OC), 10 mLof 4 M trifluoroacetic acid and 100 lL myo-inositol (inter-nal standard) were added. Samples were reacted for 4 h at378 K and then filtered through glass microfibre filter(GF6 Whatman). The filtrate was dried on a rotary evapo-rator at 313 K, taken up in 10 mL distilled H2O, and subse-quently purified using preconditioned XAD-7 and Dowex50Wx8 resins. The freezed-dried eluate was taken up intotal 2 mL distilled H2O and transferred into a 3-mL reac-tivial, and freeze-dried again. Derivatization was accom-plished by adding 200 lL methyl glucose (derivatization
standard) plus 200 lL derivatization solution (20 mg/mLo-methylhydroxylamine in pyridine) into the vials and leav-ing them for 30 min at 348 K. Then, after cooling for15 min, 400 lL N,O-bis(trimethylsilyl)trifluoroacetamidewere added and samples were again heated to 348 K for5 min. After derivatization, samples were measured by cap-illary gas chromatography (GC-2010, Shimadzu Corp., To-kyo, Japan) equipped with a fused silica SPB-5 column(30 m, 0.25 mm i.d., 0.25-lm film, Supelco). Helium servedas carrier gas at a constant pressure of 1 bar. The injectorwas set to 523 K and the FID to 573 K. The temperatureprogram comprised the following steps: heating to 433 Kfor 4 min, heating to 458 K (rate: 8 K/min), 1.5 min at458 K, heating to 523 K (rate: 4 K/min), 0.5 min at458 K, heating to 573 K (rate: 50 K/min) and 5 min at573 K. The recovery of myo-inositol from MOA samplesaveraged 102 ± 15%, those of litter samples averaged115 ± 8%, and those of O samples averaged 116 ± 4%.
2.9. Terminology and statistics
In the following, mineral–organic associations from Ahorizons are termed ‘A-MOAs’, those from B horizons‘B-MOAs’, respectively. The Pearson correlation coefficientwas calculated based on z-transformed variables using Stat-istica 5.1 (StatSoft Inc., Tulsa, USA).
3. RESULTS AND DISCUSSION
3.1. Time-dependent transformation of mineral–organic
associations
3.1.1. Mineralogical composition at different weathering
stages
The mineral composition of LSAG soils varies substan-tially over 4100 kyr of basalt weathering causing significanttransformation of mineral matter (Torn et al., 1997; Chor-over et al., 2004; Ziegler et al., 2005). Despite rock weath-ering being a continuous process, the most significanttransformations of minerals in MOAs with time occur with-in three operationally defined weathering stages (I–III).Stage I corresponds to the 0.3-kyr site (Thurston) and ischaracterized by rapid weathering of basaltic tephra, thuscausing a substantial loss of non-hydrolyzing cations (K+,Na+, Ca2+, Mg2+) and the creation of Al and H+ acidity(Chorover et al., 2004). Primary minerals like olivine,pyroxene, plagioclase (andesine and anorthite) present atthe 0.3-kyr site (Table 1) are weathered almost completelybefore 20 kyr giving rise to metastable minerals that domi-nate during stage II (20–400 kyr). Ferrihydrite/nanocrystal-line goethite, Al gels, and allophane constitute thedominant mineral phases during phase II of the <2-lmfraction (Chorover et al., 1999) whereas quartz and Ti-bear-ing minerals (anatase, ilmenite) comprise the larger grainsizes (not shown). A significant portion of Al dissolvedfrom minerals during weathering stage II is held in com-plexes with OM as shown by the large CuCl2-extractableAl concentrations (Table 1). Moreover, at the youngestand intermediate-aged sites (0.3–400 kyr; stage I and II), apredominant portion of the secondary Fe exists in the form
Evolution of mineral–organic associations upon substrate aging 2041
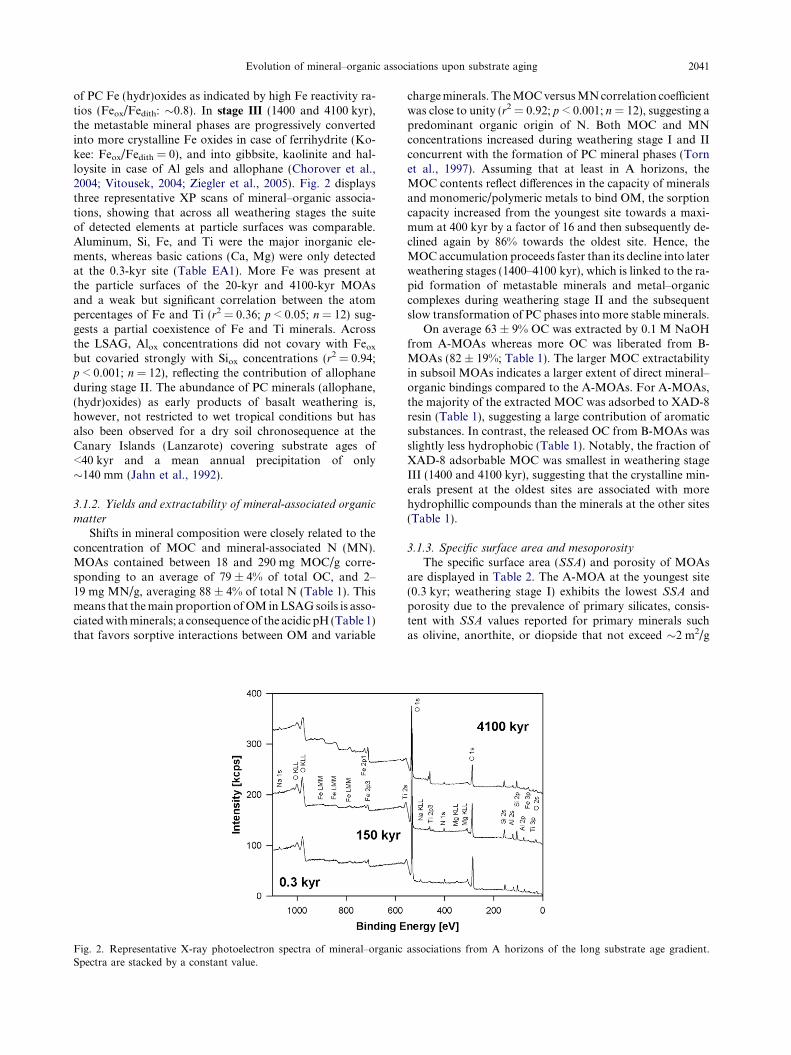
of PC Fe (hydr)oxides as indicated by high Fe reactivity ra-tios (Feox/Fedith: �0.8). In stage III (1400 and 4100 kyr),the metastable mineral phases are progressively convertedinto more crystalline Fe oxides in case of ferrihydrite (Ko-kee: Feox/Fedith = 0), and into gibbsite, kaolinite and hal-loysite in case of Al gels and allophane (Chorover et al.,2004; Vitousek, 2004; Ziegler et al., 2005). Fig. 2 displaysthree representative XP scans of mineral–organic associa-tions, showing that across all weathering stages the suiteof detected elements at particle surfaces was comparable.Aluminum, Si, Fe, and Ti were the major inorganic ele-ments, whereas basic cations (Ca, Mg) were only detectedat the 0.3-kyr site (Table EA1). More Fe was present atthe particle surfaces of the 20-kyr and 4100-kyr MOAsand a weak but significant correlation between the atompercentages of Fe and Ti (r2 = 0.36; p < 0.05; n = 12) sug-gests a partial coexistence of Fe and Ti minerals. Acrossthe LSAG, Alox concentrations did not covary with Feox
but covaried strongly with Siox concentrations (r2 = 0.94;p < 0.001; n = 12), reflecting the contribution of allophaneduring stage II. The abundance of PC minerals (allophane,(hydr)oxides) as early products of basalt weathering is,however, not restricted to wet tropical conditions but hasalso been observed for a dry soil chronosequence at theCanary Islands (Lanzarote) covering substrate ages of<40 kyr and a mean annual precipitation of only�140 mm (Jahn et al., 1992).
3.1.2. Yields and extractability of mineral-associated organic
matter
Shifts in mineral composition were closely related to theconcentration of MOC and mineral-associated N (MN).MOAs contained between 18 and 290 mg MOC/g corre-sponding to an average of 79 ± 4% of total OC, and 2–19 mg MN/g, averaging 88 ± 4% of total N (Table 1). Thismeans that the main proportion of OM in LSAG soils is asso-ciated with minerals; a consequence of the acidic pH (Table 1)that favors sorptive interactions between OM and variable
Fig. 2. Representative X-ray photoelectron spectra of mineral–organicSpectra are stacked by a constant value.
charge minerals. The MOC versus MN correlation coefficientwas close to unity (r2 = 0.92; p < 0.001; n = 12), suggesting apredominant organic origin of N. Both MOC and MNconcentrations increased during weathering stage I and IIconcurrent with the formation of PC mineral phases (Tornet al., 1997). Assuming that at least in A horizons, theMOC contents reflect differences in the capacity of mineralsand monomeric/polymeric metals to bind OM, the sorptioncapacity increased from the youngest site towards a maxi-mum at 400 kyr by a factor of 16 and then subsequently de-clined again by 86% towards the oldest site. Hence, theMOC accumulation proceeds faster than its decline into laterweathering stages (1400–4100 kyr), which is linked to the ra-pid formation of metastable minerals and metal–organiccomplexes during weathering stage II and the subsequentslow transformation of PC phases into more stable minerals.
On average 63 ± 9% OC was extracted by 0.1 M NaOHfrom A-MOAs whereas more OC was liberated from B-MOAs (82 ± 19%; Table 1). The larger MOC extractabilityin subsoil MOAs indicates a larger extent of direct mineral–organic bindings compared to the A-MOAs. For A-MOAs,the majority of the extracted MOC was adsorbed to XAD-8resin (Table 1), suggesting a large contribution of aromaticsubstances. In contrast, the released OC from B-MOAs wasslightly less hydrophobic (Table 1). Notably, the fraction ofXAD-8 adsorbable MOC was smallest in weathering stageIII (1400 and 4100 kyr), suggesting that the crystalline min-erals present at the oldest sites are associated with morehydrophillic compounds than the minerals at the other sites(Table 1).
3.1.3. Specific surface area and mesoporosity
The specific surface area (SSA) and porosity of MOAsare displayed in Table 2. The A-MOA at the youngest site(0.3 kyr; weathering stage I) exhibits the lowest SSA andporosity due to the prevalence of primary silicates, consis-tent with SSA values reported for primary minerals suchas olivine, anorthite, or diopside that not exceed �2 m2/g
associations from A horizons of the long substrate age gradient.
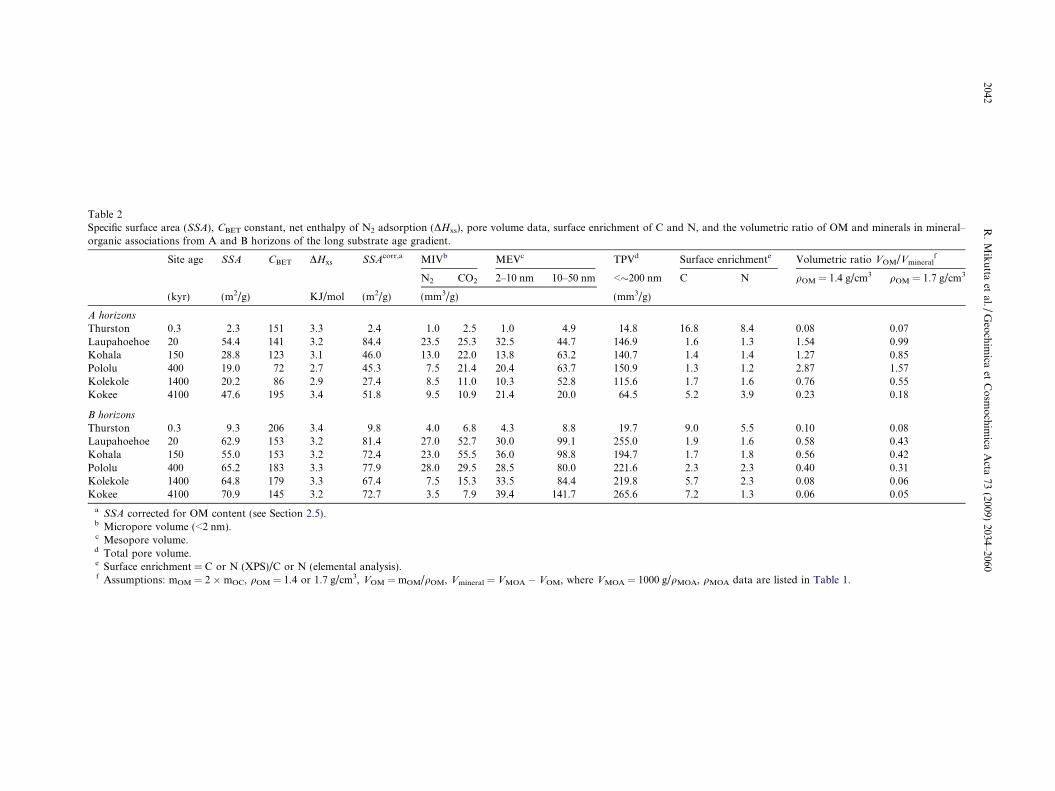
Table 2Specific surface area (SSA), CBET constant, net enthalpy of N2 adsorption (DHxs), pore volume data, surface enrichment of C and N, and the volumetric ratio of OM and minerals in mineral–organic associations from A and B horizons of the long substrate age gradient.
Site age SSA CBET DHxs SSAcorr,a MIVb MEVc TPVd Surface enrichmente Volumetric ratio VOM/Vmineralf
N2 CO2 2–10 nm 10–50 nm <�200 nm C N qOM = 1.4 g/cm3 qOM = 1.7 g/cm3
(kyr) (m2/g) KJ/mol (m2/g) (mm3/g) (mm3/g)
A horizons
Thurston 0.3 2.3 151 3.3 2.4 1.0 2.5 1.0 4.9 14.8 16.8 8.4 0.08 0.07Laupahoehoe 20 54.4 141 3.2 84.4 23.5 25.3 32.5 44.7 146.9 1.6 1.3 1.54 0.99Kohala 150 28.8 123 3.1 46.0 13.0 22.0 13.8 63.2 140.7 1.4 1.4 1.27 0.85Pololu 400 19.0 72 2.7 45.3 7.5 21.4 20.4 63.7 150.9 1.3 1.2 2.87 1.57Kolekole 1400 20.2 86 2.9 27.4 8.5 11.0 10.3 52.8 115.6 1.7 1.6 0.76 0.55Kokee 4100 47.6 195 3.4 51.8 9.5 10.9 21.4 20.0 64.5 5.2 3.9 0.23 0.18
B horizons
Thurston 0.3 9.3 206 3.4 9.8 4.0 6.8 4.3 8.8 19.7 9.0 5.5 0.10 0.08Laupahoehoe 20 62.9 153 3.2 81.4 27.0 52.7 30.0 99.1 255.0 1.9 1.6 0.58 0.43Kohala 150 55.0 153 3.2 72.4 23.0 55.5 36.0 98.8 194.7 1.7 1.8 0.56 0.42Pololu 400 65.2 183 3.3 77.9 28.0 29.5 28.5 80.0 221.6 2.3 2.3 0.40 0.31Kolekole 1400 64.8 179 3.3 67.4 7.5 15.3 33.5 84.4 219.8 5.7 2.3 0.08 0.06Kokee 4100 70.9 145 3.2 72.7 3.5 7.9 39.4 141.7 265.6 7.2 1.3 0.06 0.05
a SSA corrected for OM content (see Section 2.5).b Micropore volume (<2 nm).c Mesopore volume.d Total pore volume.e Surface enrichment = C or N (XPS)/C or N (elemental analysis).f Assumptions: mOM = 2 � mOC, qOM = 1.4 or 1.7 g/cm3, VOM = mOM/qOM, Vmineral = VMOA � VOM, where VMOA = 1000 g/qMOA, qMOA data are listed in Table 1.
2042R
.M
iku
ttaet
al./G
eoch
imica
etC
osm
och
imica
Acta
73(2009)
2034–2060
Evolution of mineral–organic associations upon substrate aging 2043
over a broad range of grain sizes (Brantley and Mellott,2000). During 20 kyr of basalt weathering, SSA increased23-fold as a result of the neosynthesis of secondary mineralphases. Despite of its large OM content, significant mineralsurface area (SSAcorr = �84 m2/g) and micropore volume(24 mm3/g) of the 20-kyr A-MOA is still accessible to N2,confirming that, in the freeze-dried state, OM only incom-pletely coats the mineral surfaces (Arnarson and Keil,2001). After this initial SSA increase, the SSA of A-MOAsdropped during stage II (20–400 kyr) due to the sorption ofOM, which is reflected by declining CBET constants (Table2). In fact, the MOC concentrations correlated negativelywith the CBET constants (r2 = 0.58; p < 0.01; n = 12), con-firming that natural OM when sorbed to mineral surfaceslowers the enthalpy of N2 adsorption (Kaiser and Guggen-berger, 2003; Modl et al., 2007; Wagai et al., 2009). The lar-ger CBET constants and SSAcorr values of B-MOAs (Table2) reflect their smaller OM input and hence smaller OMcontents in comparison to the A-MOAs. Finally in weath-ering stage III (1400–4100 kyr), the SSA and the CBET con-stants of A-MOAs increased again because of theprevalence of minerals with smaller amounts of boundOM. Freeze-dried A-MOAs from stage-II sites containedsignificantly more volume in <200-nm pores than MOAsfrom endmember soils, indicating a particularly small poregeometry of associations between OM and PC mineralphases. In contrast to A-MOAs, in B horizons the SSA,CBET constants, and pore volume of MOAs show less var-iation (Table 2), but the overall pattern still reflects thecumulative effect of mineral alteration and OM sorption.
The large CBET constants of all MOAs (Table 2) provideevidence that significant mineral surface area is bare of OM(Wagai et al., 2009). More extensive OM coatings/sur-roundings as indicated by smaller CBET values (72, 86) ex-isted in A-MOAs of the 400-kyr and 1400-kyr site.Compared to other soils (Wagai et al., 2009), these CBET
constants were still high owing to the presence of uncov-ered, microporous minerals. In accordance with the largeCBET constants, also the atom% contribution of C to thebulk XP spectra of MOAs (hydrogen ignored) was <50%(14–49%; not shown) and also revealed that less C is asso-ciated with particle surfaces in B-MOAs compared toA-MOAs (Table EA1). Additionally, we adopted theempirical approach of Mayer (1999, 2005) which relatesthe difference in the net N2 adsorption enthalpy betweenbare and organically coated mineral surfaces [D(DHxs)] tothe OM fractional coverage according to D(DHxs) = DHbare
� DHcoated = 1.08 (fractional coverage)0.535, where DHbare
denotes the N2 adsorption enthalpy for the bare mineralsurfaces and DHcoated for the organically coated ones.Due to the dominating oxide-type mineral composition,2-line ferrihydrite served as energetic reference for a blankmineral surface (CBET = 239 and DHbare = RT ln CBET =3.5 KJ/mol). The assumption inherent to this approach isthat all mineral surfaces are energetically homogeneous,which strictly is not valid for natural microporous samples.However, when using this approach, one would end up withno more than 50% of the N2-accessible mineral surface areacoated by OM – in line with the high CBET constants andXPS data. The presence of significant inorganic surfaces,
despite of the large OM contents, also agrees well withthe high points of zero proton charge particular of stage-II soils (�6 in 1 mM LiCl electrolyte) (Chorover et al.,2004). In principle, mineral surfaces might remain bare ofOM either by being located in microsites inaccessible toOM, e.g., in small aggregates, by electrostatic shielding bypre-existing sorbed OM, or by being chemically unreactivetowards OM.
3.1.4. Importance of mineral microporosity
In soils, mineral micropores with diameters <2 nm canarise from crystal defects, the stacking edges of expandable2:1 clay minerals, dead-ends of pores at domain boundariesof Fe (hydr)oxides or from interparticle spaces of PC miner-als (Cabrera et al., 1981; Cornell and Schwertmann, 1996;Fischer et al., 1996; Aringhieri, 2004). The close proximityof pore walls render micropores favorable sorption sites forOM because of the high density of hydroxyl groups and theability of OM to sorb to mineral surfaces through multiplebonds (Kaiser and Guggenberger, 2003). The N2- and CO2-detectable micropore volumes of MOAs are displayed in Ta-ble 2. The CO2-accessible micropore volume exceeded theN2-derived micropore volume in all MOAs by a factor of1.1–2.9 (Table 2). This can be explained by the molecularsieving of N2 at 77 K, whereas CO2 at 273 K is capable of dif-fusing through the flexible organic network into mineralmicropores (Kwon and Pignatello, 2005; Mikutta and Mi-kutta, 2006; Kaiser et al., 2007; Mikutta et al., 2008). TheCO2-micropore volume of MOAs correlated positively withoxalate-extractable
P(Fe, Al, Si) concentrations (r2 = 0.96;
p < 0.001; n = 12) whereas MOC failed to predict the CO2-micropore volume (r2 = 0.14). Consequently, CO2 particu-larly probed micropores of PC mineral phases such as Feand Al (hydr)oxides and allophane rather than those ofOM. Similarly, Kaiser et al. (2007) showed that the CO2 sorp-tion at 273 K to goethite and ferrihydrite is largely indepen-dent from the amount of sorbed OC even at extremely highOC concentrations comparable to the maximal OC concen-trations in the MOAs studied (�300 mg OC/g). Also for syn-thetic coprecipitates, the reduction of the mineral microporevolume was much less intense for CO2 than for N2 if the OMcontent was increased (Mikutta et al., 2008). Therefore, thedifference between the N2- and CO2-micropore volumes inthe MOAs, particularly during weathering stage II, suggeststhat OM bound to PC minerals partly cloggs the microporeentrances (Mikutta and Mikutta, 2006). Hence, at the vicin-ity of micropores, OM is ‘sterically’ stabilized by multiplebonds to the mineral surface (Kaiser and Guggenberger,2007b), which would reduce OM desorption and thus biodeg-radation (Kaiser and Guggenberger, 2003, 2007b; Mikuttaet al., 2007). Consequently, the association of OM withmicroporous mineral phases particularly in stage II is anadditional factor that favors the accumulation and stabiliza-tion of OM in the LSAG soils.
3.1.5. Enrichment of organic matter at mineral surfaces and
volumetric ratios
Table EA1 compiles the XPS-based element composi-tion of MOA surfaces. Despite the low to moderate OMcoverages, the surfaces of MOAs appear enriched with

2044 R. Mikutta et al. / Geochimica et Cosmochimica Acta 73 (2009) 2034–2060
OM as evidenced by the large OC concentrations (88–372 mg OC/g MOA) and MN concentrations (2–23 mgMN/g MOA; Table EA1). The XPS-based surface MOCconcentrations are comparable with those observed for goe-thite reacted with dissolved OM in the sorption plateau re-gion (276 mg OC/g; Kaiser and Guggenberger, 2007b) andwith the maximum concentrations observed in differentsoils including Podzols, Andisols, Cambisols, and a Luvisol(Yuan et al., 1998; Gerin et al., 2003). The surface C and Nenrichment was calculated as the ratio between XPS-de-rived MOC and MN concentrations and those derived fromelemental analysis. Values >1 correspond to an enrichment,values <1 to a depletion of MOC and MN at particle sur-faces relative to the bulk concentration. Surface enrichmentvalues of MOC and MN ranged between 1.3–16.8 and 1.2–8.4, respectively (Table 2). MOC and MN were always en-riched at mineral surfaces with the strongest enrichment atthe youngest (stage I) and oldest site (stage III) (Table 2).The surface C and N enrichment in LSAG endmemberMOAs reflect a larger volume ratio of minerals to OM,or, in other words, that larger mineral grains are coatedwith OM. In contrast, in surface horizons of intermedi-ate-aged sites, the smaller surface C and N enrichment aswell as the larger volume contained in nanometer-sizedpores (Table 2) imply that MOAs consist of a homogeneousarray of PC minerals and OM. Volumetric ratios betweensorbed OM (VOM) and the mineral phase (Vmineral) werecalculated to illustrate the potential mode of OM accumu-lation. Here, we utilized the pycnometric q data of MOAs(Table 1) and assumed qOM to vary between 1.4 and1.7 g/cm3, thus giving also credit to the potentially higherdensity of sorbed OM (Kaiser and Guggenberger, 2007b).Table 2 depicts the VOM/Vmineral ratios, which range be-tween 0.05 and 2.87 depending on the qOM assumed. Inendmember A-MOAs (0.3 and 4100 kyr), volumetric ratioswere small (0.07–0.23) and consistent with the C surfaceenrichment data, thus favoring the ‘coating model’ of OM
Fig. 3. Plot of the volumetric ratio of sorbed OM (VOM) versus mineraland B horizons (B-MOA) of the long substrate age gradient. VolumemOM = 2 �mOC, qOM = 1.4 g/cm3, VOM = mOM/qOM, Vmineral = VMOA
values are given in Table 1.
on particle surfaces, i.e., Vmineral >> VOM. In contrast, inA-MOAs from intermediate-aged sites (stage II), VOM
was either close to or even larger than Vmineral (Table 2).The large volume fraction of sorbed OM means that adsorp-tion processes alone are insufficient to explain the OM accu-mulation in A-MOAs during weathering stage II. Morelikely, the data imply that between 20 and 400 kyr, wherethe pH was lowest and the CuCl2-exchangeable Al was larg-est (Table 1), the precipitation of OM and the subsequentaccretion of mineral particles or the precipitation of OM withmultivalent metals (Al, Fe) or hydroxides play a significantrole in the formation of MOAs (Chorover et al., 2004). Note-worthy, the VOM/Vmineral ratios of MOAs were larger at low-er soil pH (Fig. 3), possibly because charge neutralization byH+ or low-molecular Al or Fe species favors the precipitationof natural OM (Scheel et al., 2008). It is important to realizethat the OM in stage-II A-MOAs is effectively stabilized de-spite of seemingly less direct mineral–organic bondings in-volved. This may, in addition to the stabilization derivedfrom adsorption of OM to microporous PC minerals, also re-sult from the fact that OM in precipitated flocs (i) is more re-calcitrant due to its high aromatic C and low N content(Scheel et al., 2007) and (ii) is partly inaccessible for microor-ganisms due to the flocs’ small pore sizes and the high degreeof metal-C cross-linkings (Scheel et al., 2008). In the respec-tive B-MOAs, the volumetric ratios were generally smallerthan in A-MOAs, with Vmineral always clearly exceedingVOM, thus implying that adsorptive processes are more rele-vant in subsoil than in OM-rich surface soil horizons.
3.1.6. Transmission electron microscopy
The six A-MOA samples were imaged and analyzedby TEM and EDS to reveal potential differences inMOA structures across the LSAG. For each MOA sam-ple, a reasonable number of particles (10 < n < 15) of var-ious dimensions were analyzed in order to investigate arepresentative fraction of MOAs for each site. At the
matter (Vmineral) in mineral–organic associations from A (A-MOA)tric ratios were calculated based on the following assumptions:� VOM, where VMOA = 1000 g/qMOA. The corresponding qMOA
Evolution of mineral–organic associations upon substrate aging 2045
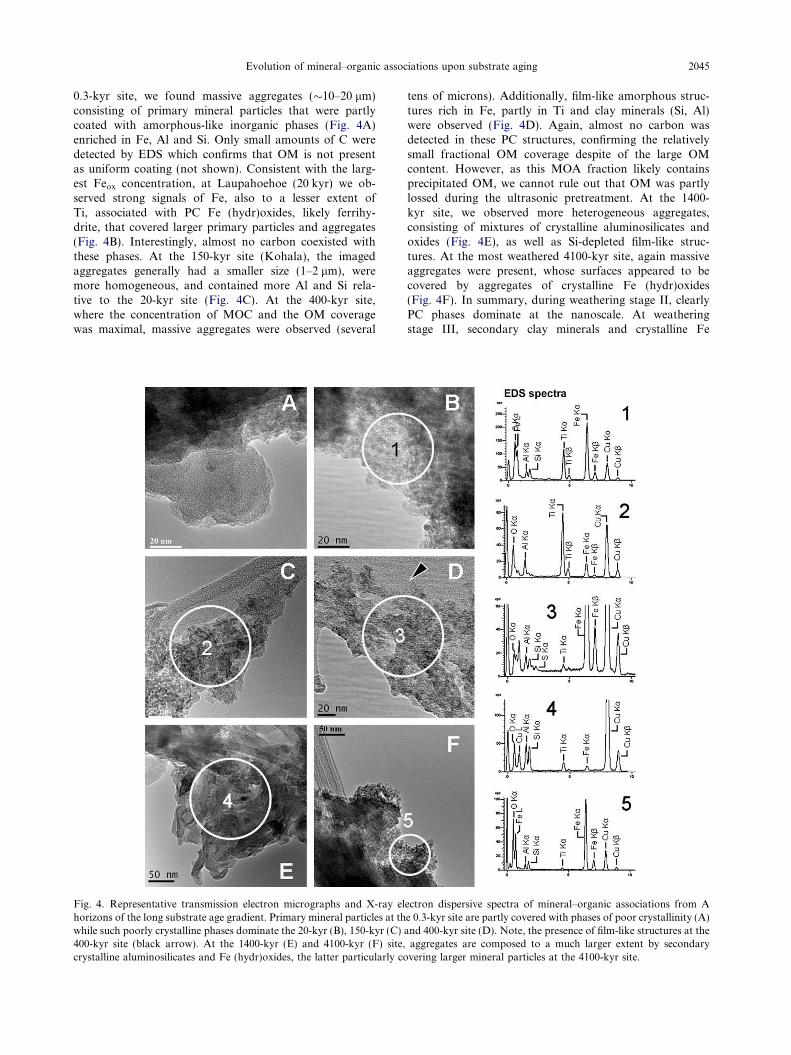
0.3-kyr site, we found massive aggregates (�10–20 lm)consisting of primary mineral particles that were partlycoated with amorphous-like inorganic phases (Fig. 4A)enriched in Fe, Al and Si. Only small amounts of C weredetected by EDS which confirms that OM is not presentas uniform coating (not shown). Consistent with the larg-est Feox concentration, at Laupahoehoe (20 kyr) we ob-served strong signals of Fe, also to a lesser extent ofTi, associated with PC Fe (hydr)oxides, likely ferrihy-drite, that covered larger primary particles and aggregates(Fig. 4B). Interestingly, almost no carbon coexisted withthese phases. At the 150-kyr site (Kohala), the imagedaggregates generally had a smaller size (1–2 lm), weremore homogeneous, and contained more Al and Si rela-tive to the 20-kyr site (Fig. 4C). At the 400-kyr site,where the concentration of MOC and the OM coveragewas maximal, massive aggregates were observed (several
Fig. 4. Representative transmission electron micrographs and X-ray elhorizons of the long substrate age gradient. Primary mineral particles at thwhile such poorly crystalline phases dominate the 20-kyr (B), 150-kyr (C)400-kyr site (black arrow). At the 1400-kyr (E) and 4100-kyr (F) site,crystalline aluminosilicates and Fe (hydr)oxides, the latter particularly co
tens of microns). Additionally, film-like amorphous struc-tures rich in Fe, partly in Ti and clay minerals (Si, Al)were observed (Fig. 4D). Again, almost no carbon wasdetected in these PC structures, confirming the relativelysmall fractional OM coverage despite of the large OMcontent. However, as this MOA fraction likely containsprecipitated OM, we cannot rule out that OM was partlylossed during the ultrasonic pretreatment. At the 1400-kyr site, we observed more heterogeneous aggregates,consisting of mixtures of crystalline aluminosilicates andoxides (Fig. 4E), as well as Si-depleted film-like struc-tures. At the most weathered 4100-kyr site, again massiveaggregates were present, whose surfaces appeared to becovered by aggregates of crystalline Fe (hydr)oxides(Fig. 4F). In summary, during weathering stage II, clearlyPC phases dominate at the nanoscale. At weatheringstage III, secondary clay minerals and crystalline Fe
ectron dispersive spectra of mineral–organic associations from Ae 0.3-kyr site are partly covered with phases of poor crystallinity (A)and 400-kyr site (D). Note, the presence of film-like structures at the
aggregates are composed to a much larger extent by secondaryvering larger mineral particles at the 4100-kyr site.
2046 R. Mikutta et al. / Geochimica et Cosmochimica Acta 73 (2009) 2034–2060
(hydr)oxides were abundant, the latter particularly cover-ing larger aggregates.
3.2. Time-dependent chemical alteration of sorbed organic
matter
3.2.1. X-ray photoelectron spectroscopy
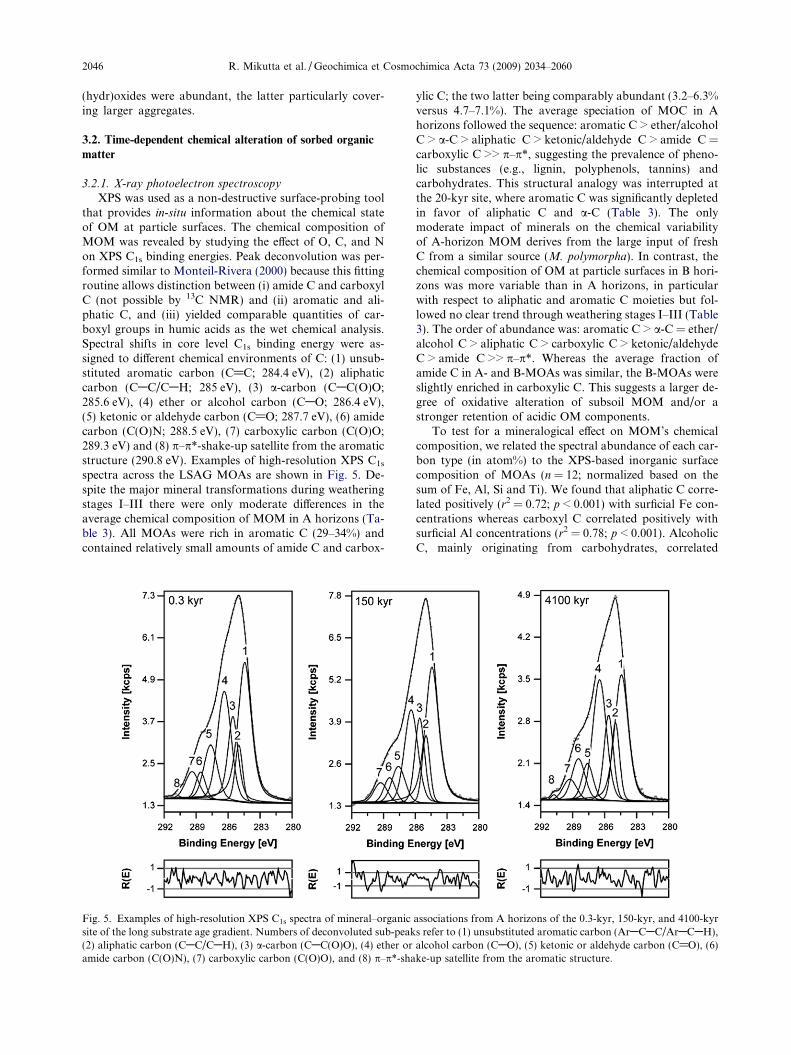
XPS was used as a non-destructive surface-probing toolthat provides in-situ information about the chemical stateof OM at particle surfaces. The chemical composition ofMOM was revealed by studying the effect of O, C, and Non XPS C1s binding energies. Peak deconvolution was per-formed similar to Monteil-Rivera (2000) because this fittingroutine allows distinction between (i) amide C and carboxylC (not possible by 13C NMR) and (ii) aromatic and ali-phatic C, and (iii) yielded comparable quantities of car-boxyl groups in humic acids as the wet chemical analysis.Spectral shifts in core level C1s binding energy were as-signed to different chemical environments of C: (1) unsub-stituted aromatic carbon (C@C; 284.4 eV), (2) aliphaticcarbon (CAC/CAH; 285 eV), (3) a-carbon (CAC(O)O;285.6 eV), (4) ether or alcohol carbon (CAO; 286.4 eV),(5) ketonic or aldehyde carbon (C@O; 287.7 eV), (6) amidecarbon (C(O)N; 288.5 eV), (7) carboxylic carbon (C(O)O;289.3 eV) and (8) p–p*-shake-up satellite from the aromaticstructure (290.8 eV). Examples of high-resolution XPS C1s
spectra across the LSAG MOAs are shown in Fig. 5. De-spite the major mineral transformations during weatheringstages I–III there were only moderate differences in theaverage chemical composition of MOM in A horizons (Ta-ble 3). All MOAs were rich in aromatic C (29–34%) andcontained relatively small amounts of amide C and carbox-
Fig. 5. Examples of high-resolution XPS C1s spectra of mineral–organicsite of the long substrate age gradient. Numbers of deconvoluted sub-peak(2) aliphatic carbon (CAC/CAH), (3) a-carbon (CAC(O)O), (4) ether oramide carbon (C(O)N), (7) carboxylic carbon (C(O)O), and (8) p–p*-sha
ylic C; the two latter being comparably abundant (3.2–6.3%versus 4.7–7.1%). The average speciation of MOC in Ahorizons followed the sequence: aromatic C > ether/alcoholC > a-C > aliphatic C > ketonic/aldehyde C > amide C =carboxylic C >> p–p*, suggesting the prevalence of pheno-lic substances (e.g., lignin, polyphenols, tannins) andcarbohydrates. This structural analogy was interrupted atthe 20-kyr site, where aromatic C was significantly depletedin favor of aliphatic C and a-C (Table 3). The onlymoderate impact of minerals on the chemical variabilityof A-horizon MOM derives from the large input of freshC from a similar source (M. polymorpha). In contrast, thechemical composition of OM at particle surfaces in B hori-zons was more variable than in A horizons, in particularwith respect to aliphatic and aromatic C moieties but fol-lowed no clear trend through weathering stages I–III (Table3). The order of abundance was: aromatic C > a-C = ether/alcohol C > aliphatic C > carboxylic C > ketonic/aldehydeC > amide C >> p–p*. Whereas the average fraction ofamide C in A- and B-MOAs was similar, the B-MOAs wereslightly enriched in carboxylic C. This suggests a larger de-gree of oxidative alteration of subsoil MOM and/or astronger retention of acidic OM components.
To test for a mineralogical effect on MOM’s chemicalcomposition, we related the spectral abundance of each car-bon type (in atom%) to the XPS-based inorganic surfacecomposition of MOAs (n = 12; normalized based on thesum of Fe, Al, Si and Ti). We found that aliphatic C corre-lated positively (r2 = 0.72; p < 0.001) with surficial Fe con-centrations whereas carboxyl C correlated positively withsurficial Al concentrations (r2 = 0.78; p < 0.001). AlcoholicC, mainly originating from carbohydrates, correlated
associations from A horizons of the 0.3-kyr, 150-kyr, and 4100-kyrs refer to (1) unsubstituted aromatic carbon (ArACAC/ArACAH),alcohol carbon (CAO), (5) ketonic or aldehyde carbon (C@O), (6)ke-up satellite from the aromatic structure.
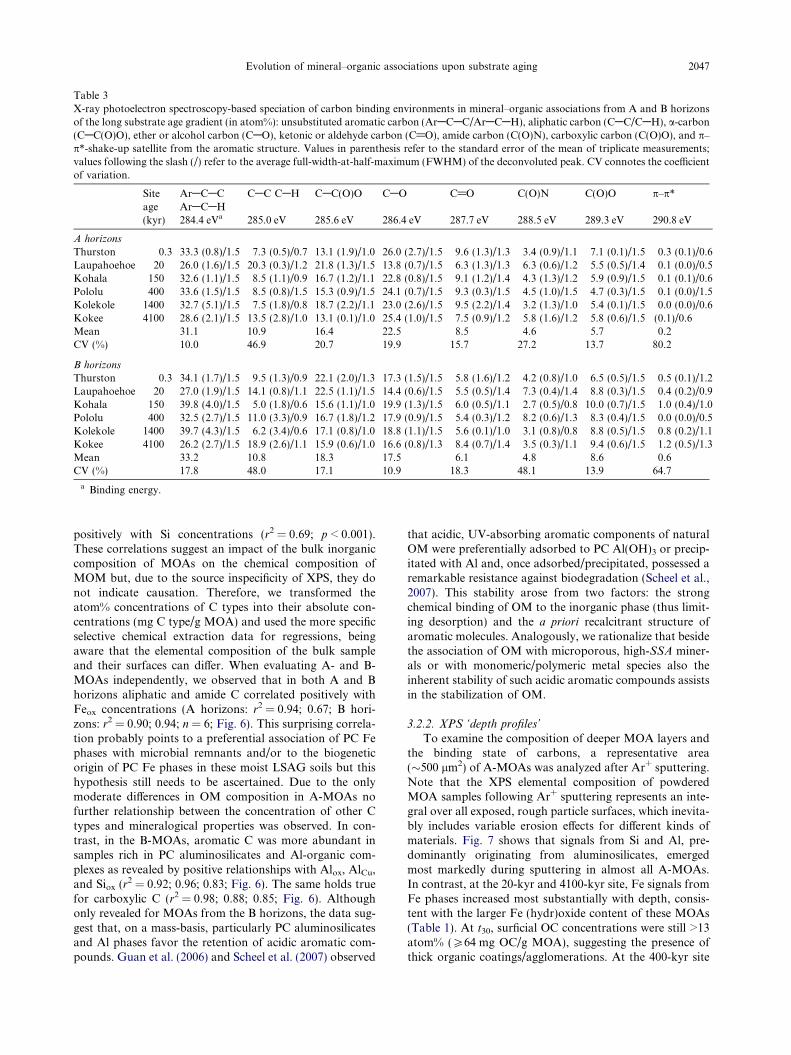
Table 3X-ray photoelectron spectroscopy-based speciation of carbon binding environments in mineral–organic associations from A and B horizonsof the long substrate age gradient (in atom%): unsubstituted aromatic carbon (ArACAC/ArACAH), aliphatic carbon (CAC/CAH), a-carbon(CAC(O)O), ether or alcohol carbon (CAO), ketonic or aldehyde carbon (C@O), amide carbon (C(O)N), carboxylic carbon (C(O)O), and p–p*-shake-up satellite from the aromatic structure. Values in parenthesis refer to the standard error of the mean of triplicate measurements;values following the slash (/) refer to the average full-width-at-half-maximum (FWHM) of the deconvoluted peak. CV connotes the coefficientof variation.
Siteage
ArACACArACAH
CAC CAH CAC(O)O CAO C@O C(O)N C(O)O p–p*
(kyr) 284.4 eVa 285.0 eV 285.6 eV 286.4 eV 287.7 eV 288.5 eV 289.3 eV 290.8 eV
A horizons
Thurston 0.3 33.3 (0.8)/1.5 7.3 (0.5)/0.7 13.1 (1.9)/1.0 26.0 (2.7)/1.5 9.6 (1.3)/1.3 3.4 (0.9)/1.1 7.1 (0.1)/1.5 0.3 (0.1)/0.6Laupahoehoe 20 26.0 (1.6)/1.5 20.3 (0.3)/1.2 21.8 (1.3)/1.5 13.8 (0.7)/1.5 6.3 (1.3)/1.3 6.3 (0.6)/1.2 5.5 (0.5)/1.4 0.1 (0.0)/0.5Kohala 150 32.6 (1.1)/1.5 8.5 (1.1)/0.9 16.7 (1.2)/1.1 22.8 (0.8)/1.5 9.1 (1.2)/1.4 4.3 (1.3)/1.2 5.9 (0.9)/1.5 0.1 (0.1)/0.6Pololu 400 33.6 (1.5)/1.5 8.5 (0.8)/1.5 15.3 (0.9)/1.5 24.1 (0.7)/1.5 9.3 (0.3)/1.5 4.5 (1.0)/1.5 4.7 (0.3)/1.5 0.1 (0.0)/1.5Kolekole 1400 32.7 (5.1)/1.5 7.5 (1.8)/0.8 18.7 (2.2)/1.1 23.0 (2.6)/1.5 9.5 (2.2)/1.4 3.2 (1.3)/1.0 5.4 (0.1)/1.5 0.0 (0.0)/0.6Kokee 4100 28.6 (2.1)/1.5 13.5 (2.8)/1.0 13.1 (0.1)/1.0 25.4 (1.0)/1.5 7.5 (0.9)/1.2 5.8 (1.6)/1.2 5.8 (0.6)/1.5 (0.1)/0.6Mean 31.1 10.9 16.4 22.5 8.5 4.6 5.7 0.2CV (%) 10.0 46.9 20.7 19.9 15.7 27.2 13.7 80.2
B horizons
Thurston 0.3 34.1 (1.7)/1.5 9.5 (1.3)/0.9 22.1 (2.0)/1.3 17.3 (1.5)/1.5 5.8 (1.6)/1.2 4.2 (0.8)/1.0 6.5 (0.5)/1.5 0.5 (0.1)/1.2Laupahoehoe 20 27.0 (1.9)/1.5 14.1 (0.8)/1.1 22.5 (1.1)/1.5 14.4 (0.6)/1.5 5.5 (0.5)/1.4 7.3 (0.4)/1.4 8.8 (0.3)/1.5 0.4 (0.2)/0.9Kohala 150 39.8 (4.0)/1.5 5.0 (1.8)/0.6 15.6 (1.1)/1.0 19.9 (1.3)/1.5 6.0 (0.5)/1.1 2.7 (0.5)/0.8 10.0 (0.7)/1.5 1.0 (0.4)/1.0Pololu 400 32.5 (2.7)/1.5 11.0 (3.3)/0.9 16.7 (1.8)/1.2 17.9 (0.9)/1.5 5.4 (0.3)/1.2 8.2 (0.6)/1.3 8.3 (0.4)/1.5 0.0 (0.0)/0.5Kolekole 1400 39.7 (4.3)/1.5 6.2 (3.4)/0.6 17.1 (0.8)/1.0 18.8 (1.1)/1.5 5.6 (0.1)/1.0 3.1 (0.8)/0.8 8.8 (0.5)/1.5 0.8 (0.2)/1.1Kokee 4100 26.2 (2.7)/1.5 18.9 (2.6)/1.1 15.9 (0.6)/1.0 16.6 (0.8)/1.3 8.4 (0.7)/1.4 3.5 (0.3)/1.1 9.4 (0.6)/1.5 1.2 (0.5)/1.3Mean 33.2 10.8 18.3 17.5 6.1 4.8 8.6 0.6CV (%) 17.8 48.0 17.1 10.9 18.3 48.1 13.9 64.7
a Binding energy.
Evolution of mineral–organic associations upon substrate aging 2047
positively with Si concentrations (r2 = 0.69; p < 0.001).These correlations suggest an impact of the bulk inorganiccomposition of MOAs on the chemical composition ofMOM but, due to the source inspecificity of XPS, they donot indicate causation. Therefore, we transformed theatom% concentrations of C types into their absolute con-centrations (mg C type/g MOA) and used the more specificselective chemical extraction data for regressions, beingaware that the elemental composition of the bulk sampleand their surfaces can differ. When evaluating A- and B-MOAs independently, we observed that in both A and Bhorizons aliphatic and amide C correlated positively withFeox concentrations (A horizons: r2 = 0.94; 0.67; B hori-zons: r2 = 0.90; 0.94; n = 6; Fig. 6). This surprising correla-tion probably points to a preferential association of PC Fephases with microbial remnants and/or to the biogeneticorigin of PC Fe phases in these moist LSAG soils but thishypothesis still needs to be ascertained. Due to the onlymoderate differences in OM composition in A-MOAs nofurther relationship between the concentration of other Ctypes and mineralogical properties was observed. In con-trast, in the B-MOAs, aromatic C was more abundant insamples rich in PC aluminosilicates and Al-organic com-plexes as revealed by positive relationships with Alox, AlCu,and Siox (r2 = 0.92; 0.96; 0.83; Fig. 6). The same holds truefor carboxylic C (r2 = 0.98; 0.88; 0.85; Fig. 6). Althoughonly revealed for MOAs from the B horizons, the data sug-gest that, on a mass-basis, particularly PC aluminosilicatesand Al phases favor the retention of acidic aromatic com-pounds. Guan et al. (2006) and Scheel et al. (2007) observed
that acidic, UV-absorbing aromatic components of naturalOM were preferentially adsorbed to PC Al(OH)3 or precip-itated with Al and, once adsorbed/precipitated, possessed aremarkable resistance against biodegradation (Scheel et al.,2007). This stability arose from two factors: the strongchemical binding of OM to the inorganic phase (thus limit-ing desorption) and the a priori recalcitrant structure ofaromatic molecules. Analogously, we rationalize that besidethe association of OM with microporous, high-SSA miner-als or with monomeric/polymeric metal species also theinherent stability of such acidic aromatic compounds assistsin the stabilization of OM.
3.2.2. XPS ‘depth profiles’
To examine the composition of deeper MOA layers andthe binding state of carbons, a representative area(�500 lm2) of A-MOAs was analyzed after Ar+ sputtering.Note that the XPS elemental composition of powderedMOA samples following Ar+ sputtering represents an inte-gral over all exposed, rough particle surfaces, which inevita-bly includes variable erosion effects for different kinds ofmaterials. Fig. 7 shows that signals from Si and Al, pre-dominantly originating from aluminosilicates, emergedmost markedly during sputtering in almost all A-MOAs.In contrast, at the 20-kyr and 4100-kyr site, Fe signals fromFe phases increased most substantially with depth, consis-tent with the larger Fe (hydr)oxide content of these MOAs(Table 1). At t30, surficial OC concentrations were still >13atom% (P64 mg OC/g MOA), suggesting the presence ofthick organic coatings/agglomerations. At the 400-kyr site
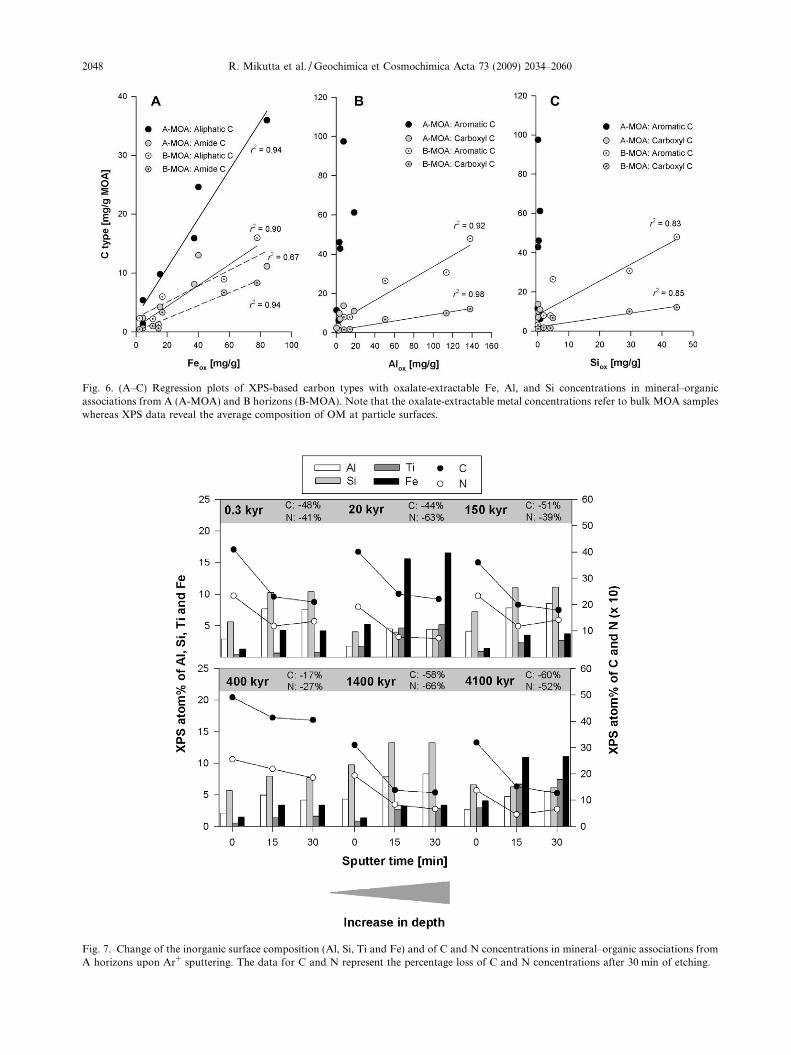
Fig. 6. (A–C) Regression plots of XPS-based carbon types with oxalate-extractable Fe, Al, and Si concentrations in mineral–organicassociations from A (A-MOA) and B horizons (B-MOA). Note that the oxalate-extractable metal concentrations refer to bulk MOA sampleswhereas XPS data reveal the average composition of OM at particle surfaces.
Fig. 7. Change of the inorganic surface composition (Al, Si, Ti and Fe) and of C and N concentrations in mineral–organic associations fromA horizons upon Ar+ sputtering. The data for C and N represent the percentage loss of C and N concentrations after 30 min of etching.
2048 R. Mikutta et al. / Geochimica et Cosmochimica Acta 73 (2009) 2034–2060
Evolution of mineral–organic associations upon substrate aging 2049
where the MOC concentration and the volumetric OM–mineral ratio were largest, the XPS C1s signal decline wasmuch less intense, again revealing that MOM exists in aparticularly homogeneous mineral–organic microfabric. Incontrast, at the two oldest sites (stage III), thinner organiccoatings/agglomerations are indicated by a more pro-nounced decline of the C concentration (Fig. 7).
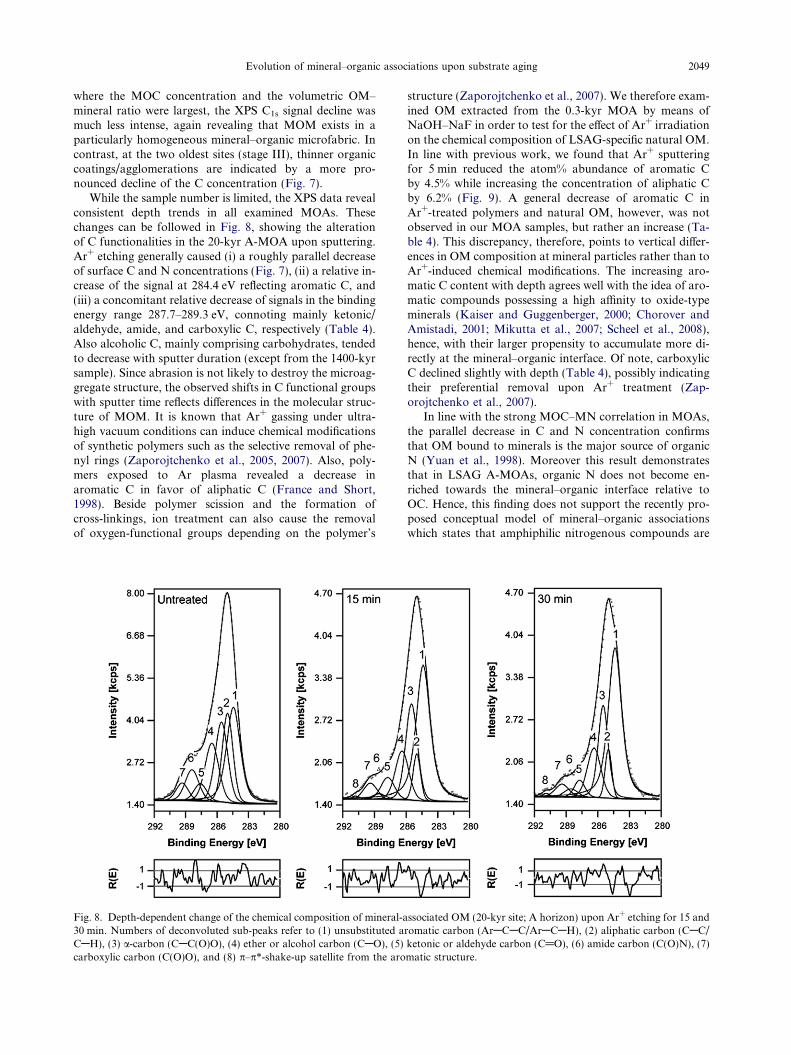
While the sample number is limited, the XPS data revealconsistent depth trends in all examined MOAs. Thesechanges can be followed in Fig. 8, showing the alterationof C functionalities in the 20-kyr A-MOA upon sputtering.Ar+ etching generally caused (i) a roughly parallel decreaseof surface C and N concentrations (Fig. 7), (ii) a relative in-crease of the signal at 284.4 eV reflecting aromatic C, and(iii) a concomitant relative decrease of signals in the bindingenergy range 287.7–289.3 eV, connoting mainly ketonic/aldehyde, amide, and carboxylic C, respectively (Table 4).Also alcoholic C, mainly comprising carbohydrates, tendedto decrease with sputter duration (except from the 1400-kyrsample). Since abrasion is not likely to destroy the microag-gregate structure, the observed shifts in C functional groupswith sputter time reflects differences in the molecular struc-ture of MOM. It is known that Ar+ gassing under ultra-high vacuum conditions can induce chemical modificationsof synthetic polymers such as the selective removal of phe-nyl rings (Zaporojtchenko et al., 2005, 2007). Also, poly-mers exposed to Ar plasma revealed a decrease inaromatic C in favor of aliphatic C (France and Short,1998). Beside polymer scission and the formation ofcross-linkings, ion treatment can also cause the removalof oxygen-functional groups depending on the polymer’s
Fig. 8. Depth-dependent change of the chemical composition of mineral-a30 min. Numbers of deconvoluted sub-peaks refer to (1) unsubstituted aCAH), (3) a-carbon (CAC(O)O), (4) ether or alcohol carbon (CAO), (5)carboxylic carbon (C(O)O), and (8) p–p*-shake-up satellite from the aro
structure (Zaporojtchenko et al., 2007). We therefore exam-ined OM extracted from the 0.3-kyr MOA by means ofNaOH–NaF in order to test for the effect of Ar+ irradiationon the chemical composition of LSAG-specific natural OM.In line with previous work, we found that Ar+ sputteringfor 5 min reduced the atom% abundance of aromatic Cby 4.5% while increasing the concentration of aliphatic Cby 6.2% (Fig. 9). A general decrease of aromatic C inAr+-treated polymers and natural OM, however, was notobserved in our MOA samples, but rather an increase (Ta-ble 4). This discrepancy, therefore, points to vertical differ-ences in OM composition at mineral particles rather than toAr+-induced chemical modifications. The increasing aro-matic C content with depth agrees well with the idea of aro-matic compounds possessing a high affinity to oxide-typeminerals (Kaiser and Guggenberger, 2000; Chorover andAmistadi, 2001; Mikutta et al., 2007; Scheel et al., 2008),hence, with their larger propensity to accumulate more di-rectly at the mineral–organic interface. Of note, carboxylicC declined slightly with depth (Table 4), possibly indicatingtheir preferential removal upon Ar+ treatment (Zap-orojtchenko et al., 2007).
In line with the strong MOC–MN correlation in MOAs,the parallel decrease in C and N concentration confirmsthat OM bound to minerals is the major source of organicN (Yuan et al., 1998). Moreover this result demonstratesthat in LSAG A-MOAs, organic N does not become en-riched towards the mineral–organic interface relative toOC. Hence, this finding does not support the recently pro-posed conceptual model of mineral–organic associationswhich states that amphiphilic nitrogenous compounds are
ssociated OM (20-kyr site; A horizon) upon Ar+ etching for 15 andromatic carbon (ArACAC/ArACAH), (2) aliphatic carbon (CAC/ketonic or aldehyde carbon (C@O), (6) amide carbon (C(O)N), (7)matic structure.
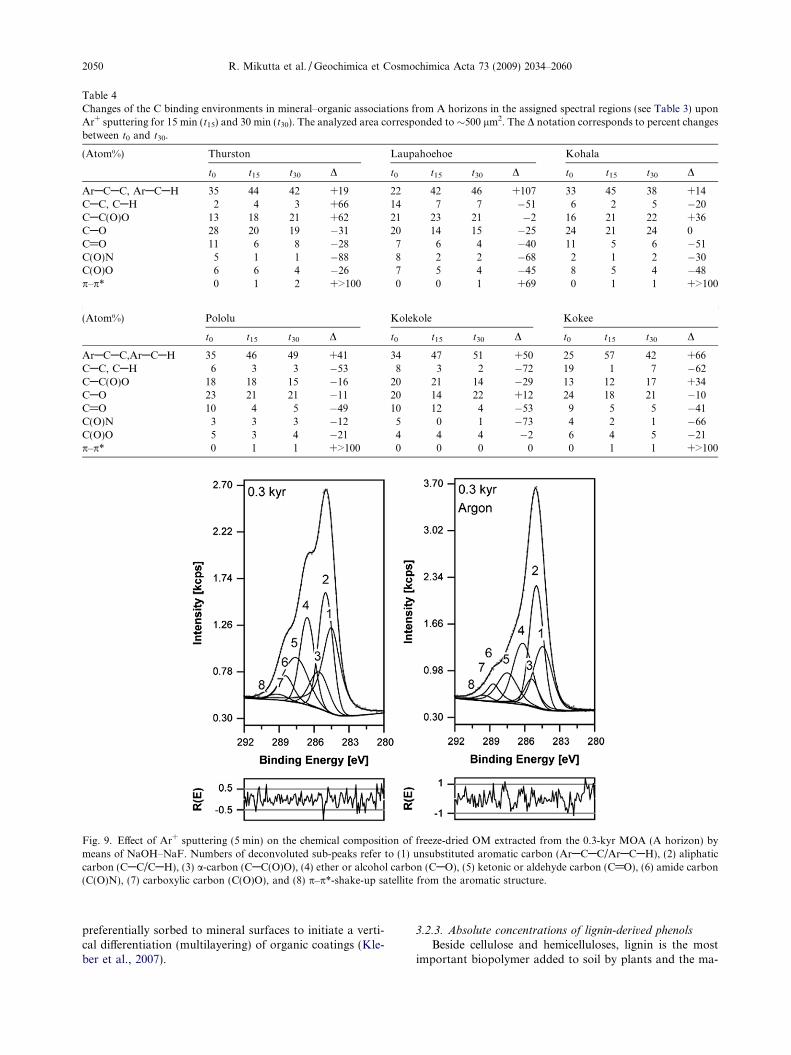
Table 4Changes of the C binding environments in mineral–organic associations from A horizons in the assigned spectral regions (see Table 3) uponAr+ sputtering for 15 min (t15) and 30 min (t30). The analyzed area corresponded to �500 lm2. The D notation corresponds to percent changesbetween t0 and t30.
(Atom%) Thurston Laupahoehoe Kohala
t0 t15 t30 D t0 t15 t30 D t0 t15 t30 D
ArACAC, ArACAH 35 44 42 +19 22 42 46 +107 33 45 38 +14CAC, CAH 2 4 3 +66 14 7 7 �51 6 2 5 �20CAC(O)O 13 18 21 +62 21 23 21 �2 16 21 22 +36CAO 28 20 19 �31 20 14 15 �25 24 21 24 0C@O 11 6 8 �28 7 6 4 �40 11 5 6 �51C(O)N 5 1 1 �88 8 2 2 �68 2 1 2 �30C(O)O 6 6 4 �26 7 5 4 �45 8 5 4 �48p–p* 0 1 2 +>100 0 0 1 +69 0 1 1 +>100
(Atom%) Pololu Kolekole Kokee
t0 t15 t30 D t0 t15 t30 D t0 t15 t30 D
ArACAC,ArACAH 35 46 49 +41 34 47 51 +50 25 57 42 +66CAC, CAH 6 3 3 �53 8 3 2 �72 19 1 7 �62CAC(O)O 18 18 15 �16 20 21 14 �29 13 12 17 +34CAO 23 21 21 �11 20 14 22 +12 24 18 21 �10C@O 10 4 5 �49 10 12 4 �53 9 5 5 �41C(O)N 3 3 3 �12 5 0 1 �73 4 2 1 �66C(O)O 5 3 4 �21 4 4 4 �2 6 4 5 �21p–p* 0 1 1 +>100 0 0 0 0 0 1 1 +>100
Fig. 9. Effect of Ar+ sputtering (5 min) on the chemical composition of freeze-dried OM extracted from the 0.3-kyr MOA (A horizon) bymeans of NaOH–NaF. Numbers of deconvoluted sub-peaks refer to (1) unsubstituted aromatic carbon (ArACAC/ArACAH), (2) aliphaticcarbon (CAC/CAH), (3) a-carbon (CAC(O)O), (4) ether or alcohol carbon (CAO), (5) ketonic or aldehyde carbon (C@O), (6) amide carbon(C(O)N), (7) carboxylic carbon (C(O)O), and (8) p–p*-shake-up satellite from the aromatic structure.
2050 R. Mikutta et al. / Geochimica et Cosmochimica Acta 73 (2009) 2034–2060
preferentially sorbed to mineral surfaces to initiate a verti-cal differentiation (multilayering) of organic coatings (Kle-ber et al., 2007).
3.2.3. Absolute concentrations of lignin-derived phenols
Beside cellulose and hemicelluloses, lignin is the mostimportant biopolymer added to soil by plants and the ma-
Evolution of mineral–organic associations upon substrate aging 2051
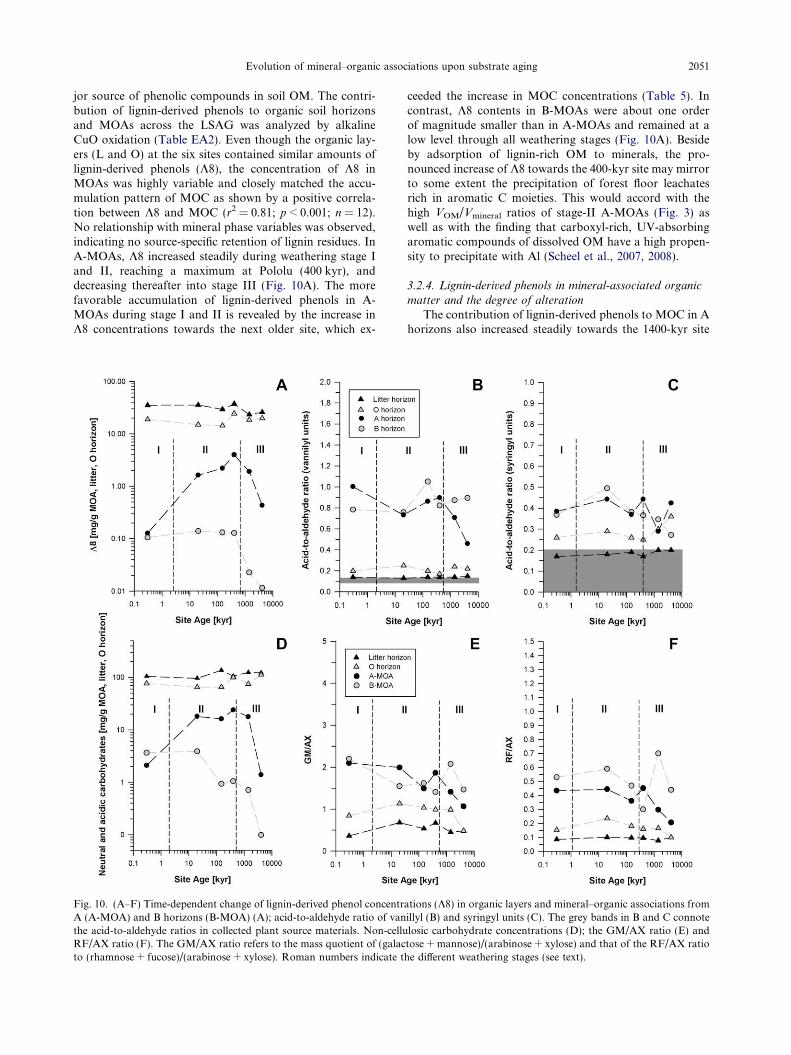
jor source of phenolic compounds in soil OM. The contri-bution of lignin-derived phenols to organic soil horizonsand MOAs across the LSAG was analyzed by alkalineCuO oxidation (Table EA2). Even though the organic lay-ers (L and O) at the six sites contained similar amounts oflignin-derived phenols (K8), the concentration of K8 inMOAs was highly variable and closely matched the accu-mulation pattern of MOC as shown by a positive correla-tion between K8 and MOC (r2 = 0.81; p < 0.001; n = 12).No relationship with mineral phase variables was observed,indicating no source-specific retention of lignin residues. InA-MOAs, K8 increased steadily during weathering stage Iand II, reaching a maximum at Pololu (400 kyr), anddecreasing thereafter into stage III (Fig. 10A). The morefavorable accumulation of lignin-derived phenols in A-MOAs during stage I and II is revealed by the increase inK8 concentrations towards the next older site, which ex-
Fig. 10. (A–F) Time-dependent change of lignin-derived phenol concentrA (A-MOA) and B horizons (B-MOA) (A); acid-to-aldehyde ratio of vanthe acid-to-aldehyde ratios in collected plant source materials. Non-celluRF/AX ratio (F). The GM/AX ratio refers to the mass quotient of (galacto (rhamnose + fucose)/(arabinose + xylose). Roman numbers indicate t
ceeded the increase in MOC concentrations (Table 5). Incontrast, K8 contents in B-MOAs were about one orderof magnitude smaller than in A-MOAs and remained at alow level through all weathering stages (Fig. 10A). Besideby adsorption of lignin-rich OM to minerals, the pro-nounced increase of K8 towards the 400-kyr site may mirrorto some extent the precipitation of forest floor leachatesrich in aromatic C moieties. This would accord with thehigh VOM/Vmineral ratios of stage-II A-MOAs (Fig. 3) aswell as with the finding that carboxyl-rich, UV-absorbingaromatic compounds of dissolved OM have a high propen-sity to precipitate with Al (Scheel et al., 2007, 2008).
3.2.4. Lignin-derived phenols in mineral-associated organic
matter and the degree of alteration
The contribution of lignin-derived phenols to MOC in Ahorizons also increased steadily towards the 1400-kyr site
ations (K8) in organic layers and mineral–organic associations fromillyl (B) and syringyl units (C). The grey bands in B and C connotelosic carbohydrate concentrations (D); the GM/AX ratio (E) andtose + mannose)/(arabinose + xylose) and that of the RF/AX ratiohe different weathering stages (see text).
Table 5Factorial change of organic carbon (MOC), lignin phenols (K8),and non-cellulosic carbohydrate concentrations (on mass-basis) inmineral–organic associations towards the next older site.
MOC Lignin phenols (K8) Carbohydrates
A horizons
0.3 ? 20 kyr 9.5 12.8 8.620 ? 150 kyr 1.1 1.4 0.9150 ? 400 kyr 1.5 1.8 1.5400 ? 1400 kyr 0.5 0.5 0.71400 ? 4100 kyr 0.3 0.2 0.1
B horizons
0.3 ? 20 kyr 4.9 1.3 1.120 ? 150 kyr 1.1 0.9 0.2150 ? 400 kyr 0.7 1.0 1.1400 ? 1400 kyr 0.2 0.2 0.71400 ? 4100 kyr 0.6 0.5 0.1
2052 R. Mikutta et al. / Geochimica et Cosmochimica Acta 73 (2009) 2034–2060
and then dropped off at the oldest site (Fig. 11A). Thismeans that during weathering stage I and II not only didthe total concentration of lignin-derived phenols increaseover time but also the relative contribution of lignin-derivedphenols to MOM increased. This finding corroborates thatin weathering stage II (20–400 kyr) lignin-derived phenolsare preferentially stabilized in associations with PC miner-als or monomeric/polymeric metal species. The minor con-tribution of lignin phenols to total MOC in A-MOAs at the0.3-kyr site can be explained by the larger abundance oflow-SSA primary minerals (olivine, pyroxene and feldspar),which do not favor the selective retention of lignin-derivedphenols in comparison to other OM components like car-bohydrates (see Section 3.2.7). Except from the 0.3-kyr site,the MOC-normalized K8 yields of B-MOAs were 87–92%smaller than in A-MOAs, comprising only between 0.9and 1.6 mg/g of MOC (Table EA2). We do not think thatthe smaller subsoil K8 yields are caused by a less efficientextractability in NaOH, because subsoil MOC was gener-ally more extractable under alkaline conditions (Table 1).Given the large XPS-based concentration of aromatic Cin A- and B-MOAs (�30%) and the small amounts ofCuO-digestible lignin monomers particularly in B-MOAs,this implies either (i) an underestimation of lignin phenolsdue to the CuO technique, (ii) major lignin transformations(thus escaping the analytical window), or (iii) the presenceof other, non-lignin-derived phenolic compounds. Theoccurrence of non-lignin-derived phenols appears realisticsince, besides coming from lignin, soluble polyphenols(92 ± 3 mg/g) and tannin (65 ± 4 mg/g) are major aromaticcomponents of Metrosideros litter (Rothstein et al., 2004).
Fig. 12A plots the S/V versus C/V ratios of lignin insource leaf materials, organic layers, and MOAs. The litterlayer reflects the predominant angiosperm (M. polymorpha)origin (S/V 0.7–1.1), which becomes progressively altered inthe O layers as shown by decreasing S/V and increasingacid-to-aldehyde ratios of vanillyl (ac/al)V and syringyl(ac/al)S units (Fig. 10B and C; Table EA2). This trend re-sults from the preferential removal of syringyl moieties(Miltner and Zech, 1998; Moller et al., 2002; Otto andSimpson, 2006). Compared with the organic layers, ligninphenols in A- and B-MOAs exhibit a much higher degree
of side chain oxidation as evidenced by markedly increased(ac/al)V and (ac/al)S ratios (Fig. 10B and C). In addition tomicrobial alteration, the high acid-to-aldehyde ratios inMOAs can derive from the selective retention of acidic lig-nin compounds by charged mineral surfaces (Grunewaldet al., 2006; Hernes et al., 2007) or from the preferential pre-cipitation of acidic aromatic substances (Scheel et al., 2007,2008). The latter aspects can explain the larger absolute lig-nin-derived phenol concentrations as well as the larger con-tribution of lignin phenols to MOM during weatheringstage II. However, the generally high degree of lignin sidechain oxidation persisting through time suggests that inparticular acidic lignin components are stabilized by inter-action with soil minerals and hydrolyzable metals. Hence,the long-term mineralogical shift primarily affects the abso-lute concentration of mineral-associated lignin phenolsrather than their ‘diagenetic’ state.
3.2.5. Contribution of hydroxybenzenecarboxylic acids
Beside the lignin phenol monomers, a suite of hydroxy-benzenecarboxylic acids (BA) was detected as CuO oxida-tion products (Table EA2; Fig. 11A and B). Thesecompounds comprise between 23–39% and 50–255% ofMOC-normalized K8 in A- and B-MOAs, respectively.However, the origin of most of these compounds in soilsis not specific. Dihydroxybenzoic acid (3,5di-H BA) mayderive from polyhydroxyaromatic tannins or other flavo-noids (Goni and Hedges, 1995; Louchouarn et al., 1999;Dickens et al., 2007) but is also considered as a degradationproduct of lignin (Prahl et al., 1994). All detected BAs werealready liberated from source vegetation leaves and arepresent in both A- and B-MOAs (Table EA2). The BAs ex-tracted from live leaf tissues of M. polymorpha upon CuOoxidation likely originate from its polyphenol/tannin com-ponents (Hattenschwiler et al., 2003). The BA/K8 ratio,including 3,5di-H BA, increased exponentially from sourcevegetation leaves, O and L layers to the MOAs from A andB horizons (Fig. 12B). The facts that BAs (i) are releasedfrom source vegetation leaves, organic soil layers, andMOAs and (ii) become progressively enriched in MOAs rel-ative to lignin-derived phenols suggests a high stability and/or a strong retention of respective source compounds (likelypolyphenols/tannins). However, we cannot exclude thatsome BAs are lignin degradation products.
3.2.6. Absolute concentrations of non-cellulosic
carbohydrates
Table EA3 provides the MOA- and OC-based concentra-tions of hydrolyzable neutral and acidic (glucuronic acid,galacturonic acid) monosaccharides across the LSAG. Ona mol%-basis, glucose, mannose, and galactose were thedominant hexoses across the LSAG, accounting on averagefor 62 ± 2% and 59 ± 2% of the total carbohydrate pool inA- and B-MOAs, respectively (not shown). Plant-derivedpentoses (xylose and arabinose) were less abundant, com-prising on average only �25 mol% in both top- and subsoilMOAs. Uronic acid concentrations were generally<5 mol% (2.7 ± 0.3 mol%; mean ± standard error; n = 12).As with lignin phenol monomers, the concentration of neu-tral and acidic carbohydrates paralleled the MOC accumula-
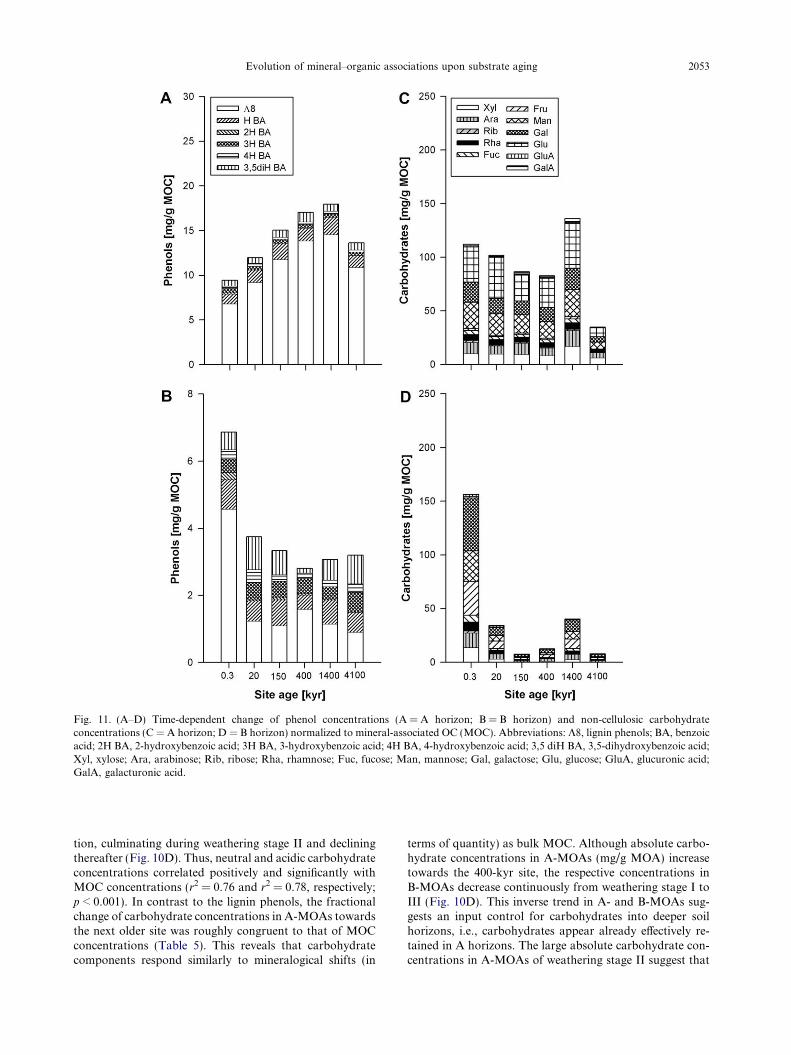
Fig. 11. (A–D) Time-dependent change of phenol concentrations (A = A horizon; B = B horizon) and non-cellulosic carbohydrateconcentrations (C = A horizon; D = B horizon) normalized to mineral-associated OC (MOC). Abbreviations: K8, lignin phenols; BA, benzoicacid; 2H BA, 2-hydroxybenzoic acid; 3H BA, 3-hydroxybenzoic acid; 4H BA, 4-hydroxybenzoic acid; 3,5 diH BA, 3,5-dihydroxybenzoic acid;Xyl, xylose; Ara, arabinose; Rib, ribose; Rha, rhamnose; Fuc, fucose; Man, mannose; Gal, galactose; Glu, glucose; GluA, glucuronic acid;GalA, galacturonic acid.
Evolution of mineral–organic associations upon substrate aging 2053
tion, culminating during weathering stage II and decliningthereafter (Fig. 10D). Thus, neutral and acidic carbohydrateconcentrations correlated positively and significantly withMOC concentrations (r2 = 0.76 and r2 = 0.78, respectively;p < 0.001). In contrast to the lignin phenols, the fractionalchange of carbohydrate concentrations in A-MOAs towardsthe next older site was roughly congruent to that of MOCconcentrations (Table 5). This reveals that carbohydratecomponents respond similarly to mineralogical shifts (in
terms of quantity) as bulk MOC. Although absolute carbo-hydrate concentrations in A-MOAs (mg/g MOA) increasetowards the 400-kyr site, the respective concentrations inB-MOAs decrease continuously from weathering stage I toIII (Fig. 10D). This inverse trend in A- and B-MOAs sug-gests an input control for carbohydrates into deeper soilhorizons, i.e., carbohydrates appear already effectively re-tained in A horizons. The large absolute carbohydrate con-centrations in A-MOAs of weathering stage II suggest that
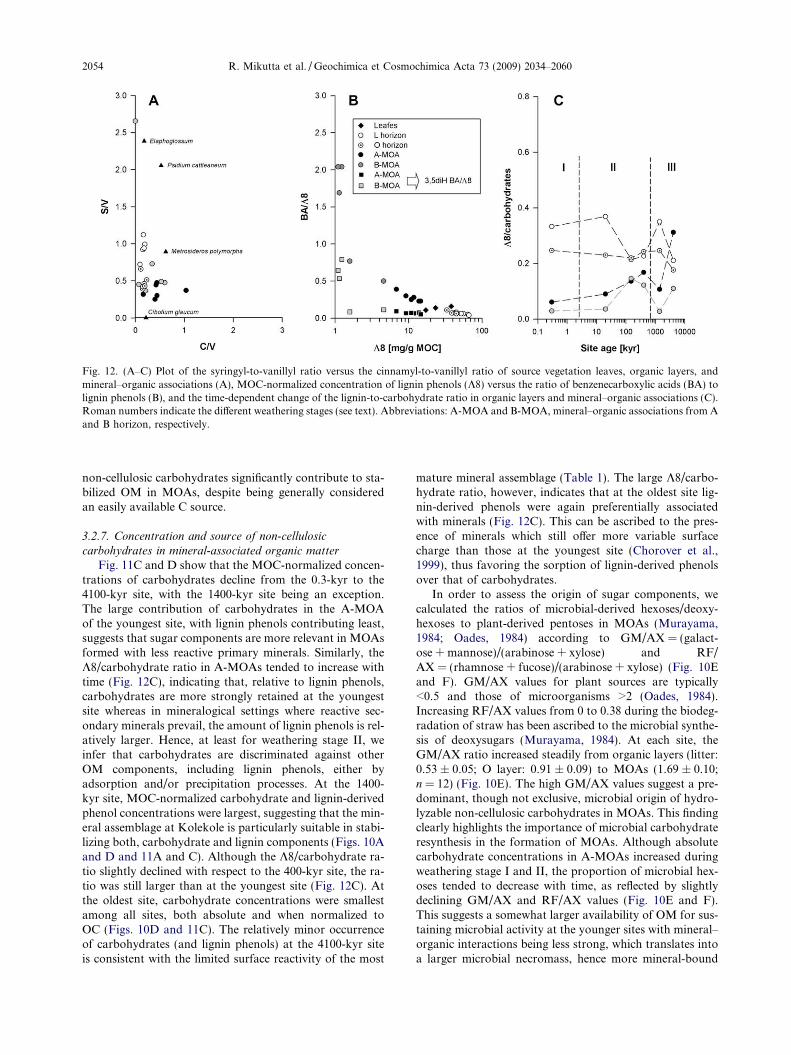
Fig. 12. (A–C) Plot of the syringyl-to-vanillyl ratio versus the cinnamyl-to-vanillyl ratio of source vegetation leaves, organic layers, andmineral–organic associations (A), MOC-normalized concentration of lignin phenols (K8) versus the ratio of benzenecarboxylic acids (BA) tolignin phenols (B), and the time-dependent change of the lignin-to-carbohydrate ratio in organic layers and mineral–organic associations (C).Roman numbers indicate the different weathering stages (see text). Abbreviations: A-MOA and B-MOA, mineral–organic associations from Aand B horizon, respectively.
2054 R. Mikutta et al. / Geochimica et Cosmochimica Acta 73 (2009) 2034–2060
non-cellulosic carbohydrates significantly contribute to sta-bilized OM in MOAs, despite being generally consideredan easily available C source.
3.2.7. Concentration and source of non-cellulosic
carbohydrates in mineral-associated organic matter
Fig. 11C and D show that the MOC-normalized concen-trations of carbohydrates decline from the 0.3-kyr to the4100-kyr site, with the 1400-kyr site being an exception.The large contribution of carbohydrates in the A-MOAof the youngest site, with lignin phenols contributing least,suggests that sugar components are more relevant in MOAsformed with less reactive primary minerals. Similarly, theK8/carbohydrate ratio in A-MOAs tended to increase withtime (Fig. 12C), indicating that, relative to lignin phenols,carbohydrates are more strongly retained at the youngestsite whereas in mineralogical settings where reactive sec-ondary minerals prevail, the amount of lignin phenols is rel-atively larger. Hence, at least for weathering stage II, weinfer that carbohydrates are discriminated against otherOM components, including lignin phenols, either byadsorption and/or precipitation processes. At the 1400-kyr site, MOC-normalized carbohydrate and lignin-derivedphenol concentrations were largest, suggesting that the min-eral assemblage at Kolekole is particularly suitable in stabi-lizing both, carbohydrate and lignin components (Figs. 10Aand D and 11A and C). Although the K8/carbohydrate ra-tio slightly declined with respect to the 400-kyr site, the ra-tio was still larger than at the youngest site (Fig. 12C). Atthe oldest site, carbohydrate concentrations were smallestamong all sites, both absolute and when normalized toOC (Figs. 10D and 11C). The relatively minor occurrenceof carbohydrates (and lignin phenols) at the 4100-kyr siteis consistent with the limited surface reactivity of the most
mature mineral assemblage (Table 1). The large K8/carbo-hydrate ratio, however, indicates that at the oldest site lig-nin-derived phenols were again preferentially associatedwith minerals (Fig. 12C). This can be ascribed to the pres-ence of minerals which still offer more variable surfacecharge than those at the youngest site (Chorover et al.,1999), thus favoring the sorption of lignin-derived phenolsover that of carbohydrates.
In order to assess the origin of sugar components, wecalculated the ratios of microbial-derived hexoses/deoxy-hexoses to plant-derived pentoses in MOAs (Murayama,1984; Oades, 1984) according to GM/AX = (galact-ose + mannose)/(arabinose + xylose) and RF/AX = (rhamnose + fucose)/(arabinose + xylose) (Fig. 10Eand F). GM/AX values for plant sources are typically<0.5 and those of microorganisms >2 (Oades, 1984).Increasing RF/AX values from 0 to 0.38 during the biodeg-radation of straw has been ascribed to the microbial synthe-sis of deoxysugars (Murayama, 1984). At each site, theGM/AX ratio increased steadily from organic layers (litter:0.53 ± 0.05; O layer: 0.91 ± 0.09) to MOAs (1.69 ± 0.10;n = 12) (Fig. 10E). The high GM/AX values suggest a pre-dominant, though not exclusive, microbial origin of hydro-lyzable non-cellulosic carbohydrates in MOAs. This findingclearly highlights the importance of microbial carbohydrateresynthesis in the formation of MOAs. Although absolutecarbohydrate concentrations in A-MOAs increased duringweathering stage I and II, the proportion of microbial hex-oses tended to decrease with time, as reflected by slightlydeclining GM/AX and RF/AX values (Fig. 10E and F).This suggests a somewhat larger availability of OM for sus-taining microbial activity at the younger sites with mineral–organic interactions being less strong, which translates intoa larger microbial necromass, hence more mineral-bound
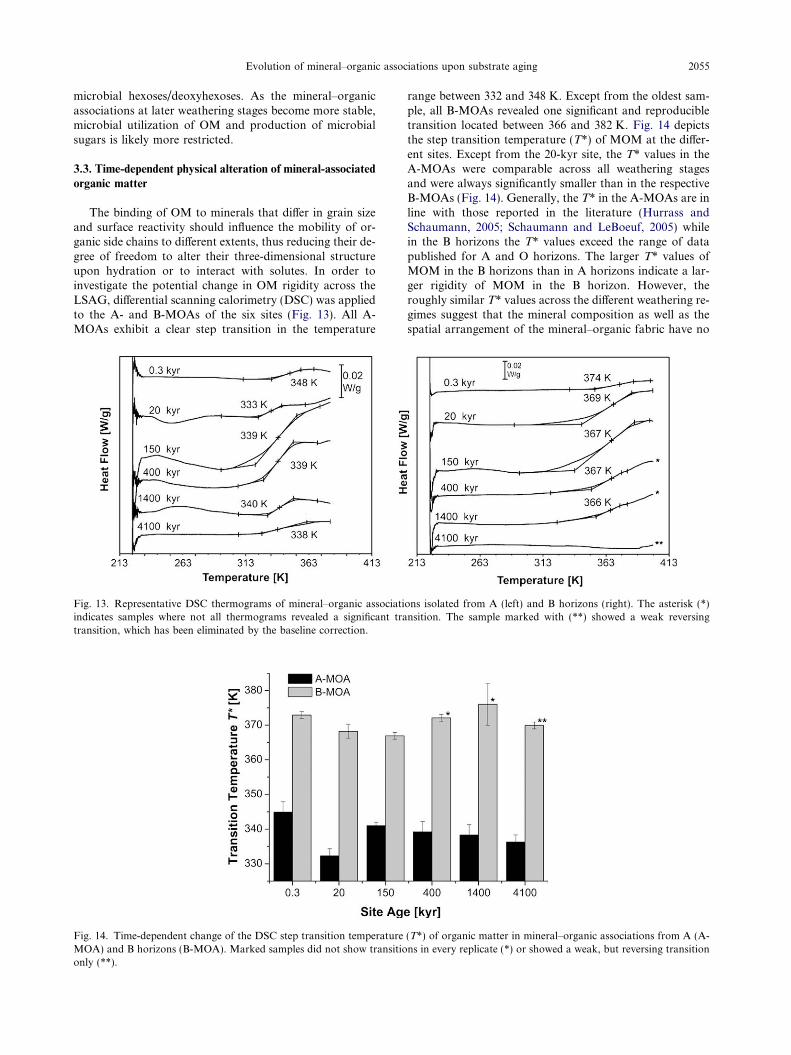
Evolution of mineral–organic associations upon substrate aging 2055
microbial hexoses/deoxyhexoses. As the mineral–organicassociations at later weathering stages become more stable,microbial utilization of OM and production of microbialsugars is likely more restricted.
3.3. Time-dependent physical alteration of mineral-associated
organic matter
The binding of OM to minerals that differ in grain sizeand surface reactivity should influence the mobility of or-ganic side chains to different extents, thus reducing their de-gree of freedom to alter their three-dimensional structureupon hydration or to interact with solutes. In order toinvestigate the potential change in OM rigidity across theLSAG, differential scanning calorimetry (DSC) was appliedto the A- and B-MOAs of the six sites (Fig. 13). All A-MOAs exhibit a clear step transition in the temperature
Fig. 13. Representative DSC thermograms of mineral–organic associatiindicates samples where not all thermograms revealed a significant tratransition, which has been eliminated by the baseline correction.
Fig. 14. Time-dependent change of the DSC step transition temperatureMOA) and B horizons (B-MOA). Marked samples did not show transitioonly (**).
range between 332 and 348 K. Except from the oldest sam-ple, all B-MOAs revealed one significant and reproducibletransition located between 366 and 382 K. Fig. 14 depictsthe step transition temperature (T*) of MOM at the differ-ent sites. Except from the 20-kyr site, the T* values in theA-MOAs were comparable across all weathering stagesand were always significantly smaller than in the respectiveB-MOAs (Fig. 14). Generally, the T* in the A-MOAs are inline with those reported in the literature (Hurrass andSchaumann, 2005; Schaumann and LeBoeuf, 2005) whilein the B horizons the T* values exceed the range of datapublished for A and O horizons. The larger T* values ofMOM in the B horizons than in A horizons indicate a lar-ger rigidity of MOM in the B horizon. However, theroughly similar T* values across the different weathering re-gimes suggest that the mineral composition as well as thespatial arrangement of the mineral–organic fabric have no
ons isolated from A (left) and B horizons (right). The asterisk (*)nsition. The sample marked with (**) showed a weak reversing
(T*) of organic matter in mineral–organic associations from A (A-ns in every replicate (*) or showed a weak, but reversing transition
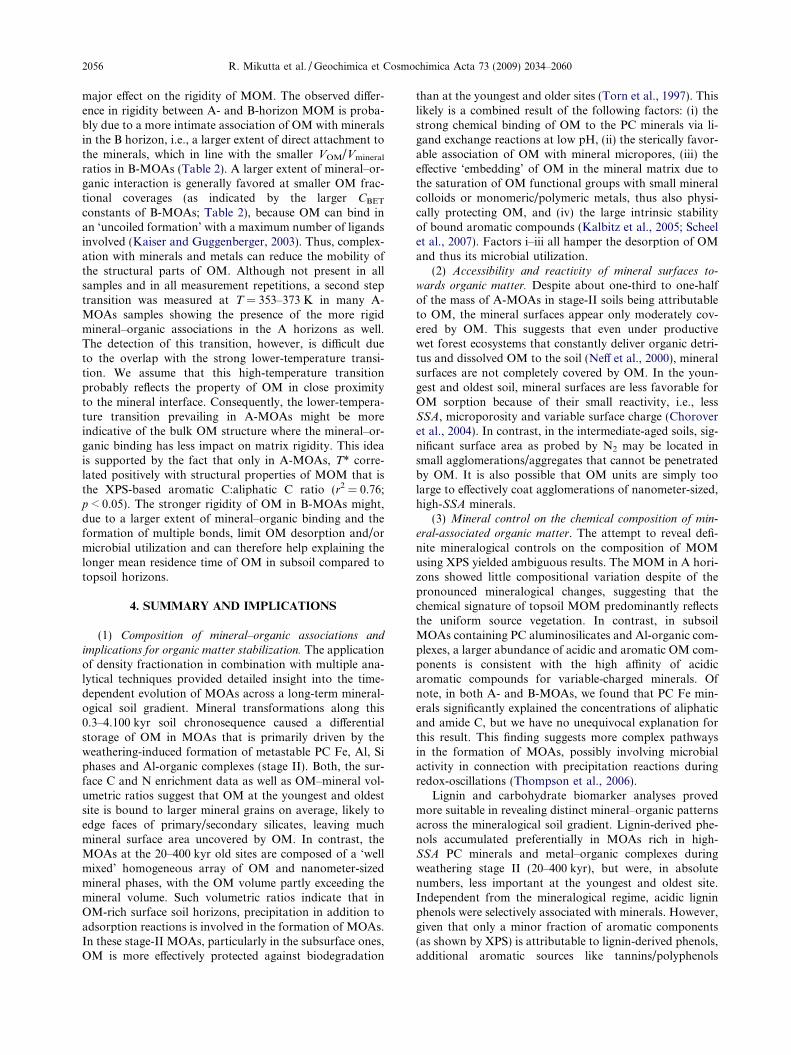
2056 R. Mikutta et al. / Geochimica et Cosmochimica Acta 73 (2009) 2034–2060
major effect on the rigidity of MOM. The observed differ-ence in rigidity between A- and B-horizon MOM is proba-bly due to a more intimate association of OM with mineralsin the B horizon, i.e., a larger extent of direct attachment tothe minerals, which in line with the smaller VOM/Vmineral
ratios in B-MOAs (Table 2). A larger extent of mineral–or-ganic interaction is generally favored at smaller OM frac-tional coverages (as indicated by the larger CBET
constants of B-MOAs; Table 2), because OM can bind inan ‘uncoiled formation’ with a maximum number of ligandsinvolved (Kaiser and Guggenberger, 2003). Thus, complex-ation with minerals and metals can reduce the mobility ofthe structural parts of OM. Although not present in allsamples and in all measurement repetitions, a second steptransition was measured at T = 353–373 K in many A-MOAs samples showing the presence of the more rigidmineral–organic associations in the A horizons as well.The detection of this transition, however, is difficult dueto the overlap with the strong lower-temperature transi-tion. We assume that this high-temperature transitionprobably reflects the property of OM in close proximityto the mineral interface. Consequently, the lower-tempera-ture transition prevailing in A-MOAs might be moreindicative of the bulk OM structure where the mineral–or-ganic binding has less impact on matrix rigidity. This ideais supported by the fact that only in A-MOAs, T* corre-lated positively with structural properties of MOM that isthe XPS-based aromatic C:aliphatic C ratio (r2 = 0.76;p < 0.05). The stronger rigidity of OM in B-MOAs might,due to a larger extent of mineral–organic binding and theformation of multiple bonds, limit OM desorption and/ormicrobial utilization and can therefore help explaining thelonger mean residence time of OM in subsoil compared totopsoil horizons.
4. SUMMARY AND IMPLICATIONS
(1) Composition of mineral–organic associations and
implications for organic matter stabilization. The applicationof density fractionation in combination with multiple ana-lytical techniques provided detailed insight into the time-dependent evolution of MOAs across a long-term mineral-ogical soil gradient. Mineral transformations along this0.3–4.100 kyr soil chronosequence caused a differentialstorage of OM in MOAs that is primarily driven by theweathering-induced formation of metastable PC Fe, Al, Siphases and Al-organic complexes (stage II). Both, the sur-face C and N enrichment data as well as OM–mineral vol-umetric ratios suggest that OM at the youngest and oldestsite is bound to larger mineral grains on average, likely toedge faces of primary/secondary silicates, leaving muchmineral surface area uncovered by OM. In contrast, theMOAs at the 20–400 kyr old sites are composed of a ‘wellmixed’ homogeneous array of OM and nanometer-sizedmineral phases, with the OM volume partly exceeding themineral volume. Such volumetric ratios indicate that inOM-rich surface soil horizons, precipitation in addition toadsorption reactions is involved in the formation of MOAs.In these stage-II MOAs, particularly in the subsurface ones,OM is more effectively protected against biodegradation
than at the youngest and older sites (Torn et al., 1997). Thislikely is a combined result of the following factors: (i) thestrong chemical binding of OM to the PC minerals via li-gand exchange reactions at low pH, (ii) the sterically favor-able association of OM with mineral micropores, (iii) theeffective ‘embedding’ of OM in the mineral matrix due tothe saturation of OM functional groups with small mineralcolloids or monomeric/polymeric metals, thus also physi-cally protecting OM, and (iv) the large intrinsic stabilityof bound aromatic compounds (Kalbitz et al., 2005; Scheelet al., 2007). Factors i–iii all hamper the desorption of OMand thus its microbial utilization.
(2) Accessibility and reactivity of mineral surfaces to-
wards organic matter. Despite about one-third to one-halfof the mass of A-MOAs in stage-II soils being attributableto OM, the mineral surfaces appear only moderately cov-ered by OM. This suggests that even under productivewet forest ecosystems that constantly deliver organic detri-tus and dissolved OM to the soil (Neff et al., 2000), mineralsurfaces are not completely covered by OM. In the youn-gest and oldest soil, mineral surfaces are less favorable forOM sorption because of their small reactivity, i.e., lessSSA, microporosity and variable surface charge (Choroveret al., 2004). In contrast, in the intermediate-aged soils, sig-nificant surface area as probed by N2 may be located insmall agglomerations/aggregates that cannot be penetratedby OM. It is also possible that OM units are simply toolarge to effectively coat agglomerations of nanometer-sized,high-SSA minerals.
(3) Mineral control on the chemical composition of min-
eral-associated organic matter. The attempt to reveal defi-nite mineralogical controls on the composition of MOMusing XPS yielded ambiguous results. The MOM in A hori-zons showed little compositional variation despite of thepronounced mineralogical changes, suggesting that thechemical signature of topsoil MOM predominantly reflectsthe uniform source vegetation. In contrast, in subsoilMOAs containing PC aluminosilicates and Al-organic com-plexes, a larger abundance of acidic and aromatic OM com-ponents is consistent with the high affinity of acidicaromatic compounds for variable-charged minerals. Ofnote, in both A- and B-MOAs, we found that PC Fe min-erals significantly explained the concentrations of aliphaticand amide C, but we have no unequivocal explanation forthis result. This finding suggests more complex pathwaysin the formation of MOAs, possibly involving microbialactivity in connection with precipitation reactions duringredox-oscillations (Thompson et al., 2006).
Lignin and carbohydrate biomarker analyses provedmore suitable in revealing distinct mineral–organic patternsacross the mineralogical soil gradient. Lignin-derived phe-nols accumulated preferentially in MOAs rich in high-SSA PC minerals and metal–organic complexes duringweathering stage II (20–400 kyr), but were, in absolutenumbers, less important at the youngest and oldest site.Independent from the mineralogical regime, acidic ligninphenols were selectively associated with minerals. However,given that only a minor fraction of aromatic components(as shown by XPS) is attributable to lignin-derived phenols,additional aromatic sources like tannins/polyphenols

Evolution of mineral–organic asso
should contribute and/or the lignin in MOAs might alreadybe highly altered and thus be invisible for the CuO tech-nique. The analysis of the carbohydrate fraction showedthat sugars are an integral part of MOAs and can becomeeffectively stabilized particularly in presence of PC mineralphases and hydrolyzable metal species during weatheringstage II. In contrast to lignin-derived phenols, non-cellu-losic carbohydrates were relatively more important in theformation of MOAs at the youngest site where primaryminerals prevail. Consequently, the fractionation of OMduring adsorption or precipitation reactions is an importantpathway that imposes differences in the chemical composi-tion of MOM.
(4) Chemical fractionation within mineral-associated or-
ganic matter. Depth profiling of A-MOAs by means ofAr+ sputtering revealed a parallel loss of C and N intensity,thus questioning the recently proposed importance of pro-teins in the initial formation of MOAs at least for theseacidic tropical soils. This result more supports the view thatN is an integral component of mineral-associated OM.While Ar+ sputtering bears the risk of chemical modifica-tions in OM such as the removal of aromatic structures,the fact that aromatic C increased with sputter time to-wards the mineral–organic interface whereas aliphatic/amide C declined suggests a zonal differentiation withinmineral-attached OM especially with regards to aromaticmoieties. Such a zonal differentiation within organic coat-ings/agglomerations is intriguing and certainly warrantsfurther research.
(5) Matrix rigidity of mineral-associated organic mat-
ter. The DSC measurements revealed that in spite ofthe mineralogical changes and different properties ofMOAs, the rigidity of sorbed OM did not differ apprecia-bly over time. However, the transition temperature, T*,of subsoil MOM was significantly higher than forMOM in A horizons, suggesting a more rigid structureof subsoil MOM. This likely arises from a larger degreeof direct mineral–organic bindings that restricts the sidechain mobility of OM. We speculate that such limitedflexibility may increase the residence time of OM in sub-soil MOAs, because desorption as well as enzymatic reac-tions with sorbed OM are less likely to occur as thedegree of chain movements within OM becomes restrictedby complexation with metals and minerals.
ACKNOWLEDGMENTS
We are grateful to Peter Vitousek for his visionary leadership inthe Hawaiian Ecosystem Research and to Heraldo Farrington forhis enthusiastic support during sampling. For the XPS analyseswe are thankful to Marion Bertram (GWT-TUD GmbH) and forlaboratory assistance to Gerlinde Hardt, Christine Krenkewitz,and Heike Oetzmann. This study also profited much from discus-sions with Klaus Kaiser and Lawrence M. Mayer. Financial sup-port was provided by the German Research Foundation (DFGproject Gu 406/18-1). Sampling support for Marc Kramer was pro-vided by the USDA CSREES NR1 program 2007-03184. The DSCanalyses were carried out under the DFG project SCHA 849/6-1.The Weathering Science Consortium funded by a National Envi-ronmental Research Council (NE/C004566/1) is gratefullyacknowledged for the TEM analysis.
APPENDIX A. SUPPLEMENTARY DATA
Supplementary data associated with this article can befound, in the online version, at doi:10.1016/j.gca.2008.12.028.
REFERENCES
Aiken G. R. and Leenheer J. A. (1993) Isolation and chemicalcharacterization of dissolved and colloidal organic matter.Chem. Ecol. 8, 135–151.
Amelung W., Kaiser K., Kammerer G. and Sauer G. (2002)Organic carbon at soil particle surfaces—evidence from X-rayphotoelectron spectroscopy and surface abrasion. Soil Sci. Soc.
Am. J. 66, 1526–1530.
Amelung W., Flach K. W. and Zech W. (1999) Lignin in particle-size fractions as influenced by climate. Soil Sci. Soc. Am. J. 63,
1222–1228.
Amelung W., Cheshire M. V. and Guggenberger G. (1996)Determination of neutral and acidic sugars in soil by capillarygas–liquid chromatography after trifluoroacetic acid hydrolysis.Soil Biol. Biochem. 28, 1631–1639.
Aringhieri R. (2004) Nanoporosity characteristics of some naturalclay minerals and soils. Clay Clay Mineral. 52, 700–704.
Arnarson T. S. and Keil R. G. (2001) Organic–mineral interactionsin marine sediments studied using density fractionation and X-ray photoelectron spectroscopy. Org. Geochem. 32, 1401–1415.
Arnarson T. S. and Keil R. G. (2007) Changes in organic matter–mineral interactions for marine sediments with varying oxygenexposure times. Geochim. Cosmochim. Acta 71, 3545–3556.
Aufdenkampe A. K., Hedges J. I., Richey J. E., Krusche A. V. andLierena C. A. (2001) Sorptive fractionation of dissolved organicnitrogen and amino acids onto fine sediments within theAmazon Basin. Limnol. Oceanogr. 46, 1918–1935.
Baisden W. T., Amundson R., Cook A. C. and Brenner D. L.(2002) Turnover and storage of C and N in five densityfractions from California annual grassland surface soils. Global
Biogeochem. Cycles, 16. doi:10.1029/2001GB001822.Barrett E. P., Joyner L. G. and Halenda P. P. (1951) The
determination of pore volume and area distributions in poroussubstances. I. Computations from nitrogen isotherms. J. Am.
Chem. Soc. 73, 373–380.
Basile-Doelsch I., Amundson R., Stone W. E. E., Borschneck D.,Bottero J. Y., Moustier S., Masin F. and Colin F. (2007)Mineral control of carbon pools in a volcanic soil horizon.Geoderma 137, 477–489.
Benner R., Weliky K. and Hedges J. I. (1990) Early diagenesis ofmangrove leaves in a tropical estuary: molecular-level analysesof neutral sugars and lignin-derived phenols. Geochim. Cosmo-
chim. Acta 54, 1991–2001.
Blakemore L. C., Searle P. L. and Daly B. K. (1987) Methods forchemical analysis of soils. New Zealand Soil Bureau Scientific
Report 80. NZ Soil Bureau. Department of Scientific andIndustrial Research, Lower Hutt, New Zealand.
Brantley S. L. and Mellott N. P. (2000) Surface area and porosityof primary silicate minerals. Am. Mineral. 85, 1767–1783.
Brenner D. L., Amundson R., Baisden W. T., Kendall C. andHarden J. (2001) Soil N and 15N variation with time in aCalifornia annual grassland ecosystem. Geochim. Cosmochim.
Acta 65, 4171–4186.
Brunauer S., Emmett P. H. and Teller E. (1938) Adsorption ofgases in multimolecular layers. J. Am. Chem. Soc. 60, 309–319.
Cabrera F., de Arambarri P., Madrid L. and Toca C. G. (1981)Desorption of phosphate from iron oxides in relation toequilibrium pH and porosity. Geoderma 26, 203–216.
ciations upon substrate aging 2057

2058 R. Mikutta et al. / Geochimica et Cosmochimica Acta 73 (2009) 2034–2060
Chorover J., Amistadi M. K. and Chadwick O. A. (2004) Surfacecharge evolution of mineral–organic complexes during pedo-genesis in Hawaiian basalt. Geochim. Cosmochim. Acta 68,
4859–4876.
Chorover J. and Amistadi M. K. (2001) Reaction of forest floororganic matter at goethite, birnessite and smectite surfaces.Geochim. Cosmochim. Acta 65, 95–109.
Chorover J., DiChiaro M. J. and Chadwick O. A. (1999) Structuralcharge and cesium retention in a chronosequence of tephriticsoils. Soil Sci. Soc. Am. J. 63, 169–177.
Collins M. J., Bishop A. N. and Farrimond P. (1995) Sorption bymineral surfaces: rebirth of the classical condensation pathwayfor kerogen formation? Geochim. Cosmochim. Acta 59, 2387–
2391.
Cornell R. M. and Schwertmann U. (1996) The Iron Oxides.Structure, Properties, Reactions, Occurrences and Uses. VCH,Weinheim.
Crow S. E., Swanston C. W., Lajtha K., Brooks J. R. andKeirstead H. (2007) Density fractionation of forest soils:methodological questions and interpretation of incubationresults and turnover time in an ecosystem context. Biogeochem-
istry 85, 69–90.
Dengis P. B., Gerin P. A. and Rouxhet P. G. (1995)X-ray photoelectron spectroscopy analysis of biosurfaces:examination of performances with yeast cells andrelated model compounds. Colloids Surf. B Biointerfaces 4,
199–211.
Dickens A. F., Gudeman J. A., Gelinas Y., Baldock J. A., TinnerW., Hu F. S. and Hedges J. I. (2007) Sources and distribution ofCuO-derived benzene carboxylic acids in soils and sediments.Org. Geochem. 38, 1256–1276.
Dickens A. F., Baldock J. A., Smernik R. J., Wakeham S. G.,Arnarson T. S., Gelinas Y. and Hedges J. I. (2006) Solid-state 13C NMR analysis of size and density fractions ofmarine sediments: insight into organic carbon sources andpreservation mechanisms. Geochim. Cosmochim. Acta 70, 666–
686.
Feng X., Simpson A. J. and Simpson M. J. (2005) Chemical andmineralogical controls on humic acid sorption to clay mineralsurfaces. Org. Geochem. 36, 1553–1566.
Fischer L., zur Muhlen E., Brummer G. W. and Niehaus H. (1996)Atomic force microscopy (AFM) investigations of the surfacetopography of a multidomain porous goethite. Eur. J. Soil Sci.
47, 329–334.
France R. M. and Short R. D. (1998) Plasma treatment ofpolymers: the effects of energy transfer from an argon plasmaon the surface chemistry of polystyrene, and polypropylene. Ahigh-energy resolution X-ray photoelectron spectroscopy study.Langmuir 14, 4827–4835.
Gerin P. A., Genet M. J., Herbillon A. J. and Delvaux B. (2003)Surface analysis of soil material by X-ray photoelectronspectroscopy. Eur. J. Soil Sci. 54, 589–603.
Goni M. A. and Hedges J. I. (1995) Sources and reactivities ofmarine-derived organic matter in coastal sediments as deter-mined by alkaline CuO oxidation. Geochim. Cosmochim. Acta
59, 2965–2981.
Gregg S. H. and Sing K. S. W. (1982). Adsorption, Surface Area and
Porosity, second ed. Academic Press, New York.Grunewald G., Kaiser K., Jahn R. and Guggenberger G. (2006)
Organic matter stabilization in young calcareous soils asrevealed by density fractionation and analysis of lignin-derivedconstituents. Org. Geochem. 37, 1573–1589.
Guan X.-H., Shang C. and Chen G.-H. (2006) Competitiveadsorption of organic matter with phosphate on aluminumhydroxide. J. Colloid Interface Sci. 296, 51–58.
Guggenberger G. and Zech W. (1994) Composition and dynamicsof dissolved carbohydrates and lignin-degradation products intwo coniferous forests, N.E. Bavaria, Germany. Soil Biol.
Biochem. 26, 19–27.
Harden J. W. (1987) Soils developed in granitic alluvium nearMerced, CA. In A Series of Soil Chronosequences in the Western
United States (ed. J. W. Harden). US Geological SurveyBulletin 1590-A. US Government Printing Office, Washington,DC.
Hattenschwiler S., Hagerman A. E. and Vitousek P. M. (2003)Polyphenol in litter from tropical montane forests across a widerange in soil fertility. Biogeochemistry 61, 129–148.
Hernes P. J., Robinson A. C. and Aufdenkampe A. K. (2007)Fractionation of lignin during leaching and sorption andimplications for organic matter ‘‘freshness’’. Geophys. Res.
Lett. 34, L17401. doi:10.1029/2007GL031017.
Hesse R., Chasse T. and Szargan R. (2003) Unifit 2002 – universalanalysis software for photoelectron spectra. Anal. Bioanal.
Chem. 375, 856–863.
Hurrass J. and Schaumann G. E. (2005) Is glassiness a commoncharacteristic of soil organic matter? Environ. Sci. Technol. 39,
9534–9540.
Hurrass J. and Schaumann G. E. (2007) Influence of the samplehistory and the moisture status on the thermal behavior of soilorganic matter. Geochim. Cosmochim. Acta 71, 691–702.
IPCC (2001) Climate change. The scientific basis. Contribution ofWorking Group I to the Third Assessment Report of theIntergovernmental Panel on Climate Change. Cambridge Uni-versity Press, Cambridge, UK.
Jahn R., Zarei M. and Stahr K. (1992) Development of andic soilproperties and of clay minerals in the semiarid climate ofLanzarote (Spain). Mineral. Petrogr. Acta XXXV-A, 193–201.
Juo A. S. R. and Kamprath E. J. (1979) Copper chloride as anextractant for estimating the potentially reactive aluminumpool in acid soils. Soil Sci. Soc. Am. J. 43, 35–38.
Kaiser K. and Guggenberger G. (2007a) Distribution of hydrousaluminium and iron over density fractions depends on organicmatter load and ultrasonic dispersion. Geoderma 140, 140–146.
Kaiser K. and Guggenberger G. (2007b) Sorptive stabilization oforganic matter by microporous goethite: sorption into smallpores vs. surface complexation. Eur. J. Soil Sci. 58, 45–59.
Kaiser K., Mikutta R. and Guggenberger G. (2007) Increasedstability of organic matter sorbed to ferrihydrite and goethiteon aging. Soil Sci. Soc. Am. J. 71, 711–719.
Kaiser K. and Guggenberger G. (2003) Mineral surfaces and soilorganic matter. Eur. J. Soil Sci. 54, 219–236.
Kaiser K., Guggenberger G. and Haumaier J. (2004) Changes indissolved lignin-derived phenols, neutral sugars, uronic acids,and amino sugars with depth in forest Haplic Arenosols andRendzic Leptosols. Biogeochemistry 70, 135–151.
Kaiser K. and Guggenberger G. (2000) The role of DOM sorptionto mineral surfaces in the preservation of organic matter insoils. Org. Geochem. 31, 711–725.
Kaiser K., Guggenberger G., Haumaier J. and Zech W. (1997)Dissolved organic matter sorption on subsoils and mineralsstudied by C-13-NMR and DRIFT spectroscopy. Eur. J. Soil
Sci. 48, 301–310.
Kalbitz K., Schwesig D., Rethemeyer J. and Matzner E. (2005)Stabilization of dissolved organic matter by sorption to themineral soil. Soil Biol. Biochem. 37, 1319–1331.
Keil R. G., Tsamakis E., Giddings J. C. and Hedges J. I. (1998)Biochemical distributions (amino acids, neutral sugars, andlignin phenols) among size-classes of modern marine sedimentsfrom the Washington coast. Geochim. Cosmochim. Acta 62,
1347–1364.
Evolution of mineral–organic associations upon substrate aging 2059
Kleber M., Sollins P. and Sutton R. (2007) A conceptual model oforgano-mineral interactions in soils: self-assembly of organicmolecular fragments into zonal structures on mineral surfaces.Biogeochemistry 85, 9–24.
Kogel I. (1986) Estimation and decomposition pattern of thelignin component in forest soil. Soil Biol. Biochem. 18, 589–
594.
Kwon S. and Pignatello J. J. (2005) Effect of natural organicsubstances on the surface and adsorptive properties of envi-ronmental black carbon (char): pseudo pore blockage by modellipid components and its implications for N2-probed surfaceproperties of natural sorbents. Environ. Sci. Technol. 39, 7932–
7939.
Louchouarn P., Lucotte M. and Farella N. (1999) Historical andgeographical variations of sources and transport of terrigenousorganic matter within a large-scale coastal environment. Org.
Geochem. 30, 675–699.
Masiello C. A., Chadwick O. A., Southon J., Torn M. S. andHarden J. W. (2004) Weathering controls on mechanisms ofcarbon storage in grassland soils. Global Biogeochem. Cycles,18. doi:10.1029/2004GB002219.
Mayer L. M. (2005) Erratum to L.M. Mayer (1999) ‘‘Extent ofcoverage of mineral surfaces by organic matter in marinesediments” Geochim. Cosmochim. Acta 63, 207–215. Geochim.
Cosmochim. Acta 69, 1375.
Mayer L. M. (1999) Extent of coverage of mineral surfaces byorganic matter in marine sediments. Geochim. Cosmochim. Acta
63, 207–215.
Miltner A. and Zech W. (1998) Beech leaf litter lignin degradationand transformation as influenced by mineral phases. Org.
Geochem. 28, 457–463.
Mikutta C., Mikutta R., Bonneville S., Wagner F., Voegelin A.,Christl A. and Kretschmar R. (2008) Synthetic coprecipitates ofexopolysaccharides and ferrihydrite. Part I: characterization.Geochim. Cosmochim. Acta 72, 1111–1127.
Mikutta R., Mikutta C., Kalbitz K., Scheel T., Kaiser K. and JahnR. (2007) Biodegradation of forest floor organic matter boundto minerals via different binding mechanisms. Geochim. Cos-
mochim. Acta 71, 2569–2590.
Mikutta R., Kleber M., Torn M. S. and Jahn R. (2006) (Stabil-ization of soil organic matter: association with minerals orchemical recalcitrance?) Biogeochemistry 77, 25–56.
Mikutta R. and Mikutta C. (2006) Stabilization of organic matterat micropores (<2 nm) in acid forest subsoils. Soil Sci. Soc. Am.
J. 70, 2049–2056.
Modl C., Wormann H. and Amelung W. (2007) Contrastingeffects of different types of organic material on surfacearea and microaggregation of goethite. Geoderma 141, 167–
173.
Moller A., Kaiser K. and Zech W. (2002) Lignin, carbohydrate,and amino sugar distribution and transformation in the tropicalhighland soils of northern Thailand under cabbage cultivation,Pinus reforestation, secondary forest, and primary forest. Aust.
J. Soil Res. 40, 977–998.
Monteil-Rivera F., Brouwer E. B., Masset S., Deslandes Y. andDumonceau J. (2000) Combination of X-ray photoelectron andsolid-state 13C nuclear magnetic resonance spectroscopy in thestructural characterisation of humic acids. Anal. Chim. Acta
424, 243–255.
Moulder J. F., Stickle W. F., Sobol P. E. and Bomben K. D. (1992)Handbook of X-ray Photoelectron Spectroscopy. Perkin-ElmerCorp., Eden Prairie, MN.
Murayama S. (1984) Changes in monosaccharide compositionduring the decomposting of straws under field conditions. Soil
Sci. Plant Nutr. 30, 367–381.
Neff J., Hobbie S. and Vittousek P. M. (2000) Nutrient andmineralogical control on dissolved organic C, N and P fluxesand stoichiometry in Hawaiian soils. Biogeochemistry 51, 283–
302.
NIST X-ray phostoelectron spectroscopy database. U.S. Secretaryof Commerce. Available from: http://srdata.nist.gov./xps.
Oades J. M. (1984) Soil organic matter and structural stability:mechanisms and implications for management. Plant Soil 76,
319–337.
Otto A. and Simpson M. J. (2006) Evaluation of CuO oxidationparameters for determining the source and stage of lignindegradation in soil. Biogeochemistry 80, 121–142.
Prahl F. G., Ertel J. R., Goni M. A., Sparrow M. A. andEversmeyer B. (1994) Terrestrial organic carbon contributionsto sediments on the Washington margin. Geochim. Cosmochim.
Acta 58, 3035–3048.
Rothstein D. E., Vitousek P. M. and Simmons B. L. (2004) Anexotic tree alters the decomposition and nutrient cycling in aHawaiian montane forest. Ecosystems 7, 805–814.
Rouquerol J., Rouquerol F. and Sing K. (1998). Adsorption by
Powders and Porous Solids. Principles, Methodology and Appli-
cations. Elsevier.Schaumann G. E. (2006) Soil organic matter beyond molecular
structure. 2. Amorphous nature and physical aging. J. Plant
Nutr. Soil Sci. 169, 157–167.
Schaumann G. E. (2005) Matrix relaxation and change of waterstate during hydration of peat. Colloids Surf. A Physicochem.
Eng. Aspects 265, 163–170.
Schaumann G. and LeBoeuf E. J. (2005) Glass transition in peat:their relevance and the impact of water. Environ. Sci. Technol.
39, 800–806.
Scheel T., Haumaier L., Ellerbrock R. H., Ruhlmann J. andKalbitz K. (2008) Properties of organic matter precipitatedfrom acidic forest soil solutions. Org. Geochem. 39, 1439–
1453.
Scheel T., Dorfler C. and Kalbitz K. (2007) Precipitation ofdissolved organic matter by aluminum stabilizes carbon inacidic forest soils. Soil Sci. Soc. Am. J. 71, 64–74.
Sollins P., Swanston C., Kleber M., Filley T., Kramer M., Crow S.,Caldwell B. A., Lajtha K. and Bowden R. (2006) Organic C andN stabilization in a forest soil: evidence from sequential densityfractionation. Soil Biol. Biochem. 38, 3313–3324.
Torn M. S., Trumbore S. E., Chadwick O. A., Vitousek P. M. andHendricks D. M. (1997) Mineral control of soil organic carbonstorage and turnover. Nature 389, 170–173.
Torn M. S., Vitousek P. M. and Trumbore S. E. (2005) Theinfluence of nutrient availability on soil organic matter turnoverestimated by incubations and radiocarbon modeling. Ecosys-
tems 8, 352–372.
Thompson A., Chadwick O. A., Rancourt D. G. and Chorover J.(2006) Iron-oxide crystallinity increases during soil redoxoscillations. Geochim. Cosmochim. Acta 70, 1710–1727.
Vitousek P. M. (2004) Nutrient Cycling and Limitation: Hawaii as a
Model System. Princeton University Press.Wagai R., Mayer L. M. and Kitayama K. (2009) Extent and nature
of organic coverage of soil mineral surfaces assessed by a gassorption approach. Geoderma 149, 152–160.
Yuan G., Soma N., Seyama H., Theng B. K. G., Lavkulich L. M.and Takamatsu T. (1998) Assessing the surface composition ofsoil particles from some Podzolic soils by X-ray photoelectronspectroscopy. Geoderma 86, 169–181.
Ziegler K., Chadwick O. A., Brzezinski M. A. and Kelly E. F.(2005) Natural variations of d30Si ratios during progressivebasalt weathering, Hawaiian Islands. Geochim. Cosmochim.
Acta 69, 4597–4610.

2060 R. Mikutta et al. / Geochimica et Cosmochimica Acta 73 (2009) 2034–2060
Zubavichus Y., Fuchs O., Weinhardt L., Heske C., Umbach E.,Denlinger J. D. and Grunze M. (2004) Soft X-ray-induceddecomposition of amino acids: an XPS, mass spectrometry, andNEXAFS study. Radiat. Res. 161, 346–358.
Zaporojtchenko V., Zekonyte J. and Faupel F. (2007) Effects of ionbeam treatment on atomic and macroscopic adhesion of copperto different polymer materials. Nucl. Instrum. Methods Phys.
Res. B 265, 139–145.
Zaporojtchenko V., Zekonyte J., Wille S., Schuermann U.and Faupel F. (2005) Tailoring of the PS surface withlow energy ions: relevance to growth and adhesion ofnoble metals. Nucl. Instrum. Method Phys. Res. B 236,
95–102.
Associate editor: Jay A. Brandes


![Biogeochemistry Chapter - Reading Materials[1]](https://static.fdocuments.us/doc/165x107/563db8d4550346aa9a975901/biogeochemistry-chapter-reading-materials1.jpg)