Behavior of PAH/mineral associations during ...
18
HAL Id: hal-01158744 https://hal.archives-ouvertes.fr/hal-01158744 Submitted on 2 Feb 2018 HAL is a multi-disciplinary open access archive for the deposit and dissemination of sci- entific research documents, whether they are pub- lished or not. The documents may come from teaching and research institutions in France or abroad, or from public or private research centers. L’archive ouverte pluridisciplinaire HAL, est destinée au dépôt et à la diffusion de documents scientifiques de niveau recherche, publiés ou non, émanant des établissements d’enseignement et de recherche français ou étrangers, des laboratoires publics ou privés. Behavior of PAH/mineral associations during thermodesorption: impact for the determination of mineral retention properties towards PAHs Coralie Biache, Catherine Lorgeoux, Alain Saada, Pierre Faure To cite this version: Coralie Biache, Catherine Lorgeoux, Alain Saada, Pierre Faure. Behavior of PAH/mineral associ- ations during thermodesorption: impact for the determination of mineral retention properties to- wards PAHs. Analytical and Bioanalytical Chemistry, Springer Verlag, 2015, 407 (12), pp.3509-3516. 10.1007/s00216-015-8547-z. hal-01158744
Transcript of Behavior of PAH/mineral associations during ...

HAL Id: hal-01158744https://hal.archives-ouvertes.fr/hal-01158744
Submitted on 2 Feb 2018
HAL is a multi-disciplinary open accessarchive for the deposit and dissemination of sci-entific research documents, whether they are pub-lished or not. The documents may come fromteaching and research institutions in France orabroad, or from public or private research centers.
L’archive ouverte pluridisciplinaire HAL, estdestinée au dépôt et à la diffusion de documentsscientifiques de niveau recherche, publiés ou non,émanant des établissements d’enseignement et derecherche français ou étrangers, des laboratoirespublics ou privés.
Behavior of PAH/mineral associations duringthermodesorption: impact for the determination of
mineral retention properties towards PAHsCoralie Biache, Catherine Lorgeoux, Alain Saada, Pierre Faure
To cite this version:Coralie Biache, Catherine Lorgeoux, Alain Saada, Pierre Faure. Behavior of PAH/mineral associ-ations during thermodesorption: impact for the determination of mineral retention properties to-wards PAHs. Analytical and Bioanalytical Chemistry, Springer Verlag, 2015, 407 (12), pp.3509-3516.�10.1007/s00216-015-8547-z�. �hal-01158744�
Behavior of PAH/mineral associations during thermodesorption:
impact for the determination of mineral retention properties
towards PAHs
Coralie Biache1,2,*, Catherine Lorgeoux3,4, Alain Saada5, Pierre Faure1,2
1 Université de Lorraine, LIEC, UMR7360,54506 Vandœuvre-lès-Nancy, France
2 CNRS, LIEC, UMR7360, 54506 Vandœuvre-lès-Nancy, France
3 Université de Lorraine, GeoRessources, UMR7359, 54506 Vandœuvre-lès-Nancy, France
4 CNRS, GeoRessources, UMR7359, 54506 Vandœuvre-lès-Nancy, France
5 BRGM, 3 Avenue Claude Guillemin, BP 36009, 45060 Orléans Cedex 2, France
* Corresponding author (C. Biache) e-mail: [email protected]
Keywords: Evolved gas analysis; Thermal desorption; Bentonite; Silica sand; Polycyclic aromatic
hydrocarbon; Sorption
Abstract
Polycyclic aromatic hydrocarbons (PAHs) associated with two minerals (silica sand and bentonite)
presenting opposite retention properties were analyzed with a thermodesorption (Td)-GC-MS coupling
in order to validate this technique as a new and rapid way to evaluate the solid sorption properties.
Two analysis modes were used, evolved gas analysis (EGA) and Td with cryo-trap. EGA allowed a real-
time monitoring of the compounds desorbed during a temperature program and gave a first screening
of the samples while Td gave more precise indications on compound abundances for selected
temperature ranges. When associated with silica sand, PAHs were released at relatively low
temperatures (<300 °C) close to corresponding boiling point, whereas for the PAH/bentonite mixture,
PAHs were desorbed at much higher temperatures; they were also present in much lower abundance
and were associated with mono-aromatic compounds. With bentonite, the PAH abundances
decreased and the mono-aromatics increased with the increasing PAH molecular weight. These results
indicated a clear PAH retention by the bentonite due to polymerization, followed by a thermal cracking
at higher temperatures. The Td-GC-MS was proven to efficiently underline differences in retention
properties of two minerals, and this study highlights the great potential of this technique to evaluate
compound/matrix bond strength and interaction.

1. Introduction
Polycyclic aromatic hydrocarbons (PAHs) have drawn some attention during the past decades due to
their toxic and carcinogenic properties [1]. Their presence in soils can be caused by atmospheric
deposition or spilling of contaminated materials such as coal tar which is frequently encountered in
sites housing coal-related activities [2]. PAH fate in the soils implies either degradation or stabilization
[3]. Biotic and abiotic degradations infer that the compounds are available for such processes, and
stabilization involves most of the time strong sorption on mineral or organic surfaces. Consequently,
soil constituents and especially minerals will have strong influence on the PAH fate. Indeed, some
minerals, especially clay minerals, have strong sorption properties towards PAHs [3–6] and are known
to participate in organic matter (OM)—including PAHs—stabilization in contaminated soils [7, 8]. Most
of the time, the evaluation of retention properties of a given matrix towards a specific compound or
family of compounds is made via sorption batch experiments [9]. Such experiences are time consuming
since the solid/solution ratio (at least 1:10) and sufficient contact times (at least 24 h) need to be
determined before the definite sorption and desorption experiments [10]. Another possibility is to
determine the compound mobility/ availability which depends on the solid retention properties. For
example, thermal desorption is applied in the Pollut-Eval technique—based on Rock-Eval pyrolysis—
to obtain indications on the type of contamination encountered in soils and sediments (e.g., light oil
hydrocarbons, heavy oil, or PAHs) [11]. These distinctions between contaminants are based on the
vaporization temperatures. Another more precise way is to use thermal analysis to correlate the solid
retention property with the temperature at which the compound is released. Such philosophy was
applied by Cuypers et al. [12] and Siewert [13]. They used thermogravimetric analyses (TGA) and
associated different loss weight temperatures to different types of OM according to its mobility and
structure. Owing to the type of analyses (TGA), their OM description was very general (i.e., easily
biodegradable, humified soil OM, condensed graphite-like substance) and they did not reach a
molecular level. However, this molecular information is necessary to determine a solid-binding
property towards specific compounds. Therefore, we propose to use thermodesorption (Td)

associated with a gas chromatograph–mass spectrometer coupling (GC-MS). Such techniques were
already developed for the determination of organic contaminants in waters [14, 15] and in air
particulate matter [16–18]. The compounds of interest, in these cases PAHs, organochlorides, and
volatile organic compounds (VOCs), were sorbed or collected on filters before being desorbed and
analyzed with Td-GC-MS. This coupling was also used to evidence the presence of organic
contaminants in river sediments or sludge from wastewater treatment plants [19–21] and was proven
to be an efficient first screening for contaminant detection. This technique was mostly developed in
order to avoid time-consuming sample preparation and to get rapid results avoiding, at the same time,
artifacts and especially losses related to extraction or concentration steps. However, the idea of
connecting desorption temperature of given compounds to their binding strength with the solid was
never explored until now.
The objectives of this study were to investigate the behavior of PAHs sorbed on different minerals
during thermodesorption and to test if the retention properties of a solid towards organic compounds
can be determined using the compound desorption temperature. In order to fulfill these purposes,
PAHs were sorbed on two mineral surfaces presenting different retention properties, a silica sand and
a bentonite. Bentonite was chosen over other clay minerals for its higher specific area, possibly
resulting in higher retention capacities. The compounds were then analyzed with Td using two
different modes, the evolved gas analysis (EGA) mode, consisting in a Td-MS coupling allowing a first
screening of the compound desorption temperatures and the Td-GC-MS coupling with cryo-trap mode
to obtain the molecular distribution and allowing an abundance estimation of the compound
thermodesorbed during defined temperature ranges.
2. Materials and methods
2.1. Samples
2.1.1. PAHs

Experiments were performed on individual PAHs and on PAH mixture. Phenanthrene, pyrene, and
perylene were selected for the individual PAH experiments as they present various molar masses (178,
202, and 252 g/mol, respectively) and different boiling points (Table 1). They were supplied by Sigma-
Aldrich with a purity >98 % for phenanthrene and pyrene and >99%for perylene. PAH solutions were
prepared to reach a 500 μg/mL concentration by weighing 2.5 mg of PAH crystals and dissolving them
in dichloromethane (DCM) adjusted to 5 mL in a volumetric flask. The PAH mixture was supplied by Dr.
Ehrenstorfer GmbH (PAH mix-64) and consisted in the 16 listed PAHs (Table 1) and carbazole (a
nitrogenated-PAH) at 2000 μg/mL.
Table 1: Abbreviations, molar masses and boiling points of the PAHs used in this study
Name Abbreviation Molar mass (g/mol) Boiling point (°C)
Naphthalene* Na 128 218a Acenaphthylene* Acy 152 280a Acenaphthene* Ace 154 279a Fluorene* Fl 166 295a Phenanthrene* Phe 178 340a Anthracene* An 178 340a Carbazole Car 167 355a Fluoranthene* Fluo 202 384a Pyrene* Py 202 404a Benz[a]anthracene* BaA 228 438a Chrysene* Chry 228 448a Benzo[b]fluoranthene* BbF 252 481b Benzo[k]fluoranthene* BkF 252 480a Benz[a]pyrene* BaP 252 496b Perylene 252 350-400c Indeno[1,2,3-cd]pyrene* IP 276 536c Benzo[ghi]perylene* BghiP 276 550b Dibenzo[a,h]anthracene* DBahA 278 797d
*PAHs listed by the US-EPA as priority pollutants afrom Handbook of chemistry and physics [21] bfrom The international program on chemical safety [22] cfrom Toxnet [23] dfrom NIST Chemistry WebBook [24]
2.1.2. Mineral phases
The silica sand was Fontainebleau sand (180 to 500 μm) provided by Carlo Erba and was used as a non-
reactive reference.

Bentonite was obtained from a purified bentonite from Georgia provided by IBECO, S&B Industrial
Minerals GmbH. The structural formula was obtained from chemical and electron microprobe
analyses: (Si3.928Al0.072)IV (Al1.383Mg0.404Fe3+0.213)VI O10(OH)2Na+
0.379K0.098
The cationic exchange capacity is close to 126 meq/100 g. The bentonite texture was characterized in
the dry state using conventional step-by-step volumetric adsorption equipment (B.E.T.) in order to
perform complete nitrogen gas adsorption– desorption cycles for the specific area determination. The
specific area of the bentonite is 78.1 m2/g.
Both minerals were washed with a methanol/chloroform 1:1 (v/v) mixture in a Soxhlet apparatus for
24 h in order to remove any potential organic contamination, and the solids were left in a ventilated
oven set at 60 °C for 24 h to ensure the complete evaporation of the solvents. Analyses of control
samples, i.e., the washed and dried mineral matrices, were carried out and confirmed that no trace of
solvent remained (see Electronic Supplementary Material, ESM).
2.2. Mineral spiking
Fraction of minerals (1 g) was spiked with isolated PAH (240 μL) and PAH mixture (60 μL) solutions in
order to reach a concentration of 120 μg of individual PAH per gram of solid. DCM (c.a. 1 mL) was
added to the mixture in order to spread the PAHs evenly on the solid surface. The mixtures were left
in a ventilated hood until complete evaporation of the solvent and stored at −18 °C.
2.3. TD-GC-MS analyses
2.3.1. Td-GC-MS coupling
A Frontier Lab Multi-shot pyrolyzer EGA/PY-3030D and a Micro Jet Cryo-Trap MJT-1030Ex were
installed on an Agilent GC 7820 coupled with a 7595 MS detector. Helium was used as carrier gas at a
constant flow of 1.4 mL/min in all Td-GC-MS measurement. The inlet and transfer line temperatures
were set at 320 °C, and the MS quadrupole and ion source were set at 180 and 230 °C, respectively.
For all analyses, the MS was used in the full scan mode.

2.3.2. EGA
The EGA mode, coupling directly Td with MS without GC separation, allowed a real-time plot of the
ions released during a temperature program of the pyrolyzer oven and gave a first screening of the
samples which was used to determine the temperature ranges used for the Td-GC-MS analyses. The
pyrolyzer temperature was programmed from 100 to 800 °C which is the maximum temperature of
the device, at a heating rate of 10 °C/min, and 30 mg of samples were analyzed in the EGA mode with
a split ratio of 10:1. For the molecular transfer to the mass spectrometer, a Frontier Lab Ultra Alloy-
DTM column (2.5 m×0.15 mm i.d.) was installed in the GC. The oven temperature was isothermal at
300 °C.
2.3.3. Td with cryo-trap
For this mode, the desorbed compounds were separated by gas chromatography. The use of the cryo-
trap (−180 °C) at the column head allowed concentrating the compounds that were desorbed during a
given Td temperature program. The samples (1 mg) were heated according to three successive Td
temperature ranges which were determined according to the first sample screenings obtained with
the EGA: from 100 to 350 °C, from 350 to 550 °C, and from 550 to 800 °C with a heating rate of 10
°C/min. The injections were done in split mode with a split ratio of 200:1. The GC was equipped with
an Agilent HP-5MS column (30 m×0.25 mm i.d.×0.25 μm film thickness). The oven temperature
program was as follow: 50 °C for 2 min, from 50 to 315 °C to 15 °C/min, then hold at 315 °C for 10 min.

Fig. 1: Overlaid extracted ion chromatograms of the EGA of (a) the phenanthrene/mineral (b) pyrene/mineral and (c) perylene/mineral mixtures (m/z: 178, 202, 252, 78, 91, 106, 128 ions were identified as phenanthrene, pyrene, perylene, benzene, toluene, ethylbenzene/xylene and naphthalene, respectively, by mass spectra comparison with the Wiley275 library)

3. Results and discussion
3.1. Overview of the compound desorption temperatures with EGA
Ions corresponding to the compounds of interest (m/z 178, 202, and 252 for phenanthrene, pyrene,
and perylene, respectively) were extracted from the chromatograms obtained with EGAs of the
PAH/mineral mixtures (Fig. 1). According to the mineral and for the three target compounds, a
difference in the maximal desorption temperature was obvious. When associated with silica sand,
phenanthrene, pyrene, and perylene were, respectively, desorbed at c.a. 200, 220, and 300 °C which
represent temperatures lower than their respective boiling points (Table 1). These lower observed
values can easily be explained by the fact that the equilibrium is constantly shifted by the helium
flowing through the oven. For the phenanthrene/bentonite mixture, the maximal desorption
temperature for the ion m/z 178 was about 500 °C. Even if the EGA profile did not give absolute
quantitative results, it should be noted that the response intensity was ten times lower for the
phenanthrene/bentonite mixture than for the phenanthrene/silica sand (Fig. 1a). This trend was
observed to a greater extent for the pyrene and perylene associated with bentonite. The maximal
desorption temperature for the ion m/z 202 was between 400 and 500 °C, with lower response
intensity, and the ion m/z 252 corresponding to perylene was not detected for the perylene/bentonite
mixture (Fig. 1c). For the PAH/bentonite mixtures, the low response intensity of the targeted PAH ions
was associated with the presence of other fragments appearing between 400 and 600 °C. They
corresponded to smaller units such as benzene (m/z 78), toluene (m/z 91), xylene (m/z 106), and
naphthalene (m/z 128). As already mentioned, clay minerals present strong sorption properties
towards PAHs [3–5] that could be responsible for these relatively high desorption temperatures. Clay
minerals are also known to interact with OM during pyrolysis causing aromatization and
polymerization of organic compounds [26–28]. Indeed, it has been demonstrated that kerogen
pyrolysis [29] and coal thermal maturation [30] in the presence of clay induced retention of the
volatilized compounds on the clay mineral surfaces. A tar-like coating presenting pre-graphitic
structure is observed around the clay grains, which is consistent with the

polymerization/polycondensation of the retained compounds. Kopinke and Remmler [28] also
observed the formation of a bound residue during thermal analyses of organic compounds (including
PAHs) associated with sediments and sediment mineral matrix and named this phenomenon
“charring”. They also observed that increasing temperatures (>450 °C) cause a thermal decomposition
or thermal cracking of the newly formed residues, which would lead to the release of low molecular
weight aromatic hydrocarbons. During the PAH/bentonite Td experiments and unlike the PAH/silica
sand experiments, the PAHs were strongly retained on the mineral surfaces and polymerization likely
occurred with the increasing temperature, possibly through radical reaction [28], leading to more
thermally stable compounds. When the thermal cracking zone was reached (c.a. 500 °C [31]), low
molecular weight aromatic structures such as benzene, toluene, xylene, etc. were produced either
from the sorbed PAH or, more likely, from the polymerization products.
Fig. 2: Areas of the GC-MS peaks corresponding to the compounds detected during the 100 - 350 °C, 350 - 550 °C and 550 – 800 °C thermodesorptions of (a) the phenanthrene/mineral (b) pyrene/mineral and (c, d) perylene/mineral mixtures (d is a magnified portion of c)

3.2. Temperature-related compound discrimination with Td/cryo-trap analyses
Td analyses allowed targeting specific temperature ranges, determined after EGA, for which the
thermodesorbed compounds were concentrated in the cryo-trap and subsequently analyzed with GC-
MS. The first zone (100–350 °C) corresponded to the thermodesorption of most of the PAHs associated
with silica sand, the second one (350–550 °C) was related to the detection of most of the small
aromatic units formed with the PAH/bentonite associations, and the last one (550–800 °C) was used
to report the last thermal cracking events. The integration of the GC-MS peaks gave better indication
of the abundance of the different compounds released during the Td steps. Td analyses confirmed the
observations made with EGA (Fig. 2), but the differences observed between silica sand and bentonite
were less intense. For the PAH/silica sand associations, most of the compounds were desorbed during
the first temperature zone (100–350 °C). Mono-aromatic compounds were also detected for the
perylene/silica sand mixture, but their intensity can be considered as negligible compared to the
parent compound (Fig. 2c, d). When associated with bentonite, most of the parent compounds were
detected during the 350–550 °C Td. Their areas were lower than with the PAH/silica sand association
which confirmed the difference of behavior of the minerals and the resulting higher retention property
of bentonite towards PAH than the silica sand. The areas of the parent compounds decreased with
increasing molar mass to reach values 100 times lower for the perylene/bentonite than for the
perylene/sand mixture, confirming the bentonite strong sorption properties possibly related to
catalyzed polymerization. The thermal cracking products, i.e., BTEX, were also mostly detected during
the 350–550 °C Td of the PAH/bentonite mixtures, and their relative intensities compared with parent
compounds increased with the PAH molecular weight. Mostly, mono-aromatic compounds resulting
from thermal cracking were detected during the 550–800 °C Td but in relatively low intensity.
The results obtained for the PAH mixture and mineral association showed the same trend than isolated
PAHs (Fig. 3). For the PAH mix/silica sand mixture, most of the compounds were released from 100 to
350 °C. It is worthwhile noting that, as observed for the isolated PAH experiment, the intensity of the
compounds detected during the higher temperature Td increased with the PAH molecular weight (Fig.

3a). Again, when associated with bentonite, most of the PAH were released during the 350–550 °C Td
and their relative intensity decreased with increasing molecular weight, which was not observed with
the silica sand. Only benzene was detected during the PAH mix/silica sand mixture Td (Fig. 3b) whereas
benzene, toluene, xylene, and ethylbenzene were generated during the PAH mix/bentonite mixture
Td mostly from 350 °C. These observations underlined once again that the important retention
property of the bentonite is likely associated with a polymerization phenomenon, inducing an
immobilization of the PAHs at its surface followed by a thermal cracking of the sorbed compounds at
high temperature (>450 °C) rather than a simple volatilization as it was the case for the silica sand.
Fig. 3: Areas of the GC-MS peaks corresponding to (a) the PAHs and (b) the BTEX detected during the 100 - 350 °C, 350 - 550 °C and 550 – 800 °C thermodesorptions of the PAH-mix/mineral mixtures (see Table 1 for PAH
abbreviation meanings)

4. Conclusion
Td and EGA were tested as a simple and rapid way to evaluate the retention properties of silica sand
and bentonite towards PAHs. EGA allowed a first screening; it underlined major differences between
the two matrices and evidenced the bentonite catalytic properties. Indeed, the results suggested that
PAHs were strongly retained on the bentonite surface, which was likely enhanced by a temperature-
induced polymerization, followed by thermal cracking as temperatures increased, releasing smaller
units. The Td analyses allowed getting more precise indications on the abundance of the compounds
released during defined temperature range. These results are encouraging and underline the potential
of such instrument for the study of organic compound–solid matrix interactions and the evaluation of
matrix retention property controlling the compound availability. A method for compound
quantification, which is necessary to validate the use of Td for the determination of the contamination
available fraction, is currently being developed.
Acknowledgements
This study was funded by the Lorraine Energy and Environment Carnot Institute (ICEEL) and the French
Geological Survey (BRGM). We thank the GISFI (French Scientific Interest Group–Industrial Wasteland,
www.gisfi.prd.fr). We are also grateful to Angelina Razafitianamaharavo for the soil-specific area
determination, and we thank Dr.Manuel Pelletier and Dr. Fabien Thomas for the helpful discussions.
We also thank Axel Bart from SRA for technical support.
References
1. Keith LH, Telliard WA (1979) Priority pollutants I—a perspective view. Environ Sci Technol 13:416–
423
2. Cerniglia CE (1992) Biodegradation of polycyclic aromatic hydrocarbons. Biodegradation 3:351–368
3. Lahlou M, Ortega-Calvo JJ (1999) Bioavailability of labile and desorption-resistant phenanthrene
sorbed to montmorillonite clay containing humic fractions. Environ Toxicol Chem 18:2729–2735
4. Hwang S, Cutright TJ (2002) Impact of clay minerals and DOM on the competitive
sorption/desorption of PAHs. Soil Sediment Contam 11:269–291

5. Karimi-Lotfabad S, Pickard MA, Gray MR (1996) Reactions of polynuclear aromatic hydrocarbons on
soil. Environ Sci Technol 30: 1145–1151
6. Badea S-L, Lundstedt S, Liljelind P, Tysklind M (2013) The influence of soil composition on the
leachability of selected hydrophobic organic compounds (HOCs) from soils using a batch leaching
test. J Hazard Mater 254–255:26–35
7. Biache C, Kouadio O, Lorgeoux C, Faure P (2014) Impact of clay mineral on air oxidation of PAH-
contaminated soils. Environ Sci Pollut Res: 11017–11026
8. Ghislain T, Faure P, Biache C, Michels R (2010) Low-temperature, mineral-catalyzed air oxidation: a
possible new pathway for PAH stabilization in sediments and soils. Environ Sci Technol 44: 8547–
8552
9. Roy WR, Krapac IG, Chou SFJ, Griffin RA (1991) Batch-type procedures for estimating soil adsorption
of chemicals. EPA/530- SW-87-006-F
10. Gaboriau H, Saada A (2001) Influence of heavy organic pollutants of anthropic origin on PAH
retention by kaolinite. Chemosphere 44: 1633–1639
11. Lafargue E, Marquis F, Pillot D (1998) Rock-Eval 6 applications in hydrocarbon exploration,
production, and soil contaminations studies. Rev Inst Fr Pétrol 53:421–437
12. Cuypers C, Grotenhuis T, Nierop KGJ, Franco EM, de Jager A, Rulkens W (2002) Amorphous and
condensed organic matter domains: the effect of persulfate oxidation on the composition of soil/
sediment organic matter. Chemosphere 48:919–931
13. Siewert C (2001) Investigation of the thermal and biological stability of soil organic matter. Shaker,
Aachen
14. Popp P, Bauer C, Hauser B, Keil P, Wennrich L (2003) Extraction of polycyclic aromatic hydrocarbons
and organochlorine compounds from water: a comparison between solid-phase microextraction
and stir bar sorptive extraction. J Sep Sci 26:961–967
15. Popp P, Keil P, Montero L, Rückert M (2005) Optimized method for the determination of 25
polychlorinated biphenyls in water samples using stir bar sorptive extraction followed by
thermodesorption-gas chromatography/mass spectrometry. J Chromatogr A 1071:155–162
16. Beiner K, Plewka A, Haferkorn S, Iinuma Y, Engewald W, Herrmann H (2009) Quantification of
organic acids in particulate matter by coupling of thermally assisted hydrolysis and methylation
with thermodesorption-gas chromatography–mass spectrometry. J Chromatogr A 1216:6642–6650
17. Haunold A, Rosenberg E, Grasserbauer M (1997) An improved sampling strategy for the
measurement of VOCs in air, based on cooled sampling and analysis by thermodesorption-GC-
MS/FID. Int J Environ Anal Chem 67:157–172
18. Zhao J, Pa P, Song J, Ma S, Sheng G, Fu J (2009) Characterization of organic matter in total
suspended particles by thermodesorption and pyrolysis-gas chromatography-mass spectrometry. J
Environ Sci 21:1658–1666
19. Faure P, Landais P (2001) Rapid contamination screening of river sediments by flash pyrolysis-gas
chromatography–mass spectrometry (PyGC–MS) and thermodesorption GC–MS (TdGC–MS). J Anal
Appl Pyrolysis 57:187–202
20. Faure P, Vilmin F, Michels R, Jarde E, Mansuy L, Elie M, Landais P (2002) Application of
thermodesorption and pyrolysis-GC–AED to the analysis of river sediments and sewage sludges for
environmental purpose. J Anal Appl Pyrolysis 62:297–318
21. Terán A, Gonzalez-Vila FJ, Gonzalez-Perez JA (2009) Detection of organic contamination in
sediments by double-shoot pyrolysis–GC/MS. Environ Chem Lett 7:301–308
22. Lide DR (ed) (2004) Handbook of chemistry and physics. 84th edn. CRC Press
23. Wold Health Organisation (2014) International programme on chemical safety.
http://www.inchem.org. Accessed 30 Oct 2014
24. U.S. National Library of Medicine (2014) TOXNET Toxicology Data Network.
http://toxnet.nlm.nih.gov/. Accessed 30 Oct 2014
25. National Institute of Standards and Technology (2014) Chemistry WebBook.
http://webbook.nist.gov/chemistry/name-ser.html. Accessed 30 Oct 2014
26. Faure P, Jeanneau L, Lannuzel F (2006) Analysis of organic matter by flash pyrolysis-gas
chromatography–mass spectrometry in the presence of Na-smectite: when clay minerals lead to
identical molecular signature. Org Geochem 37:1900–1912
27. Faure P, Schlepp L, Mansuy-Huault L, Elie M, Jardé E, Pelletier M (2006) Aromatization of organic
matter induced by the presence of clays during flash pyrolysis-gas chromatography–mass
spectrometry (PyGC–MS): a major analytical artifact. J Anal Appl Pyrolysis 75:1–10
28. Kopinke F-D, Remmler M (1995) Reactions of hydrocarbons during thermodesorption from
sediments. Thermochim Acta 263:123–139
29. Espitalié J, Senga Makadi K, Trichet J (1984) Role of the mineral matrix during kerogen pyrolysis.
Org Geochem 6:365–382
30. Saxby JD, Chatfield P, Taylor GH, Fitzgerald JD, Kaplan IR, Lu ST (1992) Effect of clay minerals on
products from coal maturation. Org Geochem 18:373–383
31. Fagbemi L, Khezami L, Capart R (2001) Pyrolysis products from different biomasses: application to
the thermal cracking of tar. Appl Energy 69:293–306

Supplementary material
Behavior of PAH/mineral associations during thermodesorption: impact for the
determination of mineral retention properties towards PAHs
Coralie Biache, Catherine Lorgeoux, Alain Saada, Pierre Faure
Control samples
Control samples, i.e. sand and bentonite washed with solvent with no PAH, were analyzed in
thermodesorption mode with cryogenic trap and were heated from 100 to 800 °C at 20 °C/min.
Chromatograms of the control samples did not show any trace of remaining solvent (Figure S1). Two
peaks were above the baseline and were also present on the blank analysis which was done under the
same conditions but with no sample (only the stainless steel cup, Figure S1). They were identified as
polysiloxanes by comparison with the NIST mass spectrum database (Figure S2) and originate from the
column or septa bleeding.
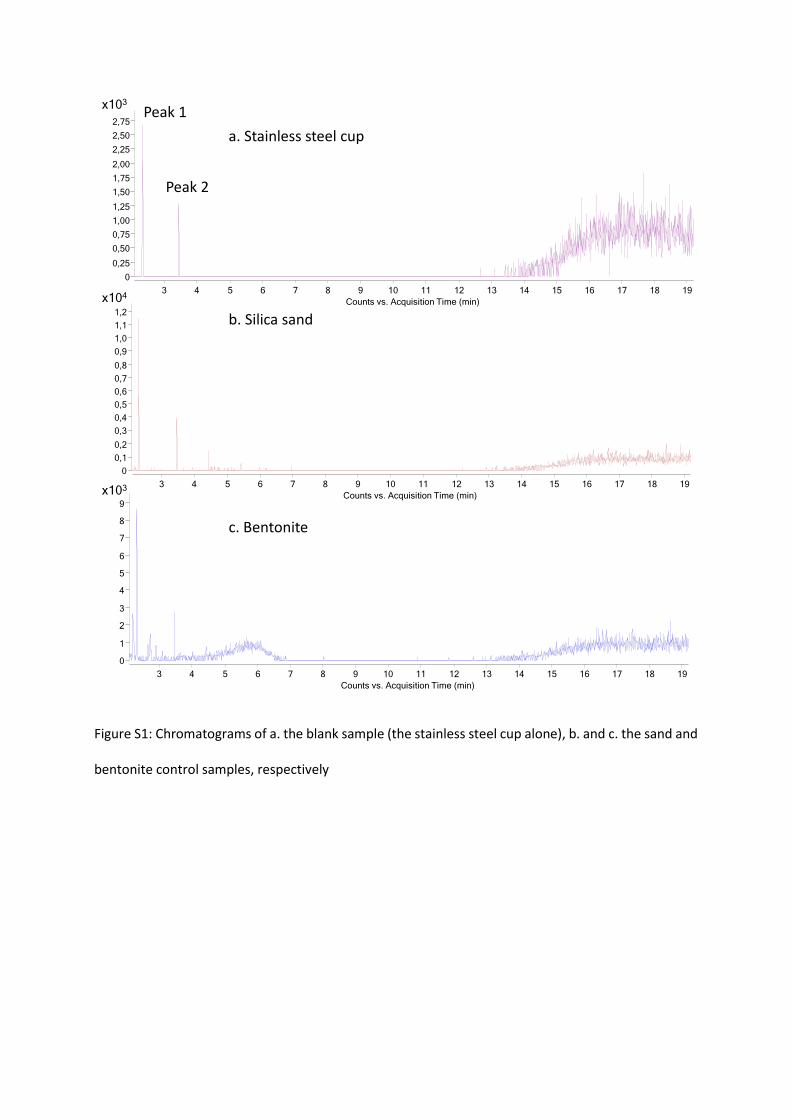
Figure S1: Chromatograms of a. the blank sample (the stainless steel cup alone), b. and c. the sand and
bentonite control samples, respectively
x103
0
0,25
0,50
0,75
1,00
1,25
1,50
1,75
2,00
2,25
2,50
2,75
Counts vs. Acquisition Time (min)
3 4 5 6 7 8 9 10 11 12 13 14 15 16 17 18 19
a. Stainless steel cup
0
0,1
0,2
0,3
0,4
0,5
0,6
0,7
0,8
0,9
1,0
1,1
1,2
Counts vs. Acquisition Time (min)
3 4 5 6 7 8 9 10 11 12 13 14 15 16 17 18 19
x104
b. Silica sand
0
1
2
3
4
5
6
7
8
9
Counts vs. Acquisition Time (min)
3 4 5 6 7 8 9 10 11 12 13 14 15 16 17 18 19
x103
c. Bentonite
Peak 1
Peak 2

Figure S2: Mass spectra of the peak 1 and 2 from the control chromatograms identified as polysiloxanes
by comparison with the NIST mass spectra database
3x10
0
0.25
0.50
0.75
1.00
1.25
1.50
1.75
2.00
2.25
2.50
Counts vs. Mass-to-Charge (m/z)
70 80 90 100 110 120 130 140 150 160 170 180 190 200 210
95.6
190.4132.6 176.4162.468.8 80.2
206.7
a. Peak 1
2x10
0
0.5
1.0
1.5
2.0
2.5
3.0
3.5
4.0
4.5
5.0
Counts vs. Mass-to-Charge (m/z)
70 80 90 100 110 120 130 140 150 160 170 180 190 200 210 220 230 240 250 260 270 280
132.8 264.472.6
280.8b. Peak 2