Renewable Energy from Biogas Ultrasonic technology helps ...

Biogas and Renewable Natural Gas in Ontario: 2019 Market Overview and Outlook
JUNE 2019
2
BIOGAS AND RENEWABLE NATURAL GAS IN ONTARIO: 2019 MARKET OVERVIEW AND OUTLOOK
Acknowledgements The Canadian Biogas Association thanks the Independent Electricity System Operator (IESO) for their support of the Empowering Municipal RNG Market Participation Initiative through the Education and Capacity Building Program.
The Canadian Biogas Association wishes to thank the stakeholders who participated in the Biogas Think Tank sessions that assisted in the development of this document. These included representatives from municipalities, utilities, project developers and owners and consultants.

3
BIOGAS AND RENEWABLE NATURAL GAS IN ONTARIO: 2019 MARKET OVERVIEW AND OUTLOOK
Contents1.0 Foreword: The Growth of Ontario’s Biogas Market 4
Figure 1 – Growth of Ontario Anaerobic Digestion Projects 2007-2016 4
Figure 2 – Biogas & RNG in Canada 5
2.0 Context 7
2.1 The Biogas Sector 7
Figure 3 – Benefits of a Circular Economy: Biogas Sector 8
2.2 Contributors to Growth in Ontario 9
2.3 Establishing a Baseline for Ontario: Facilities 10
Figure 4 – Location of Biogas Operations in Ontario as of January 1, 2019 11
Figure 5 – Number of Biogas Facilities in Ontario as of January 1, 2019 11
2.4 Establishing a Baseline for Ontario: Feedstocks 14
Figure 6 – Organic Waste Processed (excludes biosolids and on-farm waste) at Organic Processing Facilities in Ontario 14
Figure 7 – Residential Food and Organic Waste Processed 2004-2017 14
3.0 Ontario’s Changing Landscape 16
3.1 Made-in-Ontario Environment Plan 16
Table 1 – Municipal Requirements Related to Diversion 17
Table 2 – Diversion Requirements for Multi-Unit Residential Buildings, Commercial and Institutional Buildings that Might be Owned or Serviced by Municipalities 18
Table 3 – Requirements of Service Providers 18
Table 4 – Projected Increase in Source Separation Based on Requirements in the Food and Organic Waste Policy Statement – 2017-2025 19
Figure 8 – Projected Increase in Source Separation Based on Requirements in the Food and Organic Waste Policy Statement – 2017-2025 20
3.2 Clean Fuel Standard 20
4.0 Steps to Success 21
5.0 Vision 24
Figure 9 – Vision for the Biogas Association in Ontario 25
4
BIOGAS AND RENEWABLE NATURAL GAS IN ONTARIO: 2019 MARKET OVERVIEW AND OUTLOOK
1.0 Foreword: The Growth of Ontario’s Biogas Market With an increasing awareness of climate change, an interest to reduce greenhouse gas emissions, and the need for more sustainable waste management practices, biogas facilities are gaining increasing interest as immediate solutions to these significant issues impacting our local communities and businesses.
Over the last decade, Ontario has helped lead the development of the biogas and Renewable Natural Gas (RNG) sectors in Canada. It has grown from a few operations to a proven solution across the province in helping to address some of the most pressing issues from climate change to soil degradation.
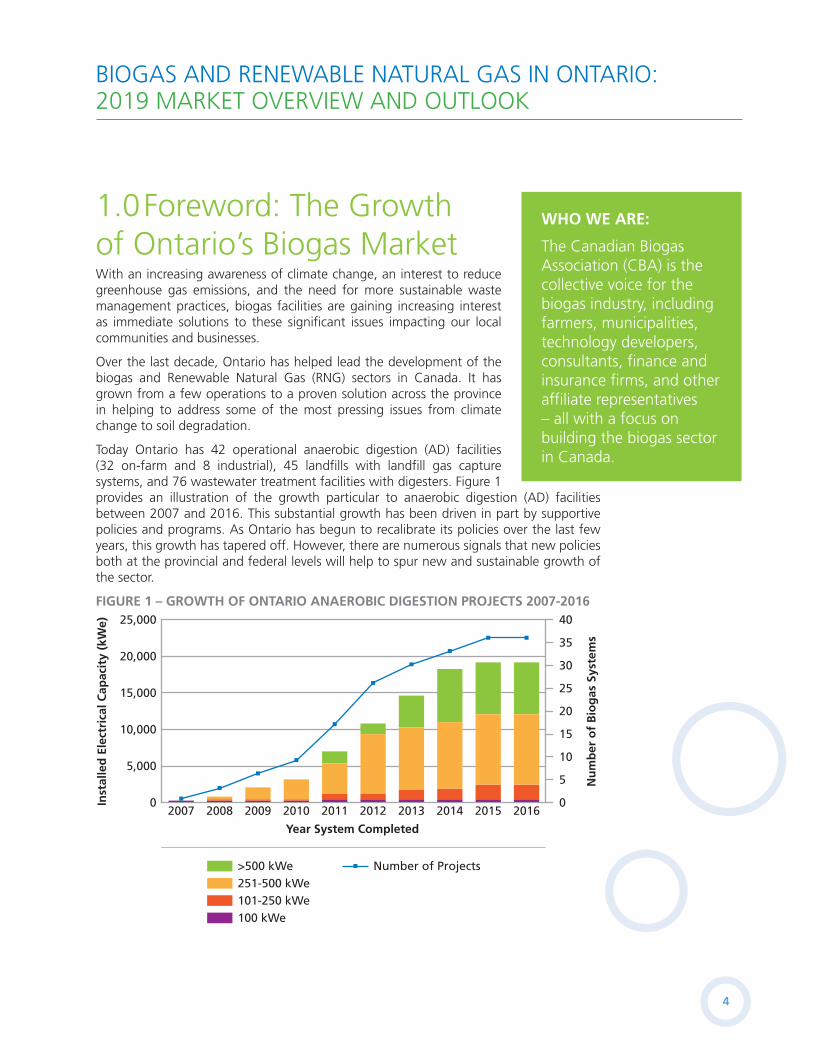
Today Ontario has 42 operational anaerobic digestion (AD) facilities (32 on-farm and 8 industrial), 45 landfills with landfill gas capture systems, and 76 wastewater treatment facilities with digesters. Figure 1 provides an illustration of the growth particular to anaerobic digestion (AD) facilities between 2007 and 2016. This substantial growth has been driven in part by supportive policies and programs. As Ontario has begun to recalibrate its policies over the last few years, this growth has tapered off. However, there are numerous signals that new policies both at the provincial and federal levels will help to spur new and sustainable growth of the sector.
FIGURE 1 – GROWTH OF ONTARIO ANAEROBIC DIGESTION PROJECTS 2007-2016
>500 kWe
02007 2008 2009 2010 2011 2012 2013 2014 2015 2016
0
5
10
15
20
25
30
35
40
5,000
10,000
15,000
20,000
25,000
Inst
alle
d E
lect
rica
l Cap
acit
y (k
We)
Nu
mb
er o
f B
iog
as S
yste
ms
Year System Completed
251-500 kWe101-250 kWe100 kWe
Number of Projects
WHO WE ARE:
The Canadian Biogas Association (CBA) is the collective voice for the biogas industry, including farmers, municipalities, technology developers, consultants, finance and insurance firms, and other affiliate representatives – all with a focus on building the biogas sector in Canada.

5
BIOGAS AND RENEWABLE NATURAL GAS IN ONTARIO: 2019 MARKET OVERVIEW AND OUTLOOK
The biogas and RNG sectors are also seeing new opportunities begin to take shape in other provinces in particular British Columbia, and Québec. Across Canada to date, the biogas sector has demonstrated the technical, financial, logistical and operational capacity with over 60 anaerobic digestion systems, 86 wastewater treatment facilities using anaerobic digestion and 53 landfills with methane collection systems. Figure 2 below illustrates the operational capacity, energy use, and types of biogas and RNG projects in Canada.
FIGURE 2 – 2019 BIOGAS & RNG IN CANADA
Biogas Energy Utilization
Electricity & RNG
RNG
Electricity Only
Heat Only
Heat & Electricity
Operating Biogas and RNG Projects in Canada
&
Biogas and RNG Energy Capacity
Biogas and RNG in Canada
Operational and initiated projects generate:
Agricultural & Food Waste Digesters
WastewaterTreatmentFacilities
Landfill Gas Projects
538661
196 MW
400,000 GJfrom RNG
Greater than
Greater than
Ontario has a significant opportunity to shape the development and utilization of the energy resources as it recalibrates its policy, it can learn from these other jurisdictions, especially with regards to renewable natural gas, combined heat and power systems and transportation fuels. This means providing better support for investment and infrastructure (e.g., reducing regulatory barriers), encouraging value creation (e.g., energy and nutrients), and implementing Ontario’s Food and Organic Waste Policy Statement and a disposal ban.
If all of the new demand created for organics processing facilities by Ontario’s Food and Organic Waste Policy Statement was met through AD facilities, it would mean more than doubling Ontario’s current capacity over the next six years. If Ontario implements a Food and Organic Waste Disposal ban this could easily triple the current capacity.
The focus to date in Ontario has mainly been using biogas to generate electricity but there is significant opportunity to generate RNG. A direct substitute for fossil-based natural gas, RNG could be injected directly into the natural gas grid or used for direct use in any traditional natural gas consuming application. As Ontario continues to move forward to seize new opportunities, it is important to establish a benchmark from which to measure the uptake of biogas and RNG as an alternative, low-carbon energy source.
6
BIOGAS AND RENEWABLE NATURAL GAS IN ONTARIO: 2019 MARKET OVERVIEW AND OUTLOOK
This report is meant to quantify the development of biogas and RNG production facilities in Ontario reflecting on the past, present and future activity in this space. It builds upon a series of workshops used to better understand the current context, existing barriers and the future potential. The data aggregated in this report establishes a baseline of our understanding, which can be expanded and refined in future reports. This report can be used to support policy, program, and regulatory developments and also provide key stakeholders with the data they need to allow the biogas and RNG sector to deliver on its full potential.
Jennifer Green Executive Director Canadian Biogas Association
1Quebec, 2030 Energy Policy Action Plan, 2017
7
BIOGAS AND RENEWABLE NATURAL GAS IN ONTARIO: 2019 MARKET OVERVIEW AND OUTLOOK
2.0 Context This report establishes a baseline for the biogas sector in Ontario to measure against future progress. While continuous efforts are made to better understand certain aspects of the sector, this report offers an initial picture. It identifies current capacities, future needs, and barriers hindering the growth and sustainability of the sector.
Establishing a baseline of good information is imperative to better understand the full market potential of the biogas and RNG sector, the impact of various government policies, regulations and programs, and, the effectiveness of the sector in dealing with various environmental and economic issues.
2.1 THE BIOGAS SECTORBiogas is a renewable fuel used for heat, power and transportation (see Figure 3). It is commonly used around the world to manage materials such as waste and residuals from agricultural and industrial sectors, municipal source separated organics, sewage sludge, and livestock manure.
There has been an increase in interest for standalone biogas facilities that convert organic materials into RNG, referred to as Anaerobic Digestion (AD). The outputs include a nutrient rich soil amendment (i.e., digestate) and a gas (also referred to as biogas) that can be flared or utilized for heat, electricity, fuel or any combination thereof. To date in Ontario, the focus of most AD facilities has been the production of electricity and soil amendments mainly utilized in the agricultural sector.

8
BIOGAS AND RENEWABLE NATURAL GAS IN ONTARIO: 2019 MARKET OVERVIEW AND OUTLOOK
FIGURE 3 – BENEFITS OF A CIRCULAR ECONOMY: ANAEROBIC DIGESTION BIOGAS
Community Benefits of Biogas and Anaerobic Digestion
CommunityResources/ReuseLivestock ManureBiosolids Crop Residues
AnaerobicDigestion Facility
WWTP (WastewaterTreatment Plant)
Sports Fields/Community Gardens
CropsHomes andBuildings
Powering Industry
SSO (SourceSeparated Organics)
Digestate
Renewable Natural Gas,Heat, Electricity
Vehicle FuelGridInjection
Community Infrastructure
Value Added Products
Co-digestion
Food Processing Waste
Residential AgricultureIC&I
(Industrial, Commercial& Institutional)
Local FleetsBuses/Waste
Collection
Did you know?Organic waste is usually processed close to the point of generation with the nutrients and clean energy being directly utilized by the local community, boosting the economy and ensuring sustainability.
Co-digestion: A process where energy-rich organic waste materials are added to wastewater digesters with excess capacity. A primary benefit of co-digestion is that is uses existing infrastructure to divert food waste to recover resources.
Anaerobic Digestion: A biological process that breaks down organics matter in an oxygen-free environment to create biogas.
Value Added Products: Recovering resources out of materials typically considered waste to create additional beneficial products.
Renewable Natural Gas (RNG): Biogas can be upgraded to RNG. RNG is carbon neutral and interchangeable with conventional natural gas
Digestate: Digestate is the product that comes from the anaerobic digestion of organic material and is a nutrient-rich slurry that can be used as a soil amendment, compost and fertilizer to recycle nutrients.

9
BIOGAS AND RENEWABLE NATURAL GAS IN ONTARIO: 2019 MARKET OVERVIEW AND OUTLOOK
Growth in the biogas market has been driven by an increasing focus toward decarbonizing the energy sector, supported by various government policies, regulations and programs. Benefits to promoting the use of biogas include:
• Producing renewable energy (e.g., electricity and RNG);
• Reducing greenhouse gas emissions;
• Mitigating pollution risks (e.g., water, soil and air); and
• Driving investment and jobs including diversifying farm revenue; and
• Reducing odours and pathogens.
Specifically, an increase in AD capacity can also help with a variety of other issues including:
• Preserving landfill capacity;
• Driving investment and jobs including diversifying farm revenue; and
• Improving soil health (i.e., returning nutrients back to the land, increasing crop yields).
With the release of a number of new provincial government documents including the Made-In-Ontario Environment Plan, the Discussion Paper on Reducing Litter and Waste in Our Communities1, and Ontario’s Agricultural Soil Health and Conservation Strategy2, it is clear these remain priorities and will drive continued government support of the biogas sector as an important solution for years to come.
The federal government has played a lesser role to date in the development of the sector however, conversations continue related to carbon pricing and climate change policies such as the Clean Fuels Standards which are expected to align with the further development of the biogas sector.
2.2 CONTRIBUTORS TO GROWTH IN ONTARIOOntario’s biogas market has largely developed over the last decade. There are several exceptions with early landfill gas to energy projects in the City of Toronto and wastewater treatment facilities that have been using AD technology for some time. Most of these early projects were generally flaring the gases, however.
The following Ontario government policies, regulations and programs have had a significant role in shaping the current market:
• In 2006, the Ontario Power Authority (OPA) launched the Renewable Energy Standard Offer Program (RESOP) offering stable pricing under a 20-year contract for renewable energy projects.
• In 2006, an agreement was signed between major municipalities in Ontario and Michigan to stop shipments of municipal waste by the end of 2010. This agreement helped incent many Ontario municipalities to implement curbside green bin programs to preserve local landfill capacity.
1Available at https://prod-environmental-registry.s3.amazonaws.com/2019-03/Reducing%20Litter%20and%20 Waste%20in%20Our%20Communities%20Discussion%20Paper_0.pdf.2Available at http://www.omafra.gov.on.ca/english/landuse/soil-strategy.pdf.
DID YOU KNOW...
of organic waste annually,with only
Ontario generates3.7 million tonnes
38%
being diverted through compost and
anaerobic digestion facilities.Landfilled organic materials
emit methane –
25x the warming potential of CO2
10
BIOGAS AND RENEWABLE NATURAL GAS IN ONTARIO: 2019 MARKET OVERVIEW AND OUTLOOK
• In 2008, O. Reg. 232/98 under the Environmental Protection Act, R.S.O. 1990 was amended to require new, expanding or operating landfills larger than 1.5 million cubic metres to include landfill gas collection and flaring or use. These requirements were also accompanied by $10 million in provincial funding for municipalities to aid in the implementation of landfill gas capture systems.
• In 2009, Ontario’s Feed-In Tariff Program under the Ontario Green Energy Act was launched providing a fixed tariff for electricity produced and fed into the grid.
• In 2013, O. Reg. 267/03 under the Nutrient Management Act, 2002 was amended to allow on-farm anaerobic digestion facilities to accept up to 50% off-farm organic or 10,000 tonnes of certain off-farm materials without the need to seek an Environmental Compliance Approval.
There have also been various provincial and federal funding programs during this period.
The combination of these policies and programs successfully drove significant investments into Ontario’s biogas sector over the last decade.
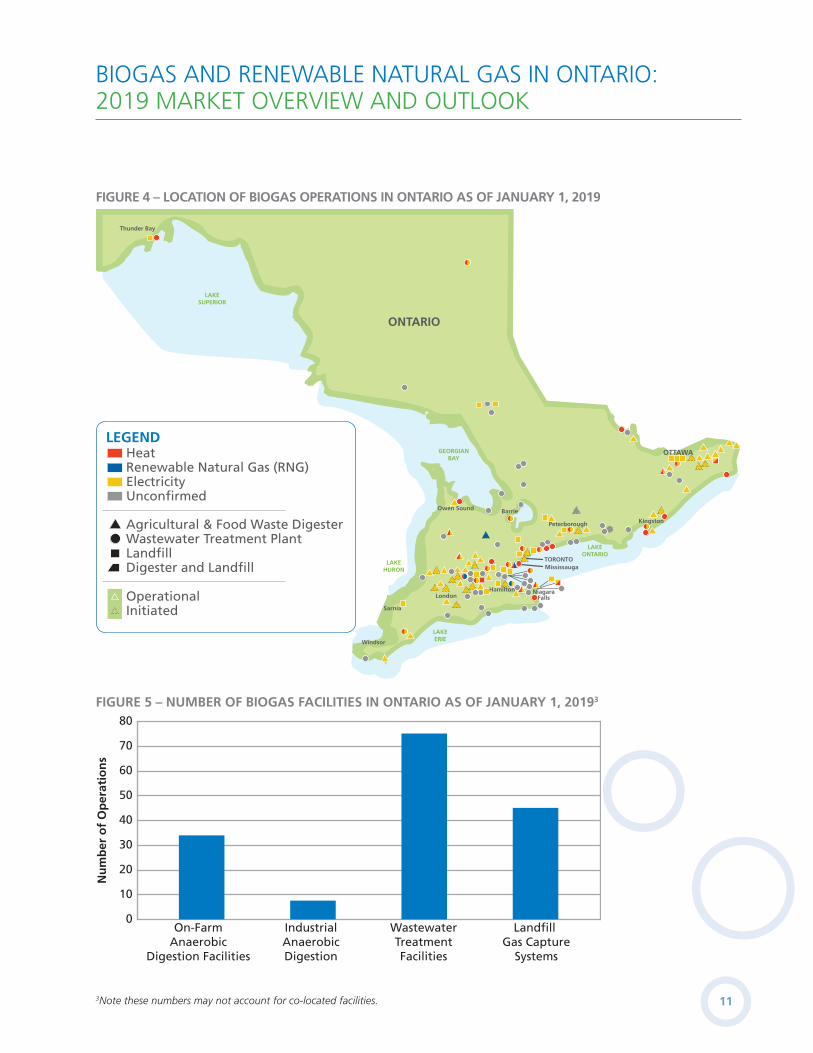
2.3 ESTABLISHING A BASELINE FOR ONTARIO: FACILITIES At the beginning of 2019, Ontario had over a hundred operational biogas facilities (see Figures 4 and 5) which includes:
• 34 on-farm anaerobic digestion facilities, which process agricultural wastes, residuals, and manure, and also accept off-farm organics wastes.
• 8 industrial anaerobic digestion facilities, which tend to be larger than on-farm facilities and process waste and residuals from the industrial sector, and municipal source separated organics.
• 76 wastewater treatment facilities that process sewage sludge and have the potential to process other organic wastes and residuals.
• 45 Landfill gas capture systems that capture biogas from larger landfill sites.
11
BIOGAS AND RENEWABLE NATURAL GAS IN ONTARIO: 2019 MARKET OVERVIEW AND OUTLOOK
FIGURE 4 – LOCATION OF BIOGAS OPERATIONS IN ONTARIO AS OF JANUARY 1, 2019
ONTARIO
GEORGIANBAY
LAKESUPERIOR
LAKEHURON
LAKEERIE
LAKEONTARIO
TORONTOMississauga
Barrie
Thunder Bay
London
Sarnia
Owen Sound
Windsor
KingstonPeterborough
NiagaraFalls
Hamilton
OTTAWAHeatRenewable Natural Gas (RNG)ElectricityUnconfirmed
Agricultural & Food Waste DigesterWastewater Treatment PlantLandfillDigester and Landfill
LEGEND
OperationalInitiated
FIGURE 5 – NUMBER OF BIOGAS FACILITIES IN ONTARIO AS OF JANUARY 1, 20193
0
10
20
30
40
50
60
70
80
On-FarmAnaerobic
Digestion Facilities
IndustrialAnaerobicDigestion
WastewaterTreatmentFacilities
Landfill Gas Capture
Systems
Nu
mb
er o
f O
per
atio
ns
3Note these numbers may not account for co-located facilities.

12
BIOGAS AND RENEWABLE NATURAL GAS IN ONTARIO: 2019 MARKET OVERVIEW AND OUTLOOK
Anaerobic Digestion Facilities
The 42 operational AD facilities in Ontario have the ability to process over 600,000 tonnes of off-farm organic waste annually and over 300,000 tonnes of on-farm manures and residuals. These facilities currently process over 450,000 tonnes of organic waste per year4 (equivalent to the weight of nearly four CN towers) and over 300,000 tonnes of on-farm manures and agricultural residuals with a contracted energy capacity of approximately 12 MW.
• On-Farm Anaerobic Digestion Facilities Ontario currently has 34 operational on-farm AD operations. These on-farm facilities have the technical ability to process just over 200,000 tonnes of off-farm organic waste annually5 (i.e., food processing waste) and over 300,000 tonnes of on-farm materials (i.e., manure and crop residuals).6 Most of these facilities are operating at capacity and all generating electricity or have combined heat and power systems.
• Industrial Anaerobic Digestion Facilities There are currently 8 operational industrial anaerobic digestion facilities in Ontario.7 These industrial facilities have the capacity to technically process over 400,000 tonnes of organic waste.8 Most of these facilities are operating at capacity. The focus of most of these facilities have been on generating electricity however three of these facilities are currently moving towards the generation of renewable natural gas.
These facilities help to reduce GHG emissions in the province by over 216,000 tonnes of eCO
2, equivalent to taking over 43,000 cars off the road.9 Based on a 1 to 0.7 ratio10
of feedstock to digestate, these facilities are producing roughly 780,000 tonnes of digestate that is returned back to the land to return nutrients and improve soil health.
There are currently 10 facilities (7 on-farm and 3 industrial), in addition to those operational facilities, in various stages of development. If built, they could increase processing capacity by 150,000 tonnes of organic waste annually. These ‘initiated’ facilities have an energy contract with the Provincial government or are in the midst of the approval process as of the beginning of 2019. It is important to note some projects may not materialize due to difficulty in obtaining project financing or regulatory approval. There are also several operational facilities in the process of increasing their capacity.
4Ontario Waste Management Association. “State of Waste in Ontario: Organics Report,” 2017. Available at https://www.owma.org/articles/state-of-waste-in-ontario-organics-report-second-annual-report. 5Ibid. 6Information from the Ontario Ministry of Agriculture, Food and Rural Affairs on May 15, 2019.7This includes one facility that is offline and one that is in the operational start-up phase.8Ontario Waste Management Association. “State of Waste in Ontario: Organics Report,” 2017. Available at https://www.owma.org/articles/state-of-waste-in-ontario-organics-report-second-annual-report. 9Cars are estimated to emit 5 tonnes of eCO
2 and the tCO
2e/tonne diverted is 0.48.
10Data is currently not captured related to digestate generation. Every facility will have a different input to output ratio. The ratio utilized is meant to take into account some operations that dewater digestate

13
BIOGAS AND RENEWABLE NATURAL GAS IN ONTARIO: 2019 MARKET OVERVIEW AND OUTLOOK
Wastewater Treatment Facilities
In 2019, Ontario has 76 operational wastewater treatment facilities (of 486) that employ anaerobic digestion. The data for these facilities is still rudimentary but at least 17 of these facilities are currently utilizing biogas to generate heat, energy or a combination of the two instead of simply flaring the gas generated.11 Generally, the biogas potential generated from biosolids alone is low and wastewater treatment facilities are typically designed based on population size. These factors can limit the amount of electricity or renewable natural gas that can be produced by wastewater facilities. However, accepting source-separated organics for co-digestion with biosolids at a wastewater facility can greatly enhance gas generation and increase opportunities for electricity or renewable natural gas generation.
There is a growing interest by municipalities in Ontario to move in this direction, allowing them to address organics processing needs using existing digester capacity. Stratford is in the process of upgrading their wastewater facility to allow for co-digestion and a 2017 report by the Environmental Commissioner of Ontario12 discussed the value proposition, as well as, the need for the Province to simplify the regulatory approvals process for energy recovery systems associated with anaerobic digestion at wastewater treatment plants, including systems that co-digest off-site organics.
Landfill Gas Capture Systems
In 2019, Ontario had 45 landfills (of 805 operational landfills)13 that have landfill gas collection systems in place. The economics to implement these systems are dependent on the size of the landfill, the amount of waste in place that is producing methane and the amount of waste that is disposed on an annual basis. Of the 45 landfills that currently have landfill gas collection systems in place, 23 are flaring the gas. The remaining 22 are generating energy with two of these systems providing fuel to nearby industries. There is a growing interest for those flaring the gas to either produce renewable natural gas or electricity. The barriers to date have been economic and logistical (i.e., distance to the electricity or gas grid).
At an efficiency rate between 60% to 75%14, it is estimated that these landfills help to reduce emissions by at least 2.8 - 3.5 megatonnes tonnes of eCO
2 of the total
8 megatonnes generated by all landfills.15,16 They have an electricity generation capacity of roughly 65 MW.
11Based on internal research undertaken by the Canadian Biogas Association.12Environmental Commissioner of Ontario. “Every Drop Counts: Reducing the Energy and Climate Footprint of Ontario’s Water Use,” 2017. Available at http://docs.assets.eco.on.ca/reports/energy/2016-2017/Every-Drop-Counts.pdf. 13Ontario Waste Management Association. “State of Waste in Ontario: Landfill Report,” 2019. Available at https://www.owma.org/articles/2019-owma-landfill-report. 14Note large landfills with gas collection systems can achieve rates of 85% landfill gas capture.15GHD. “Cap-and-Trade Research for Ontario’s Waste Management Sector,” 2016.16Environmental Commissioner of Ontario. “Beyond the Box: Ontario’s Fresh Start on Waste Diversion and the Circular Economy,” 2017.
14
BIOGAS AND RENEWABLE NATURAL GAS IN ONTARIO: 2019 MARKET OVERVIEW AND OUTLOOK
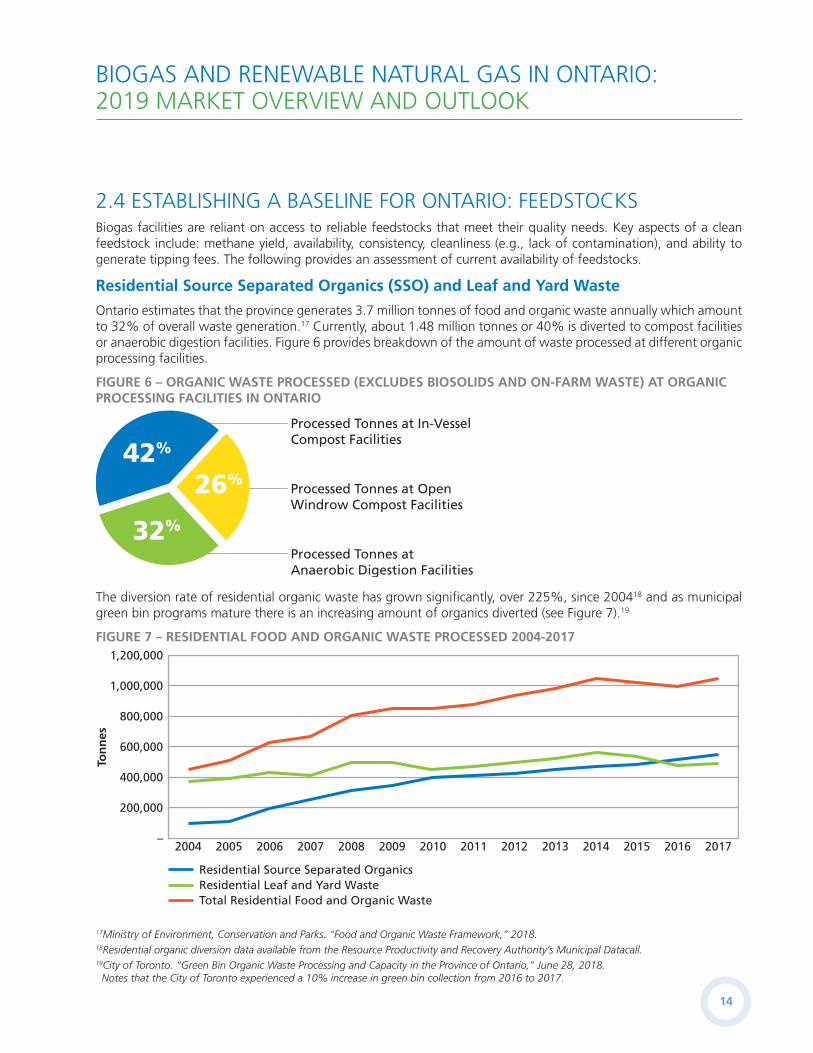
2.4 ESTABLISHING A BASELINE FOR ONTARIO: FEEDSTOCKSBiogas facilities are reliant on access to reliable feedstocks that meet their quality needs. Key aspects of a clean feedstock include: methane yield, availability, consistency, cleanliness (e.g., lack of contamination), and ability to generate tipping fees. The following provides an assessment of current availability of feedstocks.
Residential Source Separated Organics (SSO) and Leaf and Yard Waste
Ontario estimates that the province generates 3.7 million tonnes of food and organic waste annually which amount to 32% of overall waste generation.17 Currently, about 1.48 million tonnes or 40% is diverted to compost facilities or anaerobic digestion facilities. Figure 6 provides breakdown of the amount of waste processed at different organic processing facilities.
FIGURE 6 – ORGANIC WASTE PROCESSED (EXCLUDES BIOSOLIDS AND ON-FARM WASTE) AT ORGANIC PROCESSING FACILITIES IN ONTARIO
Processed Tonnes at In-Vessel Compost Facilities
Processed Tonnes at Open Windrow Compost Facilities
Processed Tonnes at Anaerobic Digestion Facilities
42%
26%
32%
The diversion rate of residential organic waste has grown significantly, over 225%, since 200418 and as municipal green bin programs mature there is an increasing amount of organics diverted (see Figure 7).19
FIGURE 7 – RESIDENTIAL FOOD AND ORGANIC WASTE PROCESSED 2004-2017
–2007200620052004 2008 2009 2010 2011 2012 2013 2014 2015 2016 2017
200,000
400,000
600,000
800,000
1,000,000
1,200,000
Ton
nes
Residential Source Separated OrganicsResidential Leaf and Yard WasteTotal Residential Food and Organic Waste
17Ministry of Environment, Conservation and Parks. “Food and Organic Waste Framework,” 2018.18Residential organic diversion data available from the Resource Productivity and Recovery Authority’s Municipal Datacall. 19City of Toronto. “Green Bin Organic Waste Processing and Capacity in the Province of Ontario,” June 28, 2018. Notes that the City of Toronto experienced a 10% increase in green bin collection from 2016 to 2017.

15
BIOGAS AND RENEWABLE NATURAL GAS IN ONTARIO: 2019 MARKET OVERVIEW AND OUTLOOK
ICI Source Separated Organics
Similar data for industrial, commercial and institutional (ICI) food and organic waste is not available however it is believed that about 440,000 tonnes of a total of 1,621,500 tonnes of food organic and organic waste generated annually from these sectors is diverted to organic processing facilities.20 Drivers for this growth include: corporate social responsibility, government policies and regulation, and economics.
Agricultural Sources
The agricultural sector can produce biogas from animal manures, crop residues and purpose grown energy crops. Currently on-farm facilities mainly process manure and crop residuals, with few currently using purpose grown energy crops. Over 300,000 tonnes of on-farm materials (e.g., manure and crop residuals)21 is currently processed at on-farm facilities. Based on the work undertaken in the Canadian Biogas Study: Benefits to the Economy, Environment and Energy, 2013, this represents a fraction of the available manure and agricultural residuals.
Landfills Gas Capture
The data related to the efficiency of landfill gas capture systems and the potential for new landfill gas capture systems is also not well understood. Based on the National Inventory Report 1990-2015, there appears to be opportunity as Ontario produced over 7 megatonnes of CO
2e (mostly from methane) from landfills. There is also opportunity
to generate energy from the 23 landfills with gas capture systems that are currently flaring gas. Many of these landfills are currently investigating opportunities to generate renewable natural gas.
Biosolids from Wastewater Treatment Facilities
The most thorough assessment to date of the potential capacity of existing anaerobic digesters at wastewater facilities to accept other organics has been done by the Southern Ontario Water Consortium (SOWC).22 The report by the SOWC identifies substantial opportunities to increase capacity if secondary digesters were upgraded or innovative pre-treatment technologies were implemented. The report noted that capacity could increase by a total of almost 100,000 tonnes of volatile solids/year if secondary digesters were upgraded, or 110,000 tonnes volatile solids/year (approximately 30%) through deploying innovative pre-treatment technologies. This represents significant potential for processing additional organic wastes at these facilities. The report also noted that anaerobic digestion capacity is well distributed: there is at least one WWTP with an AD process in each MPAC region of the province.
Additional data and regional analysis would better quantify future opportunities.
20Ministry of Environment, Conservation and Parks. “Food and Organic Waste Framework,” 2018.21Information from the Ontario Ministry of Agriculture, Food and Rural Affairs on May 15, 2019.22Latest reports by the Southern Ontario Water Consortium are available at https://sowc.ca/boardcommittees/biosolids-working-group/.

16
BIOGAS AND RENEWABLE NATURAL GAS IN ONTARIO: 2019 MARKET OVERVIEW AND OUTLOOK
3.0 Ontario’s Changing LandscapeThe policy landscape in Ontario has changed since publishing Renewable Natural Gas Developments in Ontario: an Evolving Outlook in 2017. However, policy initiatives have been announced that will support biogas growth in Ontario. A summary of these proposed initiatives as they are understood to date, and how they relate to building an RNG market in Ontario are described below. The Canadian Biogas Association hosted three in-person seminars to bring awareness to these integrated topics and specifically the relevance for RNG adoption.
3.1 MADE-IN-ONTARIO ENVIRONMENT PLANVoluntary Renewable Natural Gas Program
To achieve the action of increasing access to clean and affordable energy for families, the Made-in-Ontario Environment Plan includes an initiative to implement a voluntary renewable natural gas option for customers to be administered by the natural gas utility, Enbridge Gas Inc.
Select jurisdictions in North America including British Columba, Vermont and Michigan offer voluntary RNG programs through the local natural gas utility for residential and commercial customers. The program is available to customers who choose to participate to reduce GHG emissions by purchasing RNG at a premium. Refer to CBA’s Introduction to Voluntary RNG Programs in North America reference sheet to learn about common program elements and examples from other jurisdictions.
It is unclear yet what the degree of participation would occur in Ontario with a voluntary program. However, if all provincial government buildings were to use renewable natural gas that would be equivalent to ten AD facilities each processing 55,000 tonnes of source separated organics annually.23 Similar steps could also be taken related to government fleets including public transit and waste collection.
Reducing Litter and Waste in Our Communities
The latest discussion paper entitled “Reducing Litter and Waste in Our Communities”, released by Ontario’s Ministry of Environment, Conservation and Parks in March 2019, re-commits to the requirements established in the Food and Organic Waste Policy Statement. The Policy Statement provides direction to entities that generate, manage or oversee food waste and organic waste (e.g., organic waste from food preparation and soiled paper), including municipalities, multi-unit residential building owners, private waste management providers, industry, commercial entities and institutions that generate larger volumes of organic waste.
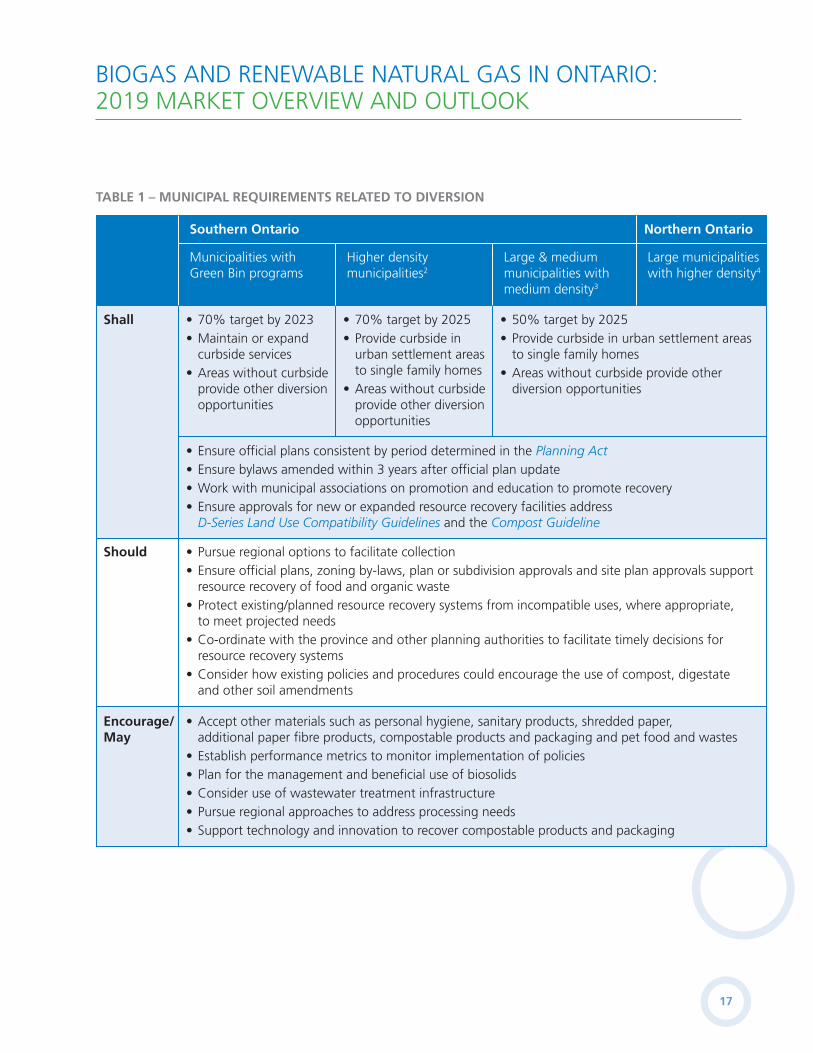
The language used is aligned with Planning Act requirements (i.e., “Shall” = clear direction; “Should” = moderate direction; “Encourage” or “May” = minimal direction). Tables 1-3 refer to requirements related to the AD sector. For all requirements including additional details please refer to the Food an Organic Waste Policy Statement, which is available on the Ministry of Environment, Conservation and Park’s website.
23Based on the Ontario government 2015 Energy consumption and greenhouse gas emission report available at https://www.ontario.ca/page/2015-energy-consumption-and-greenhouse-gas-emission-report. The government uses the 355,024,880 equivalent kilowatt hours of natural gas a year in government buildings (236,683,253*1.5). That is equivalent to 31.9 million cubic metres of natural gas based on the following conversion – https://www.businessenergy.com/business-gas/gas-bill-calculator/.
17
BIOGAS AND RENEWABLE NATURAL GAS IN ONTARIO: 2019 MARKET OVERVIEW AND OUTLOOK
TABLE 1 – MUNICIPAL REQUIREMENTS RELATED TO DIVERSION
Southern Ontario
Shall
Should
Encourage/May
Municipalities with Green Bin programs
Higher density municipalities2
Large & medium municipalities with medium density3
Large municipalities with higher density4
• 70% target by 2023• Maintain or expand curbside services• Areas without curbside provide other diversion opportunities
• Ensure official plans consistent by period determined in the Planning Act• Ensure bylaws amended within 3 years after official plan update• Work with municipal associations on promotion and education to promote recovery• Ensure approvals for new or expanded resource recovery facilities address D-Series Land Use Compatibility Guidelines and the Compost Guideline
• Pursue regional options to facilitate collection• Ensure official plans, zoning by-laws, plan or subdivision approvals and site plan approvals support resource recovery of food and organic waste• Protect existing/planned resource recovery systems from incompatible uses, where appropriate, to meet projected needs• Co-ordinate with the province and other planning authorities to facilitate timely decisions for resource recovery systems• Consider how existing policies and procedures could encourage the use of compost, digestate and other soil amendments
• Accept other materials such as personal hygiene, sanitary products, shredded paper, additional paper fibre products, compostable products and packaging and pet food and wastes• Establish performance metrics to monitor implementation of policies• Plan for the management and beneficial use of biosolids• Consider use of wastewater treatment infrastructure• Pursue regional approaches to address processing needs• Support technology and innovation to recover compostable products and packaging
• 70% target by 2025• Provide curbside in urban settlement areas to single family homes• Areas without curbside provide other diversion opportunities
• 50% target by 2025• Provide curbside in urban settlement areas to single family homes• Areas without curbside provide other diversion opportunities
Northern Ontario
18
BIOGAS AND RENEWABLE NATURAL GAS IN ONTARIO: 2019 MARKET OVERVIEW AND OUTLOOK
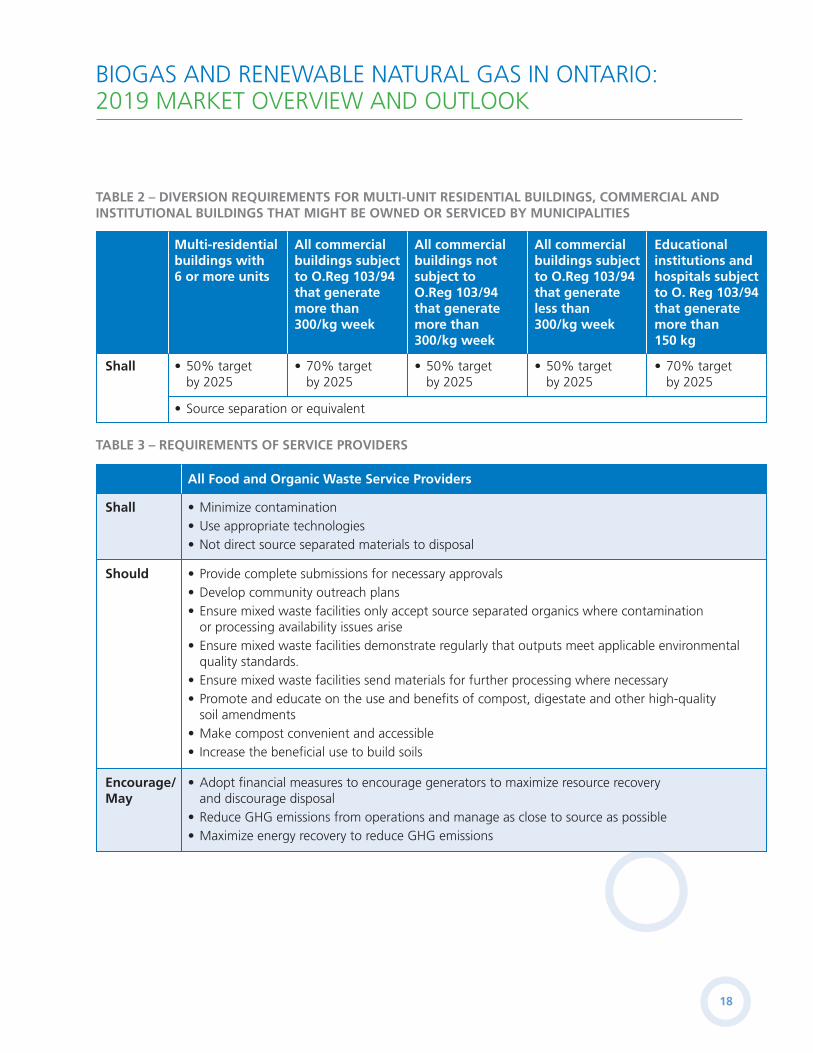
TABLE 3 – REQUIREMENTS OF SERVICE PROVIDERS
TABLE 2 – DIVERSION REQUIREMENTS FOR MULTI-UNIT RESIDENTIAL BUILDINGS, COMMERCIAL AND INSTITUTIONAL BUILDINGS THAT MIGHT BE OWNED OR SERVICED BY MUNICIPALITIES
Shall • 50% target by 2025
• Source separation or equivalent
• 70% target by 2025
• 50% target by 2025
• 50% target by 2025
• 70% target by 2025
Multi-residential buildings with 6 or more units
All commercial buildings subject to O.Reg 103/94 that generate more than 300/kg week
All commercial buildings not subject to O.Reg 103/94 that generate more than 300/kg week
All commercial buildings subject to O.Reg 103/94 that generate less than 300/kg week
Educational institutions and hospitals subject to O. Reg 103/94 that generate more than 150 kg
Shall
All Food and Organic Waste Service Providers
• Minimize contamination• Use appropriate technologies• Not direct source separated materials to disposal
• Provide complete submissions for necessary approvals• Develop community outreach plans• Ensure mixed waste facilities only accept source separated organics where contamination or processing availability issues arise• Ensure mixed waste facilities demonstrate regularly that outputs meet applicable environmental quality standards.• Ensure mixed waste facilities send materials for further processing where necessary• Promote and educate on the use and benefits of compost, digestate and other high-quality soil amendments• Make compost convenient and accessible• Increase the beneficial use to build soils
• Adopt financial measures to encourage generators to maximize resource recovery and discourage disposal• Reduce GHG emissions from operations and manage as close to source as possible• Maximize energy recovery to reduce GHG emissions
Should
Encourage/May

19
BIOGAS AND RENEWABLE NATURAL GAS IN ONTARIO: 2019 MARKET OVERVIEW AND OUTLOOK
Based on targets established in the Food and Organic Waste Policy there are a number of municipalities that will be required to implement new organics programs and meet targets by 2025. This includes the following Ontario municipalities:
• London
• Essex-Windsor
• Brantford
• City of Peterborough
• Sarnia
• Chatham-Kent
• Kawartha Lakes
• Norfolk County
• Cornwall
• Woodstock
• Stratford
• Brockville
• Owen Sound
• Cobourg
• Thunder Bay
• Sault Ste Marie
If each of these municipalities were to collect 120kg to 150kg per household,24 it would mean an additional 86,500 to 105,000 tonnes of residential source separated organics that will need processing by 2025. For those municipalities already operating green bin programs, if these programs increase collection by 2.5% per year due to population increases, increased diversion from multi-unit residential and program maturity, it will increase the amount of residential source separated organics by over 200,000 tonnes that will need processing by 2025.
Given the lack of robust data related to the ICI sector, it is difficult to predict the impacts related to the targets in the Food and Organic Waste Policy Statement. If the diversion rate doubles based on current diversion rates, there would be an increase in the amount of ICI sector source separated organics collected by 418,000 tonnes.
Table 4 provides a breakdown of the additional tonnes of source separated organics that would be collected and require processing.
TABLE 4 – PROJECTED INCREASE IN SOURCE SEPARATION BASED ON REQUIREMENTS IN THE FOOD AND ORGANIC WASTE POLICY STATEMENT – 2017-2025
Requirements in Food & Organic Waste Policy Statement
Amount of Additional Tonnes of SSO Captured by 2025
Current Performance25
Municipalities without Green Bin Programs
95,500 0
Improvements in capture rates of current Green Bin programs
106,000 546,000
Industrial, Commercial and Institutional Sectors
418,000 400,000
Total 619,500 946,000
Figure 8 provides a projection related to an incremental increase in the amount of source separated organics (i.e., does not include leaf and yard waste) related to the targets in the Food and Organic Waste Policy Statement.
24Based on 2017 RPRA Datacall for household organic waste.25Based on data from Ontario’s Food and Organic Waste Framework (https://www.ontario.ca/page/food-and-organic-waste-framework) and 2017 RPRA Datacall for household organic waste.
20
BIOGAS AND RENEWABLE NATURAL GAS IN ONTARIO: 2019 MARKET OVERVIEW AND OUTLOOK
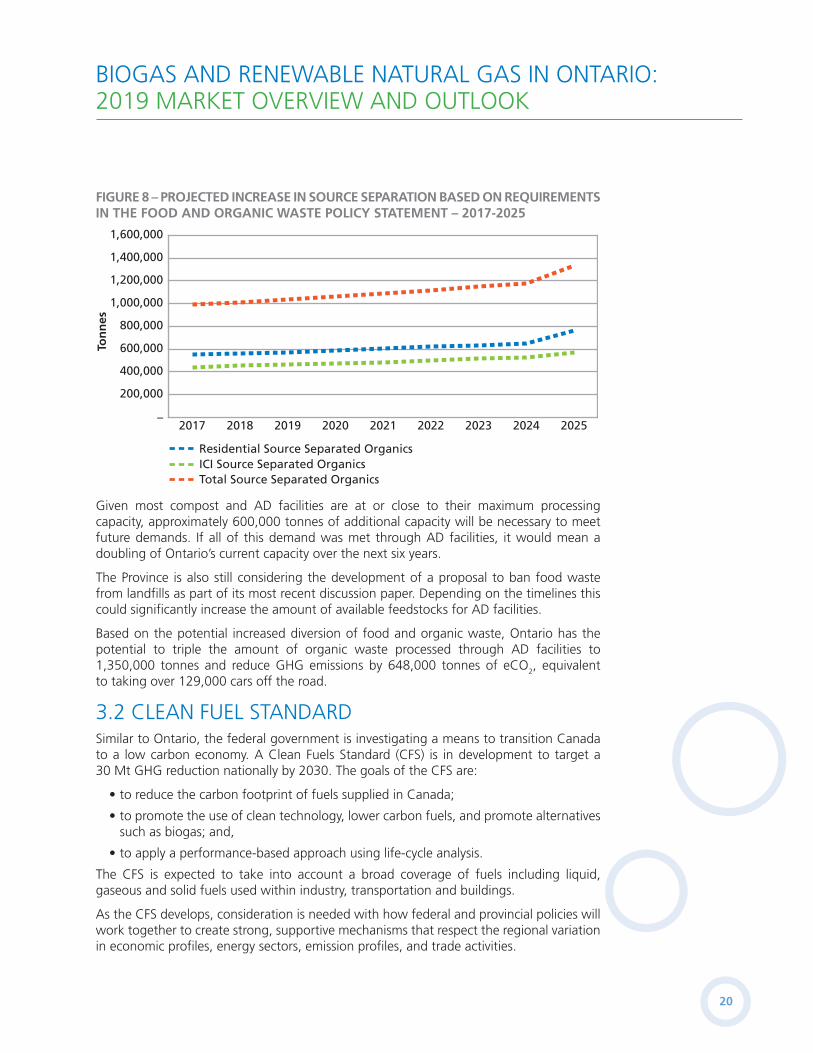
FIGURE 8 – PROJECTED INCREASE IN SOURCE SEPARATION BASED ON REQUIREMENTS IN THE FOOD AND ORGANIC WASTE POLICY STATEMENT – 2017-2025
–2020201920182017 2021 2022 2023 2024 2025
200,000
400,000
600,000
800,000
1,000,000
1,200,000
1,400,000
1,600,000
Ton
nes
Residential Source Separated OrganicsICI Source Separated OrganicsTotal Source Separated Organics
Given most compost and AD facilities are at or close to their maximum processing capacity, approximately 600,000 tonnes of additional capacity will be necessary to meet future demands. If all of this demand was met through AD facilities, it would mean a doubling of Ontario’s current capacity over the next six years.
The Province is also still considering the development of a proposal to ban food waste from landfills as part of its most recent discussion paper. Depending on the timelines this could significantly increase the amount of available feedstocks for AD facilities.
Based on the potential increased diversion of food and organic waste, Ontario has the potential to triple the amount of organic waste processed through AD facilities to 1,350,000 tonnes and reduce GHG emissions by 648,000 tonnes of eCO
2, equivalent
to taking over 129,000 cars off the road.
3.2 CLEAN FUEL STANDARDSimilar to Ontario, the federal government is investigating a means to transition Canada to a low carbon economy. A Clean Fuels Standard (CFS) is in development to target a 30 Mt GHG reduction nationally by 2030. The goals of the CFS are:
• to reduce the carbon footprint of fuels supplied in Canada;
• to promote the use of clean technology, lower carbon fuels, and promote alternatives such as biogas; and,
• to apply a performance-based approach using life-cycle analysis.
The CFS is expected to take into account a broad coverage of fuels including liquid, gaseous and solid fuels used within industry, transportation and buildings.
As the CFS develops, consideration is needed with how federal and provincial policies will work together to create strong, supportive mechanisms that respect the regional variation in economic profiles, energy sectors, emission profiles, and trade activities.

21
BIOGAS AND RENEWABLE NATURAL GAS IN ONTARIO: 2019 MARKET OVERVIEW AND OUTLOOK
4.0 Steps to Success Policies in development at the provincial and national level could help to support the development of RNG projects and establish an RNG market in Ontario. The Canadian Biogas Association convened three Biogas Think Tank sessions of industry stakeholders in 2018 and 2019. The objective of these sessions was to discuss incoming policies and the challenges and opportunities it presents for RNG project implementation. During these discussions that helped with the creation of this report, participants identified the following broad actions to support broader biogas/RNG development:
• Support investment and infrastructure to better collect and divert organic waste The biogas sector understands the importance of proper stable regulation to guide the development and operations of biogas and RNG projects in Ontario. The existing regulatory framework however poses many unnecessary burdens related to developing projects that involve excessive time commitments and expending large amounts of government resources on activities that do not bear value. There are opportunities for improvements in how resources are used to achieve results much more effectively and efficiently without hindering important new investments. Necessary changes include:
o Modernize environmental approvals: Cutting regulatory red tape and modernizing environmental approvals are essential to support sustainable end markets for waste and new waste processing infrastructure. The Environmental Activity and Sector Registry (EASR) provides a means to address many low risk activities in the biogas and RNG sector. Temporary regulatory exemptions or simplified approval process for demonstration and pilot projects would also be helpful
o Re-evaluate On-Farm Anaerobic Digestion Facility Allowances: It has been over five years since changes were made to allow on-farm anaerobic digestion facilities to accept up to 50% or 10,000 m3/year of certain off-farm organic waste materials (O. Reg 267/03). In December 2018, the CBA engaged with Ontario Ministry of Agriculture Food and Rural Affairs to discuss possible improvements to the Nutrient Management Regulation specifically related to increasing the limit of off-farm material to 20,000 m3/year. Existing facilities have been well run and offer substantial opportunities to diversify farm revenue and return nutrients directly back to the land.
o Improve Land Use Planning: There is a need to improve coordination of land use planning and environmental approval processes by updating ministry guidelines (i.e., the D-Series Guideline) to help municipalities avoid the impacts of conflicting land uses. To support resource recovery, creating and protecting land with suitable land use planning designation and zoning are critical. This should include flooding, stormwater management, and other climate impacts and measures that would minimize or prevent disasters and insurance claims in the province. This can also include land use changes to facilitate industrial developments in areas that could provide microgrids or district heating for communities.

22
BIOGAS AND RENEWABLE NATURAL GAS IN ONTARIO: 2019 MARKET OVERVIEW AND OUTLOOK
o New Approach to Financial Assurance: The current Financial Assurance approach in Ontario ties up substantial amounts of capital (i.e., $200 million) and unnecessarily hinders investment and infrastructure growth in Ontario. The CBA recommends amending the current Financial Assurance Guideline to adopt a pooled financial assurance model for biogas facility operators. This approach unlocks this stranded capital and would allow the private sector to more readily invest in the ongoing resilience of the sector. A pooled financial assurance model may allow for a blend of instruments such as insurance.
• Encourage value creation
For the biogas sector, we have the ability to not only capture energy and reduce greenhouse gas emissions, but also create a nutrient rich product can help address the many issues across the province related to poor soil health. Previous governments have often too narrowly focused on diversion from disposal and failed to link the economic opportunity.
The following are ways that the government can better harness the economic opportunities associated with encouraging value creation:
o RNG Pipeline Injection: RNG is a versatile fuel with multiple opportunities for utilization, however, there are unfortunately no RNG programs in Ontario at this time. Ontario-based RNG projects are therefore actively seeking markets outside of the province to support their development. Requiring the natural gas utilities in Ontario to implement a voluntary RNG option for customers and consult on the appropriateness of a complementary clean content requirement is a positive first step. Further, a policy statement which solidifies RNG end-markets would also be helpful by providing for long-term offtake contracts and escalating procurement requirements placed on the regulated natural gas utilities (e.g., increasing blend rates of 0.1%, 0.5%, and 1.0% RNG by 2020, 2025 and 2029, respectively).
o RNG for transportation: Remove barriers for expanding 24/7 compressed natural gas (CNG) refueling stations for trucks along the 400-series highways and provide government support for the conversion of heavy-duty truck fleets that return to base every night such as solid waste collection vehicles, school buses etc. into CNG/RNG.
o Green Procurement Policies: Bolstering green procurement practices has the potential to position the government as a leader in the adoption of new technologies as well as goods and services in this area. This could include government procurement of RNG for use in government buildings and/or fleets and the use of digestate for roads, site remediation projects, and other provincial infrastructure construction.
o Tax Credits for Replenishing Agricultural Lands: Address transportation related barriers associated with digestate management by creating a tax credit for farmers to transport products from organic waste processing facilities (ie. digestate, compost, biosolids) for use on their land.

23
BIOGAS AND RENEWABLE NATURAL GAS IN ONTARIO: 2019 MARKET OVERVIEW AND OUTLOOK
• Implement the Food and Organic Waste Policy Statement and food and organic waste disposal ban
The need for a consistent supply of feedstocks is compromised by the availability of cheap landfill capacity that does not take into account externalities. The Food and Organic Waste Policy Statement and the potential implementation of a food and organic waste ban ensure necessary feedstocks. The Province should consider the following:
o Ensure proper oversight and enforcement: The CBA recommends Ontario allocate proper resources for oversight and enforcement. Many jurisdictions often do not allocate appropriate resources to ensure proper oversight and enforcement or create regulations that are difficult to enforce (i.e., O. Reg. 103/94). Given the role that the Resource Productivity and Recovery Authority is already playing, it may make sense for them to help play an oversight and enforcement role related to the Food and Organic Waste Policy Statement. This role should also include better collection and publication of data.
o Establish a date of implementation and a clarify what a food and organic waste ban means: Typically, food and organic waste bans are implemented over a 5 to 10-year time period to allow time for appropriate steps to reduce waste, implement programs, and develop infrastructure. The implementation of the disposal ban is a complementary next step to the Food and Organic Waste Policy Statement. The Province should establish a date of implementation of a full disposal ban.

24
BIOGAS AND RENEWABLE NATURAL GAS IN ONTARIO: 2019 MARKET OVERVIEW AND OUTLOOK
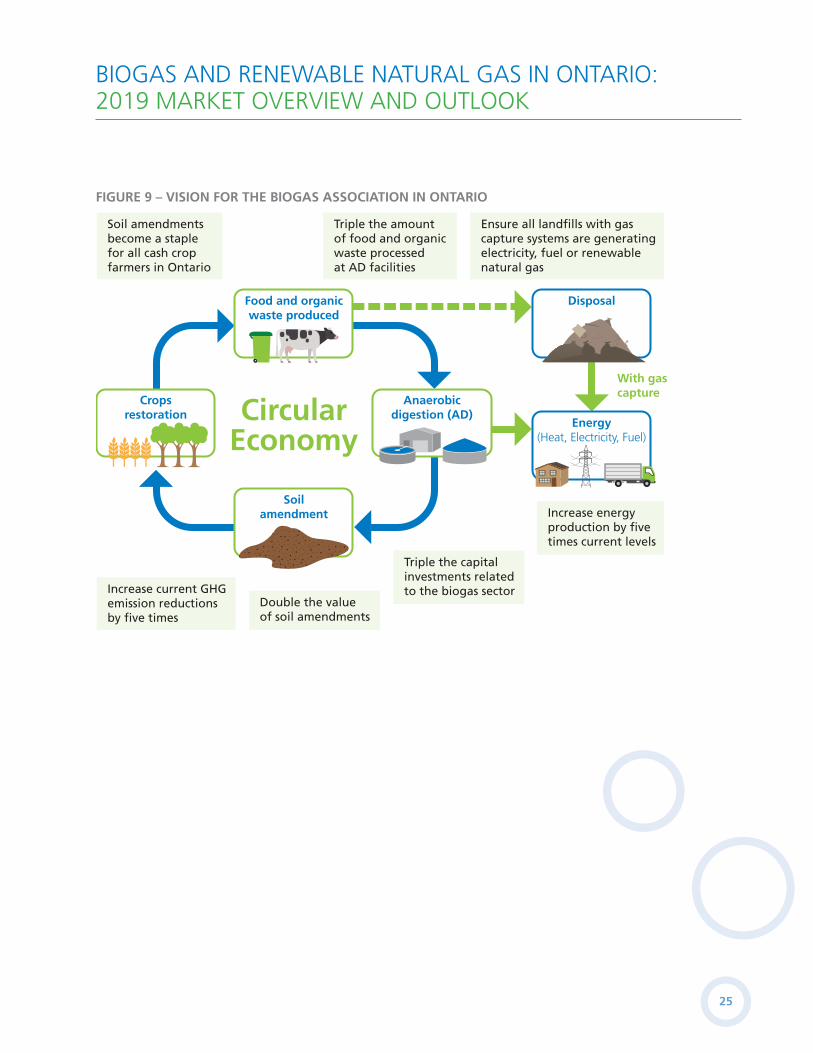
5.0 VisionIn the next 10 years, the Canadian Biogas Association’s vision is to grow the sector in the following five ways (see Figure 9):
1. Enable all landfills with existing gas capture systems to generate electricity, fuel or renewable natural gas.
Currently only about half of Ontario’s landfills that have landfill gas capture systems in place are producing energy. The other half are simply flaring gas. Implementing Clean Fuel Standards as well as increasing the demand for renewable natural gas should enable opportunities for all of these facilities to generate greater value from the gas they are already capturing.
2. Double the value of soil amendments and become a staple for all cash crop farmers in Ontario
The value of soil amendments has been growing in Ontario but in many cases, it is provided to the agricultural sector at no cost. There is substantial opportunity for the sector to increase the value of these products over the next decade to compete with other nutrient based amendments. As noted in Ontario’s Agricultural Soil Health and Conservation Strategy, there is growing concern about the degradation of Ontario’s soil health and what it could mean for cash crop farmers.
3. Triple the capital investments related to the biogas sector and the amount of food and organic waste processed at AD facilities
Given the food and organic waste processing demands related to Ontario’s Food and Organic Waste Policy Statement and a proposed disposal ban, there is substantial opportunity to increase the capital investment in the biogas sector specifically related to new or expanded anaerobic digestion facilities or in retrofits to wastewater facilities to allow for co-digestion.
4. Increase energy production by five times current levels
By opening up energy markets beyond electricity to fuels and renewable natural gas there is a substantial opportunity to increase energy production from current and new anaerobic digestion facilities, wastewater treatment facilities and landfills.
5. Increase current GHG emission reductions by five times
By reducing the amount of methane being released from organic waste in landfills and through the generation of renewable energy, Ontario could play a significant role in helping to reduce greenhouse gases in Ontario and meet its current targets.
This vision includes growth in all types of biogas facilities from on-farm and industrial AD facilities to wastewater facilities and landfills gas capture systems.
25
BIOGAS AND RENEWABLE NATURAL GAS IN ONTARIO: 2019 MARKET OVERVIEW AND OUTLOOK
FIGURE 9 – VISION FOR THE BIOGAS ASSOCIATION IN ONTARIO
With gas capture
CircularEconomy
Anaerobicdigestion (AD)
Soilamendment
Food and organicwaste produced
Cropsrestoration
Disposal
Energy(Heat, Electricity, Fuel)
Soil amendments become a staple for all cash crop farmers in Ontario
Increase current GHG emission reductions by five times
Double the value of soil amendments
Triple the amount of food and organic waste processed at AD facilities
Ensure all landfills with gas capture systems are generating electricity, fuel or renewable natural gas
Increase energy production by five times current levels
Triple the capital investments related to the biogas sector

26
275 Slater Street, Suite 900, Ottawa, Ontario, K1P 5H9, Canada
www.biogasassociation.ca