Big Data Breakthroughs in Data Management
16
Dan Glotter CEO & Founder OptimalTest Big Data Breakthroughs in data management
-
Upload
optimalplus -
Category
Technology
-
view
1.416 -
download
0
Transcript of Big Data Breakthroughs in Data Management

Dan Glotter CEO & Founder
OptimalTest
Big Data Breakthroughs in data management

Introduction
7/11/2013 2
Semiconductor companies need to collect massive volumes of test data from their Distributed Global Supply Chain to drive: • Quality • Yield • Efficiency • Global planning • Time-to-market
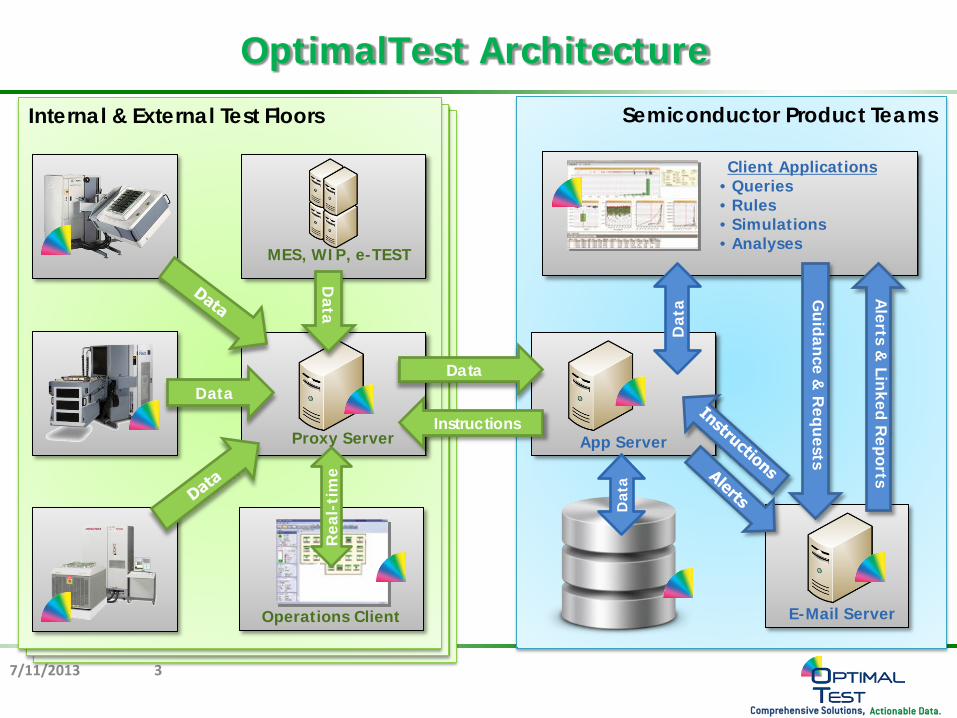
OptimalTest Architecture
7/11/2013 3
Test House Test House Internal & External Test Floors Semiconductor Product Teams
Proxy Server
MES, WIP, e-TEST
App Server
Guidance &
Requests
Alerts &
Linked Reports
Data
Instructions
Client Applications • Queries • Rules • Simulations • Analyses
Dat
a
E-Mail Server Operations Client
Data
Data
Rea
l-ti
me
Dat
a

~5-15 K tester data logs per day
~1-3 K additional files from other sources
~1-5 K parts tested in each data log
~1-5 K parametric measurements per part
~ 50-300 GB raw data per day
~25-150 GB compressed data loaded/purged per day
~5-25 TB 2013 database size x multiple environments
~0.5PB-2PB 2014 database size with increased retention to ~1 year and additional data sources
Typical fabless test data
7/11/2013 4
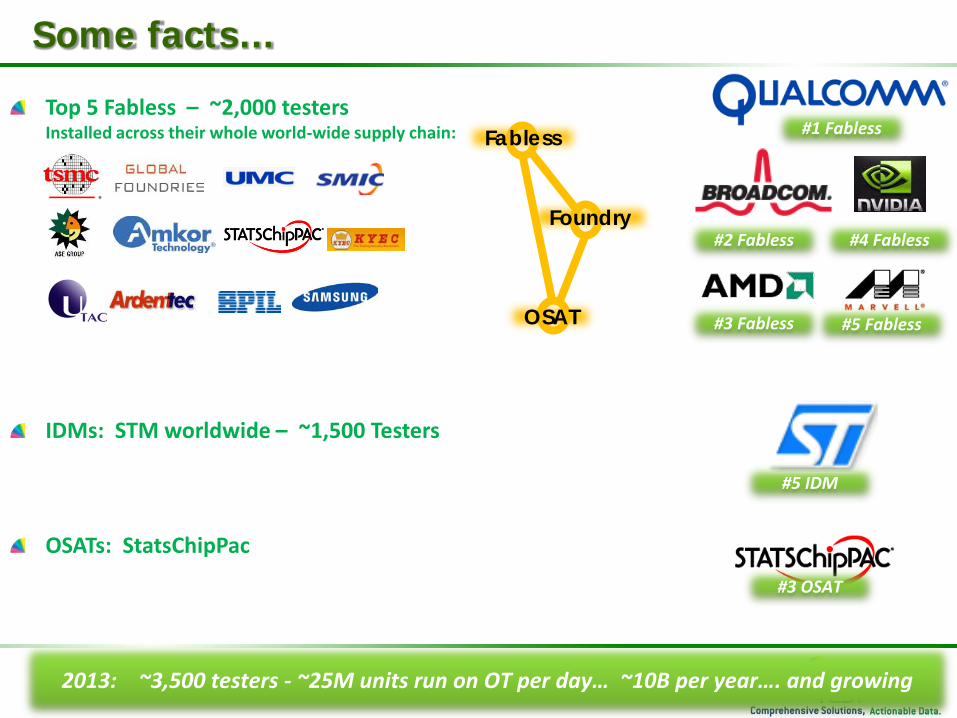
Top 5 Fabless – ~2,000 testers Installed across their whole world-wide supply chain:
IDMs: STM worldwide – ~1,500 Testers
OSATs: StatsChipPac
Some facts…
#1 Fabless
#2 Fabless #4 Fabless
#5 IDM
#3 OSAT
#5 Fabless #3 Fabless
Foundry
OSAT
Fabless
2013: ~3,500 testers - ~25M units run on OT per day… ~10B per year…. and growing

For Quality Building hundreds of baselines on the fly from to catch “issues” Escape Prevention – bin switching in real time or offline for suspect parts RMA Management – analyzing the cause of RMAs by looking at a bad part’s original test data
For Yield reclamation
Quickly detecting trends in bin or test results to enable fast root cause analysis
For Supply Chain Management
Weekly shipment planning across the distributed global supply chain
How is Test Data Used? Some Examples…
7/11/2013 6

Companies are collecting huge amounts of test data Database stores thousands of measurements per part Database size can be tens of terabytes Retention period for detailed data is limited by storage/cost
Expecting rapid increase in database sizes due to: Longer retention periods (e.g. for RMA) More operations (Inspection, WAT, WS, FT, Burn-In, SLT, Board Test, etc.)
Product complexity leading to data log growth Number of testers Detailed characterization data Multiple environments (Prod, Stage, Dev, etc.)
Expecting more complex queries Data mining Cross operation analysis
Big Data Challenges
7/11/2013 7
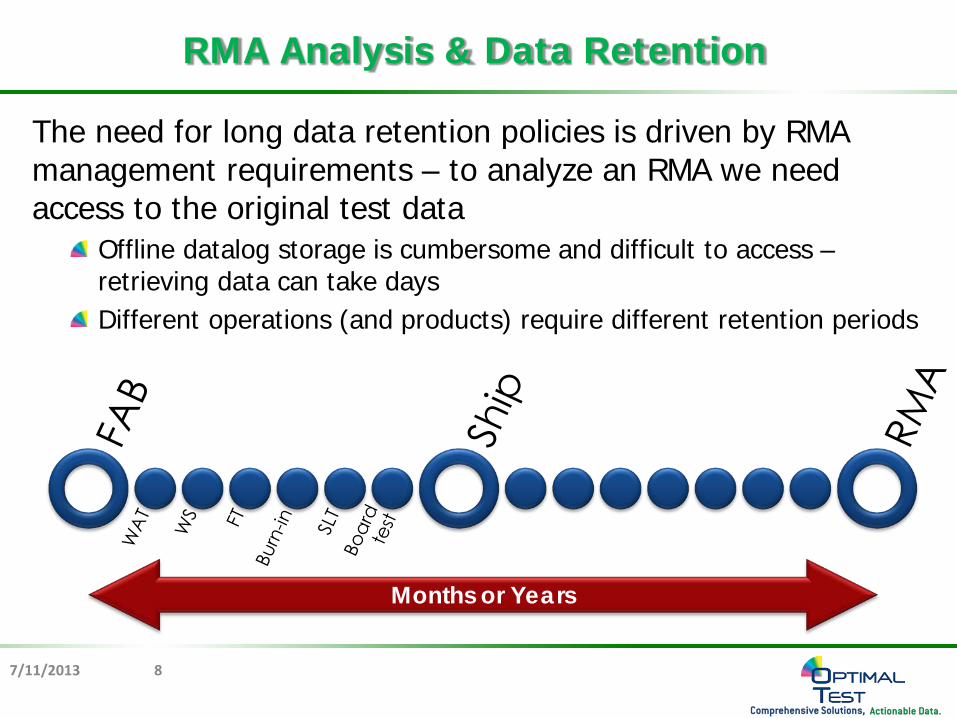
The need for long data retention policies is driven by RMA management requirements – to analyze an RMA we need access to the original test data
Offline datalog storage is cumbersome and difficult to access – retrieving data can take days Different operations (and products) require different retention periods
RMA Analysis & Data Retention
7/11/2013 8
Months or Years
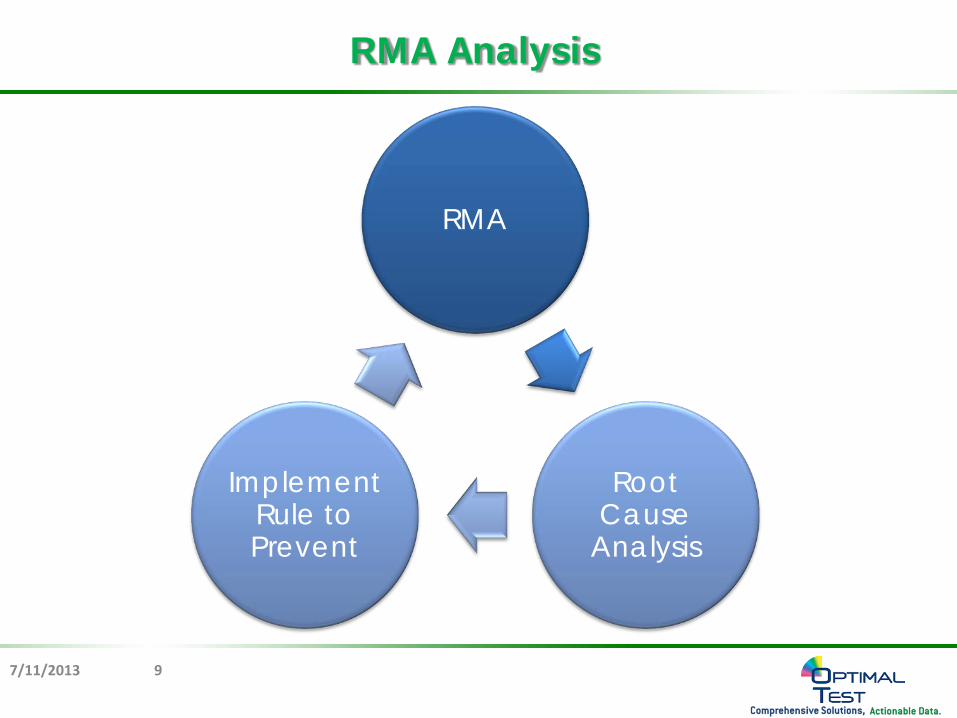
RMA Analysis
7/11/2013 9
RMA
Root Cause
Analysis
Implement Rule to Prevent
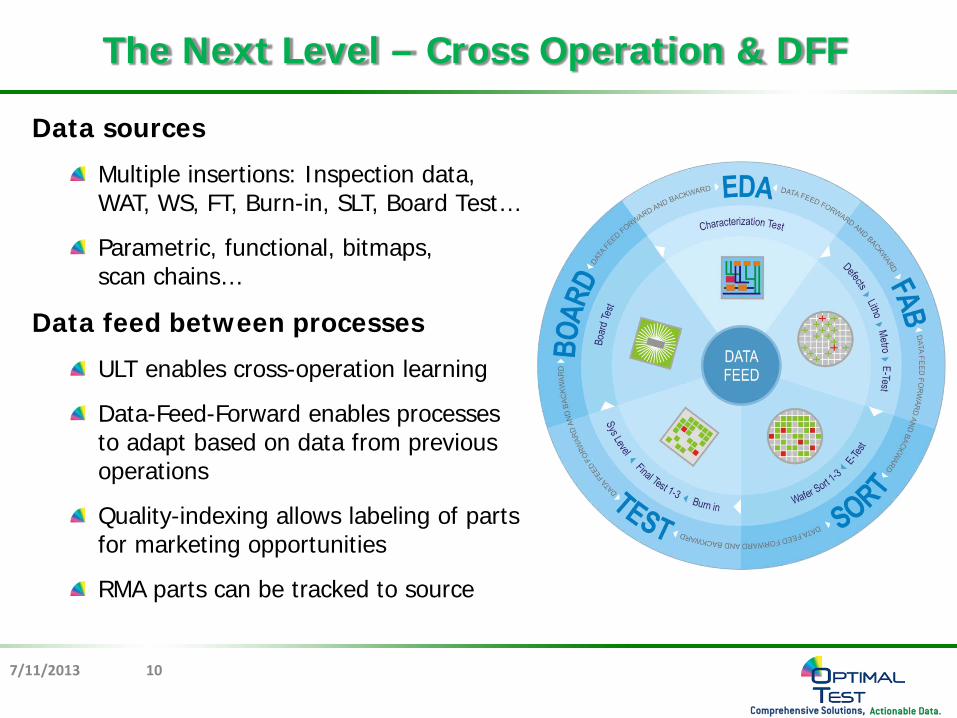
Data sources
Multiple insertions: Inspection data, WAT, WS, FT, Burn-in, SLT, Board Test…
Parametric, functional, bitmaps, scan chains…
Data feed between processes
ULT enables cross-operation learning
Data-Feed-Forward enables processes to adapt based on data from previous operations
Quality-indexing allows labeling of parts for marketing opportunities
RMA parts can be tracked to source
The Next Level – Cross Operation & DFF
7/11/2013 10

Key issue is how to automatically identify meaningful relationships in data… in ALL the data… Examples:
WAT parameters as predictors of quality / fallout Relationships between bin signatures at WS & fallout at SLT Test program changes impacting yield in later operations Wafer map reconstruction based on down-stream operations Parametric drift between operations
Cross Operation Data Mining
7/11/2013 11
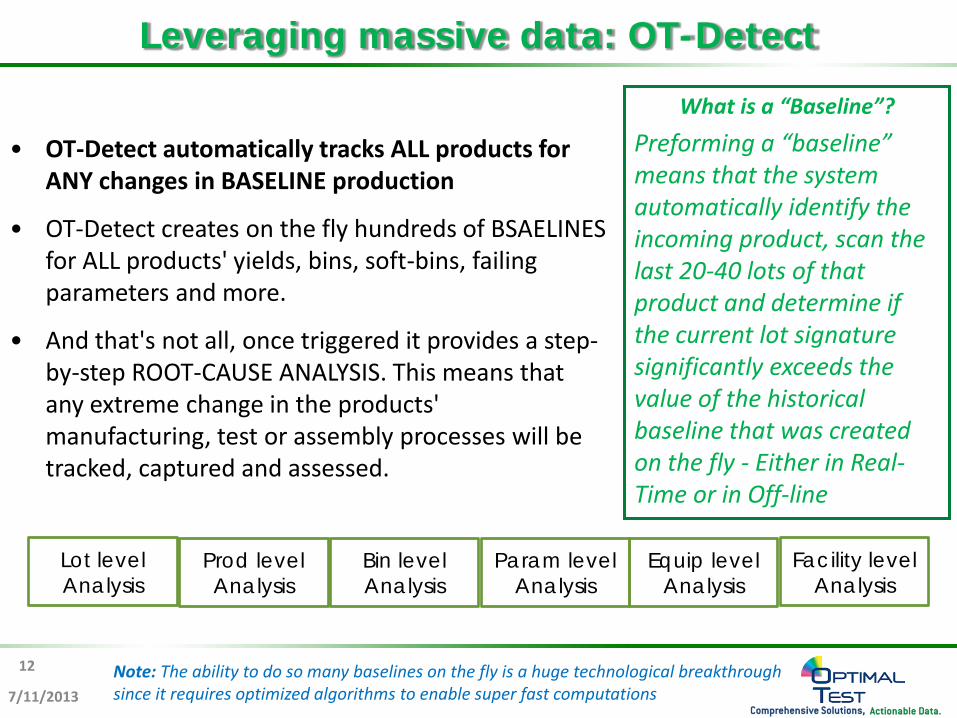
• OT-Detect automatically tracks ALL products for ANY changes in BASELINE production
• OT-Detect creates on the fly hundreds of BSAELINES for ALL products' yields, bins, soft-bins, failing parameters and more.
• And that's not all, once triggered it provides a step-by-step ROOT-CAUSE ANALYSIS. This means that any extreme change in the products' manufacturing, test or assembly processes will be tracked, captured and assessed.
Leveraging massive data: OT-Detect
Lot level Analysis
Prod level Analysis
Bin level Analysis
Param level Analysis
Equip level Analysis
Facility level Analysis
Note: The ability to do so many baselines on the fly is a huge technological breakthrough since it requires optimized algorithms to enable super fast computations
What is a “Baseline”? Preforming a “baseline” means that the system automatically identify the incoming product, scan the last 20-40 lots of that product and determine if the current lot signature significantly exceeds the value of the historical baseline that was created on the fly - Either in Real-Time or in Off-line
7/11/2013
12
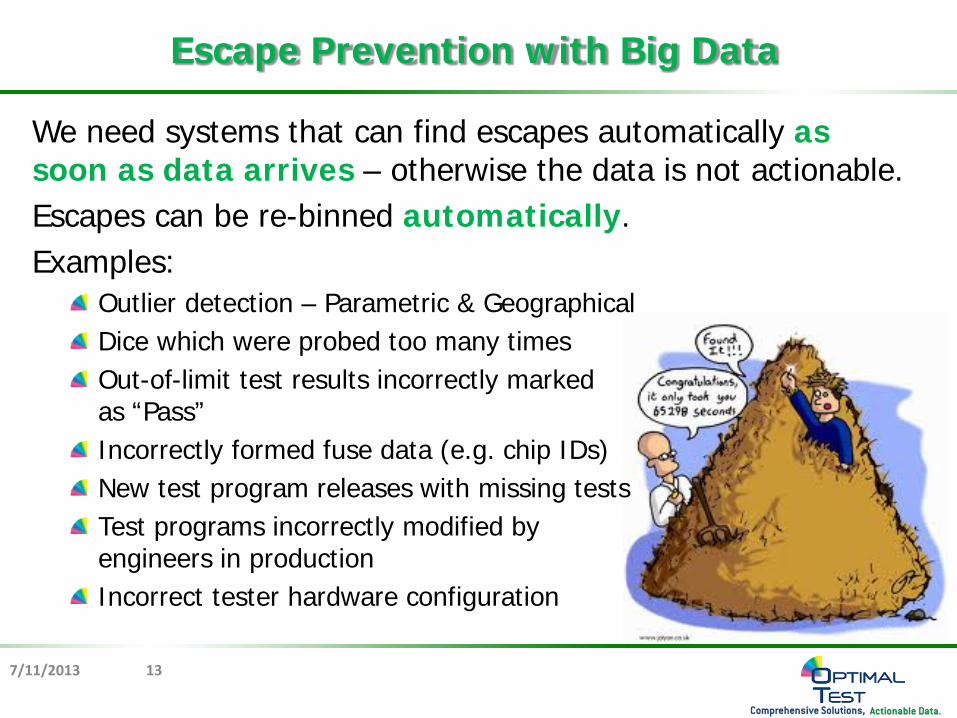
We need systems that can find escapes automatically as soon as data arrives – otherwise the data is not actionable. Escapes can be re-binned automatically. Examples:
Outlier detection – Parametric & Geographical Dice which were probed too many times Out-of-limit test results incorrectly marked as “Pass” Incorrectly formed fuse data (e.g. chip IDs) New test program releases with missing tests Test programs incorrectly modified by engineers in production Incorrect tester hardware configuration
Escape Prevention with Big Data
7/11/2013 13
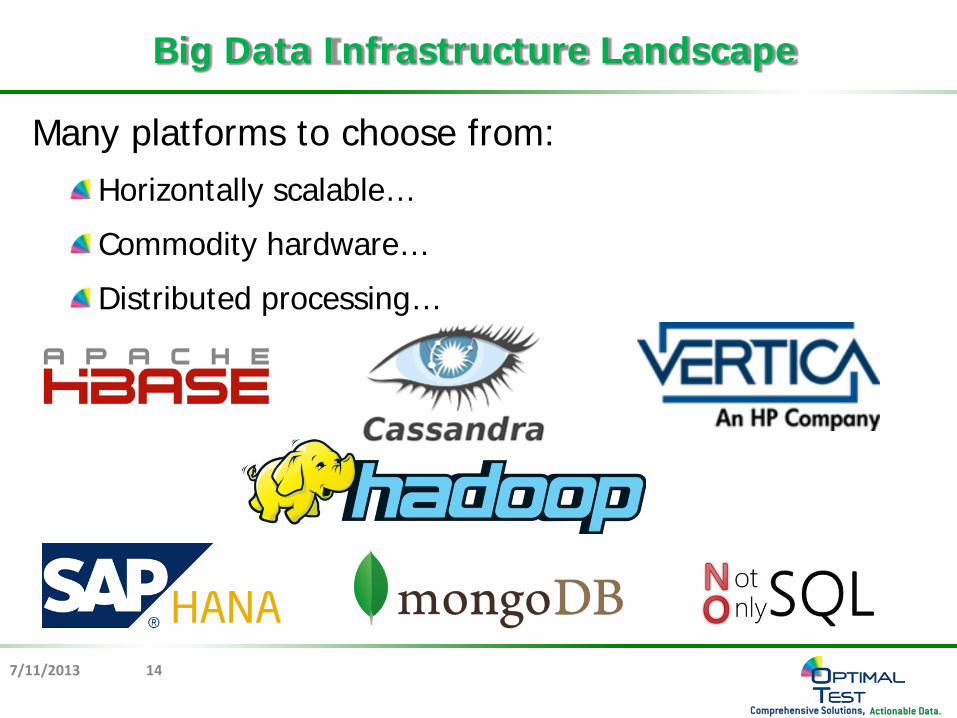
Big Data Infrastructure Landscape
7/11/2013 14
Many platforms to choose from: Horizontally scalable…
Commodity hardware…
Distributed processing…
OptimalTest’s “Not Only” SQL platform will:
Store metadata and summary data in SQL Server
Store parametric and raw data on the file system
Use distributed queries to perform ad-hoc reporting and data mining
Act as an extensible platform for big data solutions
Provide a comprehensive API for developers
Big Data in OptimalTest
7/11/2013 15
7/11/2013
OptimalTest Confidential
16
Thank you