Big Data and Small Surveys: Which one should we …...2020/02/28 · Big Data and Small Surveys:...
54
Big Data and Small Surveys: Which one should we trust more? Xiao-Li Meng Department of Statistics, Harvard University 1 / 14
Transcript of Big Data and Small Surveys: Which one should we …...2020/02/28 · Big Data and Small Surveys:...
Big Data and Small Surveys:Which one should we trust more?
Xiao-Li Meng
Department of Statistics, Harvard University
Meng, X.-L. (2018) Statistical Paradises and Paradoxes in BigData (I): Law of Large Populations, Big Data Paradox, and The2016 US Election. Annals of Applied Statistics Vol 2: 685-726
Many thanks to Stephen Ansolabehere and Shiro Kuriwaki forthe CCES (Cooperative Congressional Election Study) dataand analysis on 2016 US election.
Thanks to many students and colleagues for augmenting myintelligence, and to on-line sources for enhancing my presentation.
1 / 14

OnTheMap Project of US Census Bureau
2 / 14

Multi-Source
Built from more than 20 data sources in the LEHD (LongitudinalEmployer-Household Dynamics) system. For example:
American Community Survey: Surveys 3.5M householdscovering about 2.7% of 128M households.
Administrative Records and Census: Combined job frame usingboth Unemployment Insurance administrative records and theBLS-specified Quarterly Census of Employment and Wages,covering more than 98% of the US workforce.
I Unemployment Insurance record was never intended for statisticalinference purposes.
3 / 14

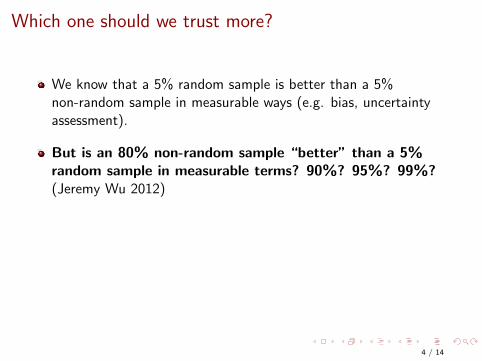
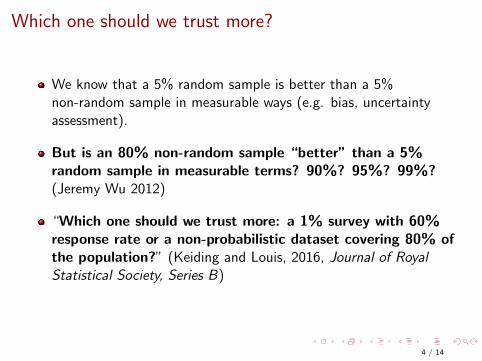
Which one should we trust more?
We know that a 5% random sample is better than a 5%non-random sample in measurable ways (e.g. bias, uncertaintyassessment).
But is an 80% non-random sample “better” than a 5%random sample in measurable terms? 90%? 95%? 99%?(Jeremy Wu 2012)
“Which one should we trust more: a 1% survey with 60%response rate or a non-probabilistic dataset covering 80% ofthe population?” (Keiding and Louis, 2016, Journal of RoyalStatistical Society, Series B)
4 / 14
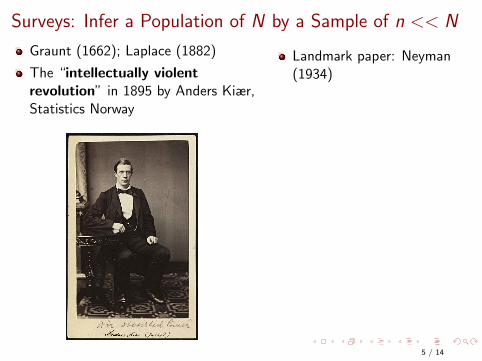
Surveys: Infer a Population of N by a Sample of n << N
Graunt (1662); Laplace (1882)
The “intellectually violentrevolution” in 1895 by Anders Kiær,Statistics Norway
Landmark paper: Neyman(1934)
First implementation in 1940US Census led by MorrisHansen
5 / 14

Surveys: Infer a Population of N by a Sample of n << N
Graunt (1662); Laplace (1882)
The “intellectually violentrevolution” in 1895 by Anders Kiær,Statistics Norway
Landmark paper: Neyman(1934)
First implementation in 1940US Census led by MorrisHansen
5 / 14
Surveys: Infer a Population of N by a Sample of n << N
Graunt (1662); Laplace (1882)
The “intellectually violentrevolution” in 1895 by Anders Kiær,Statistics Norway
Landmark paper: Neyman(1934)
First implementation in 1940US Census led by MorrisHansen
5 / 14

Surveys: Infer a Population of N by a Sample of n << N
Graunt (1662); Laplace (1882)
The “intellectually violentrevolution” in 1895 by Anders Kiær,Statistics Norway
Landmark paper: Neyman(1934)
First implementation in 1940US Census led by MorrisHansen
5 / 14
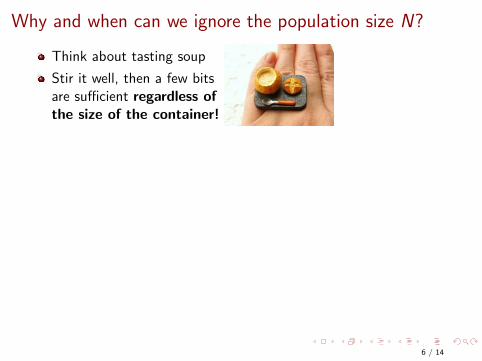
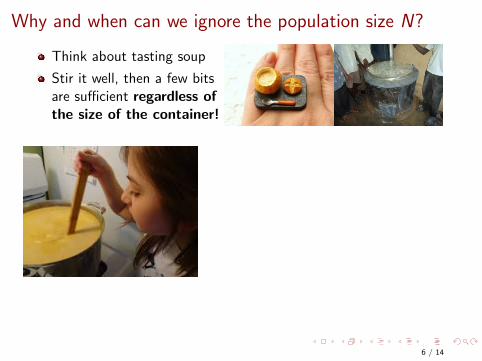
Why and when can we ignore the population size N?
Think about tasting soup
Stir it well, then a few bitsare sufficient regardless ofthe size of the container!
⇐⇒
But what happens when we fail to stir (well)?
6 / 14
Why and when can we ignore the population size N?
Think about tasting soup
Stir it well, then a few bitsare sufficient regardless ofthe size of the container!
⇐⇒
But what happens when we fail to stir (well)?
6 / 14

Why and when can we ignore the population size N?
Think about tasting soup
Stir it well, then a few bitsare sufficient regardless ofthe size of the container!
⇐⇒
But what happens when we fail to stir (well)?
6 / 14
Why and when can we ignore the population size N?
Think about tasting soup
Stir it well, then a few bitsare sufficient regardless ofthe size of the container!
⇐⇒
But what happens when we fail to stir (well)?
6 / 14

Why and when can we ignore the population size N?
Think about tasting soup
Stir it well, then a few bitsare sufficient regardless ofthe size of the container!
⇐⇒
But what happens when we fail to stir (well)?
6 / 14

Why and when can we ignore the population size N?
Think about tasting soup
Stir it well, then a few bitsare sufficient regardless ofthe size of the container!
⇐⇒
But what happens when we fail to stir (well)?
6 / 14

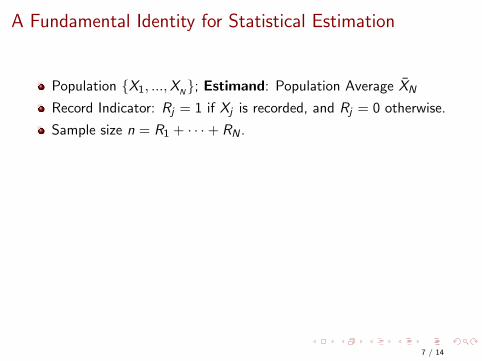
A Fundamental Identity for Statistical Estimation
Population {X1, ...,XN}; Estimand: Population Average X̄N
Record Indicator: Rj = 1 if Xj is recorded, and Rj = 0 otherwise.
Sample size n = R1 + · · ·+ RN .
Estimator: Sample Average X̄n
Three and only three ways to control the estimation error:
X̄n − X̄N︸ ︷︷ ︸
Estimation Error
= Corr(R,X )︸ ︷︷ ︸Data Quality
×√
N − n
n︸ ︷︷ ︸Data Quantity
× St.Dev(X )︸ ︷︷ ︸Problem Difficulty
.
7 / 14
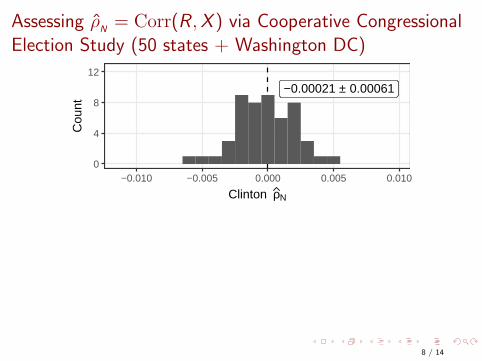
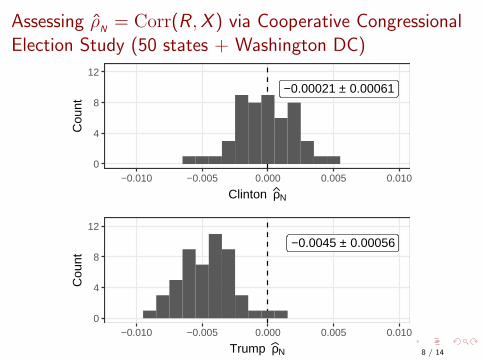
Assessing ρ̂N= Corr(R ,X ) via Cooperative Congressional
Election Study (50 states + Washington DC)
−0.00021 ± 0.00061
0
4
8
12
−0.010 −0.005 0.000 0.005 0.010
Clinton ρN
Cou
nt
−0.0045 ± 0.00056
0
4
8
12
−0.010 −0.005 0.000 0.005 0.010
Trump ρN
Cou
nt
8 / 14
Assessing ρ̂N= Corr(R ,X ) via Cooperative Congressional
Election Study (50 states + Washington DC)
−0.00021 ± 0.00061
0
4
8
12
−0.010 −0.005 0.000 0.005 0.010
Clinton ρN
Cou
nt
−0.0045 ± 0.00056
0
4
8
12
−0.010 −0.005 0.000 0.005 0.010
Trump ρN
Cou
nt
8 / 14
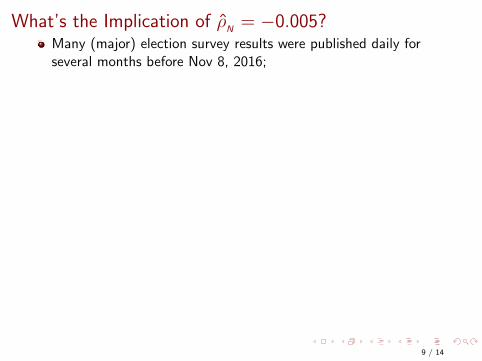
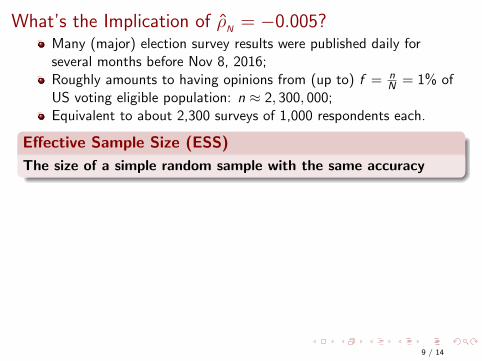
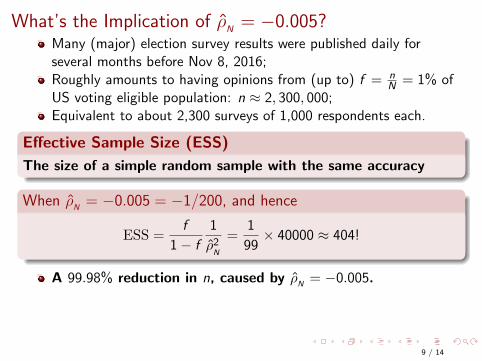
What’s the Implication of ρ̂N= −0.005?
Many (major) election survey results were published daily forseveral months before Nov 8, 2016;
Roughly amounts to having opinions from (up to) f = nN = 1% of
US voting eligible population: n ≈ 2, 300, 000;Equivalent to about 2,300 surveys of 1,000 respondents each.
Effective Sample Size (ESS)
The size of a simple random sample with the same accuracy
When ρ̂N= −0.005 = −1/200, and hence
ESS =f
1− f
1
ρ̂2N
=1
99× 40000 ≈ 404!
A 99.98% reduction in n, caused by ρ̂N
= −0.005.Butterfly Effect due to Law of Large Populations (LLP)
Relative Error =√
N− 1ρ̂N
9 / 14

What’s the Implication of ρ̂N= −0.005?
Many (major) election survey results were published daily forseveral months before Nov 8, 2016;Roughly amounts to having opinions from (up to) f = n
N = 1% ofUS voting eligible population: n ≈ 2, 300, 000;
Equivalent to about 2,300 surveys of 1,000 respondents each.
Effective Sample Size (ESS)
The size of a simple random sample with the same accuracy
When ρ̂N= −0.005 = −1/200, and hence
ESS =f
1− f
1
ρ̂2N
=1
99× 40000 ≈ 404!
A 99.98% reduction in n, caused by ρ̂N
= −0.005.Butterfly Effect due to Law of Large Populations (LLP)
Relative Error =√
N− 1ρ̂N
9 / 14

What’s the Implication of ρ̂N= −0.005?
Many (major) election survey results were published daily forseveral months before Nov 8, 2016;Roughly amounts to having opinions from (up to) f = n
N = 1% ofUS voting eligible population: n ≈ 2, 300, 000;Equivalent to about 2,300 surveys of 1,000 respondents each.
Effective Sample Size (ESS)
The size of a simple random sample with the same accuracy
When ρ̂N= −0.005 = −1/200, and hence
ESS =f
1− f
1
ρ̂2N
=1
99× 40000 ≈ 404!
A 99.98% reduction in n, caused by ρ̂N
= −0.005.Butterfly Effect due to Law of Large Populations (LLP)
Relative Error =√
N− 1ρ̂N
9 / 14
What’s the Implication of ρ̂N= −0.005?
Many (major) election survey results were published daily forseveral months before Nov 8, 2016;Roughly amounts to having opinions from (up to) f = n
N = 1% ofUS voting eligible population: n ≈ 2, 300, 000;Equivalent to about 2,300 surveys of 1,000 respondents each.
Effective Sample Size (ESS)
The size of a simple random sample with the same accuracy
When ρ̂N= −0.005 = −1/200, and hence
ESS =f
1− f
1
ρ̂2N
=1
99× 40000 ≈ 404!
A 99.98% reduction in n, caused by ρ̂N
= −0.005.
Butterfly Effect due to Law of Large Populations (LLP)
Relative Error =√
N− 1ρ̂N
9 / 14

What’s the Implication of ρ̂N= −0.005?
Many (major) election survey results were published daily forseveral months before Nov 8, 2016;Roughly amounts to having opinions from (up to) f = n
N = 1% ofUS voting eligible population: n ≈ 2, 300, 000;Equivalent to about 2,300 surveys of 1,000 respondents each.
Effective Sample Size (ESS)
The size of a simple random sample with the same accuracy
When ρ̂N= −0.005 = −1/200, and hence
ESS =f
1− f
1
ρ̂2N
=1
99× 40000 ≈ 404!
A 99.98% reduction in n, caused by ρ̂N
= −0.005.Butterfly Effect due to Law of Large Populations (LLP)
Relative Error =√
N− 1ρ̂N
9 / 14

LLP: The more voters, the higher the bias in our prediction
AL
AKAZ
AR
CACOCT
DE
DC
FL
GA
HI
ID
IL
IN
IA
KS KY
LAME MDMA
MI
MN
MS
MO
MT
NE
NV
NH
NJ
NM
NY
NC
ND
OH
OK
OR
PA
RI
SC
SD
TN
TX
UT
VT
VA
WAWV
WI
WY
−10
−5
−2
0
2
5
5.5 6.0 6.5 7.0
log10 (Total Voters)
Tru
mp
Zn
10 / 14

The Big Data Paradox:
If we do not pay attention to data quality, then
The bigger the data,
the surer we fool ourselves.
11 / 14

Lessons Learned ...Data quality is far more important than data quantity.
Compensating for quality with quantity is a doomed game.It is far more important to reduce sampling and non-responsebiases than non-response rates.Invest in small but very high quality surveys than largesurveys with uncontrolled/unknown quality.When combining datasets, relatively tiny but higher quality onesshould be given far more weights than suggested by their sizes.For population inferences, “bigness” of ”Big Data” should bemeasured by their relative size, not absolute size.Probability sampling is an extremely powerful tool for ensuringdata quality, but it is not the only strategy.
Three Enemies of Surveys and Data Science in General
Selection
Selection
Selection
12 / 14
Lessons Learned ...Data quality is far more important than data quantity.Compensating for quality with quantity is a doomed game.
It is far more important to reduce sampling and non-responsebiases than non-response rates.Invest in small but very high quality surveys than largesurveys with uncontrolled/unknown quality.When combining datasets, relatively tiny but higher quality onesshould be given far more weights than suggested by their sizes.For population inferences, “bigness” of ”Big Data” should bemeasured by their relative size, not absolute size.Probability sampling is an extremely powerful tool for ensuringdata quality, but it is not the only strategy.
Three Enemies of Surveys and Data Science in General
Selection
Selection
Selection
12 / 14

Lessons Learned ...Data quality is far more important than data quantity.Compensating for quality with quantity is a doomed game.It is far more important to reduce sampling and non-responsebiases than non-response rates.
Invest in small but very high quality surveys than largesurveys with uncontrolled/unknown quality.When combining datasets, relatively tiny but higher quality onesshould be given far more weights than suggested by their sizes.For population inferences, “bigness” of ”Big Data” should bemeasured by their relative size, not absolute size.Probability sampling is an extremely powerful tool for ensuringdata quality, but it is not the only strategy.
Three Enemies of Surveys and Data Science in General
Selection
Selection
Selection
12 / 14

Lessons Learned ...Data quality is far more important than data quantity.Compensating for quality with quantity is a doomed game.It is far more important to reduce sampling and non-responsebiases than non-response rates.Invest in small but very high quality surveys than largesurveys with uncontrolled/unknown quality.
When combining datasets, relatively tiny but higher quality onesshould be given far more weights than suggested by their sizes.For population inferences, “bigness” of ”Big Data” should bemeasured by their relative size, not absolute size.Probability sampling is an extremely powerful tool for ensuringdata quality, but it is not the only strategy.
Three Enemies of Surveys and Data Science in General
Selection
Selection
Selection
12 / 14

Lessons Learned ...Data quality is far more important than data quantity.Compensating for quality with quantity is a doomed game.It is far more important to reduce sampling and non-responsebiases than non-response rates.Invest in small but very high quality surveys than largesurveys with uncontrolled/unknown quality.When combining datasets, relatively tiny but higher quality onesshould be given far more weights than suggested by their sizes.
For population inferences, “bigness” of ”Big Data” should bemeasured by their relative size, not absolute size.Probability sampling is an extremely powerful tool for ensuringdata quality, but it is not the only strategy.
Three Enemies of Surveys and Data Science in General
Selection
Selection
Selection
12 / 14

Lessons Learned ...Data quality is far more important than data quantity.Compensating for quality with quantity is a doomed game.It is far more important to reduce sampling and non-responsebiases than non-response rates.Invest in small but very high quality surveys than largesurveys with uncontrolled/unknown quality.When combining datasets, relatively tiny but higher quality onesshould be given far more weights than suggested by their sizes.For population inferences, “bigness” of ”Big Data” should bemeasured by their relative size, not absolute size.
Probability sampling is an extremely powerful tool for ensuringdata quality, but it is not the only strategy.
Three Enemies of Surveys and Data Science in General
Selection
Selection
Selection
12 / 14
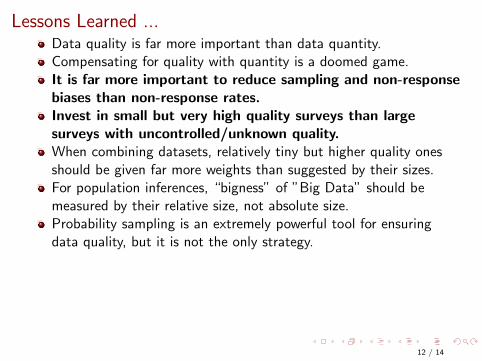
Lessons Learned ...Data quality is far more important than data quantity.Compensating for quality with quantity is a doomed game.It is far more important to reduce sampling and non-responsebiases than non-response rates.Invest in small but very high quality surveys than largesurveys with uncontrolled/unknown quality.When combining datasets, relatively tiny but higher quality onesshould be given far more weights than suggested by their sizes.For population inferences, “bigness” of ”Big Data” should bemeasured by their relative size, not absolute size.Probability sampling is an extremely powerful tool for ensuringdata quality, but it is not the only strategy.
Three Enemies of Surveys and Data Science in General
Selection
Selection
Selection
12 / 14
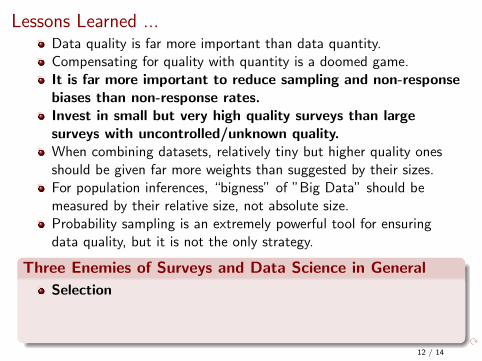

Lessons Learned ...Data quality is far more important than data quantity.Compensating for quality with quantity is a doomed game.It is far more important to reduce sampling and non-responsebiases than non-response rates.Invest in small but very high quality surveys than largesurveys with uncontrolled/unknown quality.When combining datasets, relatively tiny but higher quality onesshould be given far more weights than suggested by their sizes.For population inferences, “bigness” of ”Big Data” should bemeasured by their relative size, not absolute size.Probability sampling is an extremely powerful tool for ensuringdata quality, but it is not the only strategy.
Three Enemies of Surveys and Data Science in General
Selection
Selection
Selection12 / 14

More Lessons From ...
Open Access: https://hdsr.mitpress.mit.edu/
Global Correspondents: One correspondent from eachcountry/region (Contact: [email protected])
13 / 14

More Lessons From ...
Open Access: https://hdsr.mitpress.mit.edu/
Global Correspondents: One correspondent from eachcountry/region (Contact: [email protected])
13 / 14
Everything Data Science and Data Science for Everyone
14 / 14
Everything Data Science and Data Science for Everyone
14 / 14