Big-Data Analytics for Electric Grid and Demand-Side ...
57
Big-Data Analytics for Electric Grid and Demand-Side Management Authors: Rongxin Yin, Girish Ghatikar, 1 and Mary Ann Piette 1 Electric Power Research Institute, and formerly, LeRa LLC Energy Analysis and Environmental Impacts Division Lawrence Berkeley National Laboratory May 2019 This work was supported by the DOE Office of Electricity Delivery and Energy Reliability (OE), under Lawrence Berkeley National Laboratory Contract No. DE-AC02-05CH11231.
Transcript of Big-Data Analytics for Electric Grid and Demand-Side ...
Big-Data Analytics for Electric Grid and Demand-Side Management
Authors:
Rongxin Yin, Girish Ghatikar,1 and Mary Ann Piette
1Electric Power Research Institute, and formerly, LeRa LLC
Energy Analysis and Environmental Impacts Division Lawrence Berkeley National Laboratory
May 2019
This work was supported by the DOE Office of Electricity Delivery and Energy Reliability (OE), under Lawrence Berkeley National Laboratory Contract No. DE-AC02-05CH11231.

Disclaimer
This document was prepared as an account of work sponsored by the United States Government. While this document is believed to contain correct information, neither the United States Government nor any agency thereof, nor The Regents of the University of California, nor any of their employees, makes any warranty, express or implied, or assumes any legal responsibility for the accuracy, completeness, or usefulness of any information, apparatus, product, or process disclosed, or represents that its use would not infringe privately owned rights. Reference herein to any specific commercial product, process, or service by its trade name, trademark, manufacturer, or otherwise, does not necessarily constitute or imply its endorsement, recommendation, or favoring by the United States Government or any agency thereof, or The Regents of the University of California. The views and opinions of authors expressed herein do not necessarily state or reflect those of the United States Government or any agency thereof, or The Regents of the University of California. Ernest Orlando Lawrence Berkeley National Laboratory is an equal opportunity employer.
Copyright Notice This manuscript has been authored by an author at Lawrence Berkeley National Laboratory under Contract No. DE-AC02-05CH11231 with the U.S. Department of Energy. The U.S. Government retains, and the publisher, by accepting the article for publication, acknowledges, that the U.S. Government retains a non-exclusive, paid-up, irrevocable, worldwide license to publish or reproduce the published form of this manuscript, or allow others to do so, for U.S. Government purposes.

Big-Data Analytics for Grid and Demand-Side Management │3
Acknowledgments
We would like to acknowledge members of our Industrial Advisory Board who participated in quarterly meetings and contributed to the development of this report. We are particularly grateful to those who reviewed and commented on early draft versions of the report: Mark Martinez (Senior Project Manager, Southern California Edison), Michel Kamel (MelRok L.L.C.), and Samir Touzani (Research Scientist, Lawrence Berkeley National Laboratory). This work was supported by the U.S. Department of Energy’s Office of Electricity Delivery and Energy Reliability under Lawrence Berkeley National Laboratory Contract No. DE-AC02-05CH11231. US-China DR + Big Data US Industry Advisory Board (IAB) Members Rolf Bienert, OpenADR Alliance Albert K Chiu, Pacific Gas and Electric Company Mark Martinez, Southern California Edison Ravi Subramaniam, Institute of Electrical and Electronics Engineers (IEEE) Michel Kamel, MelRok L.L.C. Derek Cowburn, LumenCache, Inc Yvonne Qiao, Honeywell International Inc Vincent Rerolle, Lunera, Inc Yuxin Zhang, General Electric
Big-Data Analytics for Grid and Demand-Side Management │4
Abstract This report describes research to characterize the status of, and trends in, big-data analytics for the
electricity grid. The research focused on 1) identifying power-grid big-data sources, types, and
characteristics; and 2) characterizing big-data architecture, analytic methods, technology applications,
and challenges. The first part of this report describes the main sources and characteristics of big data
for the smart grid and comprehensively reviews big-data architecture, technologies, and applications in
the power sector. The second part of this report presents case studies of big data applications in the
power industry: (1) a smart-meter data and predictive analytics method for demand response (DR), (2)
synchrophasor data analytics for the distribution grid, and (3) utility data for peak-demand
management. For the predictive analytics case study, smart-meter-data-driven and physical models
were developed to predict the potential kilowatt (kW) capacity reduction from DR. The DR estimation
framework that was developed works for both small and large-scale customers. The synchrophasor case
study demonstrates use of an algorithm applied to time-series data to detect events that appear as
significant changes, known as “edges,” in voltage magnitude measurements. The synchrophasor case
study also introduces an approach for clustering sets of events to reveal unique features that
distinguish them (e.g., distinguishing capacitor bank switching from transformer tap changes). The
peak-demand management case study describes the use of the data analytics to enable DR programs to
limit forecasted peak demand, resulting in cost savings to the utility. The findings from the research
described in this report support identification of opportunities and technologies for big-data and
analytics applications for demand-side management in the power sector as well as other approaches to
modernizing the electricity grid.

Big-Data Analytics for Grid and Demand-Side Management │5
Big-Data Analytics for Grid and Demand-Side Management │6
Acronyms and Abbreviations AMI automated metering infrastructure AMR automatic meter reading DA distribution automation DR demand response DSM demand-side management EPB Electric Power Board of Chattanooga Gbps gigabits per second HAN home area network HVAC heating, ventilation, and air conditioning ID identifier IEEE Institute of Electrical and Electronics Engineers IOU investor-owned utility Kbps kilobits per second kW kilowatt LBNL Lawrence Berkeley National Laboratory M&V measurement and verification Mbps megabits per second MDM meter data management MHz megahertz µPMU micro phasor measurement unit NAICS North American Industry Classification System OAT outside air temperature PMU phasor measurement unit SA service agreement SCADA supervisory control and data acquisition STL season trend decomposition using Loess TVA Tennessee Valley Authority W Watt WBP whole-building power WLAN wireless local-area network
Big-Data Analytics for Grid and Demand-Side Management │7
Table of Contents
1 Introduction .......................................................................................................................................... 10 1.1 Study Methodology ................................................................................................................... 13
2 Data Characteristics and Use of Smart-Meter Data for Predictive Analytics ....................................... 14 2.1 Big-Data Characteristics on the Smart Grid ............................................................................... 14 2.2 Big Data and Analytics in Demand Response ............................................................................ 15
2.2.1 Data Sources, Types, and Characteristics ................................................................. 15 2.2.2 Data Analytics for Demand-Response Applications ................................................. 18
2.3 Standardizing Data to Facilitate Demand-Response Performance Assessment ....................... 21 2.3.1 Standards for Assessing Demand-Response Performance ...................................... 22
3 Data Architecture, Technologies, and Applications ............................................................................. 25 3.1 Overview of Big-Data System Architecture ............................................................................... 25 3.2 In-Depth Analysis of Big-Data Technologies .............................................................................. 26
3.2.1 Data Acquisition Technology in the Power Industry ................................................ 26 3.2.2 Data Communication Technology in the Power Industry ........................................ 28
3.3 Big-data Analytics Applications in the Power Sector ................................................................. 31 3.3.1 Descriptive Data-Analytics Models .......................................................................... 31 3.3.2 Predictive Data-Analytics Models ............................................................................ 32
4 Big-Data Applications for the Power Industry: A Predictive Analytics Model and Two Case Studies .. 36 4.1 Smart-Meter Data and Predictive Analytics for Demand Response in Commercial Buildings .. 37
4.1.1 Applications for Individual Customers ..................................................................... 40 4.1.2 Application for Large-Scale Customers .................................................................... 43
4.2 Synchrophasor Data Analytics on the Distribution Grid ............................................................ 47 4.2.1 Methodology ............................................................................................................ 47 4.2.2 Results ...................................................................................................................... 49
4.3 Utility Data Analytics Case Study: Electric Power Board of Chattanooga, Tennessee .............. 51 4.3.1 Data-Analytics Use Cases for Peak-Demand Management ..................................... 51 4.3.2 Results ...................................................................................................................... 51
5 Summary, Conclusions, and Future Activities ...................................................................................... 53 5.1 Study Conclusions ...................................................................................................................... 53 5.2 Future Activities ......................................................................................................................... 53
6 References ............................................................................................................................................ 54
Big-Data Analytics for Grid and Demand-Side Management │8
List of Figures Figure 1: Types of Data Analytics [1] ........................................................................................................... 12 Figure 2: Overall Research Framework of the Study .................................................................................. 13 Figure 3: Use of Big Data for Demand Response Analytics ......................................................................... 15 Figure 4: SmartMeter™ Electric System Communication Diagram [12] ..................................................... 17 Figure 5: Hybrid Model Framework for Demand Response-Related Predictive Analytics ......................... 19 Figure 6: Example of DR Predictive Analytics using Smart Meter and Weather Data ................................ 20 Figure 7: Scope of Standardization for Demand-Side Management .......................................................... 22 Figure 8: General Energy-Meter Data Management System Architecture for Utilities .............................. 26 Figure 9: Smart Grid Conceptual Actors/Data Flow Diagram [40], [41] ..................................................... 27 Figure 10: Example of High-Level Implementation of a Utility Automated Metering Infrastructure ........ 28 Figure 11: A Distributed Communication and Management Architecture for the Smart Grid [42] ........... 28 Figure 12: Example from the Lawrence Berkeley National Laboratory Load-Shape Regression Model [53]
.............................................................................................................................................................. 33 Figure 13. Change-Point Model: Non-Electric Heating (Left) and Electric Heating (Right) ........................ 33 Figure 14. Example of Change-Point Model Results ................................................................................... 34 Figure 15: Single-Building Example of Decomposed Weekly Patterns Obtained Using the STL Process [57]
.............................................................................................................................................................. 35 Figure 16: Big-Data Applications for Targeting and Implementing Demand Response ............................. 37 Figure 17: Example of Pre-cooling and Global Temperature Adjustment during Demand-Response Event
Hours .................................................................................................................................................... 38 Figure 18: Overall Demand Response Estimation Model ........................................................................... 39 Figure 19: Change-Point Models: Cooling only without Electric Heating (Highlighted) ............................. 40 Figure 20: Example of a Change-Point Model............................................................................................. 40 Figure 21: Demand Response Estimation Framework in a Spreadsheet Tool ............................................ 41 Figure 22: Customer Meter Data-Set Cleaning Framework ........................................................................ 44 Figure 23: Example of Demand-Response Capacity Potential for Customers in San Francisco’s 94111 Zip
Code ...................................................................................................................................................... 46 Figure 24: Example of Demand-Response Capacity Potential for Customers in San Francisco’s 94105 Zip
Code ...................................................................................................................................................... 46 Figure 25: Schematic of Analytics Pipeline for Time-Series Data [15] ........................................................ 47 Figure 26: µPMU Network Storage and Query Processing System [61] ..................................................... 48 Figure 27: Example of Edge Event Obtained from Data Analytics Pipeline [15] ......................................... 49 Figure 28: Centroids of Clusters 3, 4, and 5 [15] (Index on the x-axis refers to 1/100 second; legends are
same as in Figure 27) ............................................................................................................................ 50 Figure 29: Load Forecast Based on Current Conditions Indicates Need for a Demand-Response Event ... 52
Big-Data Analytics for Grid and Demand-Side Management │9
List of Tables
Table 1: Smart Grid Data and the “6V” Characteristics of Big Data ............................................................ 14 Table 2: Major Distribution System Data Sources for the Smart Grid ........................................................ 16 Table 3: Example of Utility Smart-Meter Data ............................................................................................ 17 Table 4: µPMU Data Format ....................................................................................................................... 18 Table 5: Performance Assessment Standards and Data Sources [33]–[38] ................................................ 24 Table 6: Communication Technologies used for Smart Grid Data Transmission [43] ................................ 30 Table 7: Model Equations for Small Office in CZ12-Stockton ..................................................................... 42 Table 8: Data Analysis Outputs for Demand Response .............................................................................. 44 Table 9: Characteristics of Observed Edge Event Clusters.......................................................................... 50
Big-Data Analytics for Grid and Demand-Side Management │10
1 Introduction Electricity grid modernization initiatives and deployment of demand-side management (DSM) programs increasingly depend deriving actionable insights from the large volumes of data collected on the smart grid. The data available to the utility industry are increasing exponentially in both number and type [1]. However, the lack of standardized and secure access to data and for analytical methods to extract actionable information from those data is limiting innovation in DSM program design and deployment as well as grid modernization. Operations and performance data from power plants and renewable generation resources, electric power grid transmission and distribution system data, and smart-meter data on electricity usage are all rich sources of information. These data can help the industry realize the economic and other benefits of DSM programs, including energy efficiency, energy conservation, load management, and demand response (DR) programs. The goal of the case studies presented in this report is to advance the adoption of cost-effective DR and enable innovative DR technologies and emerging DR markets. An overall goal of the report is to highlight both the potential benefits and challenges of “big data” and “big-data analytics” in the electricity industry. The scientific community has no single, agreed-upon definition of big data. Definitions range among those based on size (large, complex data), data type (structured, semi-structured, unstructured, heterogeneous), and computational standards (e.g., the capacity and capability of conventional data collection and analysis methods and systems) [2].
For purposes of this study, the term “big data” is defined as large volumes of unstructured and heterogeneous data sets that are complex in relation to conventional techniques.
Just as there is no single definition of “big data,” there is also no single definition for data analytics. Definitions focus on the “what” and the “why” aspects of data analytics, such as “discovery of meaningful patterns in raw data with the goal of understanding, describing, predicting, and improving business performance [1]” data processing that “expose[s] new knowledge, and facilitate[s] in responding to emerging opportunities and challenges in a timely manner [3],” or that has “the potential to generate new knowledge thus proposing innovative and actionable insights for businesses” [4].
For purposes of this study, the term “big-data analytics” is defined as encompassing methods, tools, and analyses that use advanced computing systems to extract actionable information from big data.
The key objectives of the study are to:
• Examine the characteristics of big-data types and sources related to the smart grid (e.g., smart-meter data, customer demographics, weather data)
• Review the role of big-data analytical methods and industry best practices for the smart grid, with a focus on demand-side customer meter data for DR analytics
• Explore the challenges of big data for power industry data architecture, technologies, and applications

Big-Data Analytics for Grid and Demand-Side Management │11
• Demonstrate applications of big-data analytics with case studies from industry partners • Facilitate technology transfer of big-data analytics to benefit industry activities
Recent research to evaluate the flexibility and advanced capabilities of existing and future customer electrical loads resulted in the 2025 California Demand Response Potential Study [5]. The research utilized 15-minute electricity usage data from more than 200,000 smart meters installed by California’s three investor-owned utilities (IOUs) – Pacific Gas & Electric, Southern California Edison, and San Diego Gas & Electric – as well as demographic data for 11,000,000 customers, historical weather data, and data from other sources. Using these data, the study defined characteristic customer load profiles for data clusters and assessed future DR technology capabilities and costs. Our research builds on the California Demand Response Potential Study by focusing on the use of big-data analytics to forecast DR’s potential to meet the needs of California’s changing electricity grid as penetration of renewable and distributed generation resources increases. Our research team developed a comprehensive big-data analytic framework along with DR electricity supply-side curves to estimate the amount of DR available for various grid services for each hour of the year. This report also describes a study for a municipal utility, the Electric Power Board of Chattanooga (EPB), in which distribution system and smart-meter data were used to identify cost-saving opportunities for electricity customers from DR programs [6] and other applications such as outage reduction. These studies demonstrate the value of big data for DR programs and the use of data analytics for utility grid planning and policy development. Similar research methodologies, analytical frameworks, and data from other areas of the U.S. could be used to estimate regional DR potential. In this vein, our research team is also working with the New York Independent System Operator and Consolidated Edison to expand this study’s applications [7], [8]. Data analytics uses different methods for different functions. Figure 1 shows numerous types of data analytical methods that have been defined in previous studies [1,9].

Big-Data Analytics for Grid and Demand-Side Management │12
Figure 1: Types of Data Analytics [1] Descriptive analytics Descriptive analytics mine and aggregate data to provide insight into the past (“what happened”). Predictive analytics Predictive analytics utilize a variety of statistical, modeling, data-mining, and machine-learning techniques to study recent and historical data as a basis for forecasting the future. Prescriptive analytics Prescriptive analytics use optimization and simulation algorithms to suggest possible outcomes and recommend the best course of action for any pre-specified outcome. In this study, we focus on descriptive and predictive analytics for consumer-based DR programs. The case studies we present provide insights into advanced situational and prescriptive analytics as well as technologies for pre-emptive resolution of field challenges. Situational analytics combine descriptive, predictive, and prescriptive analytics to understand real-time intelligence about the condition of the grid. Electricity grid stakeholders and product vendors can leverage the findings from this study to identify and prioritize development of technologies for big-data and analytics-related applications to maximize DSM program benefits and accelerate grid modernization.
Big-Data Analytics for Grid and Demand-Side Management │13
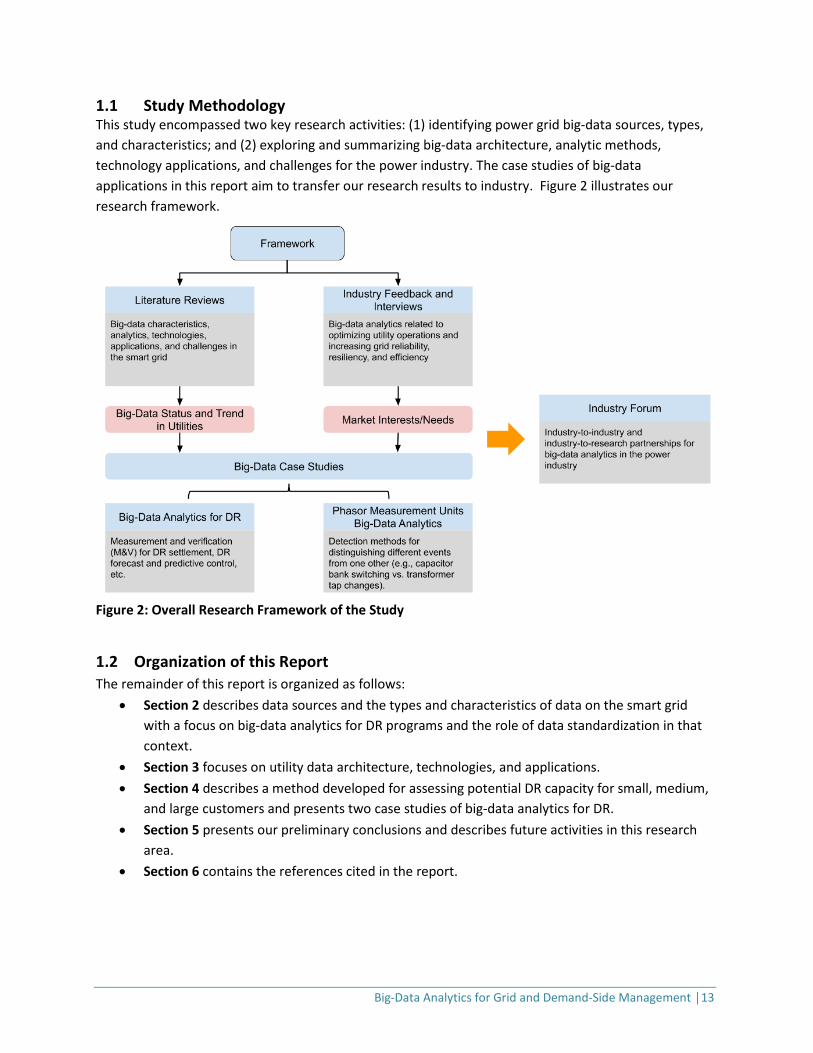
1.1 Study Methodology This study encompassed two key research activities: (1) identifying power grid big-data sources, types, and characteristics; and (2) exploring and summarizing big-data architecture, analytic methods, technology applications, and challenges for the power industry. The case studies of big-data applications in this report aim to transfer our research results to industry. Figure 2 illustrates our research framework.
Figure 2: Overall Research Framework of the Study
1.2 Organization of this Report The remainder of this report is organized as follows:
• Section 2 describes data sources and the types and characteristics of data on the smart grid with a focus on big-data analytics for DR programs and the role of data standardization in that context.
• Section 3 focuses on utility data architecture, technologies, and applications. • Section 4 describes a method developed for assessing potential DR capacity for small, medium,
and large customers and presents two case studies of big-data analytics for DR. • Section 5 presents our preliminary conclusions and describes future activities in this research
area. • Section 6 contains the references cited in the report.
Big-Data Analytics for Grid and Demand-Side Management │14
2 Data Characteristics and Use of Smart-Meter Data for Predictive Analytics
This section identifies the sources and types of big data for the smart grid, describes the characteristics of big data for each source, and discusses predictive analytics for DR using smart-meter data. The final topic of this section of the report is the use of standards-based models for data access and grid interoperability, to unlock innovation, new technology development, and market opportunities.
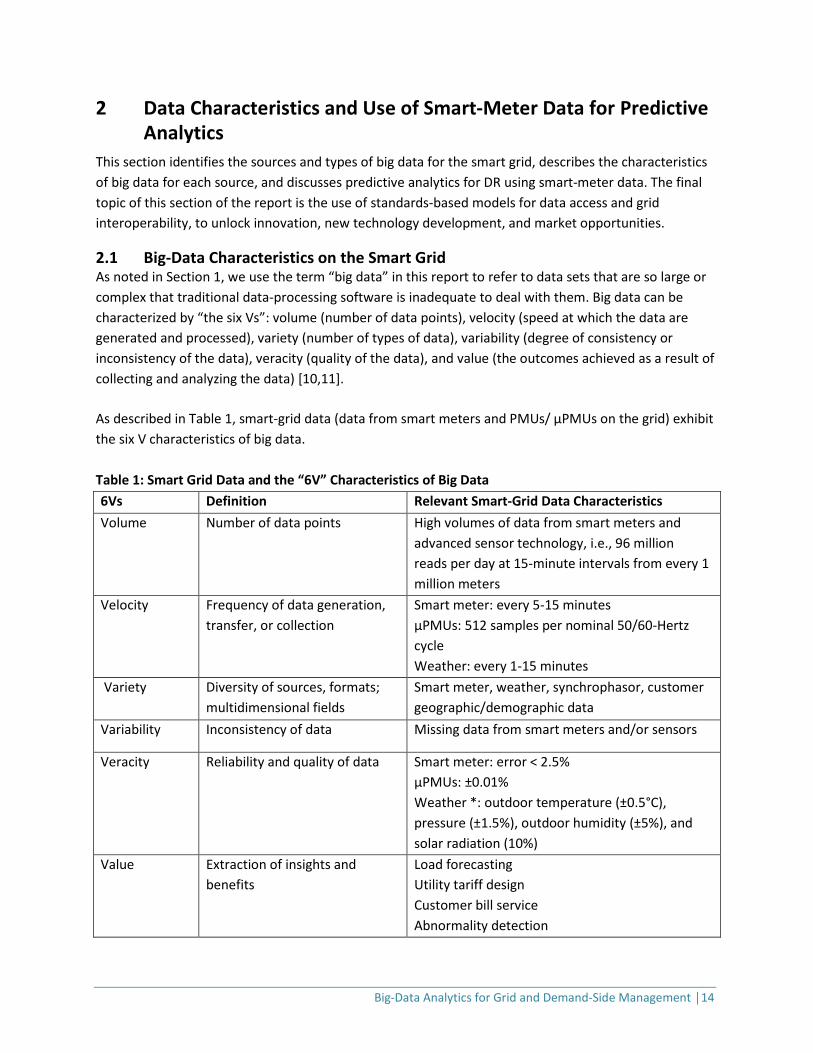
2.1 Big-Data Characteristics on the Smart Grid As noted in Section 1, we use the term “big data” in this report to refer to data sets that are so large or complex that traditional data-processing software is inadequate to deal with them. Big data can be characterized by “the six Vs”: volume (number of data points), velocity (speed at which the data are generated and processed), variety (number of types of data), variability (degree of consistency or inconsistency of the data), veracity (quality of the data), and value (the outcomes achieved as a result of collecting and analyzing the data) [10,11]. As described in Table 1, smart-grid data (data from smart meters and PMUs/ µPMUs on the grid) exhibit the six V characteristics of big data. Table 1: Smart Grid Data and the “6V” Characteristics of Big Data 6Vs Definition Relevant Smart-Grid Data Characteristics Volume Number of data points High volumes of data from smart meters and
advanced sensor technology, i.e., 96 million reads per day at 15-minute intervals from every 1 million meters
Velocity Frequency of data generation, transfer, or collection
Smart meter: every 5-15 minutes µPMUs: 512 samples per nominal 50/60-Hertz cycle Weather: every 1-15 minutes
Variety Diversity of sources, formats; multidimensional fields
Smart meter, weather, synchrophasor, customer geographic/demographic data
Variability Inconsistency of data Missing data from smart meters and/or sensors
Veracity Reliability and quality of data
Smart meter: error < 2.5% µPMUs: ±0.01% Weather *: outdoor temperature (±0.5°C), pressure (±1.5%), outdoor humidity (±5%), and solar radiation (10%)
Value Extraction of insights and benefits
Load forecasting Utility tariff design Customer bill service Abnormality detection
Big-Data Analytics for Grid and Demand-Side Management │15
Situational awareness Outage management Distributed energy resources (DER) management Volt/VAR Optimization (VVO) Conservation voltage reduction (CVR)
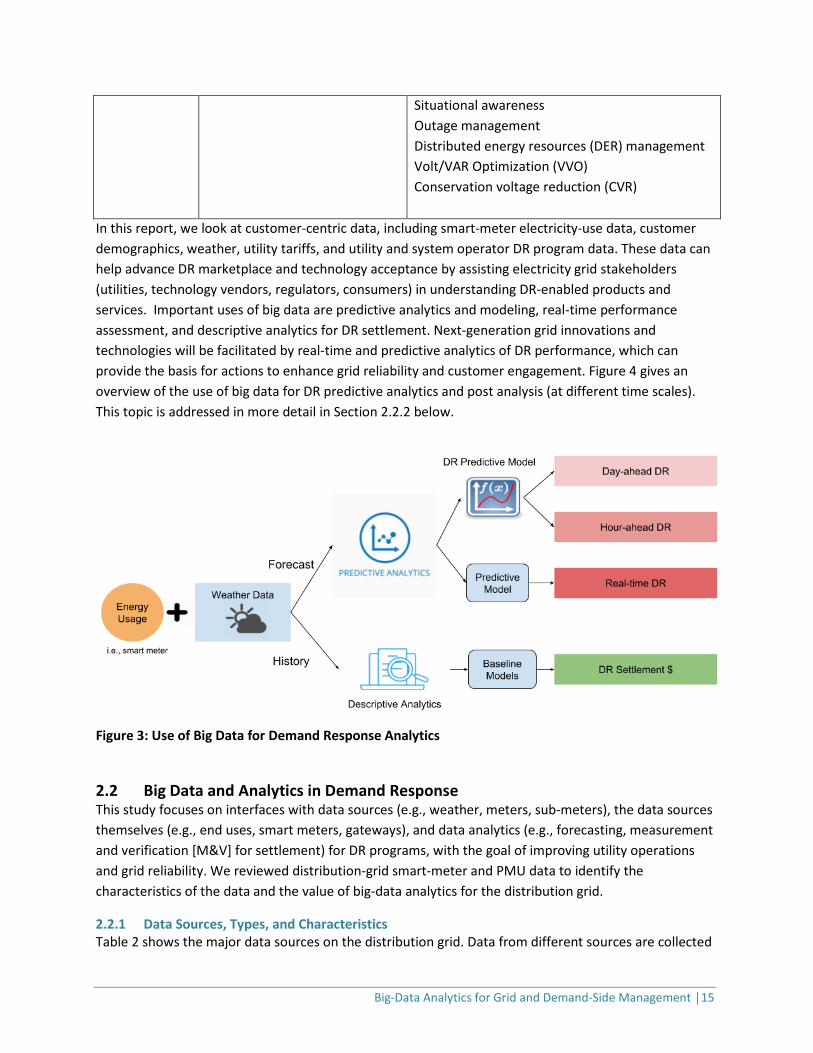
In this report, we look at customer-centric data, including smart-meter electricity-use data, customer demographics, weather, utility tariffs, and utility and system operator DR program data. These data can help advance DR marketplace and technology acceptance by assisting electricity grid stakeholders (utilities, technology vendors, regulators, consumers) in understanding DR-enabled products and services. Important uses of big data are predictive analytics and modeling, real-time performance assessment, and descriptive analytics for DR settlement. Next-generation grid innovations and technologies will be facilitated by real-time and predictive analytics of DR performance, which can provide the basis for actions to enhance grid reliability and customer engagement. Figure 4 gives an overview of the use of big data for DR predictive analytics and post analysis (at different time scales). This topic is addressed in more detail in Section 2.2.2 below.
Figure 3: Use of Big Data for Demand Response Analytics
2.2 Big Data and Analytics in Demand Response This study focuses on interfaces with data sources (e.g., weather, meters, sub-meters), the data sources themselves (e.g., end uses, smart meters, gateways), and data analytics (e.g., forecasting, measurement and verification [M&V] for settlement) for DR programs, with the goal of improving utility operations and grid reliability. We reviewed distribution-grid smart-meter and PMU data to identify the characteristics of the data and the value of big-data analytics for the distribution grid.
2.2.1 Data Sources, Types, and Characteristics Table 2 shows the major data sources on the distribution grid. Data from different sources are collected
Big-Data Analytics for Grid and Demand-Side Management │16
using different technologies [11]. This study focuses on smart-meter, PMU, electricity-price, and third-party (e.g., weather) data. Metered data can include energy and demand from various sources such as smart meters and automated metering infrastructure (AMI). Examples of smart meter and µPMU datasets are described in detail below. µPMU is used to measure the real-time synchrophasor data from the consumer voltage level. Case studies in Section 4 of this report demonstrate the use of big data from distribution-system smart meters and µPMUs. Table 2: Major Distribution System Data Sources for the Smart Grid Data sources Technology involved Remarks Advanced metering infrastructure
Smart meters Data generated from smart meters has been increasing significantly.
Distribution automation Grid and sensing equipment (PMUs)
Sensors are deployed for real-time grid monitoring and control.
Regional Transmission Organizations (RTO)/Independent System Operators (ISO)
Electricity price data (wholesale market)
These include day-ahead, real-time pre-dispatch and real-time dispatch locational marginal price data.
Off-grid data Third-party datasets (i.e., weather)
Utilities integrate data from third parties to study consumer behavior and the effect of utility programs/policies (EE and DR).
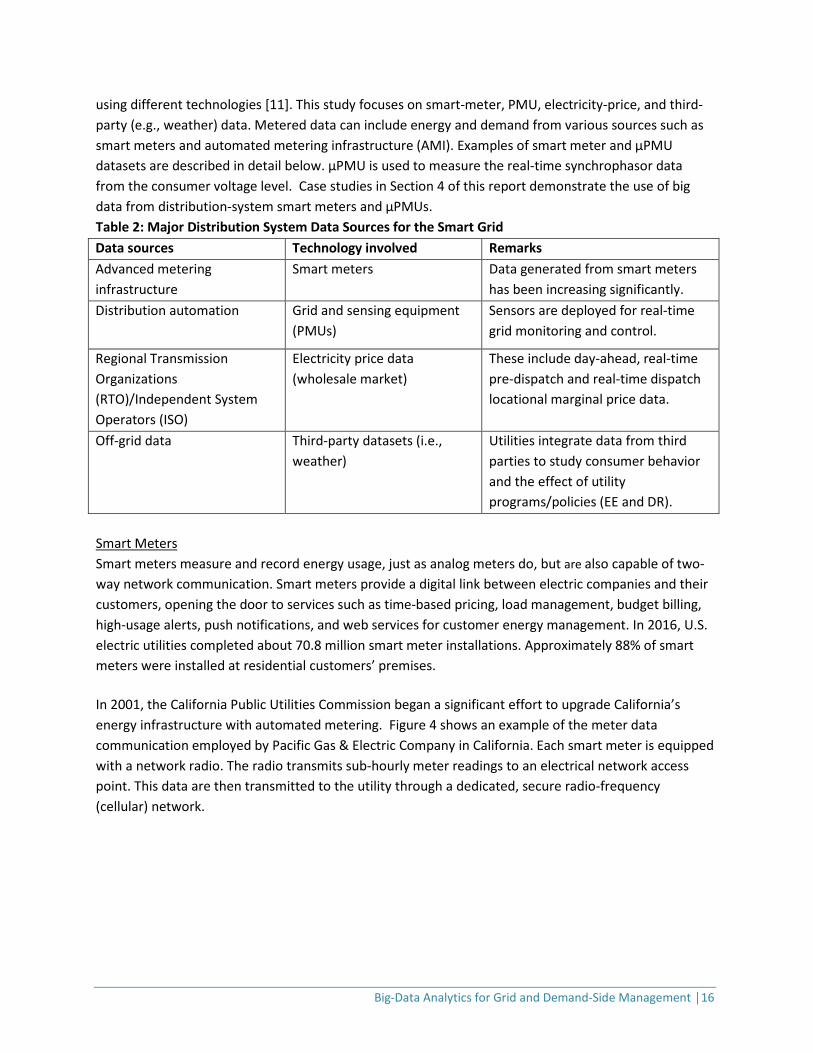
Smart Meters Smart meters measure and record energy usage, just as analog meters do, but are also capable of two-way network communication. Smart meters provide a digital link between electric companies and their customers, opening the door to services such as time-based pricing, load management, budget billing, high-usage alerts, push notifications, and web services for customer energy management. In 2016, U.S. electric utilities completed about 70.8 million smart meter installations. Approximately 88% of smart meters were installed at residential customers’ premises. In 2001, the California Public Utilities Commission began a significant effort to upgrade California’s energy infrastructure with automated metering. Figure 4 shows an example of the meter data communication employed by Pacific Gas & Electric Company in California. Each smart meter is equipped with a network radio. The radio transmits sub-hourly meter readings to an electrical network access point. This data are then transmitted to the utility through a dedicated, secure radio-frequency (cellular) network.
Big-Data Analytics for Grid and Demand-Side Management │17
Figure 4: SmartMeter™ Electric System Communication Diagram [12] Table 3 presents an example of utility smart-meter data, which are usually time-series data of power readings. Utilities integrate customer data, such as the service agreement (SA) identifier (ID) and rate schedule, with the time-interval usage data. The utility stories each customer’s other identifying information, such as location, in a different, protected database. Table 3: Example of Utility Smart-Meter Data Data type Fields Notes
Static data
SP Service point identifier (lowest level associated with a premise identifier [PREM_ID])
SA Service agreement identifier (lowest level associated with an account identifier [ACCT_ID]) for a customer
UOM Unit of measure (electric – kW/kWh/kVAR/kVARh, gas – THM/CCF)*
RS Rate schedule of associated SA
NAICS North American Industry Classification System code associated with activity at premise for associated SA
Dynamic (received from meter)
DIR Direction of electricity flow (D=delivered from grid to customer, R=received from customer to grid)
DATE Date of interval usage APCT The actual percent of intervals
VALUE Value of time measurement in 15- or 60-minute interval periods
*kW – kilowatt; kWh – kilowatt-hour; kVAR – kilovolt-ampere reactive; kVARh -- kilovolt-ampere reactive hours; THM/CCF – therm/hundred cubic feet

Big-Data Analytics for Grid and Demand-Side Management │18
Micro-Phasor Measurement Units Synchrophasors measure the angle between voltage and current at different physical locations on a power grid. Traditionally, synchrophasors have been used to investigate transmission grid stability. Distribution grids have much tinier angle differences – too small, and changing too rapidly – to resolve with traditional transmission-type PMUs, so µPMUs are required. Specifically, power flows in distribution systems are smaller and distances shorter compared to conditions on transmission systems. Voltage phase-angle differences are typically two orders of magnitude smaller on the distribution grid than on the transmission grid [13]. The increased deployment of distributed energy resources such as solar photovoltaics and electric vehicles has introduced short-term, frequent, unpredictable power-flow disturbances. An µPMU provides ultra-precise, synchronized measurements of voltage and current magnitudes and phase angles, or synchrophasors. When an µPMU is in synchrophasor mode, it communicates voltage and current magnitude and phase-angle data with very high temporal resolution in the order of 30-60 samples per second. The µPMU deployed in [14] was capable of reporting the measurement at a rate of 120 samples per second. A follow-up recent big-data analytics study [15] demonstrates the value of these high-fidelity, high-resolution sensors on distribution systems. That study presents an algorithm for detecting events by identifying edges in voltage-magnitude time-series data, and an approach for clustering events to reveal unique features that distinguish different events from one another (e.g., capacitor bank switching vs. transformer tap changes). Section 4.2. of this report describes the details of this approach. Table 4: µPMU Data Format
Data type Fields Notes
Static ID µPMU identifier
Dynamic (received from sensor)
Voltage magnitude Three-Phase voltage value (V) Current magnitude Three-Phase current value (A)
Angle between voltages Three-phase voltage angles (phase-angle difference between voltage curves)
Angle between currents Three-phase current angles (phase-angle difference between current curves)
2.2.2 Data Analytics for Demand-Response Applications DR programs are widely recognized as essential tools for utility companies [16]. Key benefits include peak-load shifting and potential elimination of costly spot-market energy purchases or capital investment in additional generation capacity [5,17]. Historically, consumption was calculated at an aggregated level and could not be easily apportioned across the customer base. Now, smart meters provide granular consumption data for the whole customer base. These data can be used to predict load-shedding from DR events. DR-related predictive analytics (at varying time scales) Increasing adoption of smart connected devices (e.g., thermostats; heating, ventilation, and air-
Big-Data Analytics for Grid and Demand-Side Management │19
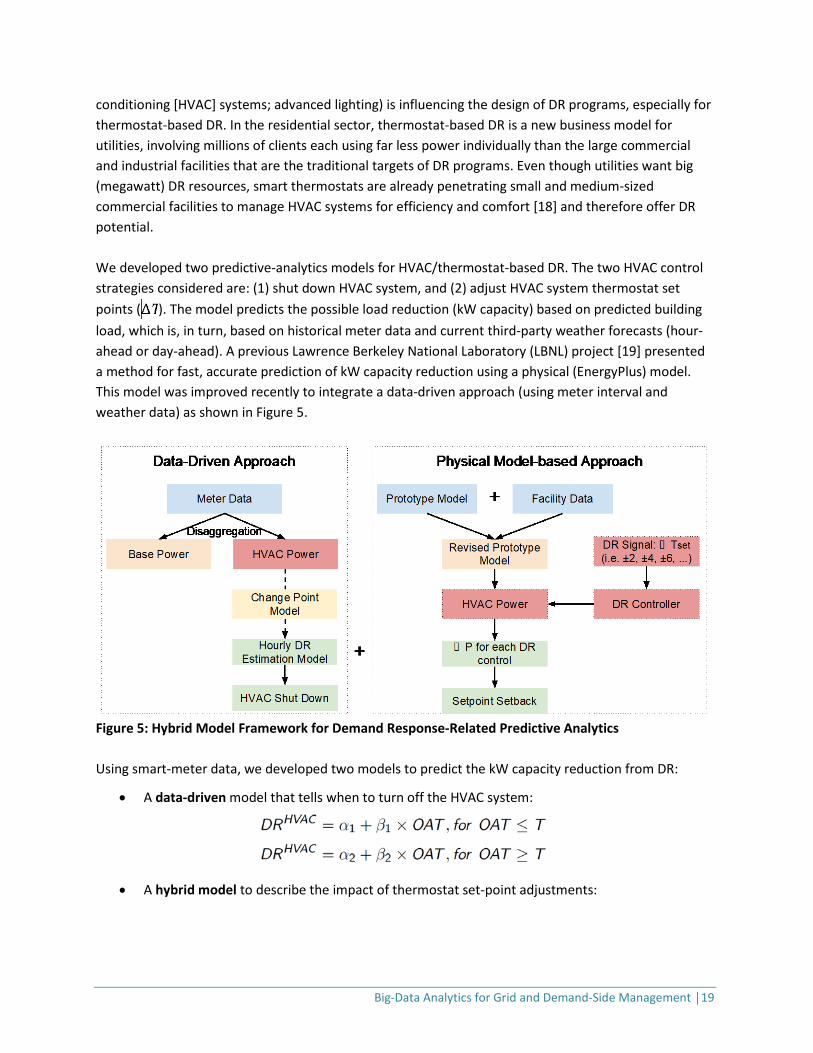
conditioning [HVAC] systems; advanced lighting) is influencing the design of DR programs, especially for thermostat-based DR. In the residential sector, thermostat-based DR is a new business model for utilities, involving millions of clients each using far less power individually than the large commercial and industrial facilities that are the traditional targets of DR programs. Even though utilities want big (megawatt) DR resources, smart thermostats are already penetrating small and medium-sized commercial facilities to manage HVAC systems for efficiency and comfort [18] and therefore offer DR potential. We developed two predictive-analytics models for HVAC/thermostat-based DR. The two HVAC control strategies considered are: (1) shut down HVAC system, and (2) adjust HVAC system thermostat set points ( ). The model predicts the possible load reduction (kW capacity) based on predicted building load, which is, in turn, based on historical meter data and current third-party weather forecasts (hour-ahead or day-ahead). A previous Lawrence Berkeley National Laboratory (LBNL) project [19] presented a method for fast, accurate prediction of kW capacity reduction using a physical (EnergyPlus) model. This model was improved recently to integrate a data-driven approach (using meter interval and weather data) as shown in Figure 5.
Figure 5: Hybrid Model Framework for Demand Response-Related Predictive Analytics Using smart-meter data, we developed two models to predict the kW capacity reduction from DR:
• A data-driven model that tells when to turn off the HVAC system:
• A hybrid model to describe the impact of thermostat set-point adjustments:
Big-Data Analytics for Grid and Demand-Side Management │20
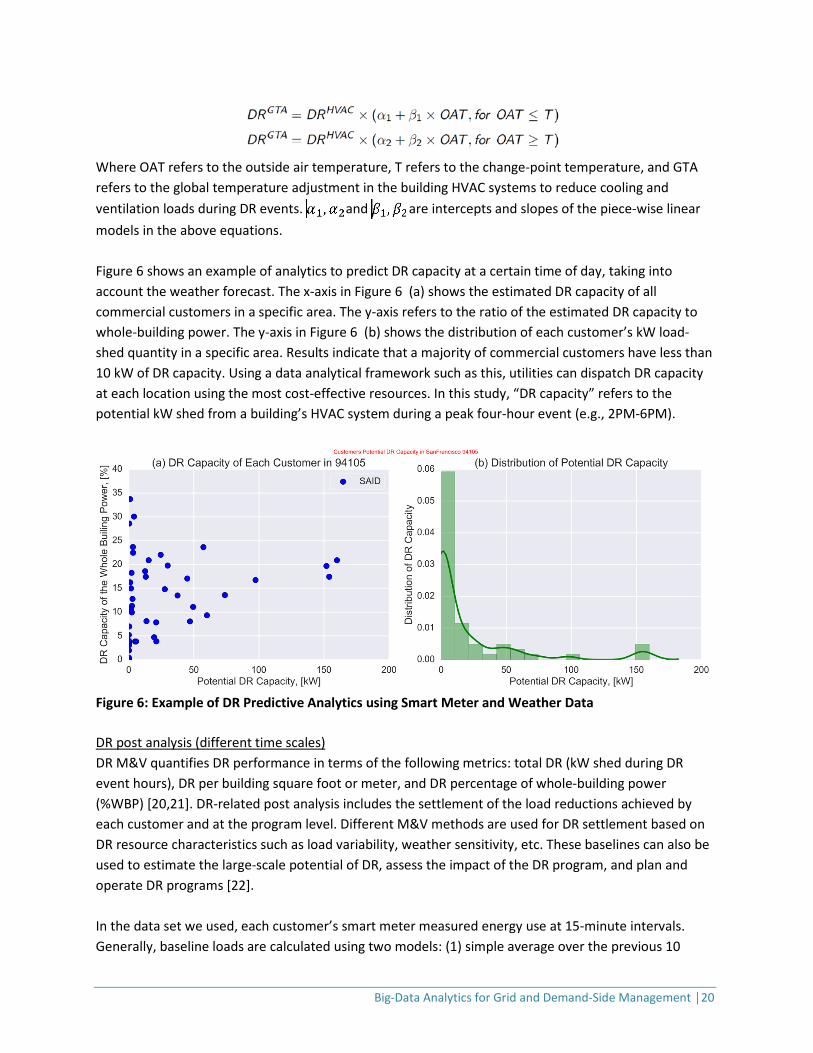
Where OAT refers to the outside air temperature, T refers to the change-point temperature, and GTA refers to the global temperature adjustment in the building HVAC systems to reduce cooling and ventilation loads during DR events. and are intercepts and slopes of the piece-wise linear models in the above equations. Figure 6 shows an example of analytics to predict DR capacity at a certain time of day, taking into account the weather forecast. The x-axis in Figure 6 (a) shows the estimated DR capacity of all commercial customers in a specific area. The y-axis refers to the ratio of the estimated DR capacity to whole-building power. The y-axis in Figure 6 (b) shows the distribution of each customer’s kW load-shed quantity in a specific area. Results indicate that a majority of commercial customers have less than 10 kW of DR capacity. Using a data analytical framework such as this, utilities can dispatch DR capacity at each location using the most cost-effective resources. In this study, “DR capacity” refers to the potential kW shed from a building’s HVAC system during a peak four-hour event (e.g., 2PM-6PM).
Figure 6: Example of DR Predictive Analytics using Smart Meter and Weather Data DR post analysis (different time scales) DR M&V quantifies DR performance in terms of the following metrics: total DR (kW shed during DR event hours), DR per building square foot or meter, and DR percentage of whole-building power (%WBP) [20,21]. DR-related post analysis includes the settlement of the load reductions achieved by each customer and at the program level. Different M&V methods are used for DR settlement based on DR resource characteristics such as load variability, weather sensitivity, etc. These baselines can also be used to estimate the large-scale potential of DR, assess the impact of the DR program, and plan and operate DR programs [22]. In the data set we used, each customer’s smart meter measured energy use at 15-minute intervals. Generally, baseline loads are calculated using two models: (1) simple average over the previous 10
Big-Data Analytics for Grid and Demand-Side Management │21
recent baseline days1 (5/10 baseline) or the highest 3 or 5 out of 10 (3/5 out of 10 baseline), with and without morning adjustment [23]; and (2) weather regression model baseline. These models are described below[24]. 10 out of 10 baseline model (10/10) The average load during the event period calculated from the previous 10 days (excluding weekends, holidays, a DR event day, and any operation off day). 10 out of 10 baseline model with morning adjustment (5/10 MA) Morning adjustments is a ratio of (a) the average load of the first three of four hours before the DR event to (b) the average load of the same hours from the selected five baseline days. The adjustment factor is limited to ±20% of the customer baseline. Weather regression baseline model For the weather regression baseline model, a whole-building power baseline is estimated first, using a regression model that assumes that whole-building power is linearly correlated with OAT. The model is computed as:
where is the predicted 15-minute interval electricity demand from time from the previous non-DR event workdays. In this study, is the 15-minute interval OAT for time . The parameters and are generated from a linear regression of the input data for time . Although these data analytics models can help improve operation and performance of DR programs, the ease of data access and the cost associated with large volumes of data make it challenging to extract the value from the data. There is a need for standards-based data access schemes, which would simplify performance assessment of DR programs.
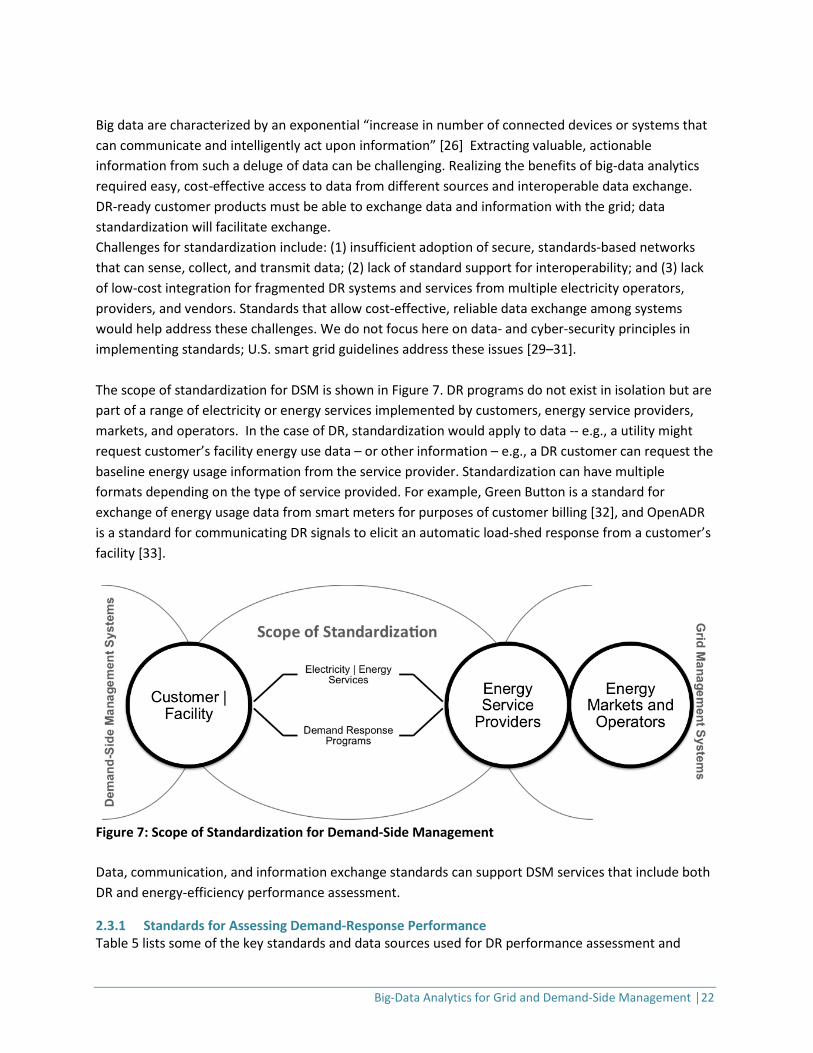
2.3 Standardizing Data to Facilitate Demand-Response Performance Assessment The cost-effectiveness of utilities’ and DR customers’ use of big data to support grid interoperability would be enhanced by data standardization. “Grid interoperability” refers to the grid’s ability to interface with disparate DR products, controls, or systems without requiring implementation-specific data translation. According to the U.S. Department of Energy’s grid modernization plan, “interoperability standards define technical requirements for defining the capability of two or more networks, systems, devices, applications, or components to externally exchange and readily use information securely and effectively” [25]. A majority of the standardization principles discussed here are derived from the study team’s research [26]. Prior studies address comprehensive applications for grid and customer transactions [27][28]; this report focuses only on assessing DR program performance.
1 Normal operation days, excluding weekends, holidays, a DR event day, and any operational off day
Big-Data Analytics for Grid and Demand-Side Management │22
Big data are characterized by an exponential “increase in number of connected devices or systems that can communicate and intelligently act upon information” [26] Extracting valuable, actionable information from such a deluge of data can be challenging. Realizing the benefits of big-data analytics required easy, cost-effective access to data from different sources and interoperable data exchange. DR-ready customer products must be able to exchange data and information with the grid; data standardization will facilitate exchange. Challenges for standardization include: (1) insufficient adoption of secure, standards-based networks that can sense, collect, and transmit data; (2) lack of standard support for interoperability; and (3) lack of low-cost integration for fragmented DR systems and services from multiple electricity operators, providers, and vendors. Standards that allow cost-effective, reliable data exchange among systems would help address these challenges. We do not focus here on data- and cyber-security principles in implementing standards; U.S. smart grid guidelines address these issues [29–31]. The scope of standardization for DSM is shown in Figure 7. DR programs do not exist in isolation but are part of a range of electricity or energy services implemented by customers, energy service providers, markets, and operators. In the case of DR, standardization would apply to data -- e.g., a utility might request customer’s facility energy use data – or other information – e.g., a DR customer can request the baseline energy usage information from the service provider. Standardization can have multiple formats depending on the type of service provided. For example, Green Button is a standard for exchange of energy usage data from smart meters for purposes of customer billing [32], and OpenADR is a standard for communicating DR signals to elicit an automatic load-shed response from a customer’s facility [33].
Figure 7: Scope of Standardization for Demand-Side Management Data, communication, and information exchange standards can support DSM services that include both DR and energy-efficiency performance assessment.
2.3.1 Standards for Assessing Demand-Response Performance Table 5 lists some of the key standards and data sources used for DR performance assessment and

Big-Data Analytics for Grid and Demand-Side Management │23
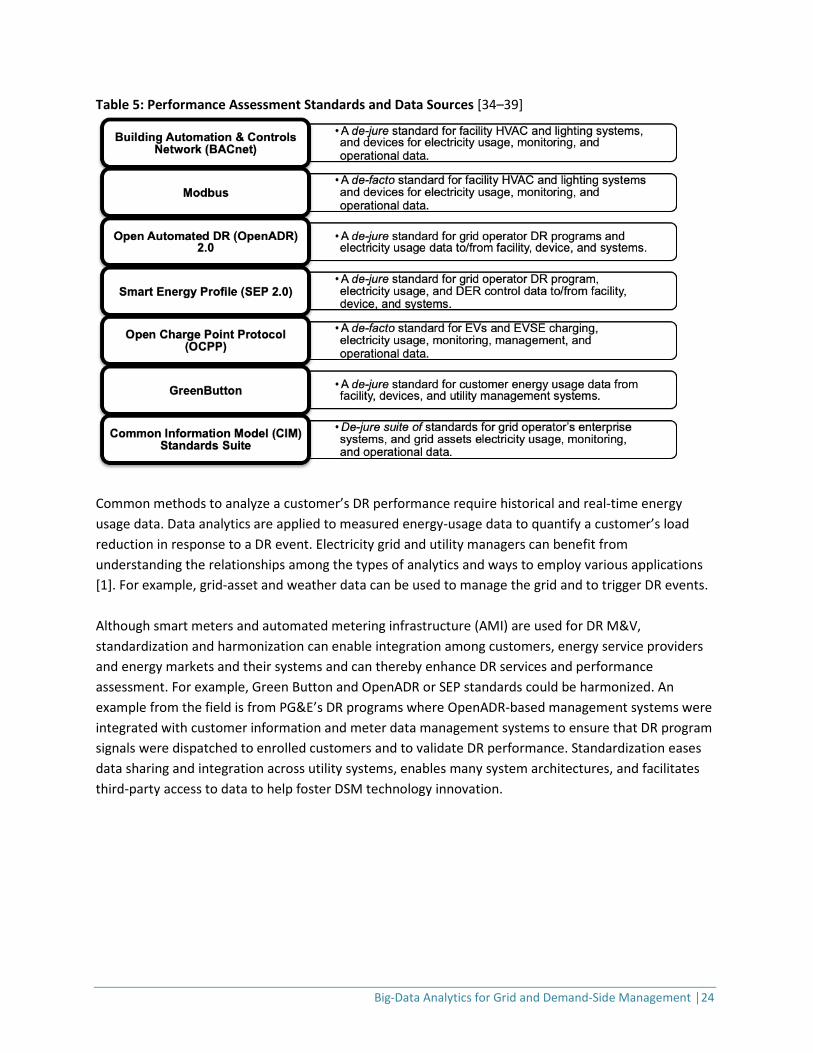
communication. The standards listed in the table were developed by formal standards development organizations (SDO) unless such a standard does not exist, as noted. The references to the table provide additional details. These standards are classified under, “de-jure” and “de-facto” standards. Here, de-jure refers to standard that is developed by an SDO and adopted by the industry. The de-facto refers to a standard that is not developed by the SDO and is still widely adopted by the industry.
Big-Data Analytics for Grid and Demand-Side Management │24
Table 5: Performance Assessment Standards and Data Sources [34–39]
Common methods to analyze a customer’s DR performance require historical and real-time energy usage data. Data analytics are applied to measured energy-usage data to quantify a customer’s load reduction in response to a DR event. Electricity grid and utility managers can benefit from understanding the relationships among the types of analytics and ways to employ various applications [1]. For example, grid-asset and weather data can be used to manage the grid and to trigger DR events. Although smart meters and automated metering infrastructure (AMI) are used for DR M&V, standardization and harmonization can enable integration among customers, energy service providers and energy markets and their systems and can thereby enhance DR services and performance assessment. For example, Green Button and OpenADR or SEP standards could be harmonized. An example from the field is from PG&E’s DR programs where OpenADR-based management systems were integrated with customer information and meter data management systems to ensure that DR program signals were dispatched to enrolled customers and to validate DR performance. Standardization eases data sharing and integration across utility systems, enables many system architectures, and facilitates third-party access to data to help foster DSM technology innovation.
Big-Data Analytics for Grid and Demand-Side Management │25
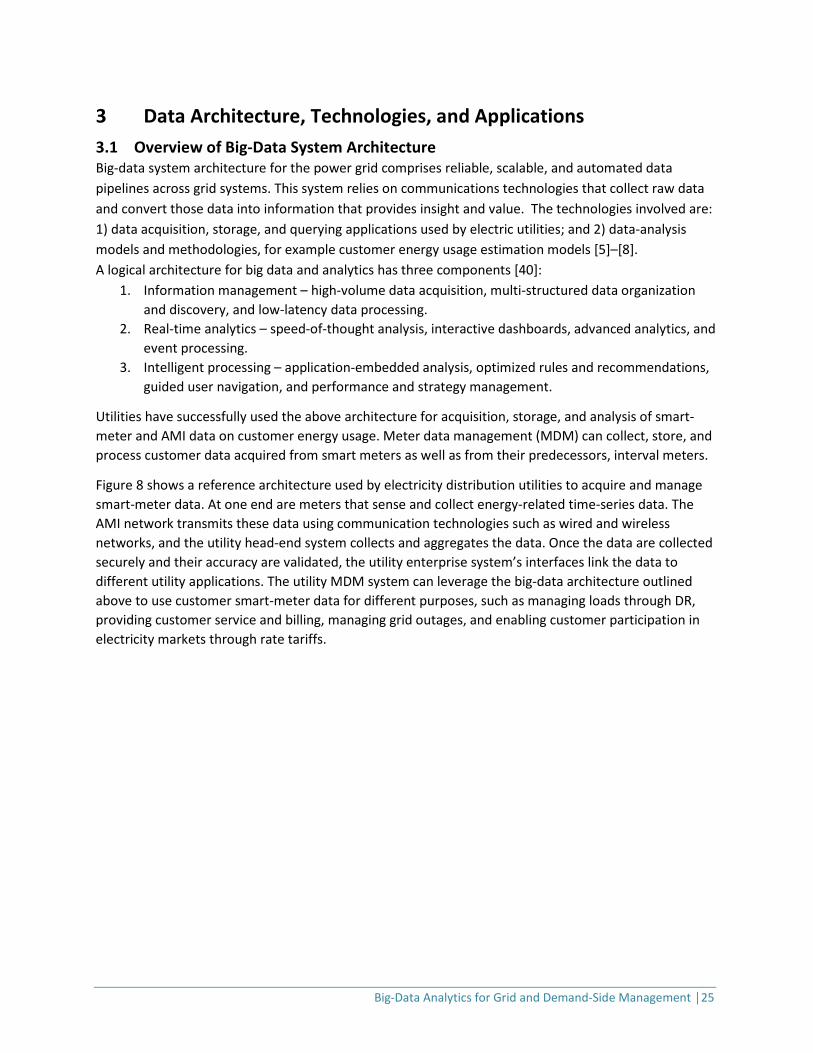
3 Data Architecture, Technologies, and Applications 3.1 Overview of Big-Data System Architecture Big-data system architecture for the power grid comprises reliable, scalable, and automated data pipelines across grid systems. This system relies on communications technologies that collect raw data and convert those data into information that provides insight and value. The technologies involved are: 1) data acquisition, storage, and querying applications used by electric utilities; and 2) data-analysis models and methodologies, for example customer energy usage estimation models [5]–[8]. A logical architecture for big data and analytics has three components [40]:
1. Information management – high-volume data acquisition, multi-structured data organization and discovery, and low-latency data processing.
2. Real-time analytics – speed-of-thought analysis, interactive dashboards, advanced analytics, and event processing.
3. Intelligent processing – application-embedded analysis, optimized rules and recommendations, guided user navigation, and performance and strategy management.
Utilities have successfully used the above architecture for acquisition, storage, and analysis of smart-meter and AMI data on customer energy usage. Meter data management (MDM) can collect, store, and process customer data acquired from smart meters as well as from their predecessors, interval meters.
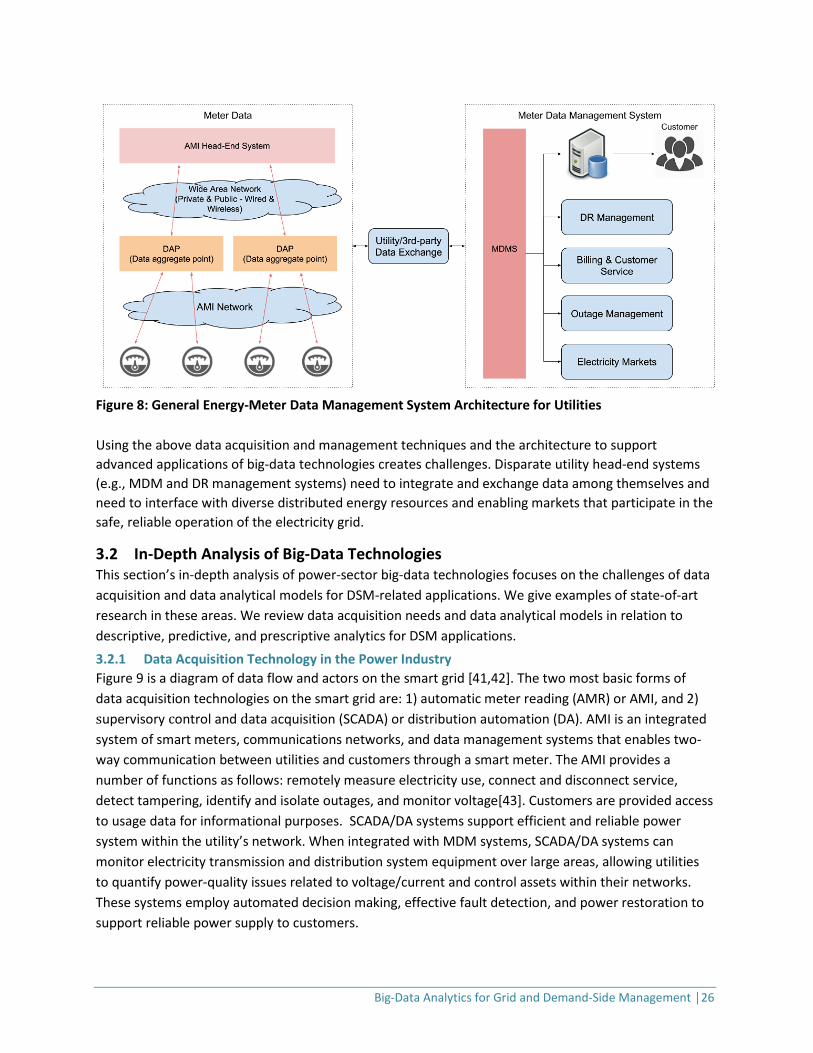
Figure 8 shows a reference architecture used by electricity distribution utilities to acquire and manage smart-meter data. At one end are meters that sense and collect energy-related time-series data. The AMI network transmits these data using communication technologies such as wired and wireless networks, and the utility head-end system collects and aggregates the data. Once the data are collected securely and their accuracy are validated, the utility enterprise system’s interfaces link the data to different utility applications. The utility MDM system can leverage the big-data architecture outlined above to use customer smart-meter data for different purposes, such as managing loads through DR, providing customer service and billing, managing grid outages, and enabling customer participation in electricity markets through rate tariffs.
Big-Data Analytics for Grid and Demand-Side Management │26
Figure 8: General Energy-Meter Data Management System Architecture for Utilities Using the above data acquisition and management techniques and the architecture to support advanced applications of big-data technologies creates challenges. Disparate utility head-end systems (e.g., MDM and DR management systems) need to integrate and exchange data among themselves and need to interface with diverse distributed energy resources and enabling markets that participate in the safe, reliable operation of the electricity grid.
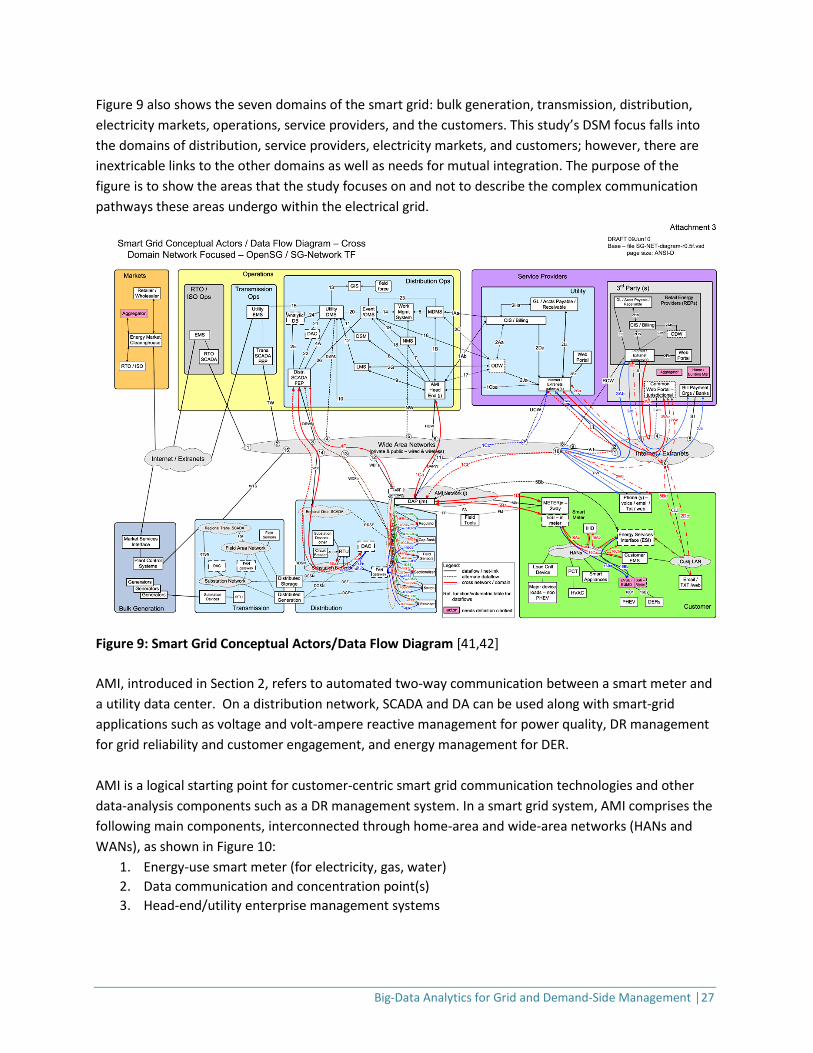
3.2 In-Depth Analysis of Big-Data Technologies This section’s in-depth analysis of power-sector big-data technologies focuses on the challenges of data acquisition and data analytical models for DSM-related applications. We give examples of state-of-art research in these areas. We review data acquisition needs and data analytical models in relation to descriptive, predictive, and prescriptive analytics for DSM applications. 3.2.1 Data Acquisition Technology in the Power Industry Figure 9 is a diagram of data flow and actors on the smart grid [41,42]. The two most basic forms of data acquisition technologies on the smart grid are: 1) automatic meter reading (AMR) or AMI, and 2) supervisory control and data acquisition (SCADA) or distribution automation (DA). AMI is an integrated system of smart meters, communications networks, and data management systems that enables two-way communication between utilities and customers through a smart meter. The AMI provides a number of functions as follows: remotely measure electricity use, connect and disconnect service, detect tampering, identify and isolate outages, and monitor voltage[43]. Customers are provided access to usage data for informational purposes. SCADA/DA systems support efficient and reliable power system within the utility’s network. When integrated with MDM systems, SCADA/DA systems can monitor electricity transmission and distribution system equipment over large areas, allowing utilities to quantify power-quality issues related to voltage/current and control assets within their networks. These systems employ automated decision making, effective fault detection, and power restoration to support reliable power supply to customers.
Big-Data Analytics for Grid and Demand-Side Management │27
Figure 9 also shows the seven domains of the smart grid: bulk generation, transmission, distribution, electricity markets, operations, service providers, and the customers. This study’s DSM focus falls into the domains of distribution, service providers, electricity markets, and customers; however, there are inextricable links to the other domains as well as needs for mutual integration. The purpose of the figure is to show the areas that the study focuses on and not to describe the complex communication pathways these areas undergo within the electrical grid.
Figure 9: Smart Grid Conceptual Actors/Data Flow Diagram [41,42] AMI, introduced in Section 2, refers to automated two-way communication between a smart meter and a utility data center. On a distribution network, SCADA and DA can be used along with smart-grid applications such as voltage and volt-ampere reactive management for power quality, DR management for grid reliability and customer engagement, and energy management for DER. AMI is a logical starting point for customer-centric smart grid communication technologies and other data-analysis components such as a DR management system. In a smart grid system, AMI comprises the following main components, interconnected through home-area and wide-area networks (HANs and WANs), as shown in Figure 10:
1. Energy-use smart meter (for electricity, gas, water) 2. Data communication and concentration point(s) 3. Head-end/utility enterprise management systems
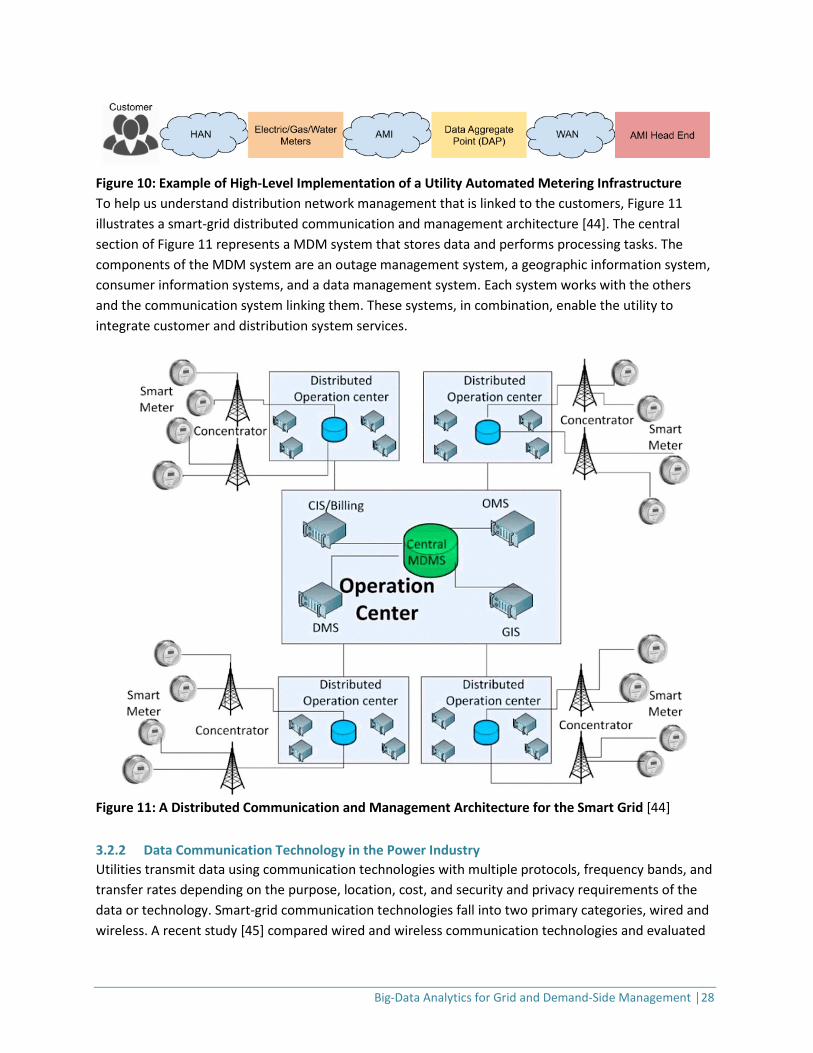
Big-Data Analytics for Grid and Demand-Side Management │28
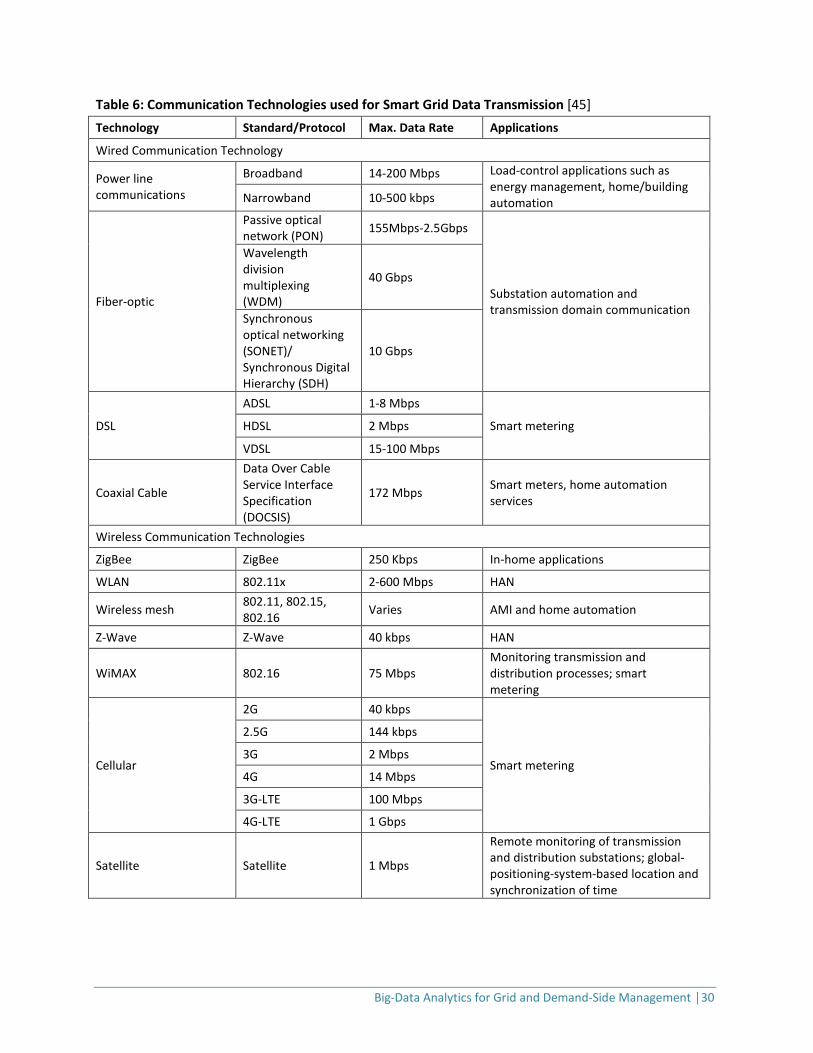
Figure 10: Example of High-Level Implementation of a Utility Automated Metering Infrastructure To help us understand distribution network management that is linked to the customers, Figure 11 illustrates a smart-grid distributed communication and management architecture [44]. The central section of Figure 11 represents a MDM system that stores data and performs processing tasks. The components of the MDM system are an outage management system, a geographic information system, consumer information systems, and a data management system. Each system works with the others and the communication system linking them. These systems, in combination, enable the utility to integrate customer and distribution system services.
Figure 11: A Distributed Communication and Management Architecture for the Smart Grid [44] 3.2.2 Data Communication Technology in the Power Industry Utilities transmit data using communication technologies with multiple protocols, frequency bands, and transfer rates depending on the purpose, location, cost, and security and privacy requirements of the data or technology. Smart-grid communication technologies fall into two primary categories, wired and wireless. A recent study [45] compared wired and wireless communication technologies and evaluated

Big-Data Analytics for Grid and Demand-Side Management │29
their applications on the smart grid. Wired Communication Technologies Most utility service providers prefer wired communication, transmitting energy data over power lines. The most important advantages of wired communication are reliability and insensitivity to interference. Types of wired communications include:
1. Power-line communications, which send data over existing power cables. There are two classes: broadband and low- and high-data-rate narrowband. Broadband operates in the 1.8-250 megahertz (MHz) range and has a physical layer rate ranging from several megabits per second (Mbps) to several hundred Mbps. Low- and high-data-rate narrowband operate in the 3 kilohertz (kHz) to ~500 kHz range and have physical layer rates of 1-10 kilobits per second (Kbps) for low data rate and 10-500 kbps for high data rate [46].
2. Fiber-optic communication is a fundamental communication technology for a WAN because it has a relatively high data rate and is immune to noise. High data rates range from 155 Mbps to 40 gigabits per second (Gbps).
3. Digital subscriber line (DSL) is used to transmit digital data over telephone lines. There are three DSL systems: asymmetric (ADSL), high-speed (HDSL), and very-high-data rate (VDSL). ADSL has data rates up to 8Mbps downstream and 800 Kbps upstream, HDSL has data rates of up to 2 Mbps, and VDSL has data rates up to 100 Mbps.
4. Coaxial cable communications on the cable infrastructure, which can provide data rates up to 170 Mbps.
Wireless Communication Technologies
1. ZigBee is a wireless personal-area-network protocol that provides data rates range from 20 kbps to 250 kbps.
2. A wireless local area network (WLAN) is based on Institute of Electrical and Electronics Engineers (IEEE) standard 802.11 [47]. A WLAN provides data rates range from 2 Mbps to 600 Mbps.
3. A wireless mesh network has many nodes of mesh clients and routers. 4. Z-Wave is a proprietary wireless technology that is suitable for short-range communications and
supports data rate of up to 40 kbps. 5. WiMAX is a 4G wireless technology based on the IEEE 802.16 set of standards [48]. It provides
data rates of up to 75 Mbps. 6. The cellular network is a communication network in which the last link is wireless. The data
rates depend on which generation of the network is used: 2G, 2.5G, 3G, and 4G provide data rates of 14.4 kbps, 144 kbps, 2 Mbps, and 14 Mbps, respectively.
7. Satellite communication transfers signals between two nodes and has data rates of up to 1 Mbps.
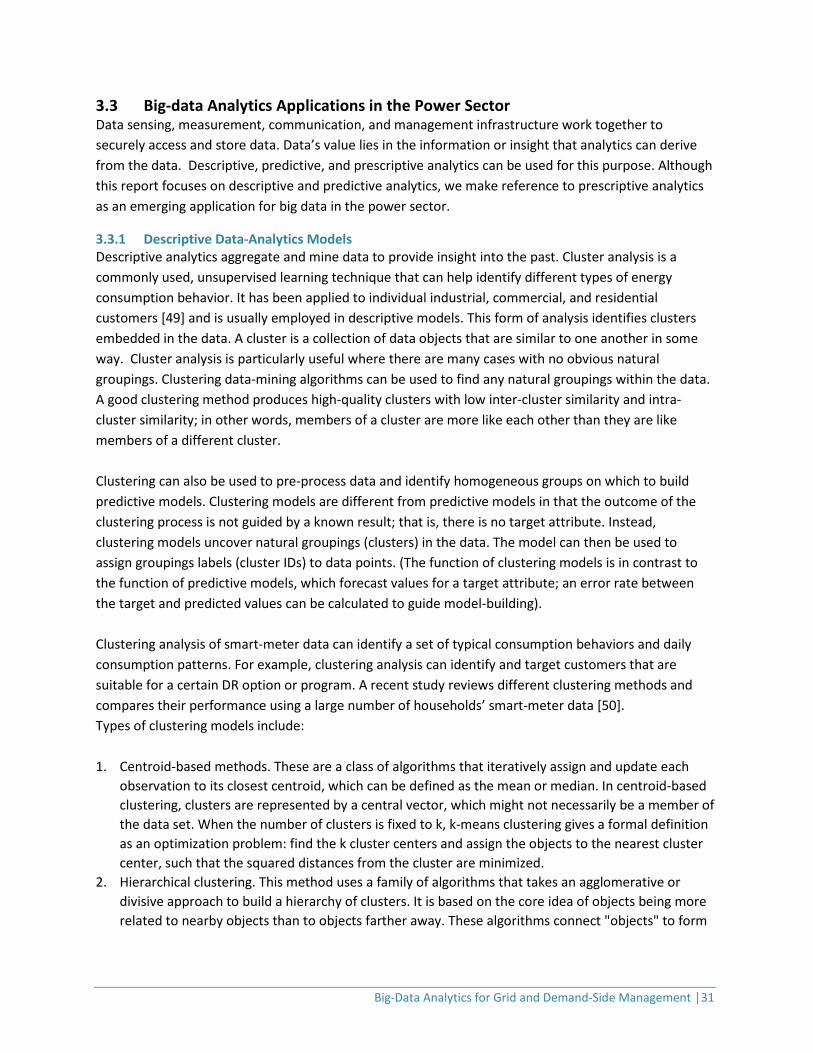
The above descriptions illustrate the diversity of communication technologies among utilities and applications. Table 6 summarizes the types of communication technologies used for smart-grid data transmission [45].
Big-Data Analytics for Grid and Demand-Side Management │30
Table 6: Communication Technologies used for Smart Grid Data Transmission [45] Technology Standard/Protocol Max. Data Rate Applications
Wired Communication Technology
Power line communications
Broadband 14-200 Mbps Load-control applications such as energy management, home/building automation Narrowband 10-500 kbps
Fiber-optic
Passive optical network (PON) 155Mbps-2.5Gbps
Substation automation and transmission domain communication
Wavelength division multiplexing (WDM)
40 Gbps
Synchronous optical networking (SONET)/ Synchronous Digital Hierarchy (SDH)
10 Gbps
DSL
ADSL 1-8 Mbps
Smart metering HDSL 2 Mbps
VDSL 15-100 Mbps
Coaxial Cable
Data Over Cable Service Interface Specification (DOCSIS)
172 Mbps Smart meters, home automation services
Wireless Communication Technologies
ZigBee ZigBee 250 Kbps In-home applications
WLAN 802.11x 2-600 Mbps HAN
Wireless mesh 802.11, 802.15, 802.16 Varies AMI and home automation
Z-Wave Z-Wave 40 kbps HAN
WiMAX 802.16 75 Mbps Monitoring transmission and distribution processes; smart metering
Cellular
2G 40 kbps
Smart metering
2.5G 144 kbps
3G 2 Mbps
4G 14 Mbps
3G-LTE 100 Mbps
4G-LTE 1 Gbps
Satellite Satellite 1 Mbps
Remote monitoring of transmission and distribution substations; global-positioning-system-based location and synchronization of time
Big-Data Analytics for Grid and Demand-Side Management │31
3.3 Big-data Analytics Applications in the Power Sector Data sensing, measurement, communication, and management infrastructure work together to securely access and store data. Data’s value lies in the information or insight that analytics can derive from the data. Descriptive, predictive, and prescriptive analytics can be used for this purpose. Although this report focuses on descriptive and predictive analytics, we make reference to prescriptive analytics as an emerging application for big data in the power sector.
3.3.1 Descriptive Data-Analytics Models Descriptive analytics aggregate and mine data to provide insight into the past. Cluster analysis is a commonly used, unsupervised learning technique that can help identify different types of energy consumption behavior. It has been applied to individual industrial, commercial, and residential customers [49] and is usually employed in descriptive models. This form of analysis identifies clusters embedded in the data. A cluster is a collection of data objects that are similar to one another in some way. Cluster analysis is particularly useful where there are many cases with no obvious natural groupings. Clustering data-mining algorithms can be used to find any natural groupings within the data. A good clustering method produces high-quality clusters with low inter-cluster similarity and intra-cluster similarity; in other words, members of a cluster are more like each other than they are like members of a different cluster. Clustering can also be used to pre-process data and identify homogeneous groups on which to build predictive models. Clustering models are different from predictive models in that the outcome of the clustering process is not guided by a known result; that is, there is no target attribute. Instead, clustering models uncover natural groupings (clusters) in the data. The model can then be used to assign groupings labels (cluster IDs) to data points. (The function of clustering models is in contrast to the function of predictive models, which forecast values for a target attribute; an error rate between the target and predicted values can be calculated to guide model-building). Clustering analysis of smart-meter data can identify a set of typical consumption behaviors and daily consumption patterns. For example, clustering analysis can identify and target customers that are suitable for a certain DR option or program. A recent study reviews different clustering methods and compares their performance using a large number of households’ smart-meter data [50]. Types of clustering models include: 1. Centroid-based methods. These are a class of algorithms that iteratively assign and update each
observation to its closest centroid, which can be defined as the mean or median. In centroid-based clustering, clusters are represented by a central vector, which might not necessarily be a member of the data set. When the number of clusters is fixed to k, k-means clustering gives a formal definition as an optimization problem: find the k cluster centers and assign the objects to the nearest cluster center, such that the squared distances from the cluster are minimized.
2. Hierarchical clustering. This method uses a family of algorithms that takes an agglomerative or divisive approach to build a hierarchy of clusters. It is based on the core idea of objects being more related to nearby objects than to objects farther away. These algorithms connect "objects" to form

Big-Data Analytics for Grid and Demand-Side Management │32
"clusters" based on their distances from one another. A cluster can be described using the maximum distance needed to connect parts of the cluster.
3. Density-based clustering. This approach uses a data-clustering algorithm proposed by Ester et al. [51]. Density-based spatial clustering of applications with noise is one of the most common clustering algorithms. Given a set of points in a space, this algorithm groups points that are closely packed together (points with many nearby neighbors), marking as outliers points that are alone in low-density regions (i.e., whose nearest neighbors are too far away). Compared to K-means clustering, density-based spatial clustering of applications with noise can find non-linearly-separable clusters.
4. Model-based clustering. This approach assumes that the data are generated by a mixture of probability distributions in which each component represents a different cluster [52]. A gaussian mixture model is commonly used for load-shape clustering in the power industry. This model assumes that the observation of each cluster of the data is gaussian. A better representation of the data can be built by increasing the number of components of the gaussian distribution and finding suitable parameters (means and covariance).
A recent DR potential study [5,17] used 15-minute electricity usage data from more than 200,000 smart meters from California’s three IOUs (Pacific Gas & Electric Company, Southern California Edison, and San Diego Gas & Electric) to define and analyze characteristic customer load profiles for the data clusters. Using these data, approximately 3,500 representative customer clusters were developed, characterized by a typical demographic profile, location, and hourly end-use load estimates.
3.3.2 Predictive Data-Analytics Models A variety of statistical, modeling, data mining, and machine-learning techniques are utilized to study recent and historical data to make predictions about the future. We describe the following predictive models: (1) load-shape regression model, (2) change-point regression model, (3) seasonality and trend decomposition [53]. Load-Shape Regression Model Predicting electrical loads based on their shape and trends over time is a mature field that forecasts consumption, detects anomalies, and analyzes the impact of DR and efficiency measures. The most common load-shape regression technique uses heating and cooling degree-days to normalize monthly consumption. Degree-day is a quantitative index that has been demonstrated to reflect demand for energy to heat or cool houses and businesses. Over the years, various other approaches have been developed using techniques such as neural networks, autoregressive integrated moving average models, and more complex regression models. The load-shape regression model was developed by LBNL [54] and [55] and has been implemented mostly for evaluating DR. The model is based on two features: a time-of-week indicator and an outdoor air-temperature dependence. It is also known as the time-of-week and temperature model or the LBNL regression model and is implemented in the load-shape library developed by LBNL [56].
Big-Data Analytics for Grid and Demand-Side Management │33
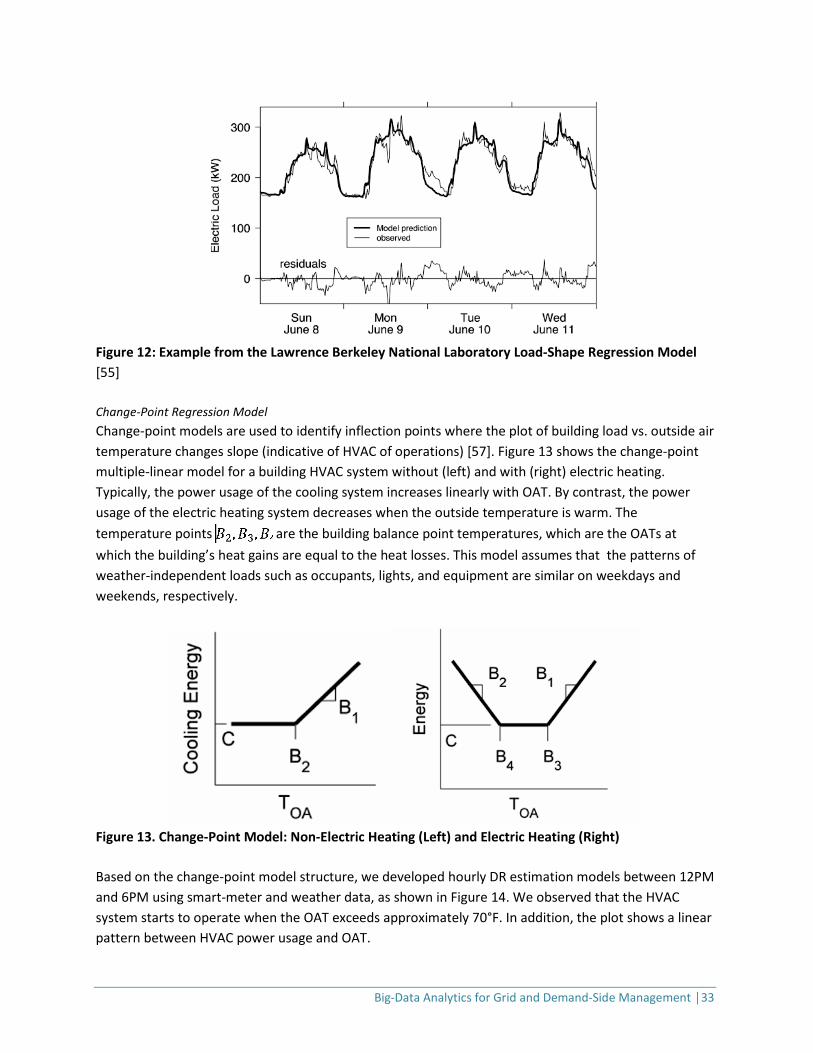
Figure 12: Example from the Lawrence Berkeley National Laboratory Load-Shape Regression Model [55] Change-Point Regression Model Change-point models are used to identify inflection points where the plot of building load vs. outside air temperature changes slope (indicative of HVAC of operations) [57]. Figure 13 shows the change-point multiple-linear model for a building HVAC system without (left) and with (right) electric heating. Typically, the power usage of the cooling system increases linearly with OAT. By contrast, the power usage of the electric heating system decreases when the outside temperature is warm. The temperature points are the building balance point temperatures, which are the OATs at which the building’s heat gains are equal to the heat losses. This model assumes that the patterns of weather-independent loads such as occupants, lights, and equipment are similar on weekdays and weekends, respectively.
Figure 13. Change-Point Model: Non-Electric Heating (Left) and Electric Heating (Right) Based on the change-point model structure, we developed hourly DR estimation models between 12PM and 6PM using smart-meter and weather data, as shown in Figure 14. We observed that the HVAC system starts to operate when the OAT exceeds approximately 70°F. In addition, the plot shows a linear pattern between HVAC power usage and OAT.
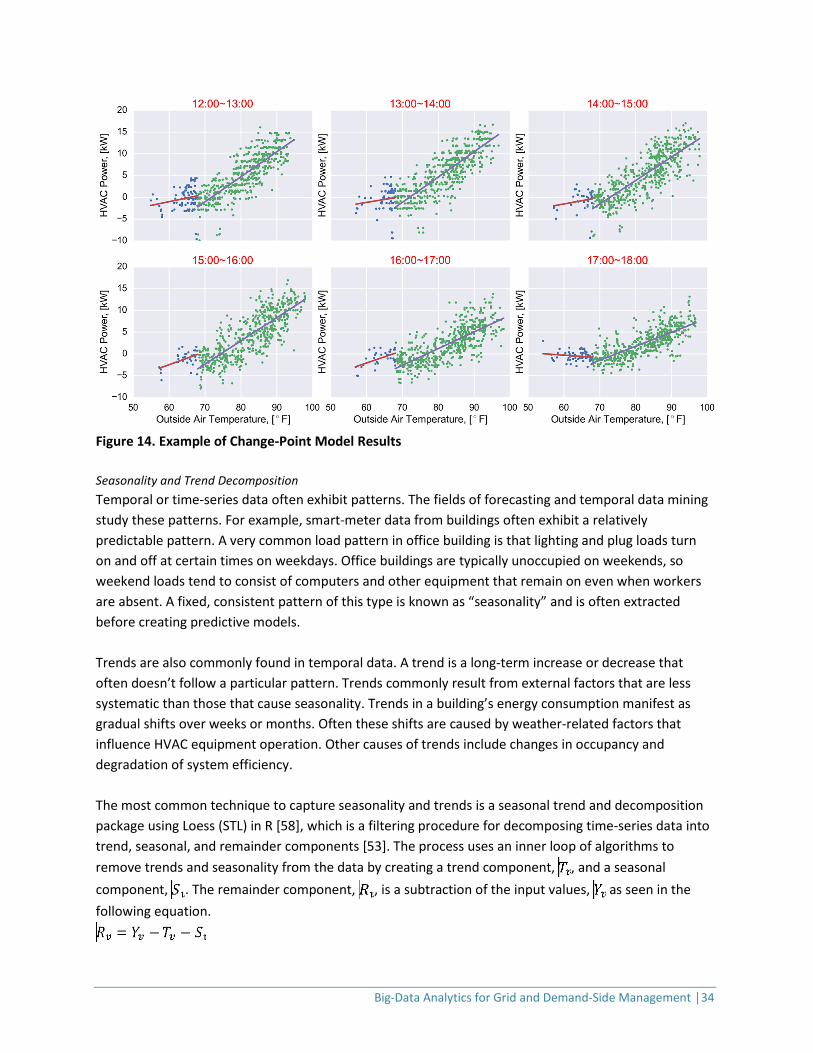
Big-Data Analytics for Grid and Demand-Side Management │34
Figure 14. Example of Change-Point Model Results Seasonality and Trend Decomposition Temporal or time-series data often exhibit patterns. The fields of forecasting and temporal data mining study these patterns. For example, smart-meter data from buildings often exhibit a relatively predictable pattern. A very common load pattern in office building is that lighting and plug loads turn on and off at certain times on weekdays. Office buildings are typically unoccupied on weekends, so weekend loads tend to consist of computers and other equipment that remain on even when workers are absent. A fixed, consistent pattern of this type is known as “seasonality” and is often extracted before creating predictive models. Trends are also commonly found in temporal data. A trend is a long-term increase or decrease that often doesn’t follow a particular pattern. Trends commonly result from external factors that are less systematic than those that cause seasonality. Trends in a building’s energy consumption manifest as gradual shifts over weeks or months. Often these shifts are caused by weather-related factors that influence HVAC equipment operation. Other causes of trends include changes in occupancy and degradation of system efficiency. The most common technique to capture seasonality and trends is a seasonal trend and decomposition package using Loess (STL) in R [58], which is a filtering procedure for decomposing time-series data into trend, seasonal, and remainder components [53]. The process uses an inner loop of algorithms to remove trends and seasonality from the data by creating a trend component, , and a seasonal component, . The remainder component, , is a subtraction of the input values, as seen in the following equation.
Big-Data Analytics for Grid and Demand-Side Management │35
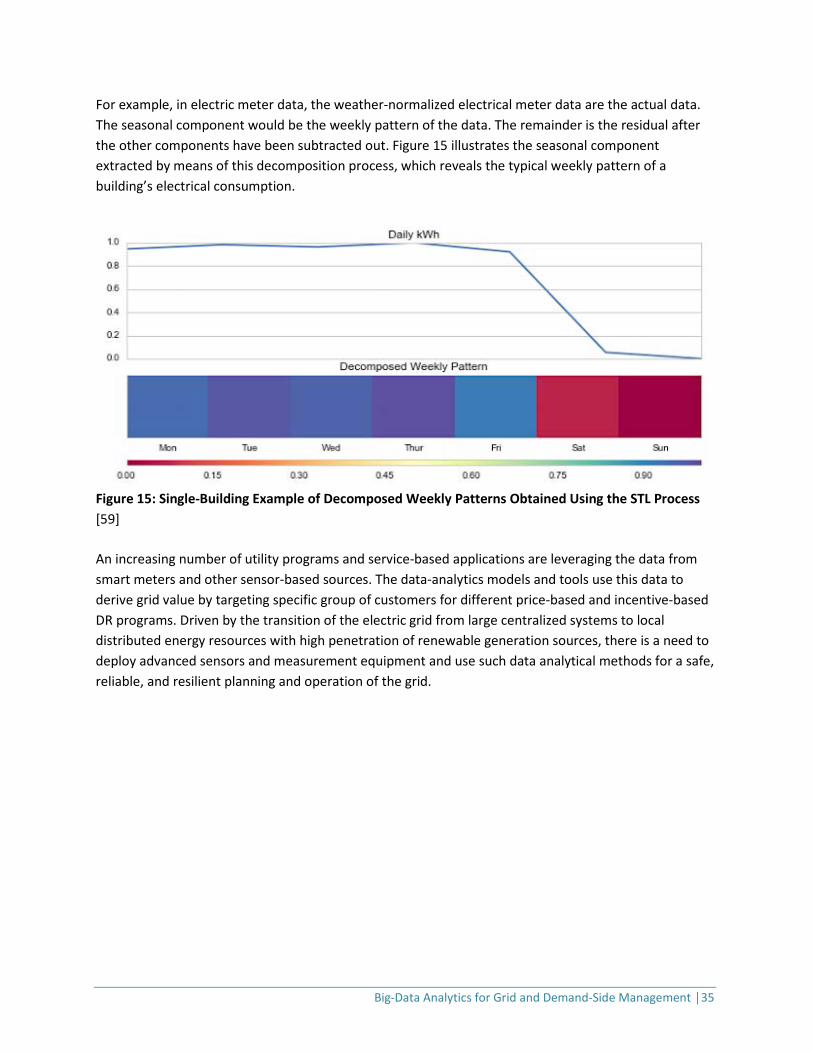
For example, in electric meter data, the weather-normalized electrical meter data are the actual data. The seasonal component would be the weekly pattern of the data. The remainder is the residual after the other components have been subtracted out. Figure 15 illustrates the seasonal component extracted by means of this decomposition process, which reveals the typical weekly pattern of a building’s electrical consumption.
Figure 15: Single-Building Example of Decomposed Weekly Patterns Obtained Using the STL Process [59] An increasing number of utility programs and service-based applications are leveraging the data from smart meters and other sensor-based sources. The data-analytics models and tools use this data to derive grid value by targeting specific group of customers for different price-based and incentive-based DR programs. Driven by the transition of the electric grid from large centralized systems to local distributed energy resources with high penetration of renewable generation sources, there is a need to deploy advanced sensors and measurement equipment and use such data analytical methods for a safe, reliable, and resilient planning and operation of the grid.
Big-Data Analytics for Grid and Demand-Side Management │36
4 Big-Data Applications for the Power Industry: A Predictive Analytics Model and Two Case Studies
This section describes a predictive analytics model used for DR programs and peak load management in commercial buildings and two utility case studies of big-data analytics applications, one using synchrophasor data and one using utility smart meter data. The case studies illustrate methods and applications described in Section 3. Before we provide case studies, examples of key applications of big data in the power sector are presented, which support utility-specific case studies on use of data and analytical methods. Such applications focus on addressing the following challenges:
• Smart energy management using smart meters, AMI, and meter data management systems (MDMS).
• Customer energy-use for demand forecasting and supply-side planning • Customer DR performance assessment using integrated demand response management systems
(DRMS) and MDMS
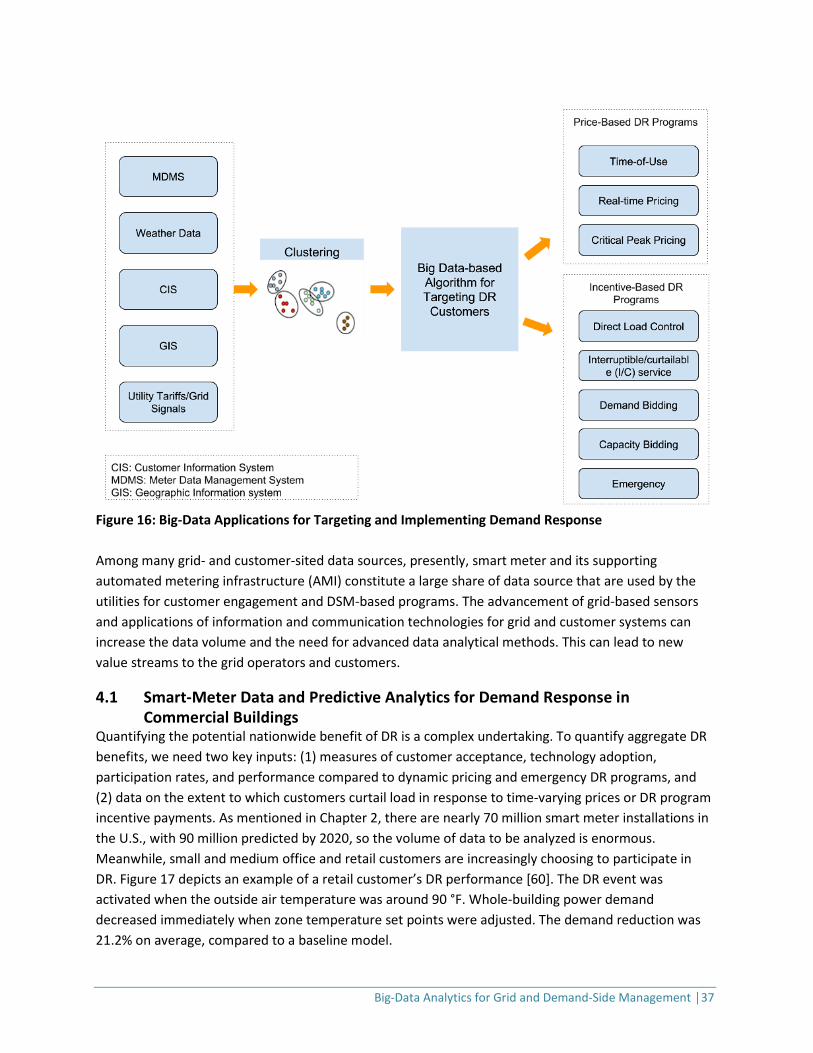
As an example of integrating the utility smart meter, AMI, and MDMS, DR and enabling electricity market participation by the customers, shows how different systems and data sources are used for clustering and big data analytics techniques to offer price-based and incentive-based DR programs and its management by the utilities. The existing systems such as MDMS, customer information system, geographic information system, and other data sources such as weather and utility electricity rate tariffs (liked to wholesale markets, as applicable) are used as analysis to offer targeted signals to DR customers. Such data analytics techniques offer locational-based dispatch capabilities to the utilities using big data analytics-based intelligence for situational awareness of the grid conditions and improve grid reliability. Figure 16 represents such big data analytics techniques, customer-centric DR programs, and utility systems used to collect and analyze the data for targeted grid applications.
Big-Data Analytics for Grid and Demand-Side Management │37
Figure 16: Big-Data Applications for Targeting and Implementing Demand Response Among many grid- and customer-sited data sources, presently, smart meter and its supporting automated metering infrastructure (AMI) constitute a large share of data source that are used by the utilities for customer engagement and DSM-based programs. The advancement of grid-based sensors and applications of information and communication technologies for grid and customer systems can increase the data volume and the need for advanced data analytical methods. This can lead to new value streams to the grid operators and customers.
4.1 Smart-Meter Data and Predictive Analytics for Demand Response in Commercial Buildings
Quantifying the potential nationwide benefit of DR is a complex undertaking. To quantify aggregate DR benefits, we need two key inputs: (1) measures of customer acceptance, technology adoption, participation rates, and performance compared to dynamic pricing and emergency DR programs, and (2) data on the extent to which customers curtail load in response to time-varying prices or DR program incentive payments. As mentioned in Chapter 2, there are nearly 70 million smart meter installations in the U.S., with 90 million predicted by 2020, so the volume of data to be analyzed is enormous. Meanwhile, small and medium office and retail customers are increasingly choosing to participate in DR. Figure 17 depicts an example of a retail customer’s DR performance [60]. The DR event was activated when the outside air temperature was around 90 °F. Whole-building power demand decreased immediately when zone temperature set points were adjusted. The demand reduction was 21.2% on average, compared to a baseline model.
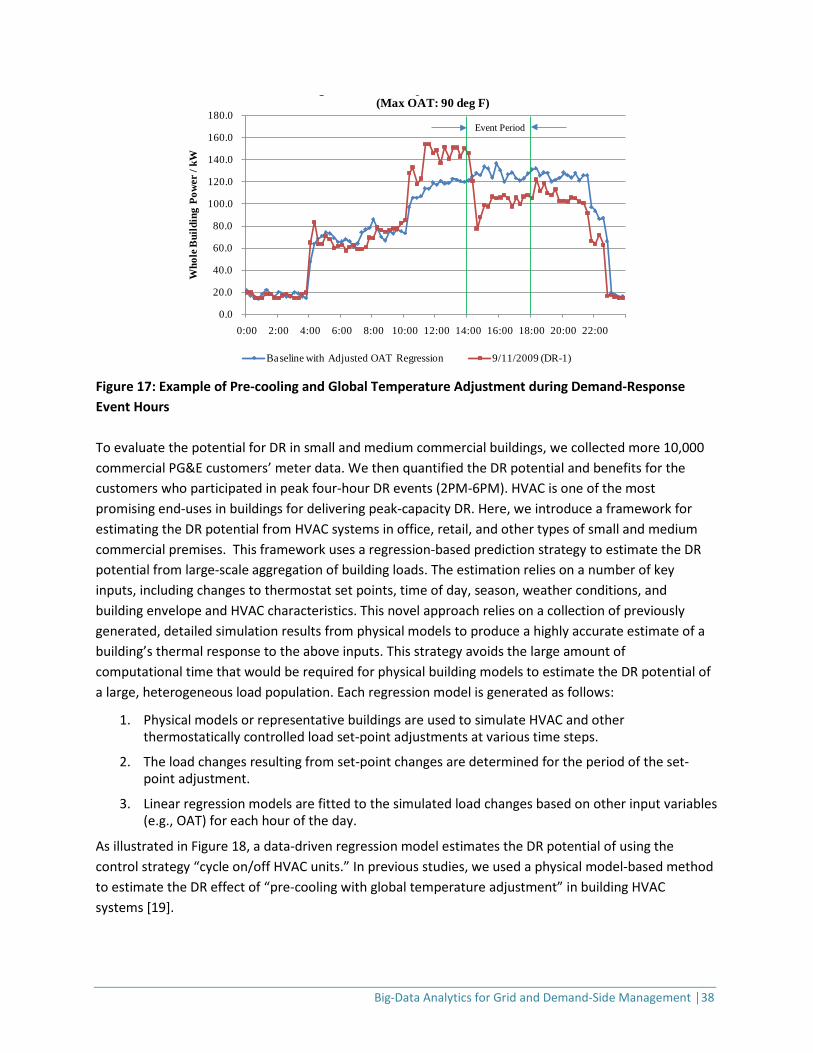
Big-Data Analytics for Grid and Demand-Side Management │38
0.0
20.0
40.0
60.0
80.0
100.0
120.0
140.0
160.0
180.0
0:00 2:00 4:00 6:00 8:00 10:00 12:00 14:00 16:00 18:00 20:00 22:00
Who
le B
uild
ing
Pow
er /
kW
g p (Max OAT: 90 deg F)
Baseline with Adjusted OAT Regression 9/11/2009 (DR-1)
Event Period
Figure 17: Example of Pre-cooling and Global Temperature Adjustment during Demand-Response Event Hours To evaluate the potential for DR in small and medium commercial buildings, we collected more 10,000 commercial PG&E customers’ meter data. We then quantified the DR potential and benefits for the customers who participated in peak four-hour DR events (2PM-6PM). HVAC is one of the most promising end-uses in buildings for delivering peak-capacity DR. Here, we introduce a framework for estimating the DR potential from HVAC systems in office, retail, and other types of small and medium commercial premises. This framework uses a regression-based prediction strategy to estimate the DR potential from large-scale aggregation of building loads. The estimation relies on a number of key inputs, including changes to thermostat set points, time of day, season, weather conditions, and building envelope and HVAC characteristics. This novel approach relies on a collection of previously generated, detailed simulation results from physical models to produce a highly accurate estimate of a building’s thermal response to the above inputs. This strategy avoids the large amount of computational time that would be required for physical building models to estimate the DR potential of a large, heterogeneous load population. Each regression model is generated as follows:
1. Physical models or representative buildings are used to simulate HVAC and other thermostatically controlled load set-point adjustments at various time steps.
2. The load changes resulting from set-point changes are determined for the period of the set-point adjustment.
3. Linear regression models are fitted to the simulated load changes based on other input variables (e.g., OAT) for each hour of the day.
As illustrated in Figure 18, a data-driven regression model estimates the DR potential of using the control strategy “cycle on/off HVAC units.” In previous studies, we used a physical model-based method to estimate the DR effect of “pre-cooling with global temperature adjustment” in building HVAC systems [19].
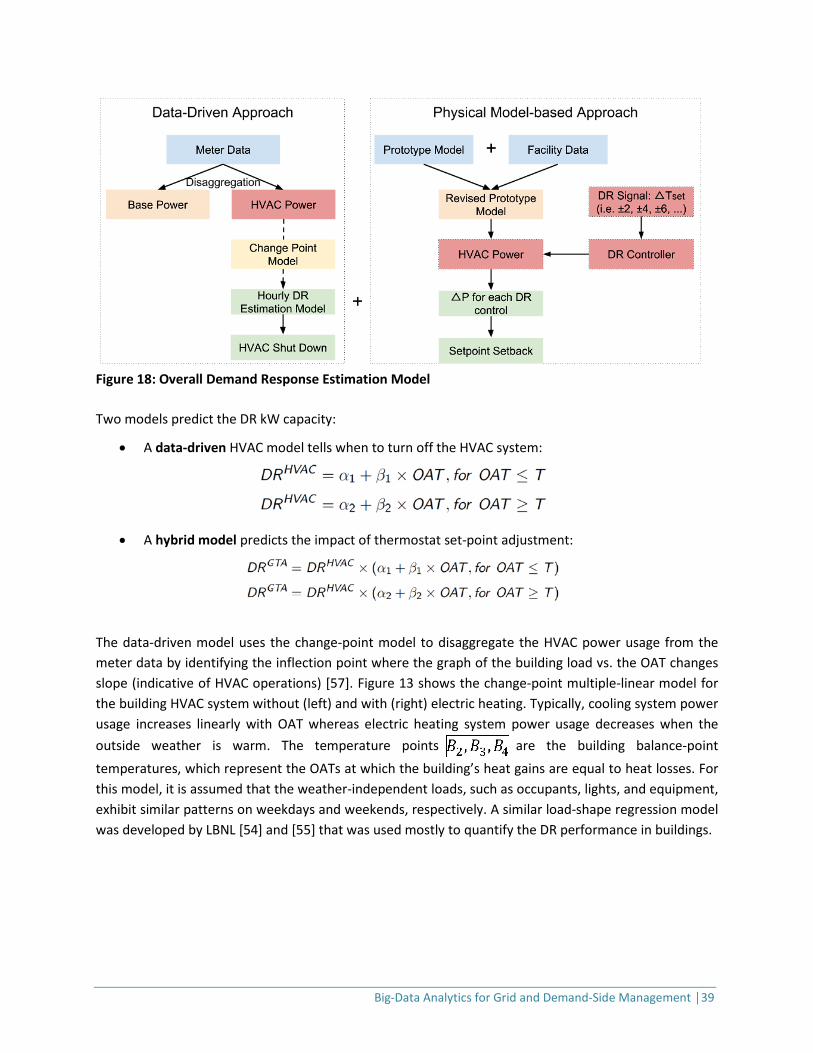
Big-Data Analytics for Grid and Demand-Side Management │39
Figure 18: Overall Demand Response Estimation Model Two models predict the DR kW capacity:
• A data-driven HVAC model tells when to turn off the HVAC system:
• A hybrid model predicts the impact of thermostat set-point adjustment:
The data-driven model uses the change-point model to disaggregate the HVAC power usage from the meter data by identifying the inflection point where the graph of the building load vs. the OAT changes slope (indicative of HVAC operations) [57]. Figure 13 shows the change-point multiple-linear model for the building HVAC system without (left) and with (right) electric heating. Typically, cooling system power usage increases linearly with OAT whereas electric heating system power usage decreases when the outside weather is warm. The temperature points are the building balance-point temperatures, which represent the OATs at which the building’s heat gains are equal to heat losses. For this model, it is assumed that the weather-independent loads, such as occupants, lights, and equipment, exhibit similar patterns on weekdays and weekends, respectively. A similar load-shape regression model was developed by LBNL [54] and [55] that was used mostly to quantify the DR performance in buildings.

Big-Data Analytics for Grid and Demand-Side Management │40
Figure 19: Change-Point Models: Cooling only without Electric Heating (Highlighted) Based on the change-point model, we developed hourly DR estimation models for the time period between 12PM and 6PM. For this, we used smart-meter and weather data, as shown in Figure 20. We observed that the HVAC system starts to operate when the OAT exceeds about 70°F. The plot also shows a linear relationship between HVAC power usage and OAT.
Figure 20: Example of a Change-Point Model
4.1.1 Applications for Individual Customers A spreadsheet tool was used to develop DR estimation approaches. This tool provides DR load-shed
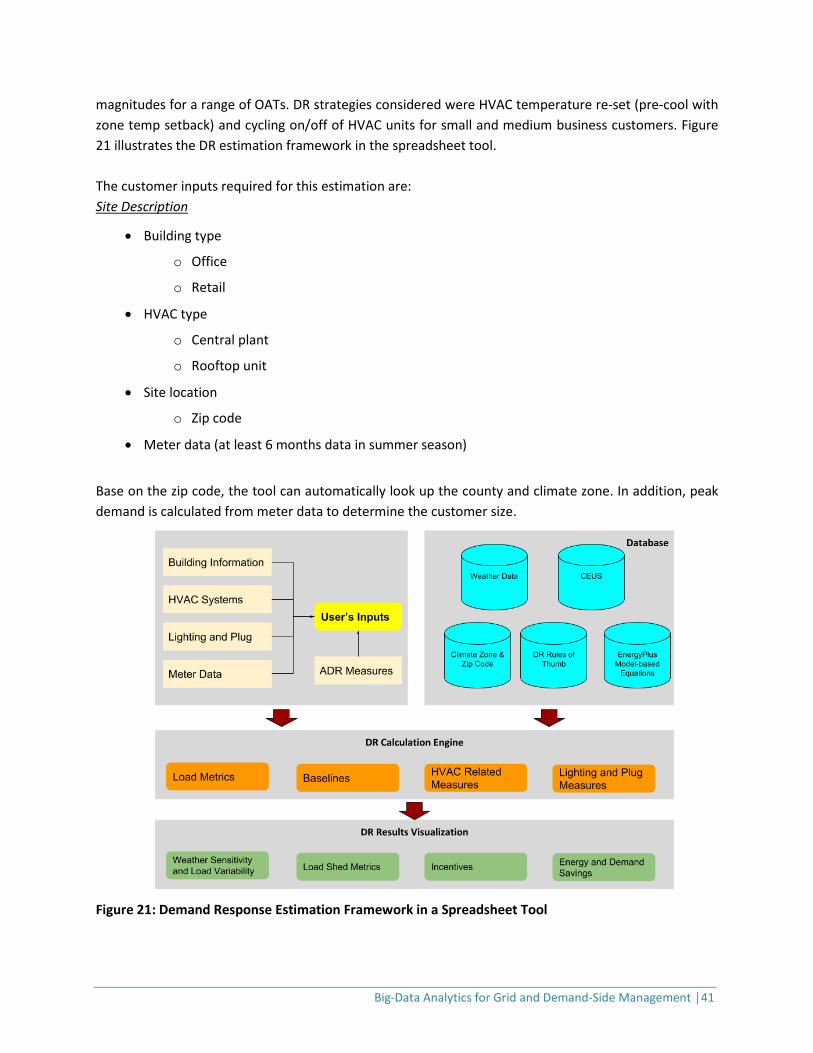
Big-Data Analytics for Grid and Demand-Side Management │41
magnitudes for a range of OATs. DR strategies considered were HVAC temperature re-set (pre-cool with zone temp setback) and cycling on/off of HVAC units for small and medium business customers. Figure 21 illustrates the DR estimation framework in the spreadsheet tool. The customer inputs required for this estimation are: Site Description
• Building type
o Office
o Retail
• HVAC type
o Central plant
o Rooftop unit
• Site location
o Zip code
• Meter data (at least 6 months data in summer season)
Base on the zip code, the tool can automatically look up the county and climate zone. In addition, peak demand is calculated from meter data to determine the customer size.
Figure 21: Demand Response Estimation Framework in a Spreadsheet Tool
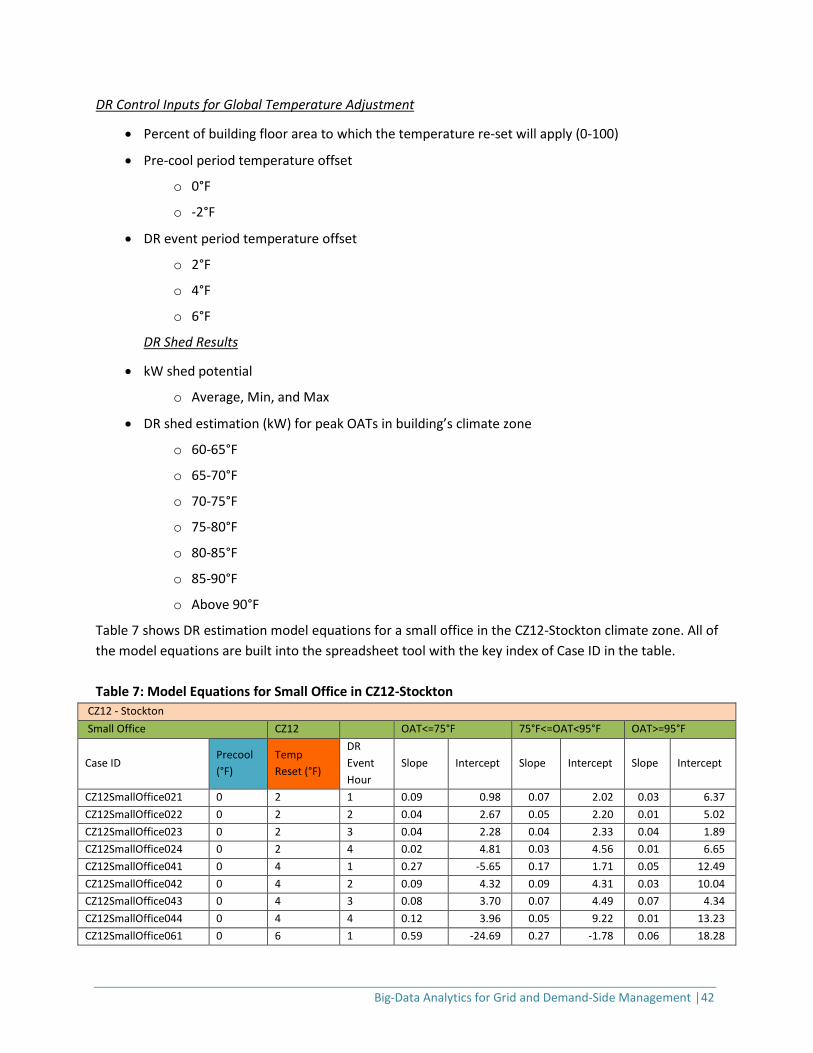
Big-Data Analytics for Grid and Demand-Side Management │42
DR Control Inputs for Global Temperature Adjustment
• Percent of building floor area to which the temperature re-set will apply (0-100)
• Pre-cool period temperature offset
o 0°F
o -2°F
• DR event period temperature offset
o 2°F
o 4°F
o 6°F
DR Shed Results
• kW shed potential
o Average, Min, and Max
• DR shed estimation (kW) for peak OATs in building’s climate zone
o 60-65°F
o 65-70°F
o 70-75°F
o 75-80°F
o 80-85°F
o 85-90°F
o Above 90°F
Table 7 shows DR estimation model equations for a small office in the CZ12-Stockton climate zone. All of the model equations are built into the spreadsheet tool with the key index of Case ID in the table. Table 7: Model Equations for Small Office in CZ12-Stockton
CZ12 - Stockton Small Office CZ12 OAT<=75°F 75°F<=OAT<95°F OAT>=95°F
Case ID Precool (°F)
Temp Reset (°F)
DR Event Hour
Slope Intercept Slope Intercept Slope Intercept
CZ12SmallOffice021 0 2 1 0.09 0.98 0.07 2.02 0.03 6.37 CZ12SmallOffice022 0 2 2 0.04 2.67 0.05 2.20 0.01 5.02 CZ12SmallOffice023 0 2 3 0.04 2.28 0.04 2.33 0.04 1.89 CZ12SmallOffice024 0 2 4 0.02 4.81 0.03 4.56 0.01 6.65 CZ12SmallOffice041 0 4 1 0.27 -5.65 0.17 1.71 0.05 12.49 CZ12SmallOffice042 0 4 2 0.09 4.32 0.09 4.31 0.03 10.04 CZ12SmallOffice043 0 4 3 0.08 3.70 0.07 4.49 0.07 4.34 CZ12SmallOffice044 0 4 4 0.12 3.96 0.05 9.22 0.01 13.23 CZ12SmallOffice061 0 6 1 0.59 -24.69 0.27 -1.78 0.06 18.28
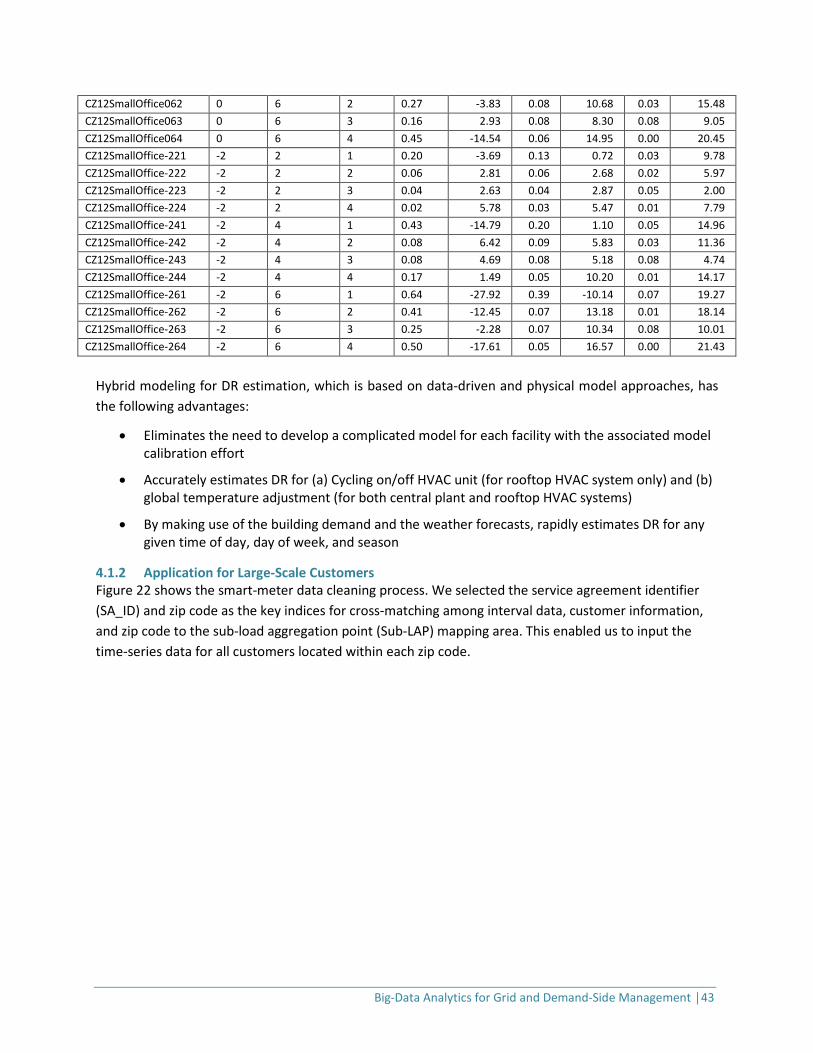
Big-Data Analytics for Grid and Demand-Side Management │43
CZ12SmallOffice062 0 6 2 0.27 -3.83 0.08 10.68 0.03 15.48 CZ12SmallOffice063 0 6 3 0.16 2.93 0.08 8.30 0.08 9.05 CZ12SmallOffice064 0 6 4 0.45 -14.54 0.06 14.95 0.00 20.45 CZ12SmallOffice-221 -2 2 1 0.20 -3.69 0.13 0.72 0.03 9.78 CZ12SmallOffice-222 -2 2 2 0.06 2.81 0.06 2.68 0.02 5.97 CZ12SmallOffice-223 -2 2 3 0.04 2.63 0.04 2.87 0.05 2.00 CZ12SmallOffice-224 -2 2 4 0.02 5.78 0.03 5.47 0.01 7.79 CZ12SmallOffice-241 -2 4 1 0.43 -14.79 0.20 1.10 0.05 14.96 CZ12SmallOffice-242 -2 4 2 0.08 6.42 0.09 5.83 0.03 11.36 CZ12SmallOffice-243 -2 4 3 0.08 4.69 0.08 5.18 0.08 4.74 CZ12SmallOffice-244 -2 4 4 0.17 1.49 0.05 10.20 0.01 14.17 CZ12SmallOffice-261 -2 6 1 0.64 -27.92 0.39 -10.14 0.07 19.27 CZ12SmallOffice-262 -2 6 2 0.41 -12.45 0.07 13.18 0.01 18.14 CZ12SmallOffice-263 -2 6 3 0.25 -2.28 0.07 10.34 0.08 10.01 CZ12SmallOffice-264 -2 6 4 0.50 -17.61 0.05 16.57 0.00 21.43
Hybrid modeling for DR estimation, which is based on data-driven and physical model approaches, has the following advantages:
• Eliminates the need to develop a complicated model for each facility with the associated model calibration effort
• Accurately estimates DR for (a) Cycling on/off HVAC unit (for rooftop HVAC system only) and (b) global temperature adjustment (for both central plant and rooftop HVAC systems)
• By making use of the building demand and the weather forecasts, rapidly estimates DR for any given time of day, day of week, and season
4.1.2 Application for Large-Scale Customers Figure 22 shows the smart-meter data cleaning process. We selected the service agreement identifier (SA_ID) and zip code as the key indices for cross-matching among interval data, customer information, and zip code to the sub-load aggregation point (Sub-LAP) mapping area. This enabled us to input the time-series data for all customers located within each zip code.
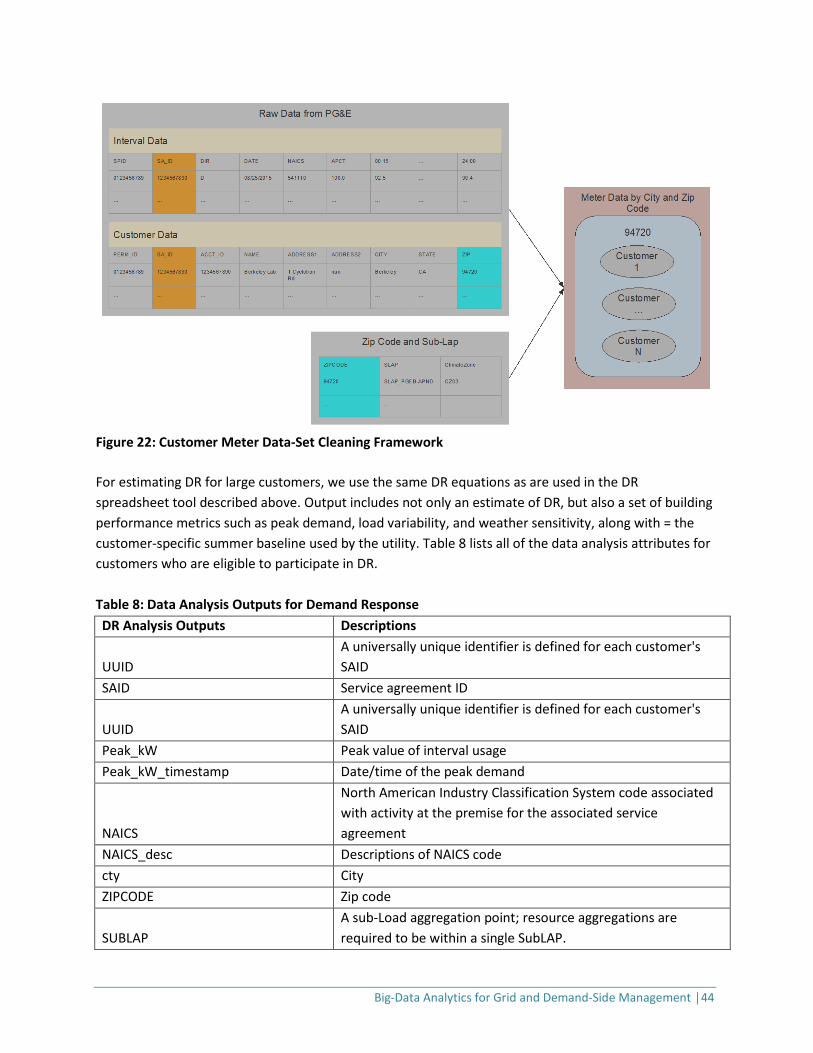
Big-Data Analytics for Grid and Demand-Side Management │44
Figure 22: Customer Meter Data-Set Cleaning Framework For estimating DR for large customers, we use the same DR equations as are used in the DR spreadsheet tool described above. Output includes not only an estimate of DR, but also a set of building performance metrics such as peak demand, load variability, and weather sensitivity, along with = the customer-specific summer baseline used by the utility. Table 8 lists all of the data analysis attributes for customers who are eligible to participate in DR. Table 8: Data Analysis Outputs for Demand Response DR Analysis Outputs Descriptions
UUID A universally unique identifier is defined for each customer's SAID
SAID Service agreement ID
UUID A universally unique identifier is defined for each customer's SAID
Peak_kW Peak value of interval usage Peak_kW_timestamp Date/time of the peak demand
NAICS
North American Industry Classification System code associated with activity at the premise for the associated service agreement
NAICS_desc Descriptions of NAICS code cty City ZIPCODE Zip code
SUBLAP A sub-Load aggregation point; resource aggregations are required to be within a single SubLAP.
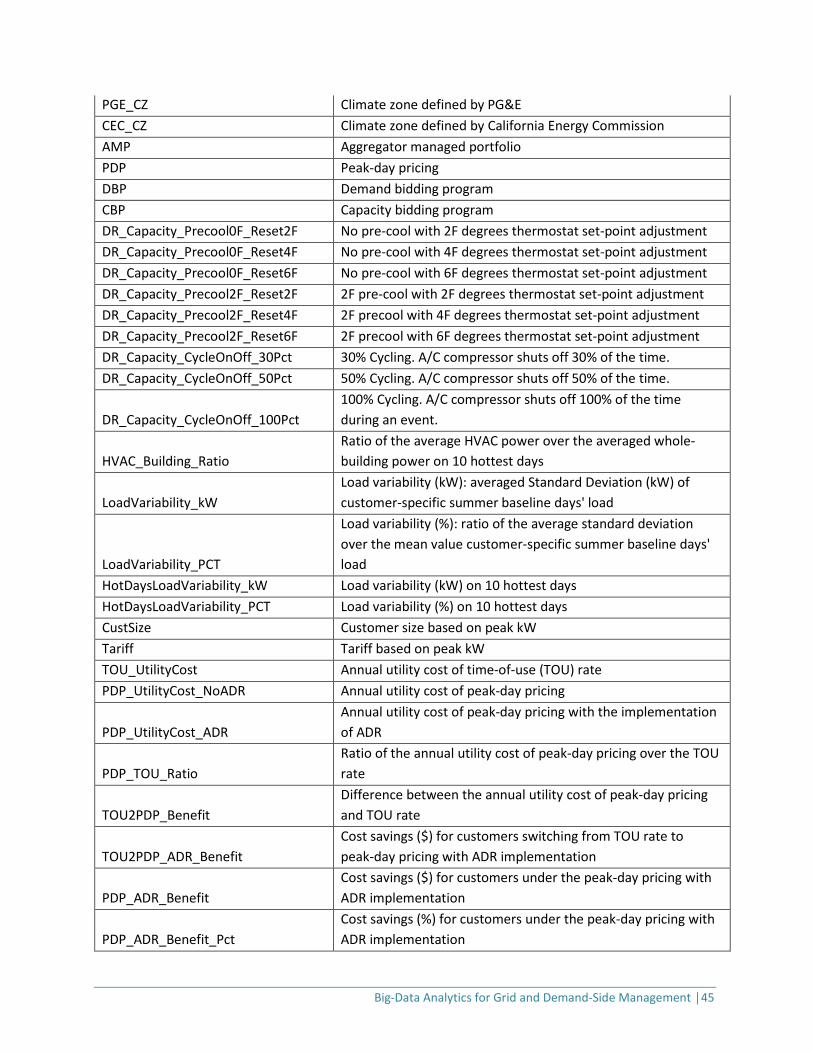
Big-Data Analytics for Grid and Demand-Side Management │45
PGE_CZ Climate zone defined by PG&E CEC_CZ Climate zone defined by California Energy Commission AMP Aggregator managed portfolio PDP Peak-day pricing DBP Demand bidding program CBP Capacity bidding program DR_Capacity_Precool0F_Reset2F No pre-cool with 2F degrees thermostat set-point adjustment DR_Capacity_Precool0F_Reset4F No pre-cool with 4F degrees thermostat set-point adjustment DR_Capacity_Precool0F_Reset6F No pre-cool with 6F degrees thermostat set-point adjustment DR_Capacity_Precool2F_Reset2F 2F pre-cool with 2F degrees thermostat set-point adjustment DR_Capacity_Precool2F_Reset4F 2F precool with 4F degrees thermostat set-point adjustment DR_Capacity_Precool2F_Reset6F 2F precool with 6F degrees thermostat set-point adjustment DR_Capacity_CycleOnOff_30Pct 30% Cycling. A/C compressor shuts off 30% of the time. DR_Capacity_CycleOnOff_50Pct 50% Cycling. A/C compressor shuts off 50% of the time.
DR_Capacity_CycleOnOff_100Pct 100% Cycling. A/C compressor shuts off 100% of the time during an event.
HVAC_Building_Ratio Ratio of the average HVAC power over the averaged whole-building power on 10 hottest days
LoadVariability_kW Load variability (kW): averaged Standard Deviation (kW) of customer-specific summer baseline days' load
LoadVariability_PCT
Load variability (%): ratio of the average standard deviation over the mean value customer-specific summer baseline days' load
HotDaysLoadVariability_kW Load variability (kW) on 10 hottest days HotDaysLoadVariability_PCT Load variability (%) on 10 hottest days CustSize Customer size based on peak kW Tariff Tariff based on peak kW TOU_UtilityCost Annual utility cost of time-of-use (TOU) rate PDP_UtilityCost_NoADR Annual utility cost of peak-day pricing
PDP_UtilityCost_ADR Annual utility cost of peak-day pricing with the implementation of ADR
PDP_TOU_Ratio Ratio of the annual utility cost of peak-day pricing over the TOU rate
TOU2PDP_Benefit Difference between the annual utility cost of peak-day pricing and TOU rate
TOU2PDP_ADR_Benefit Cost savings ($) for customers switching from TOU rate to peak-day pricing with ADR implementation
PDP_ADR_Benefit Cost savings ($) for customers under the peak-day pricing with ADR implementation
PDP_ADR_Benefit_Pct Cost savings (%) for customers under the peak-day pricing with ADR implementation
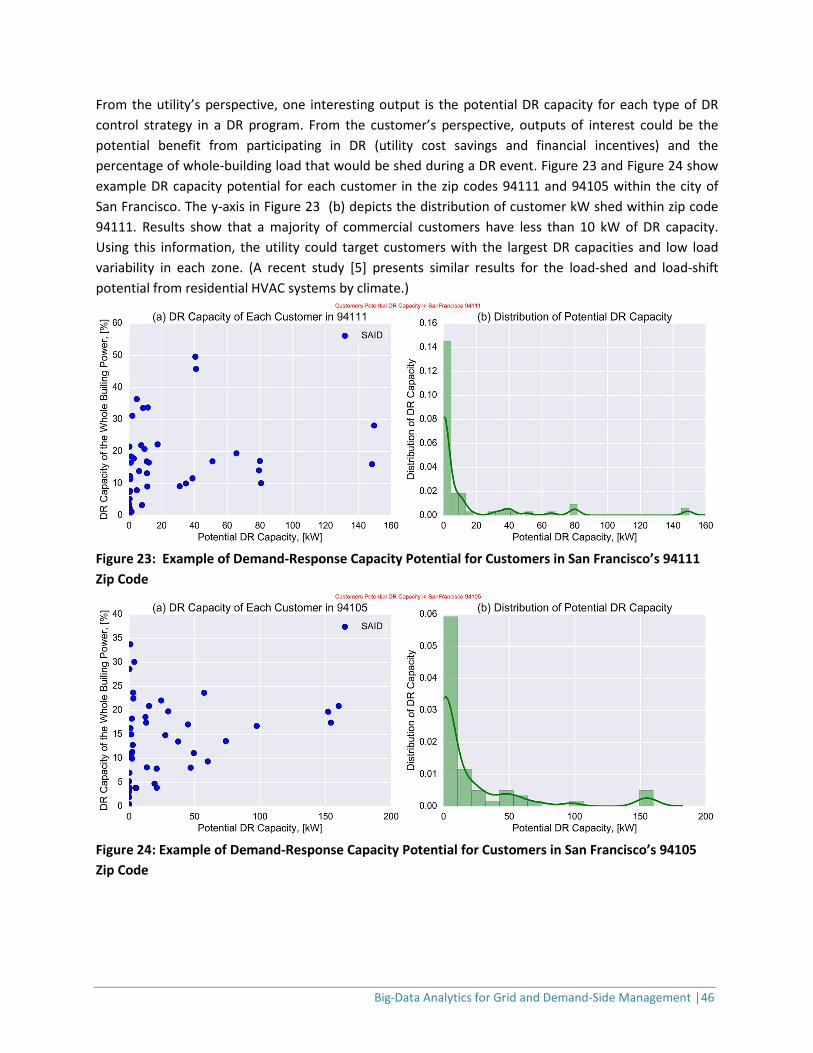
Big-Data Analytics for Grid and Demand-Side Management │46
From the utility’s perspective, one interesting output is the potential DR capacity for each type of DR control strategy in a DR program. From the customer’s perspective, outputs of interest could be the potential benefit from participating in DR (utility cost savings and financial incentives) and the percentage of whole-building load that would be shed during a DR event. Figure 23 and Figure 24 show example DR capacity potential for each customer in the zip codes 94111 and 94105 within the city of San Francisco. The y-axis in Figure 23 (b) depicts the distribution of customer kW shed within zip code 94111. Results show that a majority of commercial customers have less than 10 kW of DR capacity. Using this information, the utility could target customers with the largest DR capacities and low load variability in each zone. (A recent study [5] presents similar results for the load-shed and load-shift potential from residential HVAC systems by climate.)
Figure 23: Example of Demand-Response Capacity Potential for Customers in San Francisco’s 94111 Zip Code
Figure 24: Example of Demand-Response Capacity Potential for Customers in San Francisco’s 94105 Zip Code
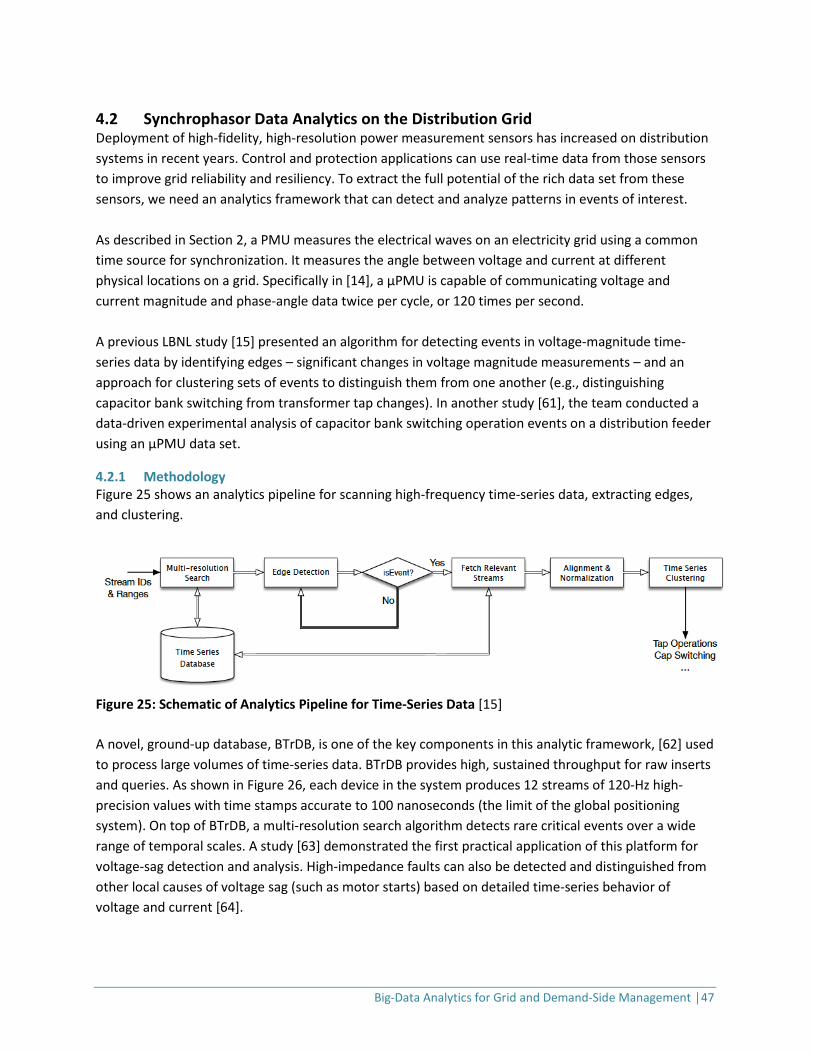
Big-Data Analytics for Grid and Demand-Side Management │47
4.2 Synchrophasor Data Analytics on the Distribution Grid Deployment of high-fidelity, high-resolution power measurement sensors has increased on distribution systems in recent years. Control and protection applications can use real-time data from those sensors to improve grid reliability and resiliency. To extract the full potential of the rich data set from these sensors, we need an analytics framework that can detect and analyze patterns in events of interest. As described in Section 2, a PMU measures the electrical waves on an electricity grid using a common time source for synchronization. It measures the angle between voltage and current at different physical locations on a grid. Specifically in [14], a µPMU is capable of communicating voltage and current magnitude and phase-angle data twice per cycle, or 120 times per second. A previous LBNL study [15] presented an algorithm for detecting events in voltage-magnitude time-series data by identifying edges – significant changes in voltage magnitude measurements – and an approach for clustering sets of events to distinguish them from one another (e.g., distinguishing capacitor bank switching from transformer tap changes). In another study [61], the team conducted a data-driven experimental analysis of capacitor bank switching operation events on a distribution feeder using an µPMU data set.
4.2.1 Methodology Figure 25 shows an analytics pipeline for scanning high-frequency time-series data, extracting edges, and clustering.
Figure 25: Schematic of Analytics Pipeline for Time-Series Data [15] A novel, ground-up database, BTrDB, is one of the key components in this analytic framework, [62] used to process large volumes of time-series data. BTrDB provides high, sustained throughput for raw inserts and queries. As shown in Figure 26, each device in the system produces 12 streams of 120-Hz high-precision values with time stamps accurate to 100 nanoseconds (the limit of the global positioning system). On top of BTrDB, a multi-resolution search algorithm detects rare critical events over a wide range of temporal scales. A study [63] demonstrated the first practical application of this platform for voltage-sag detection and analysis. High-impedance faults can also be detected and distinguished from other local causes of voltage sag (such as motor starts) based on detailed time-series behavior of voltage and current [64].
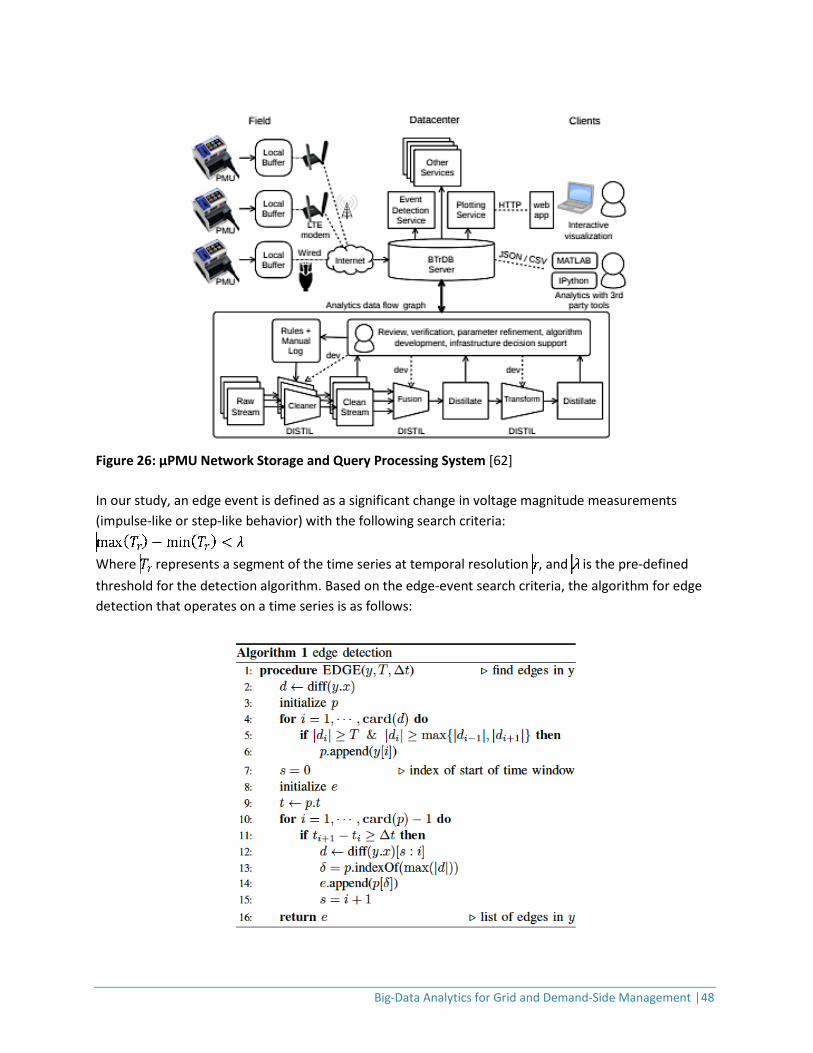
Big-Data Analytics for Grid and Demand-Side Management │48
Figure 26: µPMU Network Storage and Query Processing System [62] In our study, an edge event is defined as a significant change in voltage magnitude measurements (impulse-like or step-like behavior) with the following search criteria:
Where represents a segment of the time series at temporal resolution , and is the pre-defined threshold for the detection algorithm. Based on the edge-event search criteria, the algorithm for edge detection that operates on a time series is as follows:
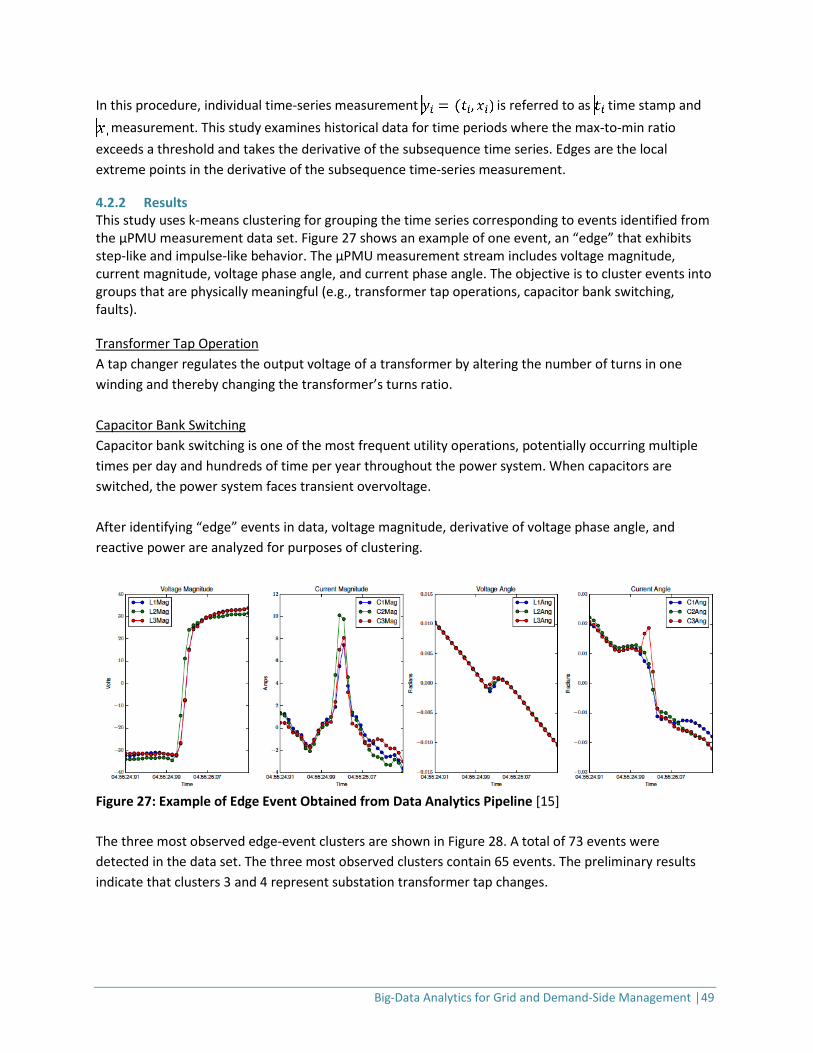
Big-Data Analytics for Grid and Demand-Side Management │49
In this procedure, individual time-series measurement is referred to as time stamp and measurement. This study examines historical data for time periods where the max-to-min ratio
exceeds a threshold and takes the derivative of the subsequence time series. Edges are the local extreme points in the derivative of the subsequence time-series measurement.
4.2.2 Results This study uses k-means clustering for grouping the time series corresponding to events identified from the µPMU measurement data set. Figure 27 shows an example of one event, an “edge” that exhibits step-like and impulse-like behavior. The µPMU measurement stream includes voltage magnitude, current magnitude, voltage phase angle, and current phase angle. The objective is to cluster events into groups that are physically meaningful (e.g., transformer tap operations, capacitor bank switching, faults). Transformer Tap Operation A tap changer regulates the output voltage of a transformer by altering the number of turns in one winding and thereby changing the transformer’s turns ratio. Capacitor Bank Switching Capacitor bank switching is one of the most frequent utility operations, potentially occurring multiple times per day and hundreds of time per year throughout the power system. When capacitors are switched, the power system faces transient overvoltage. After identifying “edge” events in data, voltage magnitude, derivative of voltage phase angle, and reactive power are analyzed for purposes of clustering.
Figure 27: Example of Edge Event Obtained from Data Analytics Pipeline [15] The three most observed edge-event clusters are shown in Figure 28. A total of 73 events were detected in the data set. The three most observed clusters contain 65 events. The preliminary results indicate that clusters 3 and 4 represent substation transformer tap changes.
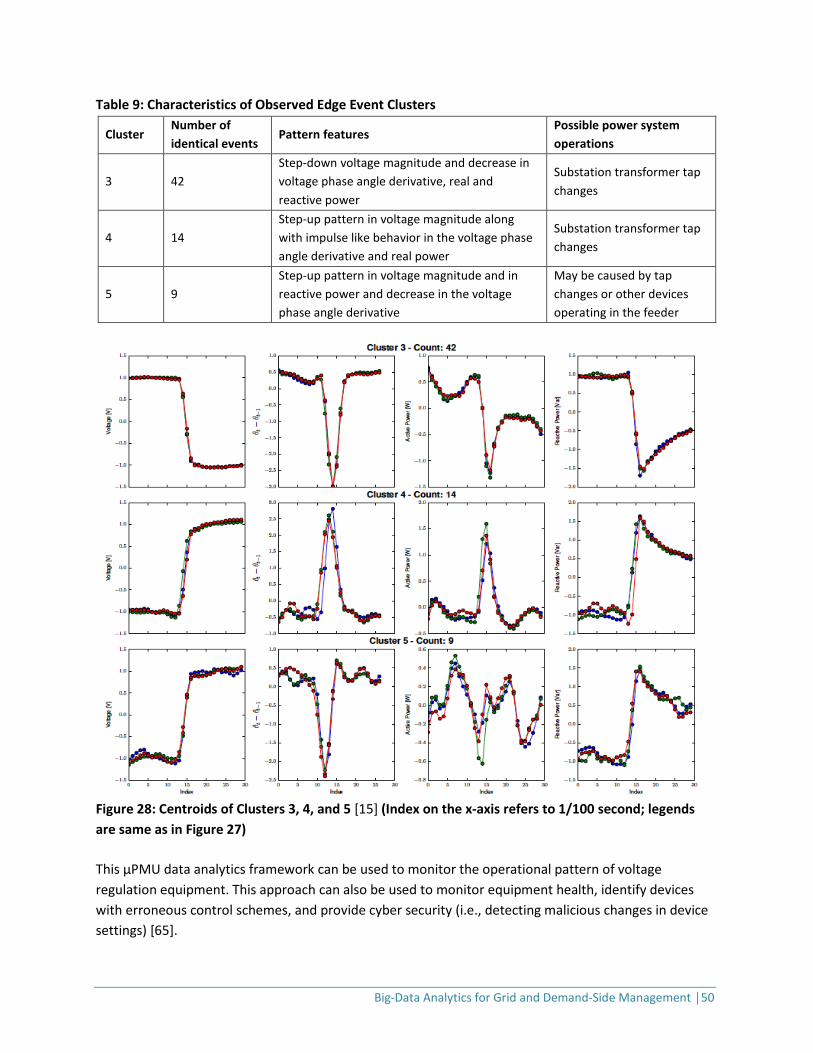
Big-Data Analytics for Grid and Demand-Side Management │50
Table 9: Characteristics of Observed Edge Event Clusters
Cluster Number of identical events
Pattern features Possible power system operations
3 42 Step-down voltage magnitude and decrease in voltage phase angle derivative, real and reactive power
Substation transformer tap changes
4 14 Step-up pattern in voltage magnitude along with impulse like behavior in the voltage phase angle derivative and real power
Substation transformer tap changes
5 9 Step-up pattern in voltage magnitude and in reactive power and decrease in the voltage phase angle derivative
May be caused by tap changes or other devices operating in the feeder
Figure 28: Centroids of Clusters 3, 4, and 5 [15] (Index on the x-axis refers to 1/100 second; legends are same as in Figure 27) This µPMU data analytics framework can be used to monitor the operational pattern of voltage regulation equipment. This approach can also be used to monitor equipment health, identify devices with erroneous control schemes, and provide cyber security (i.e., detecting malicious changes in device settings) [65].
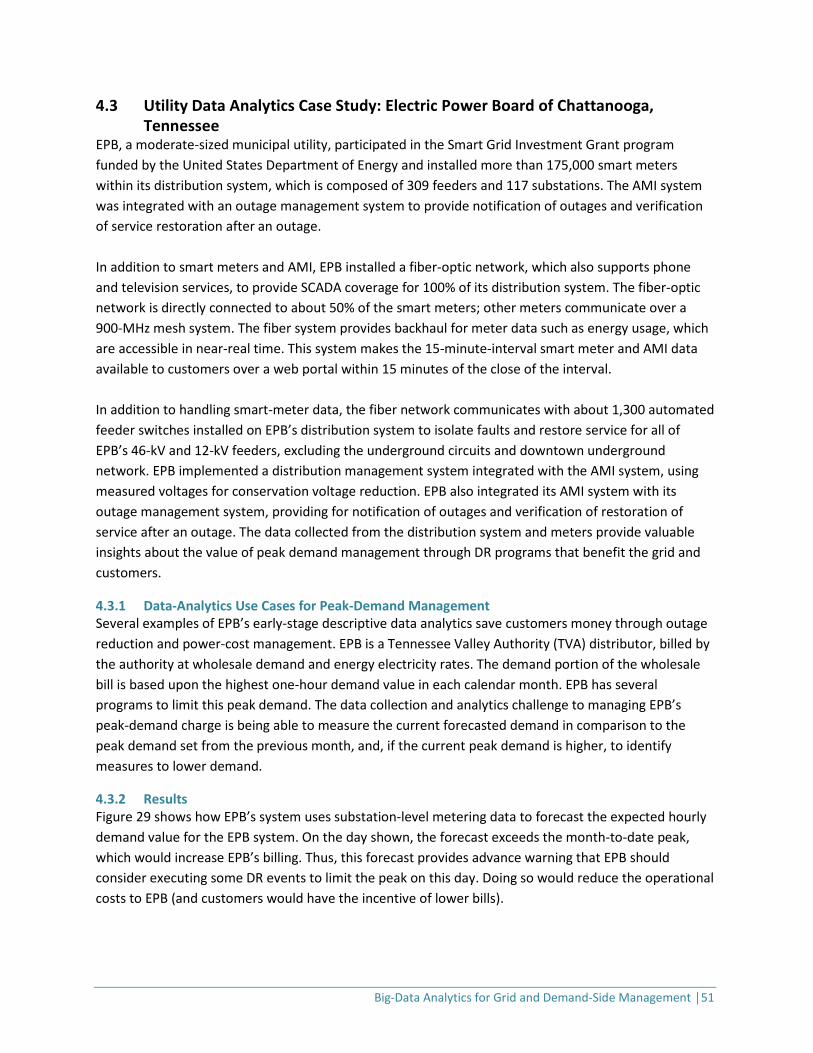
Big-Data Analytics for Grid and Demand-Side Management │51
4.3 Utility Data Analytics Case Study: Electric Power Board of Chattanooga, Tennessee
EPB, a moderate-sized municipal utility, participated in the Smart Grid Investment Grant program funded by the United States Department of Energy and installed more than 175,000 smart meters within its distribution system, which is composed of 309 feeders and 117 substations. The AMI system was integrated with an outage management system to provide notification of outages and verification of service restoration after an outage. In addition to smart meters and AMI, EPB installed a fiber-optic network, which also supports phone and television services, to provide SCADA coverage for 100% of its distribution system. The fiber-optic network is directly connected to about 50% of the smart meters; other meters communicate over a 900-MHz mesh system. The fiber system provides backhaul for meter data such as energy usage, which are accessible in near-real time. This system makes the 15-minute-interval smart meter and AMI data available to customers over a web portal within 15 minutes of the close of the interval. In addition to handling smart-meter data, the fiber network communicates with about 1,300 automated feeder switches installed on EPB’s distribution system to isolate faults and restore service for all of EPB’s 46-kV and 12-kV feeders, excluding the underground circuits and downtown underground network. EPB implemented a distribution management system integrated with the AMI system, using measured voltages for conservation voltage reduction. EPB also integrated its AMI system with its outage management system, providing for notification of outages and verification of restoration of service after an outage. The data collected from the distribution system and meters provide valuable insights about the value of peak demand management through DR programs that benefit the grid and customers.
4.3.1 Data-Analytics Use Cases for Peak-Demand Management Several examples of EPB’s early-stage descriptive data analytics save customers money through outage reduction and power-cost management. EPB is a Tennessee Valley Authority (TVA) distributor, billed by the authority at wholesale demand and energy electricity rates. The demand portion of the wholesale bill is based upon the highest one-hour demand value in each calendar month. EPB has several programs to limit this peak demand. The data collection and analytics challenge to managing EPB’s peak-demand charge is being able to measure the current forecasted demand in comparison to the peak demand set from the previous month, and, if the current peak demand is higher, to identify measures to lower demand.
4.3.2 Results Figure 29 shows how EPB’s system uses substation-level metering data to forecast the expected hourly demand value for the EPB system. On the day shown, the forecast exceeds the month-to-date peak, which would increase EPB’s billing. Thus, this forecast provides advance warning that EPB should consider executing some DR events to limit the peak on this day. Doing so would reduce the operational costs to EPB (and customers would have the incentive of lower bills).
Big-Data Analytics for Grid and Demand-Side Management │52
Figure 29: Load Forecast Based on Current Conditions Indicates Need for a Demand-Response Event Reduction of EPB’s peak load might also have the benefit of reducing its contribution to TVA’s system peak demand, thereby reducing the amount of supply that TVA is obligated to arrange to meet that demand. The economic value of this peak reduction derives from reduction in the generation and transmission cost of supply and is reflected to some extent in the peak demand component of the wholesale rate. The study results show the value of a DR program for EPB. Recently, EPB has been working with the U.S. Department of Energy’s Grid Modernization Laboratory Consortium to collect real-time data from sensors on its distribution system. The sensors provide a wide variety of data, including solar irradiance, temperature, humidity, wind speed, and detection of the presence of certain chemicals. The sensors capture vibrations, radio frequencies, coronal discharge, and thermal images of transformers from infrared cameras. Through the fiber network, the data are available to EPB centrally in near-real time. Although the sensors are not capturing power-system data, analytics based on the environmental data collected could also prove useful.

Big-Data Analytics for Grid and Demand-Side Management │53
5 Summary, Conclusions, and Future Activities This report examined big-data types and sources and the use of advanced analytics for big data related to the smart grid, with a focus on demand response. The data collection and analysis architecture, technologies, applications, and challenges associated with use of big data on the smart grid were quantitatively and qualitatively reviewed and presented. Our case studies illustrated state-of-art uses of smart meter and µPMU data on distribution grids.
Key big-data analytics methods include descriptive, predictive, and prescriptive approaches. To align with industry practices, this report focused on the descriptive and predictive aspects of (1) advanced analytics for DR using data from smart meters and other sources, and (2) use of µPMU measurement data for grid reliability and operational needs.
5.1 Study Conclusions • Standardized data methods can enable efficient, cost-effective use of analytical information to
support integrated grid activities such as electricity reliability, grid planning and operations, DSM programs, and DR performance assessment.
• A utility can use big-data analytics to target customers that have the most DR capacity for each DR program. Early-stage prescriptive analytics and advanced predictive analytics methods are available to determine the value of DR to both the grid and the customer.
• Analysis of µPMU data can detect several kinds of edge events (e.g., significant changes in the voltage magnitude) on distribution grids. This approach can also be used to monitor equipment health and help identify devices with erroneous behaviors to aid with the cyber security.
• Big-data application on the smart grid should consider (1) heterogeneity, inconsistency, and incompleteness in data due to lack of standardization; (2) speed and volume of data, which creates complexity; and (3) the need for data security and privacy, i.e., cyber physical security on the smart grid for PMU and SCADA data.
Electricity grid stakeholders including utility operators, electricity customers, and product vendors, can leverage the findings of this study to identify opportunities and technologies for big-data and analytics-related applications for DSM and in support of modernizing the electric grid.
5.2 Future Activities The next and final task of the study of which this report is a part focuses on dissemination of big-data applications in the electric utility industry and engagement of the power industry at workshops, advisory groups, conferences, webcasts, etc. Industry forums provide stakeholders with an opportunity to review data architecture, new software technologies, and applications of advanced analytics. The findings from this study showcase the value of big data and analytics for the U.S. electric industry and identify applications for prescriptive analytics that use machine-learning and artificial intelligence. Documentation of best practices in big data analytics is needed along with investigation of the challenges and opportunities of big data for the industry. In the exchange of research findings, new concepts and applications for utilities and new industry research partnerships will emerge for dissemination of big-data analytics that benefit the electric utility industry and its customers.
Big-Data Analytics for Grid and Demand-Side Management │54
6 References [1] EPRI, Big Data and Analytics in the Utility Industry: Key Findings to Successfully Shift from Data
Collection to Action, 2014. [2] Wouter Haak, Elsevier gaining momentum in its home market as a big data player, Elsevier.
(2017). [3] J. Chen, Y. Chen, X. Du, C. Li, J. Lu, S. Zhao, X. Zhou, Big data challenge: a data management
perspective, Front. Comput. Sci. 7 (2013) 157–164. doi:10.1007/s11704-013-3903-7. [4] N. Jukić, A. Sharma, S. Nestorov, B. Jukić, Augmenting Data Warehouses with Big Data, Inf. Syst.
Manag. 32 (2015) 200–209. doi:10.1080/10580530.2015.1044338. [5] P. Alstone, J. Potter, M.A. Piette, P. Schwartz, M.A. Berger, L.N. Dunn, S.J. Smith, M.D. Sohn, A.
Aghajanzadeh, S. Stensson, J. Szinai, T. Walter, L. Mckenzie, L. Lavin, B. Schneiderman, A. Mileva, E. Cutter, A. Olson, J. Bode, A. Ciccone, A. Jain, Final Report on Phase 2 Results - 2025 California Demand Response Potential Study, LBNL-2001114. (2017).
[6] EPRI, Data Analytics Initiative for Transmission and Distribution: Research Summary and Outcomes, n.d.
[7] J.J. Kim, R. Yin, S. Kiliccote, Automated Demand Response Technologies and Demonstration in New York City using OpenADR, (2013).
[8] M.A. Piette, S. Kiliccote, J.H. Dudley, Field Demonstration of Automated Demand Response for Both Winter and Summer Events in Large Buildings in the Pacific Northwest, (2012).
[9] U. Sivarajah, M.M. Kamal, Z. Irani, V. Weerakkody, Critical analysis of Big Data challenges and analytical methods, J. Bus. Res. 70 (2017) 263–286. doi:10.1016/J.JBUSRES.2016.08.001.
[10] D. Boyd, K. Crawford, Six Provocations for Big Data, in: A Decad. Internet Time Symp. Dyn. Internet Soc., 2011. doi:10.2139/ssrn.1926431.
[11] IEEE Smart Grid Working Group, Big Data Analytics in the Smart Grid Working Group on Big Data Analytics , Machine Learning and Artificial Intelligence in the Smart Grid, 2017.
[12] PGE, SmartMeterTM Network, (n.d.). https://www.pge.com/en_US/residential/save-energy-money/analyze-your-usage/your-usage/view-and-share-your-data-with-smartmeter/smartmeter-network.page (accessed March 29, 2018).
[13] A. von Meier, E. Stewart, A. McEachern, M. Andersen, L. Mehrmanesh, Precision Micro-Synchrophasors for Distribution Systems: A Summary of Applications, IEEE Trans. Smart Grid. 8 (2017) 2926–2936. doi:10.1109/TSG.2017.2720543.
[14] PSL, Synchrophasors for Distribution, Microgrids: PQube ® 3 MicroPMU, (n.d.). https://powerstandards.com/Download/MicroPMU Data Sheet Rev1_3.pdf (accessed March 30, 2018).
[15] D.B. Arnold, C. Roberts, O. Ardakanian, E.M. Stewart, Synchrophasor data analytics in distribution grids, in: 2017 IEEE Power Energy Soc. Innov. Smart Grid Technol. Conf., IEEE, 2017: pp. 1–5. doi:10.1109/ISGT.2017.8085979.
[16] PG&E, ADR for Retail - PGE-ADR, (2017). http://pge-adr.com/retail/ (accessed January 4, 2017). [17] P. Alstone, J. Potter, M.A. Piette, P. Schwartz, M.A. Berger, L.N. Dunn, S.J. Smith, M.D. Sohn, A.
Aghajanzadeh, S. Stensson, J. Szinai, Final Report on Phase 2 Results - 2015 California Demand Response Potential Study, 2016.
[18] PLMA, The Future of Utility “ Bring Your Own Thermostat ” Programs, 2018. [19] R. Yin, E.C. Kara, Y. Li, N. DeForest, K. Wang, T. Yong, M. Stadler, Quantifying flexibility of
commercial and residential loads for demand response using setpoint changes, Appl. Energy. 177 (2016) 149–164. doi:10.1016/j.apenergy.2016.05.090.
[20] M.A. Piette, O. Sezgen, D.S. Watson, N. Motegi, Development and Evaluation of Fully Automated Demand Response in Large Facilities, (2005).

Big-Data Analytics for Grid and Demand-Side Management │55
[21] N. Motegi, M.A. Piette, D.S. Watson, O. Sezgen, L. Ten Hope, Measurement and Evaluation Techniques for Automated Demand Response Demonstration, in: 2004 ACEEE Summer Study Energy Effic. Build. Pacific Grove, CA, 2004.
[22] M.L. Goldberg, G. Kennedy, Measurement and Verification for Demand Response, 2013. [23] K. Coughlin, M.A. Piette, C. Goldman, S. Kiliccote, E.O. Lawrence, Estimating Demand Response
Load Impacts: Evaluation of Baseline Load Models for Non- Residential Buildings in California Environmental Energy Technologies Division, 2008.
[24] Nexant, California ISO Baseline Accuracy Work Group Proposal, 2017. [25] DOE, Grid Modernization Multi-Year Program Plan, 2015. [26] H. Geng, Internet of things and data analytics handbook, 2017. [27] G. Ghatikar, R. Bienert, Smart Grid Standards and Systems Interoperability: A Precedent with
OpenADR, Grid-Interop 2011. (2011). [28] G. Ghatikar, E. Koch, Deploying Systems Interoperability and Customer Choice within Smart Grid
| DRRC, in: Grid-Interop 2012, Irving, TX, 2012. [29] Federal Trade Commission, Identity Theft Red Flags and Address Discrepancies Under the Fair
and Accurate Credit Transactions Act of 2003 - 16 CFR Part 681, Fed. Trade Comm. (2007). https://www.ftc.gov/policy/federal-register-notices/identity-theft-red-flags-and-address-discrepancies-under-fair-and (accessed March 22, 2018).
[30] NIST, Guidelines for Smart Grid Cybersecurity, 2014. [31] Homeland Security, Privacy Policy: Fair Information Practice Principles, 2008. [32] Green Button Alliance, Green Button, (n.d.). http://www.greenbuttonalliance.org/ (accessed
March 22, 2018). [33] OpenADR Alliance, OpenADR 2.0 Demand Response program implementation guide, 2014. [34] ASHRAE, Standard 135-2016 -- BACnet®--A Data Communication Protocol for Building
Automation and Control Networks, American Society of Heating, Refrigerating and Air-Conditioning Engineers, 2016.
[35] M.A. Piette, G. Ghatikar, S. Kiliccote, E. Koch, D. Hennage, P. Palensky, C. McParland, Open Automated Demand Response Communications Specification (Version 1.0), (2009). doi:10.2172/951952.
[36] OASIS, Energy Interoperation Version 1.0, OASIS Stand. (2014). http://docs.oasis-open.org/energyinterop/ei/v1.0/os/energyinterop-v1.0-os.html (accessed September 16, 2017).
[37] IEEE, IEEE 2030.5-2013 - IEEE Adoption of Smart Energy Profile 2.0 Application Protocol Standard, IEEE Commun. Soc. (n.d.). https://standards.ieee.org/findstds/standard/2030.5-2013.html (accessed September 16, 2017).
[38] Open Charge Alliance, Open Charge Point Protocol 1.6, (2017). http://www.openchargealliance.org/protocols/ocpp/ocpp-16/ (accessed March 22, 2018).
[39] M. Van Amstel, G. Ghatikar, A. Wargers, Importance of Open Charge Point Protocol for the Electric Vehicle Industry, (2016). http://www.openchargealliance.org/protocols/ (accessed March 22, 2018).
[40] Oracle, Big Data & Analytics Reference Architecture, (2013). [41] Department of Energy, Smart Grid Conceptual Actors/Data Flow Diagram, (n.d.).
https://www.energy.gov/sites/prod/files/gcprod/documents/EdisonElectric_Comments_SmartGridDataFlow.pdf (accessed April 30, 2018).
[42] NIST, NIST Framework and Roadmap for Smart Grid Interoperability Standards, Release 3.0, National Institute of Standards and Technology, 2014. doi:10.6028/NIST.SP.1108r3.
[43] U.S. Department of Energy, Advanced Metering Infrastructure and Customer Systems: Results from the Smart Grid Investment Grant Program, 2016.
[44] J. Zhou, R. Qingyang Hu, Y. Qian, Scalable Distributed Communication Architectures to Support

Big-Data Analytics for Grid and Demand-Side Management │56
Advanced Metering Infrastructure in Smart Grid, IEEE Trans. Parallel Distrib. Syst. 23 (2012) 1632–1642. doi:10.1109/TPDS.2012.53.
[45] M. Kuzlu, M. Pipattanasomporn, Assessment of communication technologies and network requirements for different smart grid applications, in: 2013 IEEE PES Innov. Smart Grid Technol. Conf., 2013. doi:10.1109/ISGT.2013.6497873.
[46] S. Galli, A. Scaglione, Z. Wang, Power Line Communications and the Smart Grid, in: 2010 First IEEE Int. Conf. Smart Grid Commun., IEEE, 2010: pp. 303–308. doi:10.1109/SMARTGRID.2010.5622060.
[47] WG802.11 - Wireless LAN Working Group, IEEE 802.11-2016 - IEEE Standard for Information technology—Telecommunications and information exchange between systems Local and metropolitan area networks—Specific requirements - Part 11: Wireless LAN Medium Access Control (MAC) and Physical Layer (PHY), (2016).
[48] WG802.16 - Broadband Wireless Access Working Group, IEEE 802.16-2017 - IEEE Standard for Air Interface for Broadband Wireless Access Systems, (2017).
[49] G. Chicco, R. Napoli, F. Piglione, Comparisons Among Clustering Techniques for Electricity Customer Classification, IEEE Trans. Power Syst. 21 (2006) 933–940. doi:10.1109/TPWRS.2006.873122.
[50] L. Jin, D. Lee, A. Sim, S. Borgeson, K. Wu, A.C. Spurlock, A. Todd, Comparison of Clustering Techniques for Residential Energy Behavior using Smart Meter Data, in: AAAI Work. - Artif. Intell. Smart Grids Build., 2017.
[51] M. Ester, H.-P. Kriegel, J. Sander, X. Xu, A density-based algorithm for discovering clusters a density-based algorithm for discovering clusters in large spatial databases with noise, Proc. Second Int. Conf. Knowl. Discov. Data Min. (1996) 226–231.
[52] G. Gan, C. Ma, J. Wu, 13. Density-Based Clustering Algorithms, in: Data Clust. Theory, Algorithms, Appl., Society for Industrial and Applied Mathematics, 2007: pp. 219–226. doi:10.1137/1.9780898718348.ch13.
[53] R.B. Cleveland, W.S. Cleveland, J.E. McRae, I. Terpenning, STL: A Seasonal-Trend Decomposition Procedure Based on Loess, J. Off. Stat. 6 (1990) 3–73.
[54] J.L. Mathieu, P.N. Price, S. Kiliccote, M.A. Piette, Quantifying Changes in Building Electricity Use, With Application to Demand Response, IEEE Trans. Smart Grid. 2 (2011) 507–518. doi:10.1109/TSG.2011.2145010.
[55] P.N. Price, Methods for Analyzing Electric Load Shape and its Variability, LBNL-3713E, Lawrence Berkeley National Laboratory, 2010.
[56] Lawrence Berkeley National Laboratory, berkeleylab / eetd-loadshape — Bitbucket, (n.d.). https://bitbucket.org/berkeleylab/eetd-loadshape (accessed April 28, 2018).
[57] J.K. Kissock, J.S. Haberi, D.E. Charidge, Development of a Toolkit for Calculating Linear, Change-Point Linear and Multiple-Linear Inverse Building Energy Analysis Models, ASHRAE RP 1050, 2004.
[58] R: The R Project for Statistical Computing, (n.d.). https://www.r-project.org/ (accessed April 28, 2018).
[59] C. Miller, Screening Meter Data: Characterization of Temporal Energy Data from Large Groups of Non-Residential Buildings, 2016. doi:10.3929/ethz-a-010811999.
[60] R. Yin, P. Xu, M.A. Piette, S. Kiliccote, Study on Auto-DR and pre-cooling of commercial buildings with thermal mass in California, Energy Build. 42 (2010) 967–975. doi:10.1016/j.enbuild.2010.01.008.
[61] A. Shahsavari, M. Farajollahi, E. Stewart, A. von Meier, L. Alvarez, E. Cortez, H. Mohsenian-Rad, A data-driven analysis of capacitor bank operation at a distribution feeder using micro-PMU data, in: 2017 IEEE Power Energy Soc. Innov. Smart Grid Technol. Conf., IEEE, 2017: pp. 1–5.

Big-Data Analytics for Grid and Demand-Side Management │57
doi:10.1109/ISGT.2017.8085984. [62] M.P. Andersen, D.E. Culler, BTrDB: Optimizing Storage System Design for Timeseries Processing,
in: Proc. 16th USENIX Conf. File Storage Technol., Santa Clara, CA, 2016: pp. 39–52. [63] A.L. Liao, E.M. Stewart, E.C. Kara, Micro-synchrophasor data for diagnosis of transmission and
distribution level events, in: 2016 IEEE/PES Transm. Distrib. Conf. Expo., IEEE, 2016: pp. 1–5. doi:10.1109/TDC.2016.7519975.
[64] E.M. Stewart, P. Top, M. Chertkov, D. Deka, S. Backhaus, A. Lokhov, C. Roberts, V. Hendrix, S. Peisert, A. Florita, T.J. King, M.J. Reno, Integrated multi-scale data analytics and machine learning for the distribution grid, in: 2017 IEEE Int. Conf. Smart Grid Commun., IEEE, 2017: pp. 423–429. doi:10.1109/SmartGridComm.2017.8340693.
[65] ICF, Electric Grid Security and Resilience Establishing a Baseline for Adversarial Threats, 2016.