Bi-national Commission for Collaboration on Health Guyana and Suriname. Presenter Mr. Nicholas...
16
Bi-national Commission for Collaboration on Health Guyana and Suriname. Presenter Mr. Nicholas Persaud –National HIV Care and Treatment Coordinator. Guyana Ministry of Health National AIDS Programme Secretariat
-
Upload
charla-young -
Category
Documents
-
view
214 -
download
0
Transcript of Bi-national Commission for Collaboration on Health Guyana and Suriname. Presenter Mr. Nicholas...
Bi-national Commission for Collaboration on Health Guyana and Suriname.
Presenter
Mr. Nicholas Persaud –National HIV Care and Treatment Coordinator.
GuyanaMinistry of Health
National AIDS Programme Secretariat
National Response to the HIV/AIDS Epidemic
Since the first reported case of AIDS in 1987, the GoG has been cognizant of the effects of
HIV/AIDS. The GoG has demonstrated strong political will in combating the HIV/AIDS epidemic.
In 1998, the GOG established:
• National AIDS Programme (NAP) under the Ministry of Health.
• Gentio Urinary Medicine (GUM) Clinic which is now known as the National Care and
Treatment Centre ( Premier Treatment site)
• The National Laboratory for Infectious Disease (NLID)
• The National Blood Transfusion Service (NBTS)
In 1992, the National AIDS Programme Secretariat (NAPS) was established and charged with
the role of coordinating the national response to the HIV/AIDS epidemic.

ProjectImplementation
Unit (PIU)
Ministry ofHealth (MOH)
NAPS
MoF
DonorsPresidential Panel OnHIV/AIDs (PPHA)
Cabinet
UN HIV/AIDS ThemeGroup
National AIDSCommittee (NAC)
TechnicalSupport Unit
Line Ministries
NGOs and CivilSociety
Population
Private Sector
MOH - Central LevelDepartments/Units
Regional HealthAuthorities
Implementing agencies
Implementing agencies
Consultants, ServiceProviders.Suppliers,
Contractors
Guyana Response
• Female Commercial Sex Workers, Men Sexing Men (MSM)Miners and Loggers are prioritized in the HIVision 2020 as key populations at Higher risk for HIV
• Biological Behavioural Surveillance Survey (BBSS) being conducted among miners & loggers in 2013 and includes testing for HIV/STI, Malaria, Dengue, anemia, HepB.
• Prevention: PMTCT,VCT, IEC,HIV Hotline, CSW and MSM Special Project, Condoms, Blood Screening and Safe Injection.
• Treatment: ARV, OI and STI Management and Laboratory Monitoring• Care and Support: HBC Services, Orphans and Vulnerable Children, Food Bank Services
NB :Guyana is participating in a study “Control of Histoplasmosis on HIV-infected patients in the Guiana Shield”
-Increasing awareness of the problem of American Histoplasmosis in HIV-positive patients in the Guiana Shield,· Diagnostic capacity building for histoplasmosis improved in the Guiana Shield,· Clinical practice in HIV patients in the Guiana Shield improved,· Strategy for Histoplasmosis control developed,· Network of trained health professionals reinforced in the Guiana Shield.

Overview of the National HIV Care and Treatment Programme.
Historical Progress of the National HIV Responses
Fir
st A
IDS
Ca
se
1987
Elisa Testing
1989
GU
M C
LIN
IC
1998
VC
T
PMTCT A
RV
S
Gu
ide
lin
es,
CD
4 t
esti
ng
Ge
ne
ric im
po
rte
d A
RV
s,
Pe
dia
tric
A
RV
s
Vir
al
loa
d t
esti
ng
,
He
alt
hq
ua
l
2005200420022001 20092008
Rapid testing SDN, Locally Manufactured,
LSN
Gu
ide
lin
es
revis
ed
PM
S2007 2010
HIV
DR
S
urv
eil
lan
ce,
Pa
tie
nt
Sa
tisf
acti
on
Su
rve
y &
HQ
2
Ro
un
d
Th
ird
Wa
ve
Da
ta C
oll
ecti
on
, 2
ndR
ev
isio
n
Gu
ide
lin
es.
2n
dC
lie
nt
Sa
tisf
acti
on
Su
rve
y,
Fo
urt
h W
av
e o
f D
ata
Co
lle
cti
on
an
d
De
ve
lop
me
nt
of
Co
nsu
me
r A
dv
iso
ry B
oa
rd
2011-12

TB Patients
MSM
FSW
Prisoners
Miners
Security Guards
Adult Prevalence
Pregnant Women
0.0% 5.0% 10.0% 15.0% 20.0% 25.0% 30.0% 35.0%
29.0%
19.4%
16.6%
5.2%
3.9%
2.7%
1.1%
0.8%
HIV Prevalence among different populations
HIV Prevalence
Year of prevalence: Pregnant women, TB patients- 2012, Adult Prevalence, 2011; FSW and MSM- 2009; Security Guards and Prisoners- 2004; Miners- 2003
Epidemiological Over View
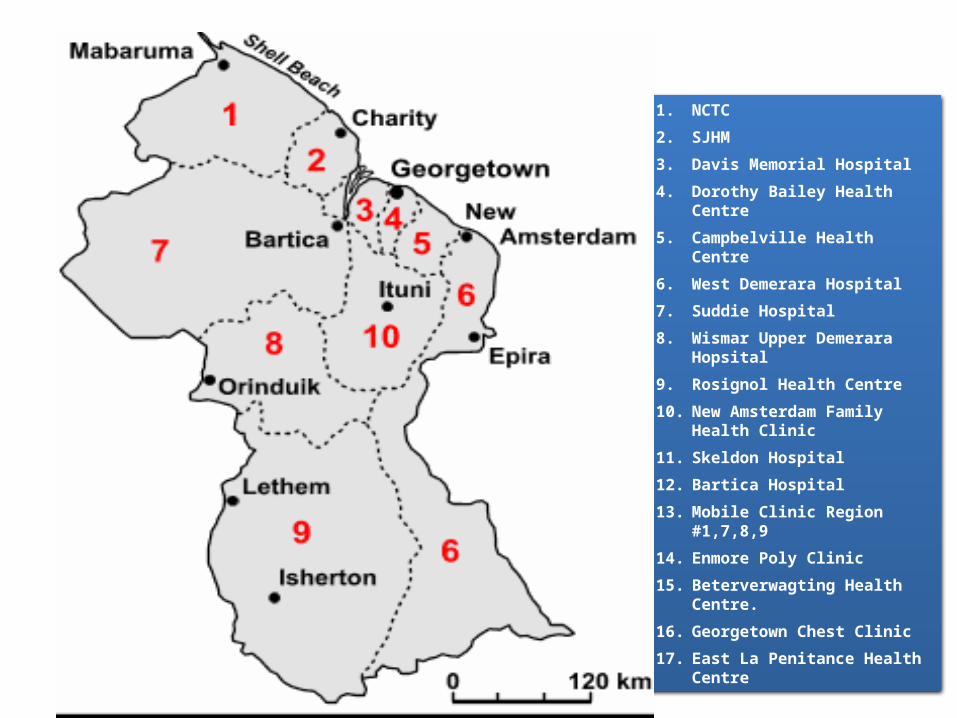
1. NCTC
2. SJHM
3. Davis Memorial Hospital
4. Dorothy Bailey Health Centre
5. Campbelville Health Centre
6. West Demerara Hospital
7. Suddie Hospital
8. Wismar Upper Demerara Hopsital
9. Rosignol Health Centre
10. New Amsterdam Family Health Clinic
11. Skeldon Hospital
12. Bartica Hospital
13. Mobile Clinic Region #1,7,8,9
14. Enmore Poly Clinic
15. Beterverwagting Health Centre.
16. Georgetown Chest Clinic
17. East La Penitance Health Centre
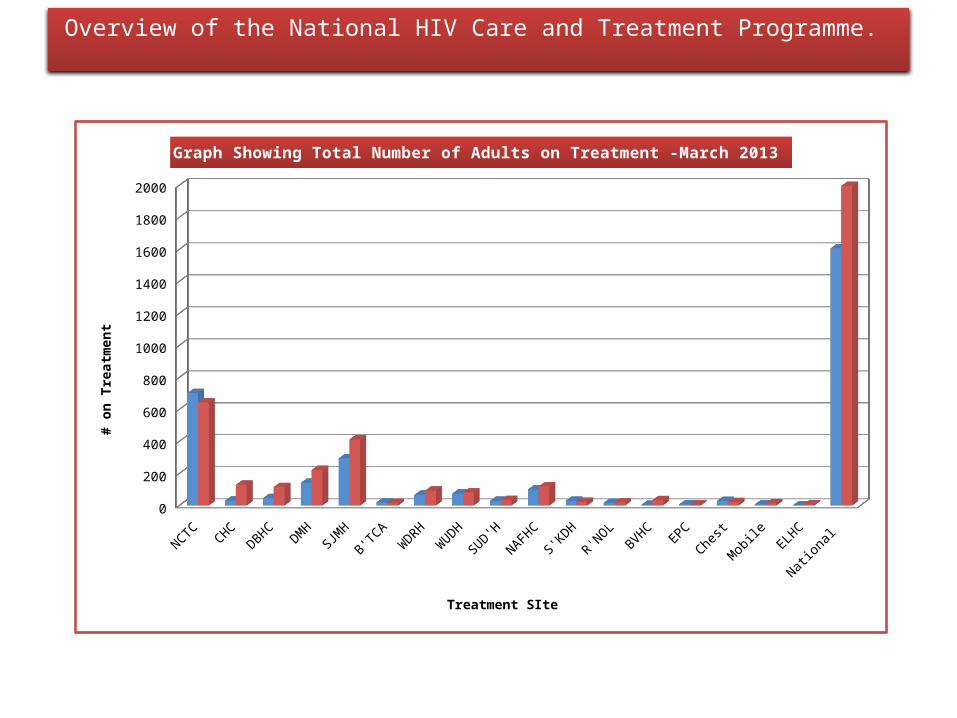
NCTC CHC DBHC DMH SJMH B'TCA WDRH
WUDH
SUD'H
NAFHC
S'KDH R'NOL BVHC EPC Chest Mo-bile
ELHC Na-tional
Male 702 31 47 142 295 20 67 75 30 101 30 17 4 8 29 8 1 1607
Female 644 130 116 222 413 17 94 82 35 119 23 20 33 6 21 14 8 1997
100
300
500
700
900
1100
1300
1500
1700
1900
Graph Showing Total Number of Adults on Treatment -March 2013
Treatment SIte
# on
Tre
atm
ent
Overview of the National HIV Care and Treatment Programme.

NCTC CHC DBHC DMH SJMH B'TCA WDRH WUDH
SUD'H NAFHC
S'KDH R'NOL BVHC EPC Chest Mo-bile
ELHC Na-tional
Male 26 4 4 4 31 3 7 6 2 8 0 0 5 0 0 0 0 100
Female 24 6 3 3 36 2 1 4 2 12 2 1 2 0 0 0 0 98
5
15
25
35
45
55
65
75
85
95
Graph Showing Total Number of Children on Treatment-March 2013
Treatment Sites
# on
Tre
atm
ent
100
300
500
700
900
1100
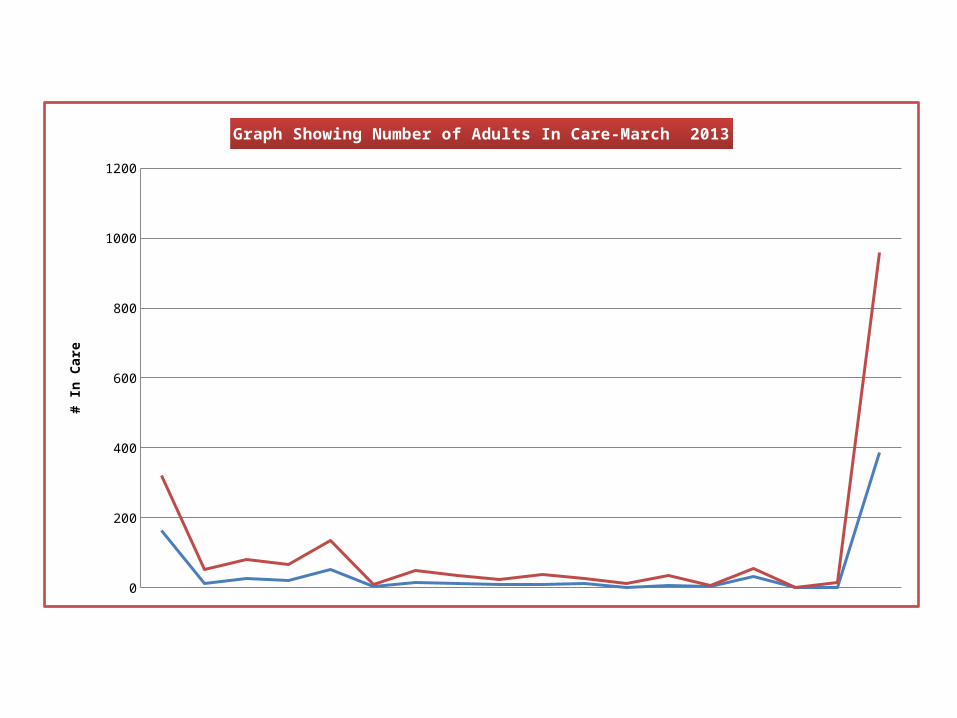
Graph Showing Number of Adults In Care-March 2013
# In
Car
e
NCTC CHC DBHC DMH SJMH B'TCA WDRH
WUDH
SUD'H
NAFHC
S'KDH
R'NOL
BVHC EPC Chest Mo-bile
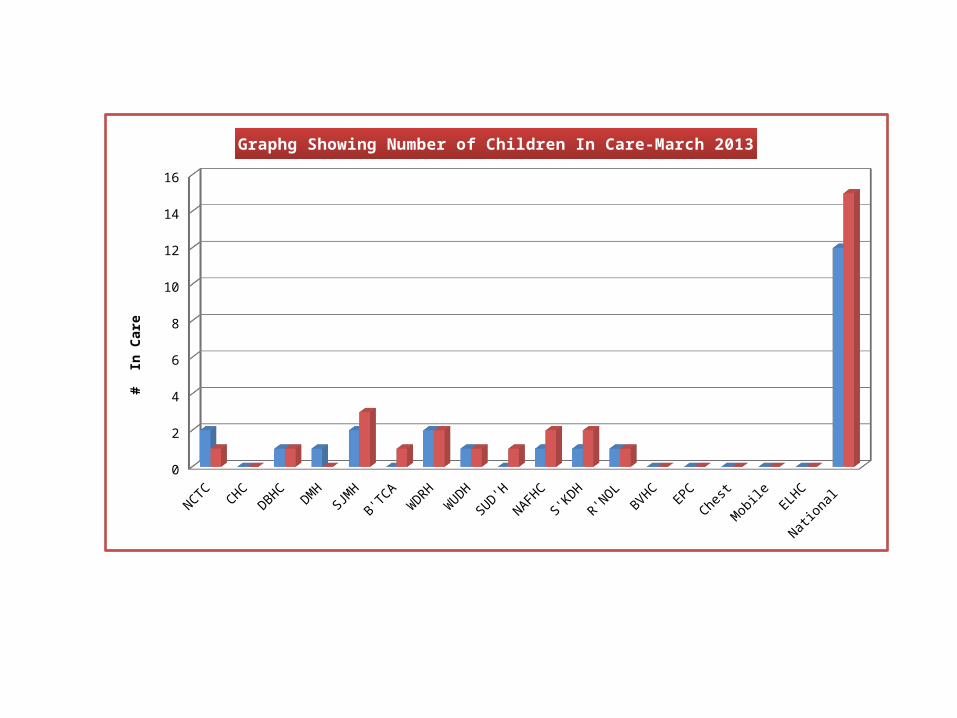
ELHC Na-tional
Male 2 0 1 1 2 0 2 1 0 1 1 1 0 0 0 0 0 12
Female 1 0 1 0 3 1 2 1 1 2 2 1 0 0 0 0 0 15
1
3
5
7
9
11
13
15
Graphg Showing Number of Children In Care-March 2013#
In C
are
NCTC CHC DBHC
DMH SJMH
B'TCA
WDRH
WUDH
SUD'H
NAFHC
S'KDH
R'NOL
BVHC
EPC ELHC Mo-bile
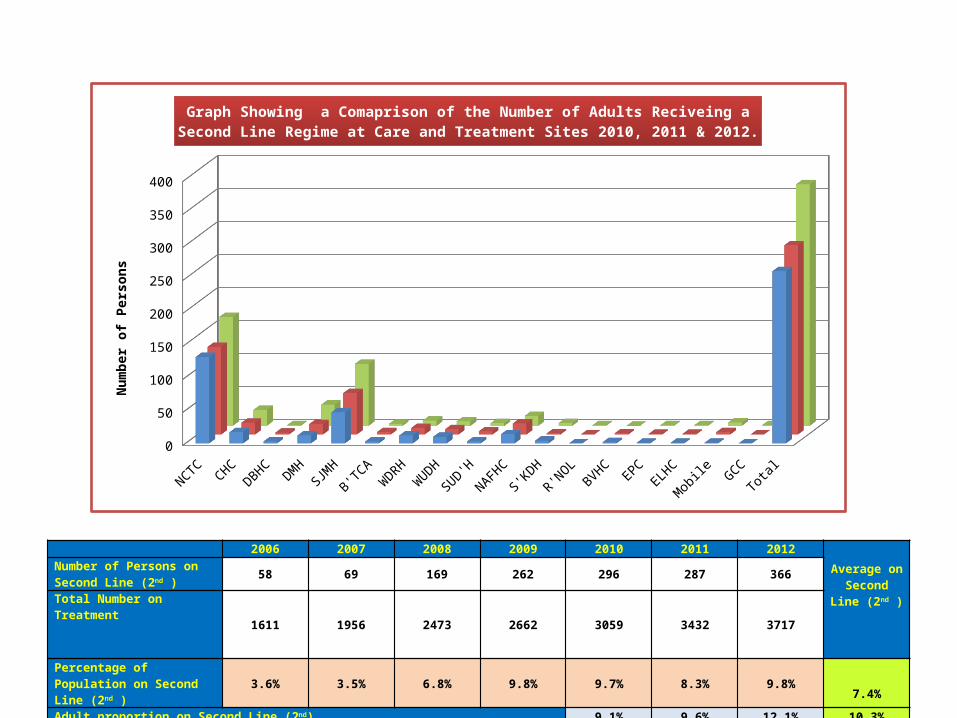
GCC Total
2010 131 17 3 12 47 3 12 10 3 14 4 0 2 1 1 1 0 261
2011 133 18 3 16 63 4 10 8 5 17 2 0 2 1 1 4 0 287
2012 165 24 1 32 94 3 8 7 4 15 4 1 0 1 1 5 1 366
25
75
125
175
225
275
325
375
Graph Showing a Comaprison of the Number of Adults Reciveing a Second Line Regime at Care and Treatment Sites 2010, 2011 & 2012.N
umbe
r of P
erso
ns
2006 2007 2008 2009 2010 2011 2012Average on Second Line
(2nd )
Number of Persons on Second Line (2nd ) 58 69 169 262 296 287 366
Total Number on Treatment
1611 1956 2473 2662 3059 3432 3717
Percentage of Population on Second Line (2nd ) 3.6% 3.5% 6.8% 9.8% 9.7% 8.3% 9.8%
7.4%Adult proportion on Second Line (2nd) 9.1% 9.6% 12.1% 10.3%Pediatric proportion on Second Line (2nd) 18.1% 10% 6.9% 11.7%

National Cohort 2011-2012
Start-Original Cohort 12 Month End Point
Male Female Male Female
0-14
15+
0-14 15+ Total
0-14
15+
0-14
15+ Total
A. Number of person initiated on ART 13 221 15 276 525 13 221 15 276 525
B. Number of transfers IN − − − − − 1 19 2 17 39
C. Number of transfers OUT − − − − − − 6 − 13 19
D.Net Cohort (A+B-C) 13 221 15 276 525 14 234 17 280 545
E. Number died - − − − − − 23 − 15 38
F. Number stopped − − − − − − 7 1 13 21
G. Number dropped (LTF) − − − − − 1 15 − 26 42
H. Number on original first-line regimen 13 221 15 276 525 13 176 16 207 412
I. Number on alternate first-line regimen − 0 − 0 0 − 12 − 15 27
J. Number on second line regimen (switched) − 0 − 0 0 − 1 − 4 5
K. Percent of cohort alive and on ART at 12 months (H+I+J)/D*100
100% 100% − 100% 100% 92.9% 80.8% 94.1% 80.7% 81.5%

NCTC
CHC
DBHC
DMH
SJMH
B'TCA
WDRH
WUDH
SUD'H
NAFHC
S'KDH
R'NOL
BVHC
EPC
Mobile
National
2009-10
83.7
70.6
90.3
82 86.4
75 81.8
88.2
75 65.2
66.7
50 83.3
83.3
58.3
80.7
2010-11
79.9
100
92.5
87 88.4
50 80 85.7
53.4
66.7
91 40 75 83.3
100
80.4
2011-12
85.3
87.5
81.6
73.1
88.4
50 83.3
73.7
75 77 91 75 92.9
80 77.8
81.5
525456585
Graph Showing Comparison of Twelve Months Surviability Measure
2009-102010-112011-12
Pe
rce
nta
ge
%
2009-10 2010-11 2011-12
7.69.6
7.7
9.1 8.7
6.9
2.81.3
3.9
Graph showing the comaprions of three outcomes after twelve months on treatment .
LTFU (Drop) Died Stopped
Challenges
•Retention in Care ; adherence to clinical appointment and medications
•TB/HIV Co-infection
•Third Line Regimen need; the future cost
•Sustainability of the response

THANK YOU