
BGL Business Services Insider - Breakout of the PEO Industry

Promise Kept or Promise Deferred
BGL Insurance Report

Plc
Rest
ructu
red
.R
ein
forc
ed
.R
eju
ven
ate
d.
Gro
up


ContentsFunso Oke [email protected]
Femi Ademola [email protected]
Vincent Nwani [email protected]
Dare Daramola [email protected]
Oritsejimi Ogbobine [email protected]
Antoinette Uwumarogie [email protected]
Uwa Osadiaye [email protected]
Patience Ololo [email protected]
Production TeamFlora Fabyan
Yvonne Edozien
Usman Imanah
Titilayomi Fakorede
Research Analysts 1. Executive Summary 5
2. Global Insurance lndustry 7
3. Nigerian Insurance Sector 14
4. Views of Industry Experts 24
5. Investment Opportunities in the Insurance Sector 29
6. Featured Insurance Companies 30
(i) AIICO Insurance Plc 31
(ii) Cornerstone Insurance Plc 34
(iii) Crystalife Insurance Company Limited 38
(iv) Custodian and allied Insurance Plc 42
(v) Goldlink Insurance Plc 46
(vi) Guaranty Trust Assurance Plc 50
(vii) Intercontinental WAPIC Insurance Plc 54
(viii) LASACO Assurance Plc 58
(viiii) Leadway Assurance Company Limited 61
(x) Mutual Benefits Assurance Plc 65
(xi) Niger Insurance Plc 69
(xii) Oasis Insurance Plc 74
(xiv) Prestige Assurance Plc 78
(xiv) Sovereign Trust Insurance Plc 83
(xv) Standard Alliance Insurance Plc 87
(xvi) Staco Insurance Plc 91
7. Appendix 95
1. Insurance Trends in Other Jurisdictions 96
(i) Latin America 97
(ii) Asia- China 98
(iii) Japan 99
(iv) Africa –South Africa 100
(v) United States Of America 101
(vi) United Kingdom 102
(vii) Europe 102

5BGL Insurance Report | January 2010
BackgroundContrary to the expectation that the Nigerian Insurance Industry would be the next growth sector, the performance of the industry, in spite of considerable improve-ment, remains far below optimal. Insurance density grew from 4.3% in 2006 to 6.9% in 2008 while the industry’ global ranking improved from 65 in 2006 to 61 in 2008. According to the National Insurance Commission (NAICOM), Gross Premium income also improved from N94 billion (US$639.4m) in 2006 to about N180 billion (US$1.23 billion) in 2008; however the industry has the potential to deliver N1.1trillion (US$7.5billion) in Gross Premium by 2012 and N60 trillion (US$400.81 billion) by 2020. NAICOM also targets increased insurance penetration from the current 6% to 30% by 2012, grow insurance contribution to GDP from 0.7% to 3% by 2012 and grow insurance density from the present N1,200 per individual to at least N7,500.
Global DevelopmentsInsurance companies worldwide are experiencing a daunting task of sustained profitability in the face of capital constraints and volatile asset values. For the first time since 1980, global insurance premium declined in real terms; down 2.0%. In the same vein, they all face common challenges as well. PriceWaterhouseCoopers (2009) identified the most common challenges of the insurers to include gover-nance and risk management, merger and acquisition, business growth, compliance and regulations, human capital and reporting requirements. The adoption of the European Union’s (EU’s) Solvency II is also expected to put reporting pressure on European insurers. Deloitte also noted that, thriving in the competitive landscape requires ability to reach customers, increased efficiency and cost control, high level of services and most importantly, the execution of plans and initiatives.
Challenges for Nigerian InsuranceNigerian insurers face the same challenges as their developed countries’ coun-terparts. However, as a developing country the challenges for Nigerian insurance companies will also include enforceability of insurance regulations. The growth target expected for the industry by the regulators would only be achieved through the enforcement of compulsory insurance.
Key Success FactorsExpectedly, the success of Nigeria’s insurance industry will depend largely on the resolution of the identified challenges especially the enforcement of compulsory insurance. Other key success factors are prompt claim settlement, competent management and corporate governance, innovative products, human capital and technology.
Insurance density grew from 4.3% in 2006 to 6.9% in 2008 while the industry’ global ranking improved from 65 in 2006 to 61 in 2008.
For the first time since 1980, global insurance premium declined in real terms; down 2.0%.
The main challenge of insurance business in Nigeria is the enforceability of compulsory insurance.
Executive Summary

6 BGL Insurance Report | January 2010
Industry OutlookIn order to deliver on growth expectations, Nigeria’s insurance industry clearly needs to experience certain changes. In the view of some industry experts, these will in-clude market-driven mergers, human capital development, charging appropriate premiums, and adoption of Solvency II in continuation of the dynamic approach to regulation by NAICOM. In their views, the mark to market reporting requirement imposed by the regulator in 2008 is an indication of the industry’s readiness to adopt the Solvency II framework.
Investment OpportunitiesAvailable investment opportunities for industry operators include the local content initiative of the federal government in oil and gas sector, investment in physical infra-structure and the convergence of the pension industry and the health management organisations (HMO). Government’s target of 70% local content by 2010 provides significant opportunities for insurance companies whose capacity had hitherto been a hindrance to meeting earlier targets. The obvious infrastructure need of the country also provide insurance companies with alternative investment avenue.
The industry will face some market-driven mergers while the adoption of the Solvency II framework will help reporting standard.

7BGL Insurance Report | January 2010
Global Insurance Industry
Insurers globally are striving to sustain profitability in the face of capital constraints, volatile asset values, the softening of non-life premium rates and the slowdown in the economies worldwide. The move to EU Solvency II and a finalised IFRS for insurance contracts (IFRS Phase II) also presents the greatest shake-up in report-ing and regulation (PWC, 2009). Outside the United States, the insurance industry is divided into life and non-life or general insurance rather than life/health and property/casualty. According to the latest Swiss Re sigma study, world insurance premium volume grew 3.4% in 2008, reflecting a 2.0% rise in life insurance and a 5.5% rise in nonlife premiums. World insurance premiums totalled US$4.27 trillion in 2008, up from US$4.13 trillion the previous year.
Year Life Nonlife (2) Total
2006 $2,125,791 $1,549,100 $3,674,892
2007 2,441,823 1,685,762 4,127,586
2008 2,490,421 1,779,316 4,269,737
World Life and Nonlife Insurance Premiums, 2006-2008 (1)(Direct premiums written, U.S. $ millions)
(1) Before reinsurance transactions(2) Includes accident and health insuranceSource: Swiss Re, Sigma
Top Ten Global Insurance Companies by Revenues, 2009 Company Country Sales Profits Assets Market Value (US$billion) (US$billion) (US$billion) (US$billion)American Intl Group United States 107.0 11.90 843.40 172.24 AXA Group France 115.2 3.42 641.88 66.12 Allianz Worldwide Germany 124.4 2.98 1,300.65 65.55 MetLife United States 44.8 4.71 481.65 37.94 Generali Group Italy 89.0 1.78 372.35 45.45 Zurich Financial Services Switzerland 64.9 2.81 320.72 33.97 Prudential Financial United States 31.7 3.54 417.78 39.70 Aviva U. K. 75.6 2.03 431.29 33.10 Munich Re Germany 62.1 2.49 276.12 30.99 Manulife Financial Canada 26.7 2.83 156.33 50.52 Aegon Netherlands 46.4 2.26 341.43 26.40
Source: Economy watch; based on Forbes’ Report Date: Feb. 28, 2009

8 BGL Insurance Report | January 2010
No doubt insurance companies face daunting common challenges. According to an industry outlook by Deloitte, insurers need to develop innovative bundles of products and services to drive top-line growth, pay attention to distribution network and keep up with increasing regulatory scrutiny around security and capital require-ments, as well as escalating attention to fraud and money laundering in order to avoid financial and reputation risk of non-compliance. According to PWC, insurers’ challenges include governance and risk management, merger and acquisition, busi-ness growth, compliance and regulations, human capital and reporting. As insurers fight to overcome these challenges, they also face ever-increasing competition in a marketplace where some mature segments are not growing as anticipated. Therefore, Deloitte in its report on the global insurance industry outlook noted that thriving in the competitive landscape requires ability to reach customers, increased efficiency and cost control, high level of services and most importantly, the execu-tion of plans and initiatives. Going forward, insurance companies will need to be quicker in implementing strategic actions with high levels of precision and efficiency. However BGL analysts believe that in developing countries, industry challenges include enforceability of insurance regulations while key success factors include a strong financial and claim settlement system, robust balance sheet for capacity and liquidity, technology and good corporate governance.
Challenges of Insurance IndustryInsurance companies find themselves juggling a variety of challenges as they work to improve profitability, grow and compete. For example, Life insurance companies face demographic changes that are altering their customer base while property and casualty companies face complex and increased exposure to significant risks due to natural disasters and terrorism. However, while the challenges facing the industry are very enormous, the changes they require are also bringing new opportunities. Some of the common challenges experienced by the industry as identified by PWC are:
Governance and Risk ManagementThe record losses from natural disasters and the global financial meltdown have once again highlighted the scale of the risks faced by insurers in an increasingly complex and uncertain financial, geopolitical and climatic environment. According to PWC, model outputs are clearly critical in monitoring and controlling aggregations and concentrations of risk. However, the largely unexpected gravity of the losses and resulting pressure on reinsurance programmes have once again underlined the importance of quality data, effective validation and calibration of model outputs and, not least, the sense check of underwriting experience and intuition. The de-velopment of Enterprise Risk Management (ERM) capabilities can help to protect insurers from losses, earnings surprises and reputational damage and provide a platform for strengthening governance, decision-making and regulatory compli-ance. Of particular interest to the industry was the threatened bankruptcy of the American International Group (AIG), an octopus in the insurance industry. As the world’s largest insurance company by assets, AIG had subsidiaries in UK, France, Hong-Kong, Australia, Pakistan, Philippines, Singapore, India, etc, and was engaged in various business activities.
Buoyed by its size and resources, the organisation took unbridled risks oblivious of the consequences particularly on shareholders’ funds. It did not take time for the bubble to burst. In spite of the crises that engulfed the firm, its insurance arm was
Going forward, insurance companies will need to be quicker in implementing strategic actions with high levels of precision and efficiency.
The development of Enterprise Risk Management (ERM) capabilities can help to protect insurers from losses, and provide a platform for strengthening governance,
9BGL Insurance Report | January 2010
largely unaffected as it carried on with its business of providing cover to clients. This development notwithstanding, a lot of lessons need to be learnt from AIG. According to the unfolding report, its managers appeared to have demonstrated a knowledge gap in the area of providing cover for complex investment instruments such as credit enhancement products and mortage- backed securities. As players in the insurance industry, we need to acknowledge the fact that no insurance company or business entity is too big to fail. As the world’s largest insurer by assets, AIG was the 18th largest company in the world before it ran into troubled waters. Besides, Insurance Companies must develop mechanisms for analysing business risks before accepting to underwrite such risks. AIG was unduly exposed to complex financial transactions/instruments which were subsequently downgraded by rating agencies. A recent study conducted by PWC, titled “ERM in insurance industry: a global study” revealed that many insurers are finding it difficult to make headway in implementing and embedding ERM in the face of continuing data, systems and governance challenges. However, the study also found many examples of how insightful and effective management are helping to overcome these technical and organisational hurdles and bring greater clarity to insurers’ ERM missions. Above all, investors in the capital market must learn to be familiar with its ups and downs and the concept of portfolio diversification as a veritable tool for risk reduction.
GrowthAfter a period of cost cutting and retrenchment, insurers are once again shifting up a gear and striving for managed growth. Organic revenue growth is valued by inves-tors but has been elusive in the relatively mature insurance industry. Demand for pensions and health insurance is likely to rise as the population ages and prepares for a longer retirement. Further openings are coming from the increasing affluence and sophistication of customers in emerging markets such as China and India as well as frontier markets like Nigeria and Indonesia. While cost control will remain critical, the ability to meet the increasingly exacting demands of today’s custom-ers is likely to be the key competitive advantage. To succeed, insurance companies will need to find ways to design innovative bundles of new products and services, cross-sell more effectively, strengthen their relationships with agents and brokers, and seize the opportunities presented by emerging markets and demographics.
An important factor in ensuring business growth is the adoption of the appropri-ate model for product distribution. Insurance companies worldwide have adopted either or all of several strategies including bancassurance, direct sales-force, tied agents and insurance brokers. The ideal strategy will be the one that offers the most cost effective method of distribution. However, bancassurance which is adopted by major European insurance groups such as Lloyds TSB, Allianz, Banca Unicredito and Caja Madrid is the most popular in Europe.
Many insurers are finding it difficult to make headway in implementing and embedding ERM in the face of continuing data, systems and governance challenges.
To succeed, insurance companies will need to find ways to design innovative bundles of new products and services, and cross-sell more effectively using appropriate distribution model
10 BGL Insurance Report | January 2010
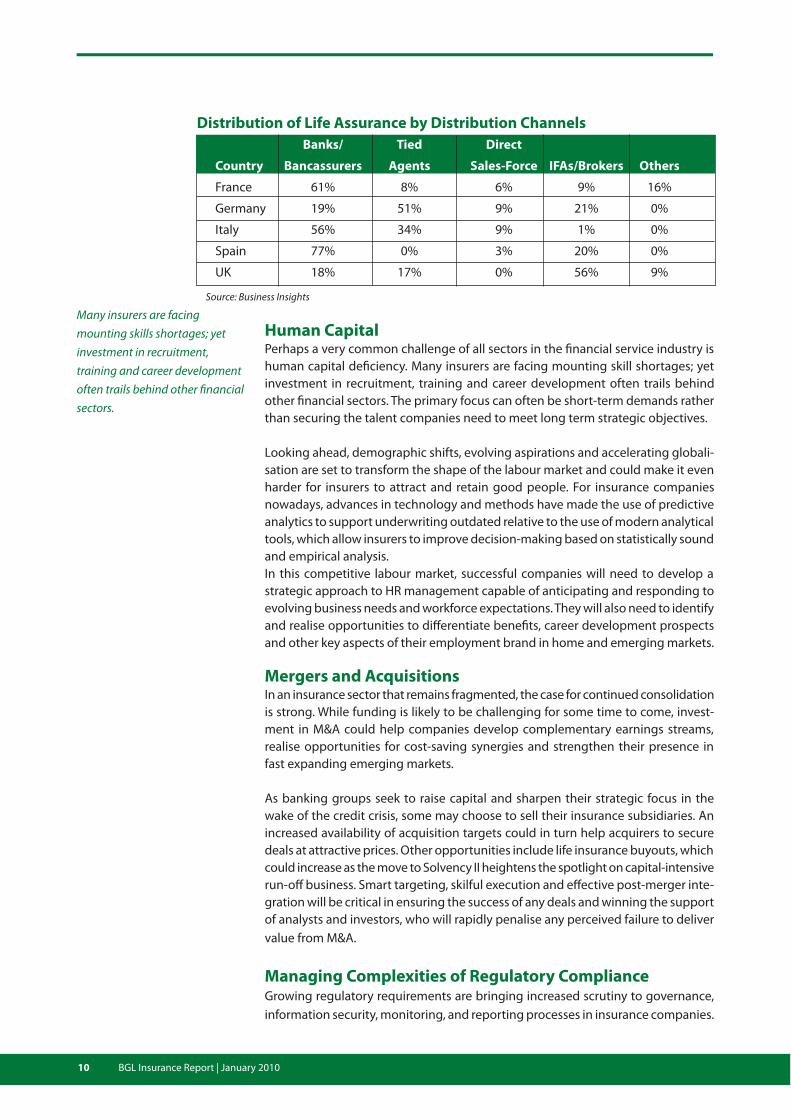
Source: Business Insights
Human CapitalPerhaps a very common challenge of all sectors in the financial service industry is human capital deficiency. Many insurers are facing mounting skill shortages; yet investment in recruitment, training and career development often trails behind other financial sectors. The primary focus can often be short-term demands rather than securing the talent companies need to meet long term strategic objectives.
Looking ahead, demographic shifts, evolving aspirations and accelerating globali-sation are set to transform the shape of the labour market and could make it even harder for insurers to attract and retain good people. For insurance companies nowadays, advances in technology and methods have made the use of predictive analytics to support underwriting outdated relative to the use of modern analytical tools, which allow insurers to improve decision-making based on statistically sound and empirical analysis.In this competitive labour market, successful companies will need to develop a strategic approach to HR management capable of anticipating and responding to evolving business needs and workforce expectations. They will also need to identify and realise opportunities to differentiate benefits, career development prospects and other key aspects of their employment brand in home and emerging markets.
Mergers and AcquisitionsIn an insurance sector that remains fragmented, the case for continued consolidation is strong. While funding is likely to be challenging for some time to come, invest-ment in M&A could help companies develop complementary earnings streams, realise opportunities for cost-saving synergies and strengthen their presence in fast expanding emerging markets.
As banking groups seek to raise capital and sharpen their strategic focus in the wake of the credit crisis, some may choose to sell their insurance subsidiaries. An increased availability of acquisition targets could in turn help acquirers to secure deals at attractive prices. Other opportunities include life insurance buyouts, which could increase as the move to Solvency II heightens the spotlight on capital-intensive run-off business. Smart targeting, skilful execution and effective post-merger inte-gration will be critical in ensuring the success of any deals and winning the support of analysts and investors, who will rapidly penalise any perceived failure to deliver value from M&A.
Managing Complexities of Regulatory ComplianceGrowing regulatory requirements are bringing increased scrutiny to governance, information security, monitoring, and reporting processes in insurance companies.
Many insurers are facing mounting skills shortages; yet investment in recruitment, training and career development often trails behind other financial sectors.
Banks/ Tied Direct
Country Bancassurers Agents Sales-Force IFAs/Brokers Others
France 61% 8% 6% 9% 16%
Germany 19% 51% 9% 21% 0%
Italy 56% 34% 9% 1% 0%
Spain 77% 0% 3% 20% 0%
UK 18% 17% 0% 56% 9%
Distribution of Life Assurance by Distribution Channels

11BGL Insurance Report | January 2010
European insurers are facing a perfect storm of new and more exerting regulatory demands. Solvency II, the planned reform of prudential standards for European insurers, is likely to require a major overhaul of risk and capital management, along with supporting information, documentation and modelling systems. The upcom-ing National Association of Insurance Commissioners (NAIC) model audit rule, the FASB and IASB efforts to define the term “insurance”, and the increasing focus of the Internal Revenue Service on insurance product tax compliance are putting regulatory pressure on US insurance companies.
The EU Reinsurance Directive seeks to provide a common system of regulation and mutual recognition across Europe. This includes a new definition of finite reinsur-ance that may preclude many existing contracts. The other key provision is the easing of the regulatory restrictions on securitisation, which could pave the way for a considerable increase in risk transfer to the capital markets. Sarbanes-Oxley Act requires compliant firms to tighten up and validate the effectiveness of their inter-nal control frameworks. Insurers are also facing a raft of local regulatory changes, including tougher provisions on customer protection and Anti-money laundering.
According to PWC, the key challenge is how to integrate these regulatory demands into ‘business as usual’ and use the investment as a basis for improving governance, decision-making and strategic assurance. Enterprise-wide risk management can help to provide a reliable and cost-effective platform for compliance across differ-ent jurisdictions and in conformity with specific compliance requirements. More sophisticated risk-based capital management can not only help to underpin com-pliance with new prudential regulation, but also provide a better understanding of the trade off between risk and reward, leading to desired capital allocation and more sustainable value creation.
Reporting RequirementsInsurers are facing a major overhaul of market reporting. This includes the launch of the Market Consistent Embedded Value Principles, planned move to a finalised IFRS standard for insurance contracts (IFRS Phase II) and the enhanced risk and capital management disclosure envisaged under EU Solvency II. Even where they do not apply, these changes are likely to set a benchmark for global disclosure that others may need to follow, particularly in relation to risk. Key developments include the possible adoption of IFRS in the US from 2014. Implementation of Solvency II and IFRS Phase reporting will be demanding. The good news is that parallels in the timings and bases of valuation could open up cost-saving synergies in areas such as data, assumption setting, modelling and reconciliation. The developments also offer an opportunity to strengthen stakeholder confidence by enabling insurers to convey a single view of their business that more closely reflects the way it is run internally. A survey of 2007 IFRS insurance reports suggests that many companies will need to provide considerably more risk information and explanation to meet the more exacting analyst expectations that have resulted from market events.
Solvency II With the creation of the European Single Market, insurance companies had to face a lot of specific risks which necessitated the introduction of Solvency I. Its develop-ment in 1997 and subsequent implementation in 2004 was meant to assure the stability of the insurance sector in meeting payment obligations to the insured.
The Key challenge is how to integrate regulatory demands into ‘business as usual’ and use the investment as a basis for improving governance, decision-making and strategic assurance

12 BGL Insurance Report | January 2010
The focus was on stricter equity requirements for adequate solvency at all times. However, due to the rapid changes in the capital markets, technology, investment instruments and increasing competition, the risk environment of insurance com-panies also altered; necessitating a revision of Solvency I.
Solvency II framework seeks to create solvency requirements that are more aligned to the risks faced by the companies, and to establish consistent supervision across all the EU member states. Solvency II is also compatible with the Financial Reporting Standards which require that assets and liabilities are marked to the market.
Solvency I focused on stricter equity requirements for adequate solvency at all time.whilst Solvency II seeks to create solvency requirements that are more aligned to the risks faced by the companies, and to establish consistent supervision across all the EU member states.
Solvency I and Solvency II Compared
Solvency II moves the focus away from the accounting-based ap-proach of solvency I to one that is more economically orientated
Solvency I
Solvency II
Book value of assets
MV Increase
Book value of assets
Free surplus
Solvency I
Technical provisions
Free surplus
SCR
MCR
Risk margin
Fair value of liabilities
Capital requirement
Technical provisions
Source: Deloitte & Touché LLP
Similar to Basel II for the banking industry, Solvency II requires insurance companies to set aside regulatory capital based on the amount of risk they face, with incen-tives in the form of reduced capital requirements for companies that have strong risk-management systems and robust internal controls. The framework is structured around three pillars:
Pillar 1: Quantitative requirements including the calculation of technical provisions and the rules relating to investment management and solvency capital.Pillar 2: Qualitative aspects of internal controls, risk management and supervi-sion.Pillar 3: Increased disclosure of the risk profile to increase transparency for regula-tors.

13BGL Insurance Report | January 2010
GOAL
Solvency II
Improved Financial Market Stability
MCR and SCR to cover,
valuate and measure main
risks with their subrisks:
Underwriting Risk
Investment Risk
Operational Risk
Two approaches:
ESA Internal Model
Approach
Improve supervision with-
in the three main parts:
Internal Control
Risk Management
Corporate Governance
Approaches:
Stress Tests, VaR Scenarios,
Simulations Continuity
testing
Improve transparency and
market discipline.
Approaches:
Disclosure requirement
aligned with IAS/IFRS
Great Unifying Theory
Publication of:
Quantitative information
Qualitative information
Measurement of Capital Supervisory Review Disclosure Requirements
Pillar 1 Pillar 2 Pillar 3
Comparing Solvency II to Basel IIThe joint purpose of Basel II and Solvency II is to efficiently reduce risks if well implemented but there are other similarities in the two models. Firstly, both models show some similarities in terms of objectives, costs and resources; they claim an improvement of risk management, market discipline, and transparency to fortify the financial stability on an international level, taking into consideration both the parent companies and subsidiaries. The objective would be achieved by the similar three-pillar structure.
Secondly, both models want to support and strengthen the stability of the financial market and to harmonise the supervision systems. For both banks and insurance companies, standard approaches and internal models are allowed to calculate the capital requirements within the first pillar. Both systems determine their Minimum Capital Requirement (MCR) in relation to underlying risks and present them in absolute numbers.
On the international level, certain parallels regarding new accounting standards are obvious. Both systems base their reporting strongly on the discussion of the international committees. This is important, considering the worldwide acceptance of Basel II and probably Solvency II.
However, despite the similarities, there are some distinguishing features that dif-ferentiate them. The models have differences in terms of organisation, regional scope and maturity. While the Basel II was initiated by the Basel Board of Banking Supervision and later examined within a wide international consultation including affected banks and associations before adoption, all designs and developments of Solvency II are coordinated by the EU. Also, while Basel II is developed and implemented worldwide; Solvency II is currently a European product. Opinions of industry analysts vary with regards to the difference between the two models. Some industry analysts believe that Solvency II represents a much wider and much more sophisticated consideration of risk than Basel II. While Basel II is a much more rule-based regulation, Solvency II is more principle-based.
Basel II and Solvency II both focus on improved risk management, market discipline and transparency, stability of financial market and harmonised supervision systems.
Some analysts believe that Solvency II represents a much wider and a much more sophisticated consideration of risk than Basel II
14 BGL Insurance Report | January 2010
The Nigerian Insurance Sector
The importance of a nation’s system for obviating, transferring or distributing risk via its insurance business can only, in part, be measured by the sheer size of its business, the number of its employees in a given country, the assets under management, or its contribution to the national GDP. As The Geneva Association puts it, “Insurance actually plays a more fundamental role in the workings of a modern society being a necessary precondition for many activities that would not take place were it not for insurance.” China’s Jiang Zemin – one of the key architects of its extant economic miracle - notes that Finance is the core of the modern economy, while insurance is an important component part of the financial system which plays an important role in promoting reforms, guaranteeing economy, stabilising society and benefit-ing the citizenry.
It is simply not plausible for an economy to engage developmental plans, systems projects or transactions of the number, variety and complexity that modernity demands without a supporting insurance industry.
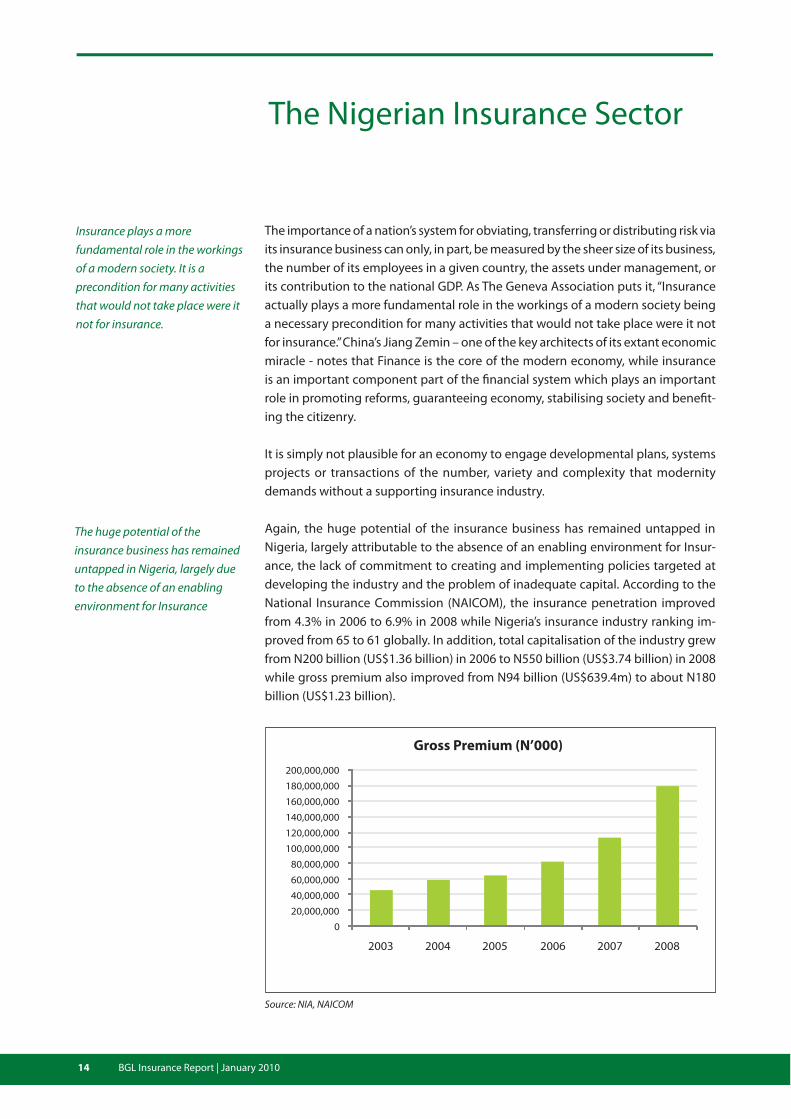
Again, the huge potential of the insurance business has remained untapped in Nigeria, largely attributable to the absence of an enabling environment for Insur-ance, the lack of commitment to creating and implementing policies targeted at developing the industry and the problem of inadequate capital. According to the National Insurance Commission (NAICOM), the insurance penetration improved from 4.3% in 2006 to 6.9% in 2008 while Nigeria’s insurance industry ranking im-proved from 65 to 61 globally. In addition, total capitalisation of the industry grew from N200 billion (US$1.36 billion) in 2006 to N550 billion (US$3.74 billion) in 2008 while gross premium also improved from N94 billion (US$639.4m) to about N180 billion (US$1.23 billion).
Insurance plays a more fundamental role in the workings of a modern society. It is a precondition for many activities that would not take place were it not for insurance.
The huge potential of the insurance business has remained untapped in Nigeria, largely due to the absence of an enabling environment for Insurance
0
20,000,000
40,000,000
60,000,000
80,000,000
100,000,000
120,000,000
140,000,000
160,000,000
180,000,000
200,000,000
2003 2004 2005 2006 2007 2008
Source: NIA, NAICOM
Gross Premium (N’000)
15BGL Insurance Report | January 2010
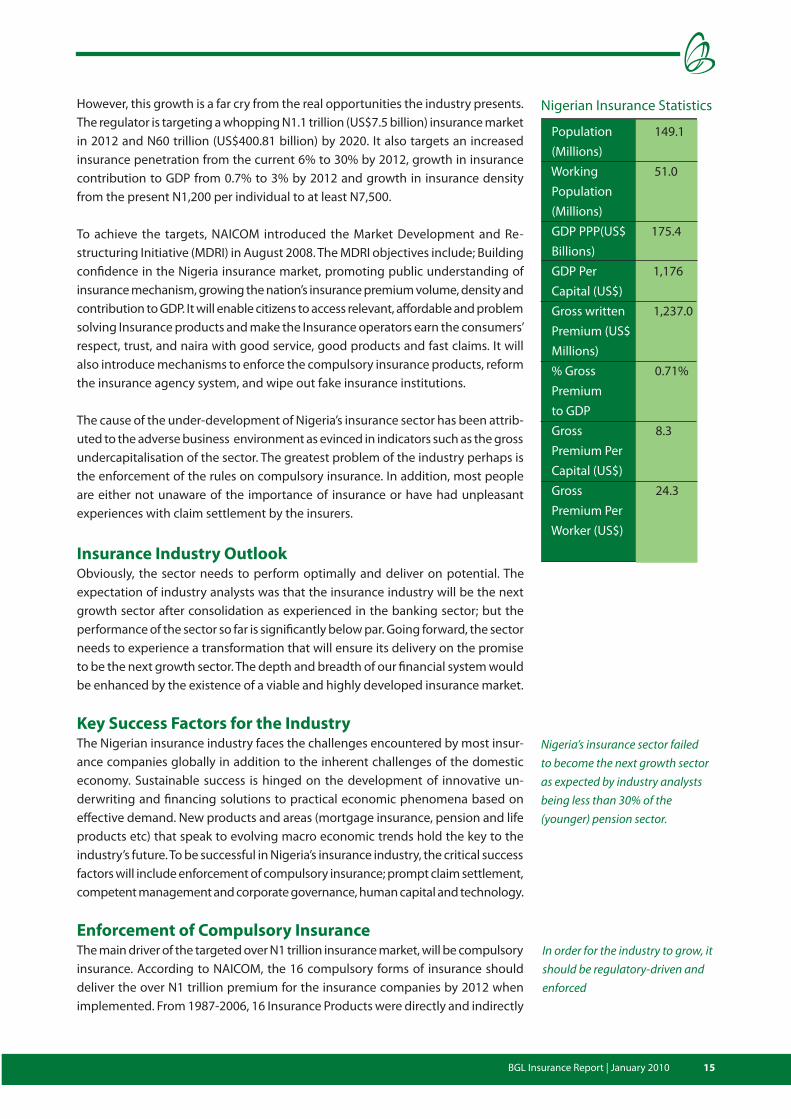
However, this growth is a far cry from the real opportunities the industry presents. The regulator is targeting a whopping N1.1 trillion (US$7.5 billion) insurance market in 2012 and N60 trillion (US$400.81 billion) by 2020. It also targets an increased insurance penetration from the current 6% to 30% by 2012, growth in insurance contribution to GDP from 0.7% to 3% by 2012 and growth in insurance density from the present N1,200 per individual to at least N7,500.
To achieve the targets, NAICOM introduced the Market Development and Re-structuring Initiative (MDRI) in August 2008. The MDRI objectives include; Building confidence in the Nigeria insurance market, promoting public understanding of insurance mechanism, growing the nation’s insurance premium volume, density and contribution to GDP. It will enable citizens to access relevant, affordable and problem solving Insurance products and make the Insurance operators earn the consumers’ respect, trust, and naira with good service, good products and fast claims. It will also introduce mechanisms to enforce the compulsory insurance products, reform the insurance agency system, and wipe out fake insurance institutions.
The cause of the under-development of Nigeria’s insurance sector has been attrib-uted to the adverse business environment as evinced in indicators such as the gross undercapitalisation of the sector. The greatest problem of the industry perhaps is the enforcement of the rules on compulsory insurance. In addition, most people are either not unaware of the importance of insurance or have had unpleasant experiences with claim settlement by the insurers.
Insurance Industry OutlookObviously, the sector needs to perform optimally and deliver on potential. The expectation of industry analysts was that the insurance industry will be the next growth sector after consolidation as experienced in the banking sector; but the performance of the sector so far is significantly below par. Going forward, the sector needs to experience a transformation that will ensure its delivery on the promise to be the next growth sector. The depth and breadth of our financial system would be enhanced by the existence of a viable and highly developed insurance market.
Key Success Factors for the IndustryThe Nigerian insurance industry faces the challenges encountered by most insur-ance companies globally in addition to the inherent challenges of the domestic economy. Sustainable success is hinged on the development of innovative un-derwriting and financing solutions to practical economic phenomena based on effective demand. New products and areas (mortgage insurance, pension and life products etc) that speak to evolving macro economic trends hold the key to the industry’s future. To be successful in Nigeria’s insurance industry, the critical success factors will include enforcement of compulsory insurance; prompt claim settlement, competent management and corporate governance, human capital and technology.
Enforcement of Compulsory InsuranceThe main driver of the targeted over N1 trillion insurance market, will be compulsory insurance. According to NAICOM, the 16 compulsory forms of insurance should deliver the over N1 trillion premium for the insurance companies by 2012 when implemented. From 1987-2006, 16 Insurance Products were directly and indirectly
Nigerian Insurance Statistics
Nigeria’s insurance sector failed to become the next growth sector as expected by industry analysts being less than 30% of the (younger) pension sector.
In order for the industry to grow, it should be regulatory-driven and enforced
Population 149.1 (Millions) Working 51.0 Population (Millions) GDP PPP(US$ 175.4 Billions) GDP Per 1,176 Capital (US$) Gross written 1,237.0 Premium (US$ Millions) % Gross 0.71% Premium to GDP Gross 8.3 Premium Per Capital (US$) Gross 24.3 Premium Per Worker (US$)

16 BGL Insurance Report | January 2010
made compulsory in Nigeria. Six are prominent and capable of generating about 55% of industry premium income.
The six products are Third Party Motor Insurance (Section 68 of Insurance Act 2003), Builders Liability (Section 64 of Insurance Act 2003), Occupiers’ Liability (Section 65 of Insurance Act 2003), Workmen’s’ Compensation (Section 40 of Workmen’s Compensation Act 1897), Health Care Professional Indemnity (Section 45 of the Nigerian Health Insurance Scheme 1995) and the Statutory Group Life (Section 3(2) and Section 9(3) of Pension Reform Act 2004).
While some industry experts opined that insurance should be a voluntary act, it should be noted that this would be a long term idea. At the moment, in order for the industry to grow, it should be regulatory driven and enforced. Failure to insure will put a lot of pressure on government to provide succour at the occurrence of perils especially due to natural disasters. The enforcement of compulsory insurance could make insurance the biggest sector in the financial service industry.
Strong Financials & Claim Settlement SystemAn immediate problem in the sector is the non-settlement/delay in claim settlement. While most Nigerians might not buy insurance policies, the few that do are usually faced with this issue whenever losses have been suffered. While this problem was generally believed to be a result of weak financial status of some insurance com-panies, there have been arguments that the problem is systemic as some suppos-edly liquid companies also delay claims settlement. The company with the most efficient claims settlement system will attract the most subscribers. Although, the value of claims paid has been on the increase in recent years, its percentage to gross premium has been on the decline. This might mean better risk management
The company with the most efficient claims settlement system will attract the most subscribers.
Source: NIA’s Insurance Digest 2008
Nature of loss 2003 2004 2005 2006 2007Fire 2,965,775 15,765,025 2,937,268 2,417,626 2,168,330Burglary Theft 760,769 734,648 1,011,383 1,474,951 2,099,528Contractor All Risk 696,306 1,414,831 3,697,728 5,813,955 5,587,843Fidelity Guarantee 212,506 495,135 89,436 410,446 181,668Engineering 131,182 151,044 319,217 674,116 520,017Motor 263,867 573,652 485,993 412,849 1,291,773Personal Accident 132,328 297,570 28,693 298,810 87,269Marine 299,425 423,603 628,200 513,685 936,906Public Liability 33,358 39,171 34,731 212,367 89,303Aviation 84,834 115,979 41,600 114,950 101,608Oil - - 217,771 15,873 202,044General Accident 512,868 783,316 1,069,790 1,366,404 1,146,304Miscellaneous 132,730 112,538 338,304 602,287 148,196Life - - - - 2,876,282Total 6,225,948 20,906,512 10,900,114 14,328,319 17,437,071Gross Premium 46,534,709 59,016,568 65,178,726 82,557,975 114,175,559Claim as % of Gross Premium 13.38% 35.42% 16.72% 17.36% 15.27%
Summary of the Large Claims Paid from 2003 - 2007 (N’000)

17BGL Insurance Report | January 2010
Source: NIA’s Insurance Digest 2008, BGL Research
Robust Balance Sheet for Capacity and LiquidityMost players in the sector have recognised that the business of insurance is now that of the financially capable as large ticket transactions of the oil & gas sector, infrastruc-ture and power are the way to go. While the sector will rely greatly on regulatory support for impact in the retail segment, the above named sectors would provide quick wins. Robust capital base and balance sheet would be a deciding factor.
50,000,000
100,000,000
150,000,000
200,000,000
250,000,000
300,000,000
350,000,000
400,000,000
450,000,000
500,000,000
2003 2004 2005 2006 2007 2008E
Total Asset Shareholder's Fund
0
Source: NIA’s Insurance Digest 2008, BGL Research
Fire, 12.4%
Burglary Theft,
12.0%
Contractor All Risk,
32.0%
Fidelity Guarantee,
1.0%
Engineering,
3.0%
Motor,
7.4%
Personal Accident,
0.5%
Marine, 5.4%
Public Liability,
0.5%
Aviation, 0.6%
Oil, 1.2%
General
Accident, 6.6%
Miscellaneous,
0.8%
Life, 16.5%
Distribution of Claims by Business
Balance Sheet Size (N’000)
in preventing losses or reduction in the number of perils. However, it could also imply non-settlement of claims by insurers. Percentage of claims paid to gross premium declined from 35.42% in 2004 to 15.27% in 2007.
Of the claims paid, 32% was on contractors’ all risk insurance, 16.5% on life insur-ance and 12% apiece on fire and burglary insurance. To support industry experts’ request for a voluntary insurance environment, there is need for improved and more transparent loss recognition and claim settlement by the insurers.
18 BGL Insurance Report | January 2010
Source: Companies’ Annual Reports, BGL Research
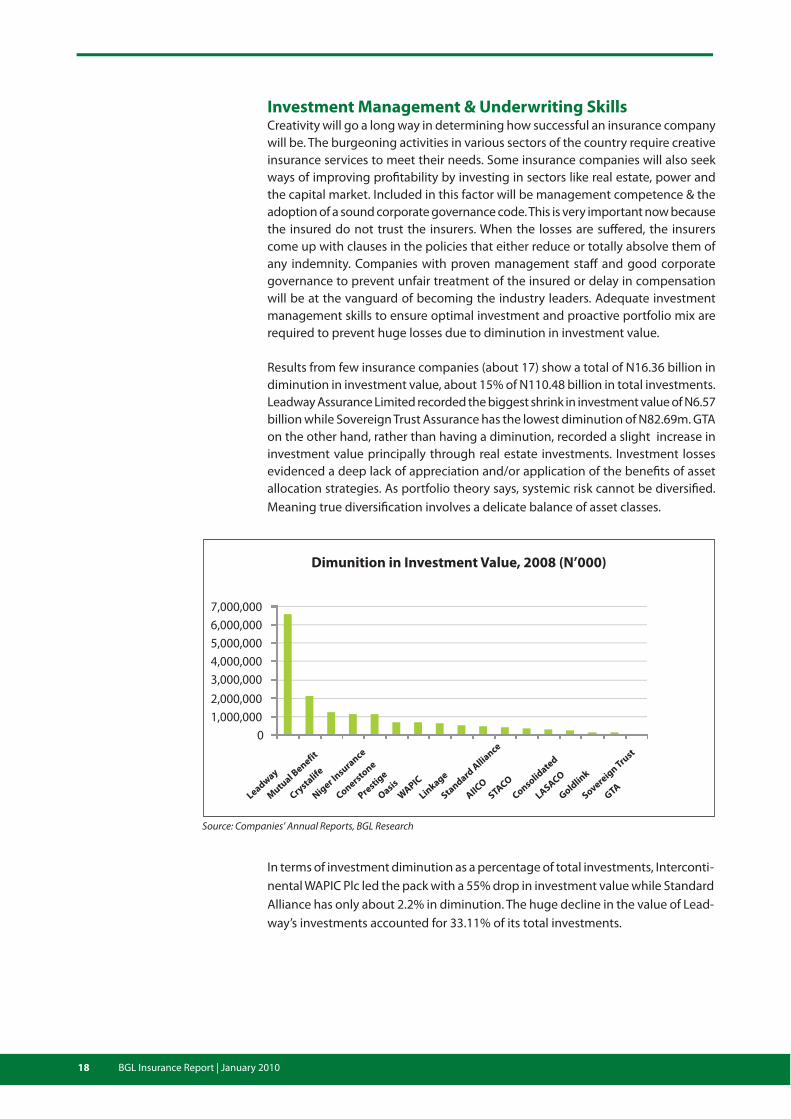
Investment Management & Underwriting SkillsCreativity will go a long way in determining how successful an insurance company will be. The burgeoning activities in various sectors of the country require creative insurance services to meet their needs. Some insurance companies will also seek ways of improving profitability by investing in sectors like real estate, power and the capital market. Included in this factor will be management competence & the adoption of a sound corporate governance code. This is very important now because the insured do not trust the insurers. When the losses are suffered, the insurers come up with clauses in the policies that either reduce or totally absolve them of any indemnity. Companies with proven management staff and good corporate governance to prevent unfair treatment of the insured or delay in compensation will be at the vanguard of becoming the industry leaders. Adequate investment management skills to ensure optimal investment and proactive portfolio mix are required to prevent huge losses due to diminution in investment value.
Results from few insurance companies (about 17) show a total of N16.36 billion in diminution in investment value, about 15% of N110.48 billion in total investments. Leadway Assurance Limited recorded the biggest shrink in investment value of N6.57 billion while Sovereign Trust Assurance has the lowest diminution of N82.69m. GTA on the other hand, rather than having a diminution, recorded a slight increase in investment value principally through real estate investments. Investment losses evidenced a deep lack of appreciation and/or application of the benefits of asset allocation strategies. As portfolio theory says, systemic risk cannot be diversified. Meaning true diversification involves a delicate balance of asset classes.
0
1,000,000
2,000,000
3,000,000
4,000,000
5,000,000
6,000,000
7,000,000
Leadway
Mutu
al Benefit
Crysta
life
Niger I
nsurance
Conersto
ne
Prestig
e
Oasis
WAPIC
Linkage
Standard
Alli
ance
AIICO
STACO
Consolidate
d
LASACO
Goldlin
k
Sovereig
nTru
st
GTA
Dimunition in Investment Value, 2008 (N’000)
In terms of investment diminution as a percentage of total investments, Interconti-nental WAPIC Plc led the pack with a 55% drop in investment value while Standard Alliance has only about 2.2% in diminution. The huge decline in the value of Lead-way’s investments accounted for 33.11% of its total investments.

19BGL Insurance Report | January 2010
0.00%
10.00%
20.00%
30.00%
40.00%
50.00%
60.00%
leadw
ay
Mutu
al Benefit
Crysta
life
Niger I
nsurance
Conersto
ne
Prestig
e
Oasis
Linkage
Standard
Alli
ance
AIICO
STACO
Consolidate
d
LASACO
Goldlin
k
Sovereig
nTru
st
GTAW
APIC
Source: Companies’ Annual Reports, BGL Research
TechnologyInsurance companies need to adopt appropriate technology to ease their operations. The business now requires greater customer focus; hence the drive for efficiency, speed and customer satisfaction. The retail strategy will require virtual branches where clients and prospects can access the services of the firm. Application forms for products/services and claims could be accessed through the internet. This brings about the need for online, real time transaction and claims processing, and the emergence of shared IT infrastructure and services. The sophistication of the risk management models and procedures needed to curb losses has also increased the need for technology utilisation.
Innovative ProductsIn addition to the traditional insurance products of motor, fire, burglary, general accident and life insurance, Nigerian insurers need to develop other innovative products to attract more clients. Some insurance companies are already churning out products with savings and investment features to complement existing insur-ance products.
The new oil & gas insurance business continues to contend with the traditional mainstay of the insurance business. Motor, general accident and marine insurance; hitherto accounting for about 70% of the industry’s business now account for about 54.1% while oil and gas now accounts for 13.3%. Although down from 18% of the industry’s business in 2006, oil & gas insurance still occupies third place behind motor (25.9%) and general accident (16.63%).
Diminution as a % of Total Investments

20 BGL Insurance Report | January 2010
Motor, 25.90%
Fire, 10.66%
General Accient,
16.63%
Marine &
Aviation,
11.56%
Workmen
Compensation,
1.01%
Miscellaneous,
8.03%
Oil & Gas, 13.33%Life, 12.88%
Source: NIA’s Insurance Digest 2008, BGL Research
Motor InsuranceMotor insurance business continues to dominate the sector with a market share of about 26%. The 16% CAGR in the last 10 years, now the highest level of growth, keeps it ahead of others. The growth of the business can be premised on the Nigerian traffic regulation which makes insurance (at least Third Party Insurance) compulsory for all motor vehicles driven in the country. While the law was out to protect losses suffered as a result of motor accidents hence the acceptance of Third Party Insurance as sufficient, comprehensive motor insurance policies are available to cover losses through theft and damages in addition to third party cover. Although the growth in the motor insurance business has been declining in recent years, the reform of the banking sector which opened doors for consumer lease financing made it possible for young Nigerians to acquire automobiles through lease finance. These facilities usually come with a requirement for comprehensive cover on the vehicles; thus leading to an unprecedented 47% growth in 2007 and its take over from fire business as the fastest growing.
-10%
0%
10%
20%
30%
40%
50%
60%
1997 1998 1999 2000 2001 2002 2003 2004 2005 2006 2007
Source: NIA’s Insurance Digest 2008, BGL Research
Contrubition to Gross Premium, 2007
Growth in Motor Insurance Business

21BGL Insurance Report | January 2010
General Accident InsuranceFrom an average contribution of 22% in the previous ten years, General Accident represented only 16.63% of Gross Premium income by 2007 after separating Work-men’s Compensation and miscellaneous insurance business from it. This class of business provides cover to individuals against miscellaneous risks including personal accident, public liability insurance against liability to the general public, burglary, fidelity guarantee and goods and cash in transit. It also covers risks like loss of profit, workmen’s compensation and professional indemnity. The growth in gross premium on general accident insurance has been erratic in the last ten years moving from a negative in 1999 to over 100% the following year before returning to negative growth in 2001. This staccato nature continued over the following years but in a more subtle manner. In spite of the surge in the oil and gas business, general accident insurance retained its second position in 2007 with percentage contribution of 16.63% and about 26% if taken together with workmen’s compen-sation and other miscellaneous insurance business. With the enforcement of the rule of law by the Federal Government, it is anticipated that more organisations and professional bodies will take insurance policies to cover risks that may arise in the course of doing business.
-40%
-20%
0%
20%
40%
60%
80%
100%
120%
1997 1998 1999 2000 2001 2002 2003 2004 2005 2006 2007
Source: NIA’s Insurance Digest 2008, BGL Research
Fire InsuranceWith a CAGR of 14.06%, Fire insurance has grown at a slower pace than motor insurance and life insurance within the last ten years, consistently contributing an average of 12% to the industry’s gross premium. The fire insurance business pro-vides cover to properties, usually buildings (and their contents) against damage by fire and other natural disasters like storms, floods, earthquakes and war strikes. It also covers arson and other losses related to the incidence of fire. As a result of poor enforcement of laws in the country, the potential in this class of business has remained largely untapped. When the law provides that all public buildings such as government buildings, schools, hospitals, churches, mosques and fuel stations should be insured, non-enforcement of the law remains the bane of growing the fire insurance business.
Growth in General Accident Insurance Business

22 BGL Insurance Report | January 2010
-5%
0%
5%
10%
15%
20%
25%
30%
35%
1997 1998 1999 2000 2001 2002 2003 2004 2005 2006 2007
Source: NIA’s Insurance Digest 2008, BGL Research
Marine, Aviation & Transit InsuranceThe historical forerunner of the classes of insurance business, contributing an average of over 26% to premium in the last ten years lost its leadership position to its key contender, motor insurance. Marine and Aviation insurance’s share of the industry premium declined significantly to 11.56% by 2007 (although an increase from 10% in 2006), below all other major classes of insurance. While it seems like the new oil and gas insurance business has taken up a significant share of the marine insurance business, the insurance class grew its business by about 44% in 2007. The class of business which covers losses of marine cargo, freight and loss of ship and aviation insurance contracts grew at a CAGR of 12.22% over the last ten years; well shy of the insurance sector’s CAGR of about 16%. Although this class of insurance is not backed by law, most transaction facilitators like financial institu-tions and port officials require marine insurance as part of the pre-requisites for financing and allowing imported goods to come into the country.
-100%
-50%
0%
50%
100%
150%
1997 1998 1999 2000 2001 2002 2003 2004 2005 2006 2007
Source: NIA’s Insurance Digest 2008, BGL Research
Growth in Marine, Aviation & Transit Insurance Business
Growth in Fire Insurance Business
23BGL Insurance Report | January 2010
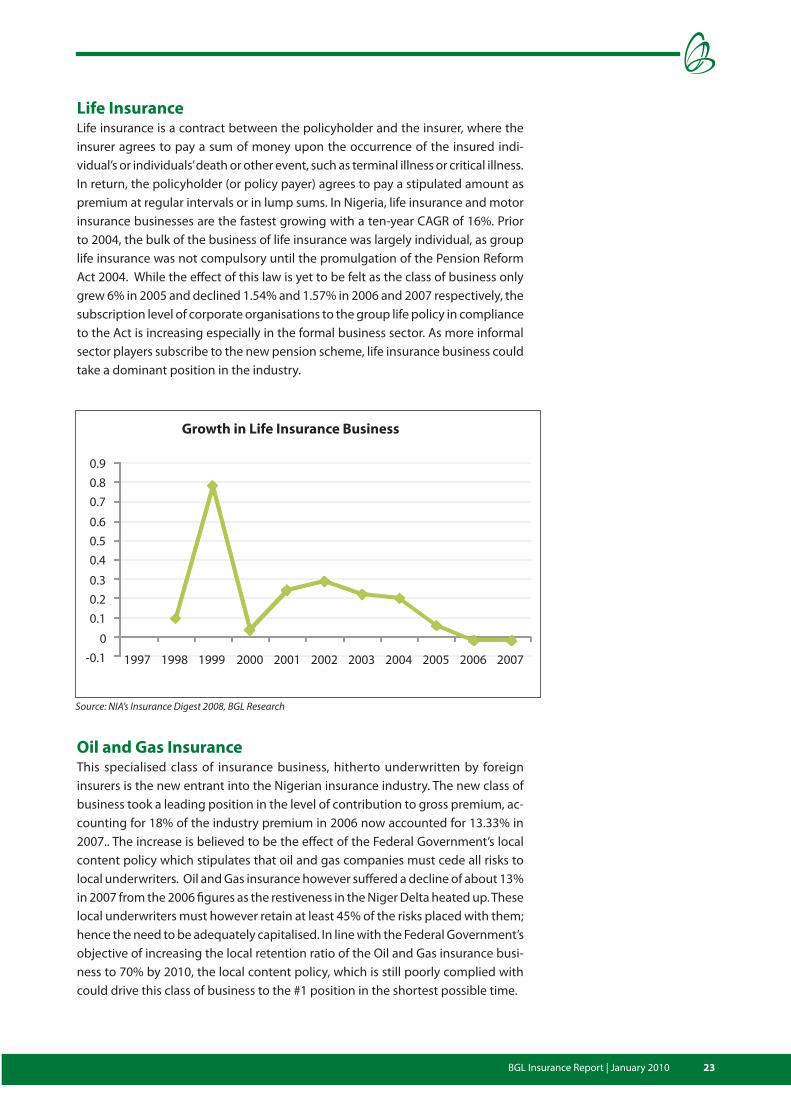
Life InsuranceLife insurance is a contract between the policyholder and the insurer, where the insurer agrees to pay a sum of money upon the occurrence of the insured indi-vidual’s or individuals’ death or other event, such as terminal illness or critical illness. In return, the policyholder (or policy payer) agrees to pay a stipulated amount as premium at regular intervals or in lump sums. In Nigeria, life insurance and motor insurance businesses are the fastest growing with a ten-year CAGR of 16%. Prior to 2004, the bulk of the business of life insurance was largely individual, as group life insurance was not compulsory until the promulgation of the Pension Reform Act 2004. While the effect of this law is yet to be felt as the class of business only grew 6% in 2005 and declined 1.54% and 1.57% in 2006 and 2007 respectively, the subscription level of corporate organisations to the group life policy in compliance to the Act is increasing especially in the formal business sector. As more informal sector players subscribe to the new pension scheme, life insurance business could take a dominant position in the industry.
-0.1
0
0.1
0.2
0.3
0.4
0.5
0.6
0.7
0.8
0.9
1997 1998 1999 2000 2001 2002 2003 2004 2005 2006 2007
Source: NIA’s Insurance Digest 2008, BGL Research
Oil and Gas InsuranceThis specialised class of insurance business, hitherto underwritten by foreign insurers is the new entrant into the Nigerian insurance industry. The new class of business took a leading position in the level of contribution to gross premium, ac-counting for 18% of the industry premium in 2006 now accounted for 13.33% in 2007.. The increase is believed to be the effect of the Federal Government’s local content policy which stipulates that oil and gas companies must cede all risks to local underwriters. Oil and Gas insurance however suffered a decline of about 13% in 2007 from the 2006 figures as the restiveness in the Niger Delta heated up. These local underwriters must however retain at least 45% of the risks placed with them; hence the need to be adequately capitalised. In line with the Federal Government’s objective of increasing the local retention ratio of the Oil and Gas insurance busi-ness to 70% by 2010, the local content policy, which is still poorly complied with could drive this class of business to the #1 position in the shortest possible time.
Growth in Life Insurance Business
24 BGL Insurance Report | January 2010
Views of Industry Experts
For the industry to deliver on its potential, industry experts believe in certain expec-tations for the industry. According to Funmi Babington-Ashaye, a veteran industry expert and former CEO of Cornerstone Insurance Plc, in her article on the Nigerian Insurance Industry, the expectation for the industry includes further consolidation through market-driven mergers, improved product offerings, improved regulation, micro-insurance and appropriate premium.
Market-Driven MergersIn 2010, we expect to see some market induced mergers in an effort by the insurers to brace up to the challenge of providing cover for players in the oil and gas sector and other critical aspects of the economy. Indeed, since the completion of the first phase of the regulation-induced consolidation exercise, many commentators have continued to wonder when the next phase of restructuring in the industry will com-mence and if the industry has reached its Promised Land with the recent fixing of the minimum capital base of insurers. Setting the minimum level of capitalisation which the government through its regulatory agency, National Insurance Com-mission (the NAICOM), has embraced, is one strategy for enhancing the capacity of the insurer to meet the needs of the insured. Given the dynamics of the envi-ronment, we strongly believe that such a review cannot be a one-off initiative; it must be regularly but reasonably done to align the insurers’ capacity with growing demand for insurance services and business risks. It is in line with this reasoning that we expect the developments in the market to induce further consolidation with synergistic effects. As the economy develops, the need for insurance services will necessarily increase. Only mega insurance companies with the right capital and personnel can play this role. Thus, we desire an industry that is solvent enough to respond to the needs of policyholders in terms of prompt payment of claims and able to contribute meaningfully to the economic development process. Such an industry must be well capitalised to play in the global market. To accomplish this, the solvency of the insurer must be measured and monitored by the government to ensure the protection of the insured.
Improved Product OfferingsThe Insurance practitioners must deliberately strive to identify the needs of their consumers, plan products that will adequately meet those needs, properly price, promote and distribute those products such that both parties will mutually benefit from the process. In other words, the insurer must translate not only the customers’ needs into product and service requirements but also must deliver the products at competitive rates with the right quality. Insurers should therefore not underestimate the importance of product features and strategy even as they pursue their distribu-tion networks in 2010. Especially significant is the need to innovate as conditions change and to service unmet demands or segments.
Without doubts, therefore, we desire an industry with adequate capacity and
Nigeria requires a solvent insurance industry to respond to the needs of policyholders in terms of prompt payment of claims and to contribute meaningfully to the economic development process

25BGL Insurance Report | January 2010
expertise to manage complex business transactions as they emerge in this increas-ingly globalised world. In other words, in 2010, we expect an insurance industry whose product portfolio allows the insurers to serve as many target customers as possible while responding quickly to the changing needs of the market. To achieve this status, the product offerings must be aligned with the insurer’s broad value proposition and strategic direction.
Charging Adequate PremiumThe focus of the insurance industry in 2010 should be towards ensuring that companies charge adequate premium that is commensurate with the risk they are insuring. The issue of charging adequate premium is very crucial at this point because insurance companies must be very liquid in view of the large amount of premium and capital that is already locked-up in the stock market. Furthermore, the probability of insurance companies earning high investment income from the stock market is very low unless there is tremendous improvement in the stock market. The regulatory authorities must also come together to fashion a way forward in this regard in the overall interest of the insurance industry in Nigeria. The Insurance Industry must be able to speak with one voice for once on a crucial matter of common interest that is capable of destroying the insurance industry. It is envisaged that with market-induced consolidation and mergers of insurance companies, companies will be increasingly able to work together as a team towards charging adequate premiums that will be commensurate with the risks insurance companies are carrying.
Micro-InsuranceAs part of its efforts to empower more Nigerians, the government through the Central Bank of Nigeria (CBN), has licensed over 800 Micro-finance banks that are currently providing credit facilities to players in the informal sector. This fledgling sector holds a lot of business opportunities for insurers as they can provide insur-ance cover to these small investors at very low rates. This will encourage these budding entrepreneurs and their financiers to take more informed risks. Thus, in 2010, we expect to see more activities in this untapped but potentially viable sec-tor of the economy.
RegulationWe expect the oversight functions of the regulatory authorities to expand in 2010 to include the verification of the exact worth of shareholders’ funds of insurers in the market. It is imperative that the capacity of the insurer to underwrite policies is unimpaired by losses and sharp practices of persons in governance responsibilities. Secondly, given the growing spate of receivables in the industry, it should be easy to appreciate the need for the regulatory authorities to regularly visit insurance companies and insurance brokers to ensure compliance to the rule on remittance of premiums. The full weight of the law should be brought to bear on deviants as a deterrent to others. The monitoring unit of NAICOM should see this as a clarion call to sanitise the insurance business. Besides, it might be necessary to encourage insurance companies to report on their level of solvency particularly as it relates to the age analysis of their receivables. Such an age analysis should be stated in weeks and/or months to facilitate regulatory oversight. The maxim that “the longer the credit, the bigger the risk” is a truism because the longer the debt is outstanding, the harder it will become for insurers to collect.
Insurers must translate not only the customers’ needs into product and service requirements but also deliver the products at competitive rates without jeopardising quality
Regulators should ensure that the capacity of the insurers to underwrite policies is unimpaired by losses and sharp practices of persons in governance responsibilities

26 BGL Insurance Report | January 2010
Above all, regulators should encourage insurance companies to strengthen their credit control departments with appropriate and aggressive professionals who can effectively track and collect receivables from intermediaries. Furthermore, invest-ment in Information Technology (IT) will also assist Insurance companies in having error free statements of account. If the objective of credit management is to have the highest possible volume of outstanding debt for the shortest possible time commensurate with increasing credit sales and the availability of funds to finance them, it should be obvious that the control and management of this important asset should be in the hands of someone fully qualified for the job.
Finally, Babington-Ashaye believes that there would be increased activities in the sec-tor if government’s planned capital expenditure of over N1.8 trillion on infrastructural development is anything to go by. She also expresses the optimism that economic activities will accelerate with positive impact on the insurance sub-sector after the passage of the 2010 appropriation bill by the National Assembly. She however ad-vocates an increase in regulatory oversight both to check the insolvency of insurers as well as remittances of premium by insurance brokers. Given the peculiarity of the Nigerian economy and the dearth of appropriate human capital to manage the sec-tor, there might be need to limit the level of risk exposure of insurance companies, by setting it on, say, multiples of equity capital. Besides, resource managers must be careful about their investment decisions and avoid speculative investment in complex financial transactions. They must learn to intelligently invest their premium incomes which are receivables in less risky and secured investment instruments.
Above all, she recommends that greater premium should be placed on human capital development, compliance to best practices and principles of corporate governance as well as the development of insurance and actuarial standards particularly as we strive to lay the foundation for the achievement of VISION 2020.
Interview with Wole OshinIn his exclusive interview with BGL Research, Wole Oshin, the Chairman of the Nige-rian Insurance Association (NIA) and the CEO of Custodian and Allied Insurance Plc, said that: “financial performance by insurance firms has been more controlled than it would have been because of NAICOM’s prescient insistence on “Mark-to-Market” accounting for December 2008. This has doubtlessly shaded the posted results for this period, but it means the results are a fair representation of things going for-ward. The 2008 accounts in effect brought “reality” early to bear on the situation. Furthermore, the specific composition of investments also mean that risk is much more controlled compared to bank’s debt investment portfolios and investment bank’s practices. As it is, the number one source of investment risk amongst insur-ance companies is the current volatility of the capital market.”
“Operationally, as economic growth has thinned out, we see moral uncertainty creep in amongst the insured clients. More risks are emerging in the market due to Social Issues. Increasingly, fraudulent claims are made; arson is perpetrated to obtain fire insurance; etc. Moral Hazards are creeping into the insurance space and an added sense of tension means for instance that people file claims through lawyers (in other words, expecting a situation of opposition as they file).”“Despite these challenges, insurance businessmen in this market anticipate sus-tained growth as we are largely insulated in our space. This is typical of the core
Financial performance by insurance firms has been more controlled than it would have been because of NAICOM’s prescient insistence on “Mark-to-Market” accounting for December 2008
Insurance firms will have to depend on gifted market experts who recognise sustainable value, identify market cycles and apply analytical science to their intuition and experience.
27BGL Insurance Report | January 2010
insurance practice worldwide- for instance AIG’s insurance practice was fine, it was its dodgy investment decisions that threatened the giant firm and indeed the whole global financial system. By nature, insurance practitioners are themselves risk managers. The crux of practice going forward is found in the question “what do you invest in going forward?” To answer this question, insurance firms will have to depend on gifted market experts who recognise sustainable value, identify market cycles and apply analytical science to their intuition and experience. As it stands, only our modest money market offers steady investment income.On the other side of the equation (the immediate prospects for increased premiums) oil & gas’s local content policies continue to offer more business for Nigerian firms. More long-term growth is tied to macroeconomic development. In order for this to happen, we need to establish a proper credit economy. Multinationals need the credit for continuous growth; retail customers need leases and hire-purchase access.”
“My personal prognosis for Nigerian economic growth was for the rates enjoyed before the global crisis to be resumed in the first quarter of 2010. Now however, it is obvious that economic growth will only be accelerated when the broad-based development measures are seriously undertaken by governments in a concerted effort. In other words, resumption of these growth-rates is not time based, it is policy based. The synchronisation of measures is vital; for instance, when the Americans sought to plug the holes in their financial system, they focused attention on the (threatened) ramifications of the alarming financial gaps for the economy- not for their own sake.”
“We are lucky in our sector to have a good regulator which has worked on capac-ity building and (as I mentioned earlier regarding mark-to-market) adoption of International Best Practices. One of NAICOM’s most interesting new measures concerns the planned adoption of a framework based on Solvency II between 2010/2011: the updated set of regulatory requirements originally drawn up for insurance firms that operate in the European Union. Solvency II will be based on economic principles for the measurement of assets and liabilities. It will also be a risk-based system as risk will be measured on consistent principles and capital requirements will depend directly on this. While the Solvency I directive was aimed at revising and updating the Solvency regime, Solvency II has a much wider scope, including capital-adequacy standards specified for nature of insurance business (Life, Automobile, etc).”
“Insurance business has an important role in infrastructure development. As a premise it must be explained that for me personally, the insurance universe in-cludes Health Maintenance Organisations (HMOs) and the fast-growing pensions subsector. When I say this in public pronouncements, I often get an (amusingly) vehement rejection of the notion by practitioners in those fields, but deep down inside, they know I’m correct. These sub-sectors will naturally converge in the years to come anyway. So, if you add the size of HMOs with pension’s monies and the current insurance capacity, you see that the analysis of Premium/GDP that makes us seem puny when considering investment in areas like infrastructure is flawed. When you take the “proper” size into consideration our sector is closer to the size of the South African sector, which is actively involved in the development of its own infrastructure via long-term investments.”
Obviously economic growth will only be accelerated when the broad-based development measures are seriously undertaken by governments in a concerted effort
The proper size of the industry includes the HMOs and the pension subsector. When taken together, Nigerian insurance sector has enough investible funds to participate in infrastructure developments.

28 BGL Insurance Report | January 2010
“At NIA, we are driving toward self-regulation. By December we hope to have completed “Independent Market Agreements” to frame this drive to bring insured and insurers together and mollify dispute via an arbitration panel chaired by a respected retired judge. Insurance practitioners also recognise that continuous education and awareness of the insurance public is crucial (in this regard, some insurance companies decided to take on the expense and effort of running the ongoing radio/television adverts on the benefits of insurance. We note the absence of such public-facing bodies in other sectors, making us innovators.”
“Insurance is not like banking. Ethics are arguably higher-regarded. I remember during the boom, we were often termed “slow” when compared to high-flying speculators; however, we are now more or less vindicated. Our business depends on trust. We compete, but only with regard for risk. The catch-phrase is that “risks are transparent”; hence the often collaborated insurance mandates. Banks which rushed at the insurance space (after they raised capital) will doubtlessly pullout as market realities shake them. Besides, the conflict of interest issues thrown up by the fact that the credit source would also be responsible for insurance cover are dangerous. The explosion of credit in this regard would lead to implosion of long-term wealth.
Banks that rushed to the insurance space after consolidation will doubtlessly pullout as market realities shake them

29BGL Insurance Report | January 2010
Nigerian insurance companies have suffered significant losses from the current financial crisis particularly due to mark-to-market principle accounting adopted for 2008. Although falling stock prices resulted in a huge decline in investment value, there are still opportunities for investment in cheap equities, fixed income instruments, real estate, private equity and commodities. In addition, there are other investment opportunities for the insurers in other sectors of the economy. Examples of these investment opportunities are as follows:
Investment in Infrastructure: Nigeria’s huge infrastructural deficit in power, housing, roads, healthcare, and port services e.t.c. also opens up interesting invest-ment outlets for custodians of long terms funds. The government’s recent drive at concessioning public infrastructure hitherto a social overhead undertaken only by the State will lead to more private investments in infrastructure. We believe the government can encourage an investment drive in infrastructure through the proper fiscal initiatives like tax rebates and the necessary legislations.
Local Content Initiative in the Oil & Gas Sector: The Nigerian government set a target of 40% by 2007 and 70% by 2010 for local content in the oil and gas industry. Difficulties in meeting past targets is due to the capacity problems of local insurance corporates, hence insurance underwriting in the oil and gas sector is still largely being undertaken by foreign underwriters. Outside capacity issues, there have been ambiguities in the interpretation as to what constitutes the local capacity. However, for local insurance corporates to adequately benefit from the local content policy, all ambiguities in the statutes need to be properly interpreted and adhered to. The insurance firms need to also boost their capacity not only to underwrite oil and gas deals but also other large ticket transactions.
Convergence of Pension Industry and Health Management Organisations (HMO): With the insurance and pension sectors both playing the role of mobilis-ing long-term capital in the economy and now the fast growing HMOs providing health insurance, a proper convergence of these three sub-sectors will be impera-tive in the near future. This model has been adopted successfully in other emerging economies like Chile and South Africa. This will provide insurance companies with deeper financial capacity to play in long-term infrastructure deals like their global peers. Health Insurance in Nigeria, in particular, in terms of penetration could be described as relatively unscathed.
Investors in the sector could take advantage of cheap prices of equity stocks as most insurance stocks now trade at norminal value, or well-structured fixed income instruments for risk-averse investors. Investment in savings and investment products in insurance companies would also be rewarding.
Investment Opportunities in the Insurance Sector
30 BGL Insurance Report | January 2010
AIICO Insurance Plc
Cornerstone Insurance Plc
Crystalife Insurance Company Limited
Custodian & Allied Insurance Plc
Goldlink Insurance Plc
Guaranty Trust Assurance Plc
Intercontinental WAPIC Insurance Plc
LASACO Insurance Plc
Leadway Assurance Company Limited
Mutual Benefits Insurance Plc
Niger Insurance Plc
Oasis Insurance Plc
Prestige Insurance Plc
Sovereign Trust Insurance Plc
Standard Alliance Insurance Plc
STACO Insurance Plc
Featured Companies

31BGL Insurance Report | January 2010
AIICO Insurance Plc
Company ProfileThe company was established in 1963 and became a private limited liability com-pany on 14th July 1970. It was converted to a public limited liability company on 17th July 1989 and was listed on The Nigerian Stock Exchange on the 3rd of December 1990.
AIICO provides Life insurance services and also general insurance business of Fire, Workmen’s Compensation, Marine, Motor, Personal Accident, Contractors’ All Risks and Casualty through its subsidiary AIICO General Insurance Company Limited. Citing the declining purchasing power of the average Nigerian individual, the company focused on General Insurance in the new millennium, with the business accounting for more than 50% of total Gross Premiums in the pre-consolidation era. The company has also tried to focus on providing policies to a growing middle-class of professionals and others with similar high purchasing power.
AIICO commenced operations in Nigeria as an agency office of American Life Insur-ance Company (ALICO), USA in 1963. In 1970, ALICO was granted an operational licence in Nigeria as a company and a full subsidiary of its parent company to offer Life and Pension products. Following the Indigenisation Decree, 60% of ALICO was acquired by the Federal Government of Nigeria, and it became American Interna-tional Insurance Company Limited (AIICO). It converted to a public liability company in 1989. The Federal Government of Nigeria subsequently divested its 60% holding in the company while ALICO retained its 40% interest. During consolidation, AIICO absorbed two smaller industry players (NFI Insurance and Lamada Insurance– which ranked about 25% and 4% respectively of AIICO’s pre-consolidation business-size in terms of Gross Premiums. The company maintains its technical alliance with its shareholder, AIICO Bahamas limited which has 12% equity in the firm as at 2008 serving as an offshore vehicle as it struggled to cope with twin threats of sluggish industry growth and fierce competition.
Aiico Bahamas
Limited
12%
Others
88%
Shareholding Structure

32 BGL Insurance Report | January 2010
Name Position Shareholding
Chief (Dr) O. Fajemirokun Chairman 510,067,945
Mr S.D.A. Sobanjo Managing Director/CEO 534,916
Mr O.S. Oyedokun Executive Director 265,416
Mr. E.U. Egejuru Executive Director 558,003
Prince (Dr.) O. Akenzua, JP 1,461,442
Chief R.A. Gbadamosi OFR 2,152,161
Chief Eugene Okwor 1,029,166
Mr. Haresh Vaswani
Senator Tokunbo Ogunbanjo 1,547,866
Mr. Deji Akinyanju
Performance AnalysisAIICO should be one of the major beneficiaries of consolidation, seeing as its Capital Adequacy was relatively low compared to the industry peer like Intercontinental WAPIC but better than that of Niger Insurance. Its Equity/Assets ratio of 0.61 is higher than the 0.30 for Niger but lower than WAPIC’s 67%. Profitability ratios trended upwards in 2008, with ratios such as Return on Average Assets which stood at 5% in 2007 up to 6.04%, Return on Equity at 3.72% in 2008 was just 2.81% in 2007 and Earnings per share at 8.96kobo, a slight increase from 8.13 kobo. As it turned out, the spate of capital raising lowered AIICO’s leverage to approximately 40% in 2008 from 50% in 2007 implying an ease in debt exposure.Gross Premium for 2008 was N7.47 billion a rise of 59.62% from the 2007 figure of N4.68 billion, its Premium earned per Gross premium stood at 93.28% a growthof approximately 6.68% from 2007, claims however also increased in 2008 by 33.14%
Board of Directors
Perfomance Ratios (Margin) 2004 2005 2006 2007 2008Change in Gross premium 24.42% -19.85% 3.37% 54.29% 59.85%Net Premium Margin 85.99% 77.54% 84.95% 87.44% 93.28%Premium Earned/Gross Premium 85.99% 77.54% 84.95% 87.44% 93.28%Claims incurred/Gross Premium 51.75% 19.95% 28.37% 34.37% 28.78%Underwriting Profit Margin 22.37% 37.04% 36.57% 29.25% 35.68%Cost to Income Ratio 0.42 0.52 0.43 0.35 0.31Pretax Profit Margin 2.04% 2.97% 11.51% -4.00% 21.04%ROAE 2.58% 2.26% 9.54% 5.00% 6.64%ROAA 0.80% 0.80% 4.98% 2.81% 3.72%EPS 0.21 0.12 0.36 0.16 0.18DPS 0.00 0.00 0.00 0.00 0.00
Financial Ratios
Asset Quality Ratios 2004 2005 2006 2007 2008
Investment Income/Investments 14.35% 3.33% 8.68% 9.03% 15.27%
Effective Return on Investment 14.35% 3.04% 7.80% -1.87% 8.01%
Cost of Bad and Doubtful Loans 0.00% 1.42% 3.87% 37.25% 43.73%
Capital Adequacy Ratios 2004 2005 2006 2007 2008
Gross Premium/Insurance Funds 0.68 2.16 2.02 2.42 2.62
Debt/Equity Ratio 2.26 1.51 0.48 1.06 0.65
Equity/Total Assets 0.31 0.40 0.67 0.49 0.61

33BGL Insurance Report | January 2010
0 5,000,000 10,000,000 15,000,000
2003
2004
2005
2006
2007
2008
N'000
Shareholders' Fund
Stock Market AnalysisAIICO’s price trend reflects the spike in values observed in 2007 and into the early part of 2008 as post-consolidation and speculative trades pushed prices upwards. However, the extensive economic crisis has seen the company along with other insurance participants badly beaten and a downward spiral mirroring the market has been the fate of AIICO in recent months.
Business Prospect2010 could be a very interesting year for the insurance industry due to the proposed 70% local content implementation in the Nigerian Oil & Gas industry even more so for AIICO Plc who potentially may be the biggest beneficiary having an ex-director of the firm as the sitting Federal Minister of Energy. As the company seeks to harness its strength of market penetration in the post-consolidation period, an obvious target for AIICO would be to become the number one player in Nigeria’s insurance sector.
0 2,000,000 4,000,000 6,000,000 8,000,000
2003
2004
2005
2006
2007
2008
N'000
Gross Premium
to N2.15 billion. It is notable that AIICO’s performance has consistently improved since 2006 after poor performance in 2004 and 2005.
0
20
40
60
80
100
120
Price v Index (% Change 2009)
NSE Index Price
05-Jan-0
9
05-Feb-0
9
05-Mar-0
9
05-Apr-0
9
05-May-0
9
05-Jun-0
9
05-Jul-0
9
05-Aug-0
9
05-Sep-0
9
05-Oct
-09
05-Nov-0
9
05-Dec-
09
Price v Index (% Change 2009)
Business StrategyLike its counterparts at the top of insurance value-chain, AIICO has a chance to leverage on its brand, reach and experience to lead the sub-sector into a bigger and brighter future. In a country with Premium/GDP< 1%, the market remains open to whichever firm can create products which harness latent investible funds and similarly takes on exciting investment opportunities.

34 BGL Insurance Report | January 2010
Company ProfileCornerstone Insurance Plc was incorporated on 26 July 1991 as a private limited liability company. It claims a niche for a progressive insurance company, offering services in line with modern realities. At inception, the company was registered to the standard raft of Insurance business including: Fire, Accident, Motor vehicle, Work-men’s Compensation, Goods-In–Transit, Marine, Aviation, Oil and Gas, Contractors-All-Risk, and Engineering-All-Risk. In view of the Company’s expanding capacity and technical ability, it was licensed in December 1999 to carry out Life Assurance business. The company thus became a Composite Insurance Underwriter and strives to implement a qualitative-controlled system of operations.
As it approaches two decades of existence, Cornerstone Insurance Plc has performed relatively well, winning the coveted Nigerian Insurers Association’s Distinguished Insurer Award in 1997 and the National Insurance Commission’s Award for Devel-opment of New Products in 1999. In 2002, it also won the Nigerian Stock Exchange President’s Merit Award in the Insurance sector for best presentation, quality and depth of its annual report and accounts for the year 2001. The company was also rated ‘C’ Adequate by the African Insurance Organisation [AIO], the continental body of all Insurance companies in Africa making it an AIO-Adequate Insurance company (the first to be so rated in Nigeria). The rating was conducted by Standard and Poor’s, advisors to the AIO Credit Assessment Committee with the support of the United Nations Conference for Trade and Development [UNCTAD] on the basis of assessing the credit strength of AIO members.
Proceeds from its mid-2006 (pre-consolidation) offer were earmarked for the cor-porate transformation and business diversification required to enable Cornerstone Insurance attain its desired goal of leading the insurance industry. Cornerstone’s management is positioned to transform the company’s processes by optimising its IT infrastructure and restructuring operations. Furthermore it announced plans to diversify its core business and invest in commercial real estate in Lagos and Abuja in a strategy aimed at strengthening its asset and investment management division for enhanced returns.
Cornerstone has enjoyed appreciable organic growth over the last 5 years, with Total Balance Sheet size rising 500% to almost N9 billion and Gross Premiums nearing N4 billion in December 2008 (as against N1.2 billion in 2003). This growth has however been tinged with volatility in the last two years as the firm struggles to come to terms with an increasingly complex and competitive market (amidst the advent of Health Insurance Purveyors and – more tellingly – Pension Fund Administrators). The complexity was of course deepened by the regulation-driven bouts of Con-solidation and Capital Raising that emerged in 2007/2008. Added to these was of course the meltdown in equity-market prices. This situation threw up challenges that meant in 2008 Cornerstone was unable to pay a dividend for the first time in more than 6 years, whilst a pre-tax loss of over N400m exacerbated the negative General Reserves to -N1.4 billion.
Cornerstone Insurance Plc
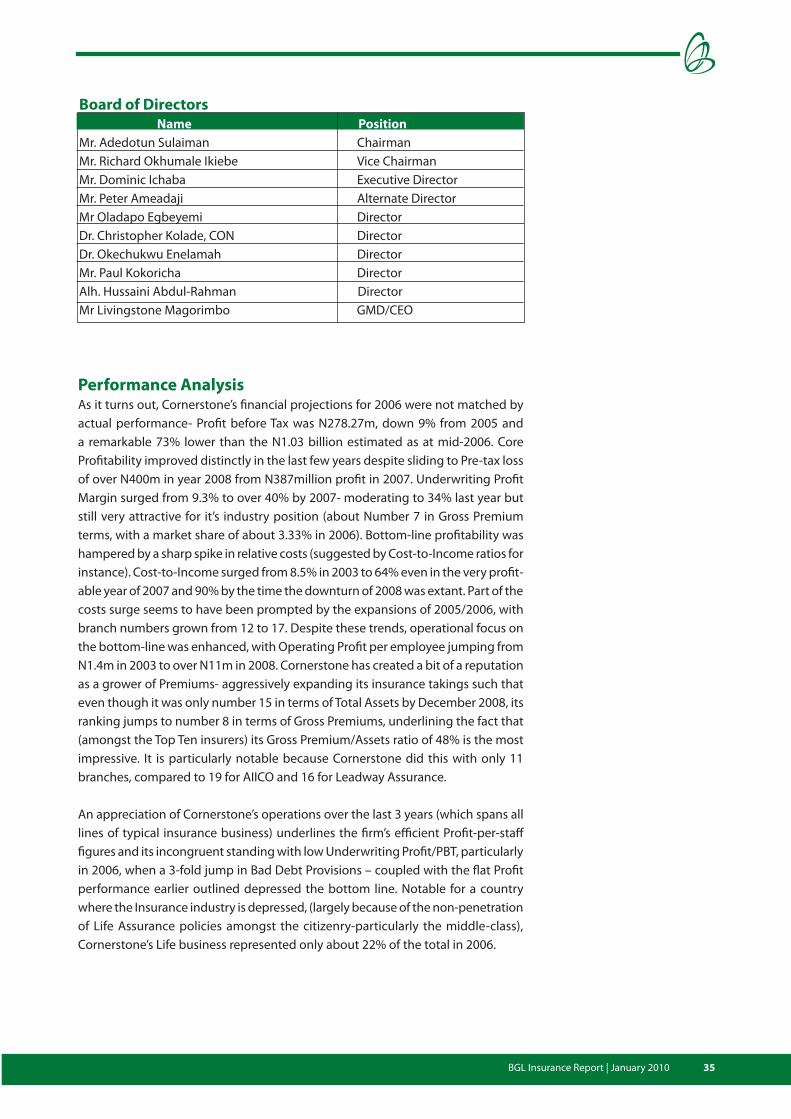
35BGL Insurance Report | January 2010
Board of Directors Name PositionMr. Adedotun Sulaiman ChairmanMr. Richard Okhumale Ikiebe Vice ChairmanMr. Dominic Ichaba Executive DirectorMr. Peter Ameadaji Alternate DirectorMr Oladapo Egbeyemi DirectorDr. Christopher Kolade, CON DirectorDr. Okechukwu Enelamah DirectorMr. Paul Kokoricha DirectorAlh. Hussaini Abdul-Rahman DirectorMr Livingstone Magorimbo GMD/CEO
Performance AnalysisAs it turns out, Cornerstone’s financial projections for 2006 were not matched by actual performance- Profit before Tax was N278.27m, down 9% from 2005 and a remarkable 73% lower than the N1.03 billion estimated as at mid-2006. Core Profitability improved distinctly in the last few years despite sliding to Pre-tax loss of over N400m in year 2008 from N387million profit in 2007. Underwriting Profit Margin surged from 9.3% to over 40% by 2007- moderating to 34% last year but still very attractive for it’s industry position (about Number 7 in Gross Premium terms, with a market share of about 3.33% in 2006). Bottom-line profitability was hampered by a sharp spike in relative costs (suggested by Cost-to-Income ratios for instance). Cost-to-Income surged from 8.5% in 2003 to 64% even in the very profit-able year of 2007 and 90% by the time the downturn of 2008 was extant. Part of the costs surge seems to have been prompted by the expansions of 2005/2006, with branch numbers grown from 12 to 17. Despite these trends, operational focus on the bottom-line was enhanced, with Operating Profit per employee jumping from N1.4m in 2003 to over N11m in 2008. Cornerstone has created a bit of a reputation as a grower of Premiums- aggressively expanding its insurance takings such that even though it was only number 15 in terms of Total Assets by December 2008, its ranking jumps to number 8 in terms of Gross Premiums, underlining the fact that (amongst the Top Ten insurers) its Gross Premium/Assets ratio of 48% is the most impressive. It is particularly notable because Cornerstone did this with only 11 branches, compared to 19 for AIICO and 16 for Leadway Assurance.
An appreciation of Cornerstone’s operations over the last 3 years (which spans all lines of typical insurance business) underlines the firm’s efficient Profit-per-staff figures and its incongruent standing with low Underwriting Profit/PBT, particularly in 2006, when a 3-fold jump in Bad Debt Provisions – coupled with the flat Profit performance earlier outlined depressed the bottom line. Notable for a country where the Insurance industry is depressed, (largely because of the non-penetration of Life Assurance policies amongst the citizenry-particularly the middle-class), Cornerstone’s Life business represented only about 22% of the total in 2006.

36 BGL Insurance Report | January 2010
Examining Top-line growth, Cornerstone has seen Gross Premiums up an average of 30% annually between 2004 and 2008 boosted by the spike in activity during 2006. The year 2006 was a stand out for the firm’s marketing efforts, with turnover up 77%. However, annual average growth apart from 2006 is still encouraging at 16.5% per annum. Net Premium margins of close to 80% continue to beat industry average of under 70% as Cornerstone continues to moderate outward accruals of premiums to reinsurers (thus retaining value), but having to deal with broader risk. This exposure is perhaps described best by the increase in the ratio of Claims Incurred-to-Gross Premium from a low of under 17% in 2005 to almost 25% in 2008.
As noted, Cornerstone’s strong premium-growing operation up to 2006 was evi-dent when compared to the Industry Average of 32.1%. The subsequent dearth of profitability was however revealed in the low Pre-tax Profit Margins (barely half of the Industry Average), which will not have been helped by the 175% surge in Bad Debt provision in the period to December 2006.
Financial Ratios
Performance Ratios (Margin) 2004 2005 2006 2007 2008
Change in Gross Premium 22.32% 7.13% 71.43% 1.34% 37.34%
Net Premium Margin 82.86% 77.22% 72.65% 86.49% 77.20%
Premium Earned/Gross Premium 78.40% 77.22% 68.37% 79.98% 70.88%
Claims incurred/Gross Premium 20.06% 0.00% 22.52% 23.94% 24.38%
Underwriting Profit Margin 36.79% 27.16% 33.82% 42.94% 33.73%
Cost to Income Ratio 0.66 0.15 0.70 0.64 0.89
Pre-tax Profit Margin 16.13% 19.01% 8.47% 13.93% -11.34%
ROAE 17.06% 14.39% 4.75% 6.19% -6.83%
ROAA 8.22% 6.98% 2.74% 4.27% -4.76%
EPS 0.16 0.11 0.03 0.04 -0.05
DPS -0.13 -0.05 -0.04 0.00 0.00
Asset Quality Ratios 2004 2005 2006 2007 2008
Investment Income/Investments 4.99% 5.75% 7.11% 8.19% 16.44%
Effective Return on Investment 4.13% 3.06% 3.21% 1.53% -0.11%
Cost of Bad and Doubtful Loans 0.00% 6.02% 8.50% 43.19% 15.95%
Capital Adequacy Ratios 2004 2005 2006 2007 2008
Gross Premium/Insurance Funds 3.09 4.53 7.42 4.42 4.06
Debt/Equity Ratio 1.04 1.08 0.60 0.36 0.52
Equity/Total Assets 0.49 0.48 0.62 0.73 0.66
0
N'000
2,000,0001,000,000 3,000,000 4,000,000 5,000,000
2004
2005
2006
2007
2008
Gross Premium
Gross Premium Shareholders’ Fund
Shareholders’ Fund
2004
2005
2006
2007
2008
0
N'000
2,000,0001,000,000 3,000,000 4,000,000 5,000,000 6,000,000 7,000,000
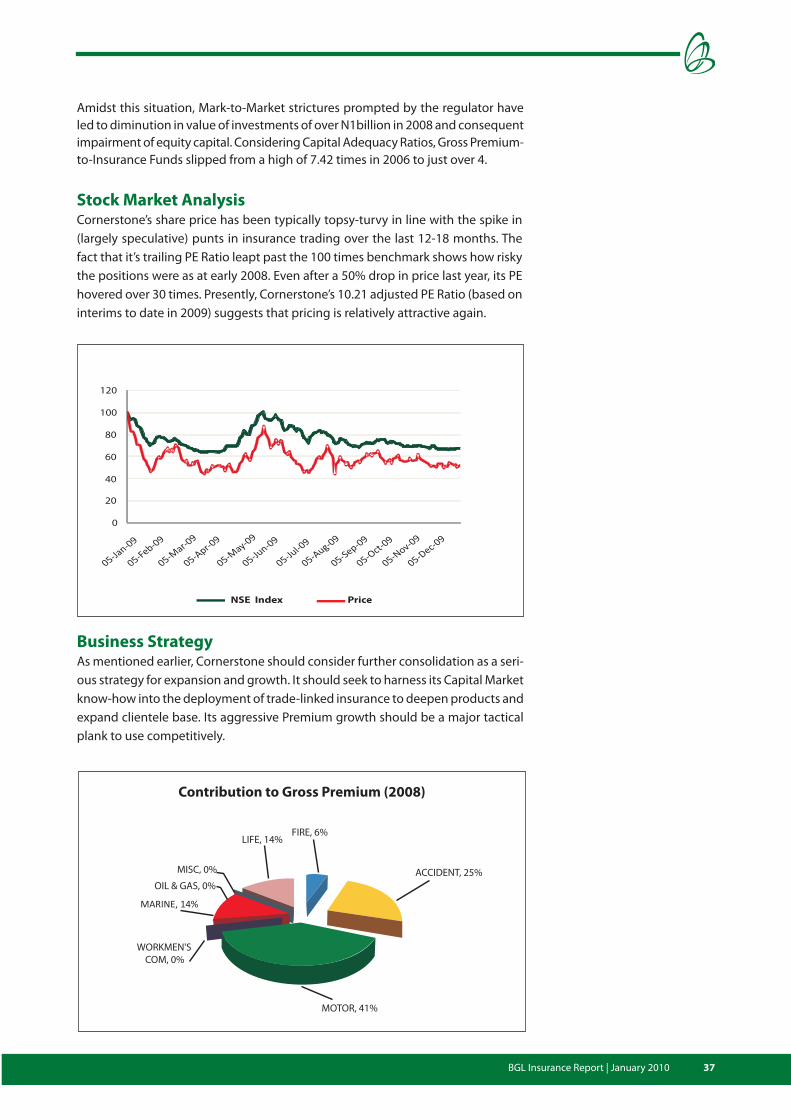
37BGL Insurance Report | January 2010
Stock Market AnalysisCornerstone’s share price has been typically topsy-turvy in line with the spike in (largely speculative) punts in insurance trading over the last 12-18 months. The fact that it’s trailing PE Ratio leapt past the 100 times benchmark shows how risky the positions were as at early 2008. Even after a 50% drop in price last year, its PE hovered over 30 times. Presently, Cornerstone’s 10.21 adjusted PE Ratio (based on interims to date in 2009) suggests that pricing is relatively attractive again.
0
20
40
60
80
100
120
Price v Index (% Change 2009)
NSE Index Price
05-Jan-0
9
05-Feb-0
9
05-Mar-0
9
05-Apr-0
9
05-May-0
9
05-Jun-0
9
05-Jul-0
9
05-Aug-0
9
05-Sep-0
9
05-Oct
-09
05-Nov-0
9
05-Dec-
09
Business StrategyAs mentioned earlier, Cornerstone should consider further consolidation as a seri-ous strategy for expansion and growth. It should seek to harness its Capital Market know-how into the deployment of trade-linked insurance to deepen products and expand clientele base. Its aggressive Premium growth should be a major tactical plank to use competitively.
FIRE, 6%
ACCIDENT, 25%
MOTOR, 41%
WORKMEN'S
COM, 0%
MARINE, 14%
OIL & GAS, 0%
MISC, 0%
LIFE, 14%
Contribution to Gross Premium (2008)
Amidst this situation, Mark-to-Market strictures prompted by the regulator have led to diminution in value of investments of over N1billion in 2008 and consequent impairment of equity capital. Considering Capital Adequacy Ratios, Gross Premium-to-Insurance Funds slipped from a high of 7.42 times in 2006 to just over 4.

38 BGL Insurance Report | January 2010
Crystalife Insurance Company Limited
Company ProfileCrystalife Assurance Company Limited (formerly Equity Life Insurance Company Ltd, formerly First Nigeria Insurance Company Limited) was incorporated in 1983 and was licensed as Life Specialist Company to transact Life and Pension businesses. Consequent upon a buy-over by new investors, the company changed its name to Equity Life Insurance Company Limited in 1998 but retained its business focus and objectives. In 2008 the company’s name was eventually changed to Crystalife Insurance Company Limited.
The Company has over the years carved out an outstanding reputation for itself as a Life Insurance company and has maintained a good business relationship with major brokers and re-insurance companies both locally and internationally.
Crystalife is owned by a select group of astute investors, comprising Skye Bank (31.2%), International Energy Insurance (28.08%), Equity Assurance Plc (10.30%), Cash Craft Asset Management (10.40%), Law Union and Rock Insurance (10.40%), and other Nigerians who own the remaining 9.62%. These shareholders collectively desire to establish a high profile mega Insurance Company that is capable of provid-ing specialised insurance, financial planning products and services to individuals and organisations nationwide by exploiting the obvious lapses in both management and underwriting practices within the Nigerian Insurance Industry and in the process, set the pace for the creation of a new image for the Nigerian Insurance Industry.
Skye Bank
31.20%
International
Energy Insurance
28.08%Law Union and Rock
Insurance
10.40%
Cash Craft Asset
Management
10.40%
Others
9.62%
Equity Assurance
10.30%
Shareholding Structure

39BGL Insurance Report | January 2010
Board of Directors Position Shareholding
Mr. Akinsola Akinfenwa (Representing Skye Bank) Chairman 1,800,000,000
Mr. Ifie Sekibo (Representing IEI Plc) Director 1,620,000,000
Mr. I. A. Balogun (Representing Equity Assurance) Director 594,000,000
Mr. Deolu Ireyomi (Representing Cashcraft) Director 600,000,000
Mr. Femi Akingbe (Representing Law Union and Rock) Director 600,000,000
Mrs. Oluseyi Ifaturoti Managing Director/CEO 32,184,533
Mr. Isaac Onoabhagbe Director 4,200,000
Mr. Kehinde Durosimi-Etti (Representing Skye Bank) Director Nil
Mr. Teju Ogunjimi (Representing IEI Plc) Director Nil
Performance AnalysisCrystalife Insurance grew premiums consistently over the last five years, albeit modestly although there is a glaring significant growth in 2008. Having gotten over 2006 recorded low of 10.62%, arguably due to reduced business activities during the industry consolidation, the company has gone through some strategic restructuring and capital in-flow informing the about 100% growth. Similarly, the company increased its Shareholders’ Funds from a paltry N25.3m in 2002 to about N3.2 billion in 2007, thus meeting the minimum capital requirement - N2 billion benchmark set for life insurance business. At the end of 2008, their Shareholders’ Funds dropped slightly to about N3 billion arguably due to the global meltdown and the overall bearish trends in the insurance market.
Board of Directors
2004
2005
2006
2007
2008
0
2003
N'000
400,000200,000 600,000 800,000 1,000,000 1,200,000
Gross PremiumGross Premium
2004
2005
2006
2007
2008
0
2003
N'000
2,000,0001,000,000 3,000,000 4,000,000
Shareholders’ FundShareholders’ Fund
Although Crystalife has increased its capital base in order to be better positioned for the market, arguably they would need some time to be able to properly measure their profitability especially when one takes into consideration the global conditions and the overall trends in the Nigerian insurance industry. Prior to the restructuring, the company continued to produce modest results gradually improving on impor-tant profitability ratios. Trends in Pre-tax Profit Margin reveal an increase from 2003 to 2007, growing from 1.36% in 2002 to 13.79% in 2006 then reaching a high of 94.74% in 2007. This was followed by a decline in 2008 to -83.65%, a drop of 200%.

40 BGL Insurance Report | January 2010
Performance Ratios (Margin) 2004 2005 2006 2007 2008
Change in Gross Premium 38.44% 43.59% 74.25% 95.30% 89.01%Net Premium Margin 76.92% 83.72% 86.08% 91.98% 96.08%Premium Earned/Gross Premium 76.92% 83.72% 86.08% 91.98% 96.08%Claims incurred/Gross Premium 27.50% 22.02% 32.31% 32.96% 28.56%Underwriting Profit Margin 36.01% 35.84% 20.27% 30.53% 24.86%Cost to Income Ratio 84.53% 77.22% 53.13% 53.04% 49.66%Pre-tax Profit Margin 13.39% 19.24% 16.87% 94.74% -83.65%ROAE 8.51% 12.83% 14.39% 28.63% -28.82%ROAA 2.49% 4.48% 5.24% 21.05% -21.49%EPS 0.03 0.07 0.08 0.10 (0.09)DPS 0.00 0.00 0.00 0.00 0.00Operating Profit per employee 25,238 14,032 3,526 8,344 6,674Underwriting Expenses per employee (5,789) (3,728) (804) (627) (1,169)Asset Quality Ratios 2004 2005 2006 2007 2008Investment Income/Investments 5.80% 10.93% 14.90% 19.68% 12.01%Effective Return on Investment 5.30% 10.64% 14.38% 17.77% -24.14%
Cost of Bad and Doubtful Loans 3.79% 0.66% 1.32% 11.86% 15.14%
Capital Adequacy Ratios 2004 2005 2006 2007 2008 Gross Premium/Insurance Funds 1.71 1.90 1.82 1.69 1.62 Debt/Equity Ratio 2.06 1.72 1.77 0.23 0.46 Equity/Total Assets 0.33 0.37 0.36 0.81 0.69
Financial Ratios
Both Return on Assets and Return on Equity followed the same trend moving from 2.49% and 8.51% in 2004 to 21.05% and 28.63% in 2007 before sliding to -21.49% and -28.81% respectively. Although these ratios may connote a loss of efficiency in the utilisation of resources in 2008, based on the current situation in the market that conclusion may be inaccurate. Proper investment decisions also saw the company’s effective return on investment grow from 1.02% in 2003 to 17.77% in 2008; however, increasing Claims Incurred relative to Premium has also consistently grown from 6.84% in 2003 to 32.96% in 2007. Arguably some claims have been paid as part of the restructuring hence the drop in claims accrued to 28.56% in 2008.
From 2002, the company consistently grew profits, though marginally in later years resulting in an EPS of N0.03k in 2004 which grew to N0.1k in 2007. While Dividend Payout was 70% in 2003, Earnings were fully paid out as Dividends in 2004 and 2006. The company retained all its Profits in 2002 and 2005. Although staff produc-tivity reached a high of 25,238 points in 2005, the staccato nature of this criterion are indicators that the company is still restructuring its operations and strategies especially when one considers that operating profit per employee dropped to N6.67m in 2008. Crystalife’s gross premium predominantly accrues from the group life segment, which constitutes more than 98% of total gross premium.
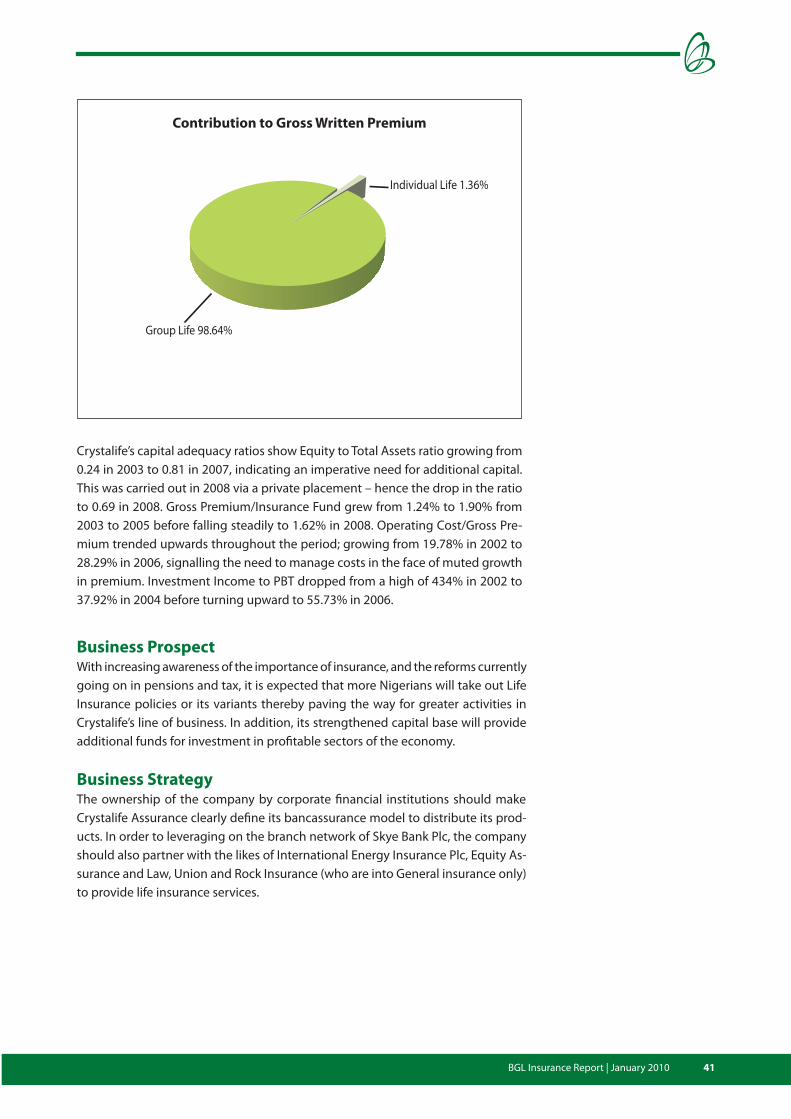
41BGL Insurance Report | January 2010
Individual Life 1.36%
Group Life 98.64%
Contribution to Gross Written Premium
Crystalife’s capital adequacy ratios show Equity to Total Assets ratio growing from 0.24 in 2003 to 0.81 in 2007, indicating an imperative need for additional capital. This was carried out in 2008 via a private placement – hence the drop in the ratio to 0.69 in 2008. Gross Premium/Insurance Fund grew from 1.24% to 1.90% from 2003 to 2005 before falling steadily to 1.62% in 2008. Operating Cost/Gross Pre-mium trended upwards throughout the period; growing from 19.78% in 2002 to 28.29% in 2006, signalling the need to manage costs in the face of muted growth in premium. Investment Income to PBT dropped from a high of 434% in 2002 to 37.92% in 2004 before turning upward to 55.73% in 2006.
Business ProspectWith increasing awareness of the importance of insurance, and the reforms currently going on in pensions and tax, it is expected that more Nigerians will take out Life Insurance policies or its variants thereby paving the way for greater activities in Crystalife’s line of business. In addition, its strengthened capital base will provide additional funds for investment in profitable sectors of the economy.
Business StrategyThe ownership of the company by corporate financial institutions should make Crystalife Assurance clearly define its bancassurance model to distribute its prod-ucts. In order to leveraging on the branch network of Skye Bank Plc, the company should also partner with the likes of International Energy Insurance Plc, Equity As-surance and Law, Union and Rock Insurance (who are into General insurance only) to provide life insurance services.

42 BGL Insurance Report | January 2010
Custodian and Allied Insurance Plc
Company ProfileCustodian & Allied Insurance Plc was incorporated on the 22nd of August 1991, licensed and registered under the name Accident and General Insurance Company. Custodian commenced operations in July 1995 as a General Insurance Business and obtained a license to operate a Life Insurance Business in 2001. It has, however, transferred its Life business to rival Leadway Assurance. It prides itself on its pro-gressive stance post-consolidation as it was one of the first insurance companies to raise capital after the announcement and it completed the first merger in the sector when it successfully merged with Signal Insurance in May 2006. Furthermore, Custodian successfully merged with Fire, Equity & General Insurance Company Limited in February 2007. On June 12, 2007, the shares of Custodian were listed on the Nigerian Stock Exchange, successfully completing a Listing by Introduction of 4,000,000,000 Ordinary Shares of 50 kobo each at N1.75 per share.
In Q3, 2008 Custodian & Allied Insurance Plc issued an unsecured variable coupon redeemable convertible loan stock at N4.50 each at par to Aureos Africa Interim Facility LLC (managed by Aureos Africa Manager Limited) and additionally issued 790m shares.
Custodian & Allied Insurance centres on providing fast, efficient and professional services to the customers. It is one of the few insurers which emphasises the use of modern information processing techniques as a competitive strategy reducing processing time thereby achieving the sought after cut-throat edge. Its products place emphasis on providing a wide menu of options on policies, having paid “due regard” to production processes employed in various industries. In keeping with this innovativeness/product-development aim, Custodian & Allied Insurance Plc introduced e-insurance.
Board of Directors Name PositionChief M. Ade Ojo ChairmanMr. O. B. Oshin Managing DirectorMr. O. A. Odunsi Deputy Managing DirectorMr. Ravi Sharma DirectorMr. Toni Ogunbor DirectorMr. A. O Odunsi DirectorChief (Mrs) M. Giwa Director
Performance AnalysisFinancially, Custodian & Allied Insurance Plc’s strategies play out in terms of opera-tional performance. It has impressively grown Gross Earnings at an annual average of 46.87% between 2004 and 2008. Pre-tax Profit improved consistently year-on-year over the last five years with a CAGR of 54.97% and grew by an outstanding 75.18% from 2007 when it posted a PBT of N1.06 billion.

43BGL Insurance Report | January 2010
2004
2005
2006
2007
2008
2003
0
N'000
2,000,0001,000,000 3,000,000 4,000,000 5,000,000
Gross Premium
2004
2005
2006
2007
2008
2003
0
N'000
6,000,0003,000,000 9,000,000 12,000,000
Shareholders’ Fund
ROA and ROE slightly dipped in 2008; however this isn’t as a result of poor earnings but a 110.82% rise in Total Assets to N11.94 billion in 2008 as well as a 121.62% rise in Net Assets.
Despite an accretion in equity which expectedly put pressure on industry profitabil-ity in 2005 and 2006, Custodian & Allied Insurance Plc ‘s return on equity remained strong, above 20% throughout the period under review . ROE was especially high at an average of 30% in 2005 and 2006 signifying commendable management capability. Percentage of Claims Incurred to Gross Premium remained stable at around 20% for the period. Earnings per Share increased from 0.23 in 2007 to 0.33 in 2008 and a dividend per share of 17 kobo was paid.
Perfomance Ratios (Margin) 2004 2005 2006 2007 2008Change in Gross Premium 19.78% 39.94% 54.76% 68.75% 51.10%Net Premium Margin 89.80% 85.50% 85.88% 82.24% 77.26%Premium Earned/Gross Premium 82.67% 83.12% 83.89% 76.22% 69.00%Claims incurred/Gross Premium 20.25% 20.23% 18.68% 20.81% 20.66%Underwriting Profit Margin 44.87% 51.47% 47.31% 39.81% 33.32%Cost to Income Ratio 56% 43% 49% 51% 49%Pretax Profit Margin 27.87% 31.85% 39.87% 38.91% 45.11%ROAE 32.31% 32.53% 27.89% 24.07% 21.25%ROAA 19.54% 17.37% 18.74% 19.04% 17.72%EPS 0.48 0.24 0.17 0.23 0.33DPS 0.10 0.00 0.10 0.12 0.17Asset Quality Ratios 2004 2005 2006 2007 2008
Investment Income/Investments 22.54% 13.55% 18.55% 32.65% 65.30%
Effective Return on Investment 22.54% 9.38% 14.94% 25.89% 57.37%
Cost of Bad and Doubtful Loans 0.00% 2.96% 6.81% 8.79% 5.22%
Capital Adequacy Ratios 2004 2005 2006 2007 2008
Gross Premium/Insurance Funds 2.59 3.15 3.88 3.95 3.49
Debt/Equity Ratio 0.63 1.02 0.31 0.24 0.18
Equity/Total Assets 0.61 0.49 0.77 0.81 0.85
Financial Ratios
Shareholders’ FundGross Premium
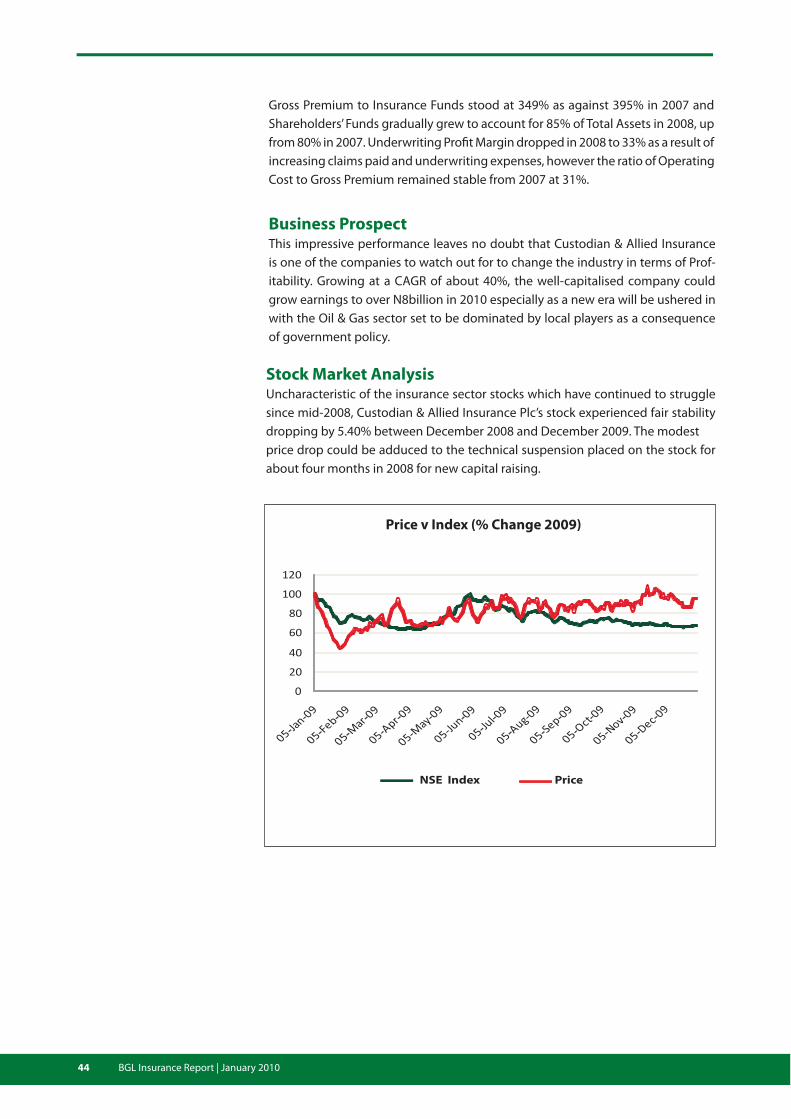
44 BGL Insurance Report | January 2010
Business ProspectThis impressive performance leaves no doubt that Custodian & Allied Insurance is one of the companies to watch out for to change the industry in terms of Prof-itability. Growing at a CAGR of about 40%, the well-capitalised company could grow earnings to over N8billion in 2010 especially as a new era will be ushered in with the Oil & Gas sector set to be dominated by local players as a consequence of government policy.
Gross Premium to Insurance Funds stood at 349% as against 395% in 2007 and Shareholders’ Funds gradually grew to account for 85% of Total Assets in 2008, up from 80% in 2007. Underwriting Profit Margin dropped in 2008 to 33% as a result of increasing claims paid and underwriting expenses, however the ratio of Operating Cost to Gross Premium remained stable from 2007 at 31%.
Stock Market AnalysisUncharacteristic of the insurance sector stocks which have continued to struggle since mid-2008, Custodian & Allied Insurance Plc’s stock experienced fair stability dropping by 5.40% between December 2008 and December 2009. The modest price drop could be adduced to the technical suspension placed on the stock for about four months in 2008 for new capital raising.
0
20
40
60
80
100
120
Price v Index (% Change 2009)
NSE Index Price
Price v Index (% Change 2009)

45BGL Insurance Report | January 2010
Business StrategyCustodian & Allied Insurance Plc’s task involves the development, packaging and delivery of innovative insurance products; hence it seeks exclusivity of service delivery as a calculated intent. It is one of the few insurers which emphasises the exploitation of technology and automation as a competitive strategy. The company also rates high as an independent, local insurer in the Oil & Gas industry- punching well above its weight taking into account premiums from the sector in context of its overall Gross premiums which was only 6% of total premiums in 2006 but was up to 16% in 2008.
Motor
29%
Accident
17%Marine
17%
Fire
18%
Engineering
3%
Oil & Energy
16%
Contribution to Gross Premium (2008)

46 BGL Insurance Report | January 2010
Goldlink Insurance Plc
Company ProfileWith Shareholders’ Funds of almost N7 billion, Goldlink Insurance Plc, is one of the 18 insurance companies in composite business licensed to underwrite all classes of insurance businesses i.e. Fire and Special Perils, Consequential Loss, Burglary, Bonds and Money, Goods-in-Transit, Group Personal Accident, Workmen’s Compensation, Marine Insurance, Engineering Installation, Household/House Owner Policies, Motor Business, Life & Pension Business.
The company seeks to outperform its peers through swift response to clients’ various and dimensional insurance problems. It has therefore computerised its operations to provide efficient and quick services to clients both in accessing products and services and in the settlement of claims.
Goldlink Insurance Plc seeks to retain its leadership position in the Insurance Indus-try through the introduction of new products and innovative services as well as its traditional insurance businesses.
Osayameh, R.K.O
8.28%
Afolayan
Olugbenga
6.25%
Okunniyi
Femi
6.12%
Ruth Star Limited
5.49%
Others
73.86%
Board of Directors Names Position Shareholding Gbenga Afolayan Chairman 564,972,050 Femi Okunniyi Managing Director/CEO 546,671,764 Tony Efegherimoni Executive Director 58,372,912 Chief K. O. Olufeko Director 17,957,720 Rt. Rev Ranti Odubogun Director 49,104,914 Chief Ndukwe Osogho-Ajala, OON Director 72,367,272 S. E. Idowu Director 85,139,334 Rep. of SPDC West Multipurpose Director 197,000,000Co-oporative Society Limited
Shareholding Structure

47BGL Insurance Report | January 2010
Performance AnalysisWith N2.8 billion in 2008, Goldlink Insurance Plc has been able to maintain a 10% increase in Gross Premium compared to 2007. This is arguably as a result of consis-tent growth in earnings in the last five years: a CAGR of about 28%. Likewise, the company grew its Shareholders’ Funds significantly, from a meagre N537m in 2003 to a whopping N6.96 billion in 2008 (about 2000% growth) to meet the minimum capital requirement announced by the industry regulator, NAICOM. The strongest growth was in 2005 when it grew Shareholders’ Funds 220% to N4.1 billion from N1.3 billion in 2004; growth in 2006 was 31.34%.
2005
2006
2007
2008
1,000,000500,000 1,500,000 2,000,000 2,500,000 3,000,000
N'000
Gross Premium
2004
2005
2006
2007
2008
4,000,0002,000,000 6,000,000 8,000,000 10,000,000
N'000
Shareholders’ Fund
Performance ratios seem relatively encouraging between 2007 and 2008; except for claim to gross premium being 2% higher (26.56%) than in 2007 (23.55%). Also, Pre-tax Profit Margin, which had been on the increase since 2002 dropped to 21.79% in 2008 after achieving a high of about 26.10% in 2007, arguably due to the mark to market initiative by industry regulators since the companies investments in equities has taken a dramatic blow due to the global recession in 2008. The prior aggressive growth in equity between 2003 and 2007 put pressure on returns as the company’s Return on Assets dropped to a 5-year low of 6.80% in 2008 (In 2005, the ROA was at a five-year high of 11.86%); while Return on Equity consistently fell from a high of 20.62% in 2003 to a low of 8.73% in 2008. Yield on Investment also suffered the

48 BGL Insurance Report | January 2010
same fate falling from a high of 7.05% in 2003 to 4.24% in 2006, having grown from 4.96% in 2002. Apart from the pressure on Returns, increase in Share Capital also caused a reduction in EPS, from N0.33k in 2003 to N0.12k in 2008; as a result of which the company did not declare Dividends in 2005, 2006 and 2008 after a constant reduction in DPS from N0.12k in 2003 to N0.02k in 2004. The last time dividend was declared was 2007 – N0.12k.
Performance Ratios 2004 2005 2006 2007 2008
Change in Gross Premium 50.00% 16.21% 8.91% 12.01% 9.95%
Net Premium Margin 76.96% 86.85% 88.75% 90.96% 91.54%
Premium Earned/Gross Premium 69.17% 82.23% 82.66% 85.91% 88.10%
Claims incurred/Gross Premium 17.24% 16.51% 17.51% 23.55% 26.56%
Underwriting Profit Margin 26.82% 41.03% 37.10% 38.57% 38.88%
Cost to Income Ratio 25.30% 57.26% 55.83% 52.75% 51.49%
Pre-tax Profit Margin 11.55% 25.20% 25.53% 26.10% 21.79%
ROAE 20.62% 17.21% 10.80% 10.80% 8.73%
ROAA 9.89% 11.86% 8.37% 8.20% 6.80%
EPS 0.19 0.20 0.15 0.16 0.12
DPS 0.02 0.00 0.00 0.12 0.00
Asset Quality Ratios 2004 2005 2006 2007 2008
Investment Income/Investments 5.35% 6.30% 4.47% 6.58% 6.35%
Effective Return on Investment 5.35% 5.77% 4.08% 6.25% 1.92%
Cost of Bad and Doubtful Loans 0.00% 0.85% 0.79% 0.66% 4.02%
Capital Adequacy Ratios 2004 2005 2006 2007 2008
Gross Premium/Insurance Funds 2.11 3.18 2.51 2.35 2.61
Debt/Equity Ratio 0.87 0.32 0.27 0.37 0.22
Equity/Total Assets 0.53 0.76 0.79 0.73 0.82
Other performance ratios show considerable improvement. In the context of Capital Adequacy, improvements are seen in Shareholders’ Fund/Total Assets which consistently increased albeit marginally from 0.38 in 2003 to 0.82 in 2008. Gross Premium/Insurance Fund remained fairly constant throughout the period although the slight increase from 2.35 in 2007 to 2.61 in 2008 is worthy of notice. Also the Debt-to-Equity ratios seem quite encouraging as the company has con-sistently reduced this ratio in the five year period. Although the ratio went up from 0.27 to 0.37 between 2006 and 2007, it was down to 0.22 by 2008 indicating more positioning in equities.
Business ProspectWith the new capital base and the performance history of Goldlink Insurance, it is permissive to continue to expect double digit growth in Gross Premium and Profitability. Although the company could not meet its profit projections for 2008 arguably due to the mark to market inhibitions but we expect the company would bounce back from this set back.
Financial Ratios
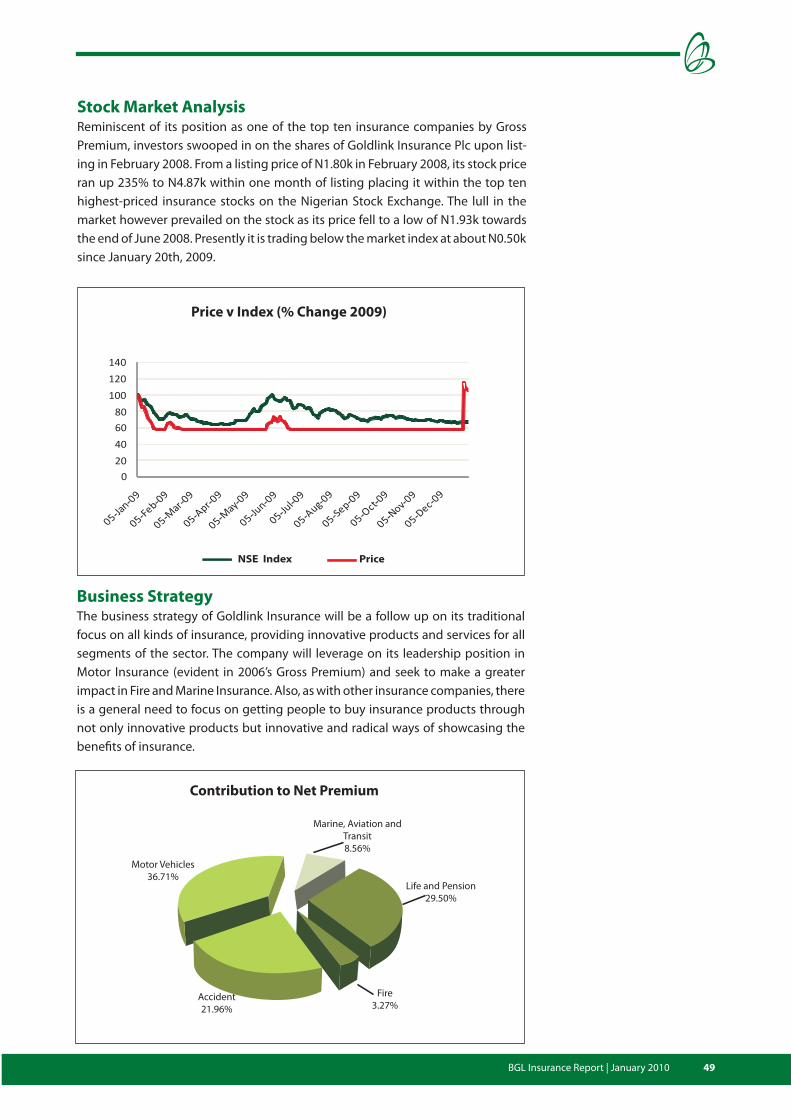
49BGL Insurance Report | January 2010
Stock Market AnalysisReminiscent of its position as one of the top ten insurance companies by Gross Premium, investors swooped in on the shares of Goldlink Insurance Plc upon list-ing in February 2008. From a listing price of N1.80k in February 2008, its stock price ran up 235% to N4.87k within one month of listing placing it within the top ten highest-priced insurance stocks on the Nigerian Stock Exchange. The lull in the market however prevailed on the stock as its price fell to a low of N1.93k towards the end of June 2008. Presently it is trading below the market index at about N0.50k since January 20th, 2009.
0
20
40
60
80
100
120
140
Price v Index (% Change 2009)
NSE Index Price
Business StrategyThe business strategy of Goldlink Insurance will be a follow up on its traditional focus on all kinds of insurance, providing innovative products and services for all segments of the sector. The company will leverage on its leadership position in Motor Insurance (evident in 2006’s Gross Premium) and seek to make a greater impact in Fire and Marine Insurance. Also, as with other insurance companies, there is a general need to focus on getting people to buy insurance products through not only innovative products but innovative and radical ways of showcasing the benefits of insurance.
Marine, Aviation and
Transit
8.56%
Life and Pension
29.50%
Fire
3.27%Accident
21.96%
Motor Vehicles
36.71%
Contribution to Net Premium
Price v Index (% Change 2009)

50 BGL Insurance Report | January 2010
Guaranty Trust Assurance Plc
Company ProfileThe company was incorporated in June 1989 as Heritage Assurance Limited. Fol-lowing an acquisition of a majority stake by Guaranty Trust Bank Plc in September 2004, the company was renamed Guaranty Trust Assurance Limited (GTA). The acquisition followed the introduction of Universal Banking in 2000 when banks were provided with the freedom to undertake a wide range of activities including the provision of insurance services. The company subsequently became a Public limited company in March 2006 following the admission of new members.
GTA listed 10 billion of its issued ordinary shares on the Nigerian bourse on 19th November 2009. Prior to listing in 2008, GTA raised N4.69 billion in fresh capital through a special placement of 3.75 billion ordinary shares at N1.25 per share. The company had earlier recapitalised through equity injection by GTB and a Rights issues and Private Placement carried out between February 2004 and March 2006, taking Shareholders’ Funds from N450m in 2004 to N5.3 billion in 2006, an increase of over 1000%. The Shareholders’ Funds currently stands at N12.5 billion.
GTA has one subsidiary – Assur Asset Management which provides portfolio management services to corporate and individual clients. Two new subsidiaries were floated as special purpose vehicles during the financial year 2006. These are Barista Property Development and GTA Real Estate Limited. GTA Real Estate Ltd was disposed off in 2008.
Board of Directors Name Position No. of Shares held
Mr. Victor G. Osibodu Chairman 133,750,000
Mrs. Yetunde Ilori Director 1,000,000
Mr. Tosin Runsewe Chief Executive Officer 29,962,500
Mr. Tayo Aderinokun Director 158,750,000
Mr. Segun Agbaje Director 15,000,000
Mr. Kolapo Omidire Director 5,022,727
Mr. Demola Odeyemi Director 8,400,000
Mr. Victor Akinbayo Director 19,550,000
Mr. Hakim Khelifa Director Nil
Performance AnalysisGTA continued its impressive growth in 2008 growing Gross Premium by 100% from N2.06 billion in 2007 to N4.14 billion in 2008. This is however lower than the 5-year Gross Premium CAGR of 127%. Similarly, the company grew its Shareholders’ Funds consistently, from N450m in 2004 to N12.5 billion in 2008 (a CAGR of 183%), reaching about N3.1 billion in 2005 (although, about N2.6 billion were deposits for shares not yet allocated). This feat in 2005 enabled the company achieve statutory capitalisation requirements prior to recapitalisation.

51BGL Insurance Report | January 2010
Guaranty Trust
Bank Plc
74%
AfricInvest
Limited
5%
Free float
21%
Shareholding Structure
N'000
2004
2005
2006
2007
2008
2,000,0001,000,000 3,000,000 4,000,000 5,000,000
Gross PremiumGross Premium
2004
2005
2006
2007
2008
N'000
6,000,0003,000,000 9,000,000 12,000,000 15,000,000
Shareholders’ FundShareholders Funds
GTA’s Pre-tax Profits have increased by a 5 year CAGR of 96%, growing from a loss of N37m in 2004 to N1.99 billion in 2008; while Pre-tax Profit Margin grew consistently from a -8% in 2004 to 48% in 2008. Increase in Equity and the build up of Assets notwithstanding, the company’s Return on Average Total Assets grew from -12.92% in 2004 to 15.34% in 2008 while Return on Average Equity grew from -17.55% to 19.93% over the same period. Yield on Investment dipped by 22% in 2008, the first drop in 5 years. Yields on Investment were at an impressive high of 11.2% in 2004 but fell to less than 1% in 2005 (lowest in four years) but was back up to 6.59% in 2006 and to a high of 23.65% in 2007, denoting a successful investment strategy in the midst of the boom. In 2008, the Yield on Investment dropped to 1.7% depicting the low returns of investment which was the norm in 2008.

52 BGL Insurance Report | January 2010
Overall in terms of profitability, GTA outperformed its peers in 2008. The assets’ quality and profitability of insurance companies in Nigeria were affected by the equities market downturn on one hand; and on the other, the directive by regula-tor NAICOM to draw books of account on a mark to market basis. Percentage of Claims Paid to Gross Premium remained fairly low in 2008 growing to 19.25% from 17.59% in 2007.
GTA’s impressive performance saw the company growing from a Loss per Share of (N0.09k) in 2004 to N0.33k in 2008 representing an impressive growth of 267%. This enabled the company increase dividend payout by 150%, from N0.06 the previous year to N0.15 in 2008. Though the DPS increased, the payout reduced from 66% in 2007 to 45% in 2008. Staff productivity also improved significantly as Underwriting Profit/Employee rose from N21.8m in 2004 to N62m in 2008 while Underwriting Expenses/Staff also grew from N0.3m in 2004 to N62m in 2008. The Efficiency ratio as measured by Underwriting Profit Margin has halved in the past five years, drop-ping from 55% in 2004 to 28.96% in 2008.
Capital Adequacy ratios show Equity/Total Assets, with a 5 year average of 81%, has been dropping annually since 2005 when it reached a five year high of 92%. It was down to 76% in 2008. Despite the drop, the ratio of Equity to Assets is still considered adequate. Gross Premium/Insurance Fund was at a low of 331% in 2005. It recorded its highest year on year growth in 2008, when it grew 40% from the previous year to reach 522%. Debt to Equity ratio increased to 32% in 2008 from 27% in 2007
Asset Quality Ratios 2004 2005 2006 2007 2008
Investment Income/Investments 11.19% 0.79% 6.59% 24.25% 1.69%
Effective Return on Investment 11.19% 0.69% 6.46% 23.93% 0.77%
Cost of Bad and Doubtful Loans 0.00% 1.02% 0.95% 1.80% 3.69%
Capital Adequacy Ratios 2004 2005 2006 2007 2008
Gross Premium/Insurance Funds 7.82 7.95 3.31 3.71 5.22
Debt/Equity Ratio 0.36 0.08 0.16 0.27 0.32
Equity/Total Assets 0.74 0.92 0.86 0.79 0.76
Perfomance Ratios (Margin) 2004 2005 2006 2007 2008
Change in Gross Premium 101.01% 213.88% 149.55% 93.13% 101.00%
Net Premium Margin 70.87% 80.33% 77.58% 66.95% 61.78%
Premium Earned/Gross Premium 66.90% 75.43% 57.24% 56.75% 59.20%
Claims incurred/Gross Premium 12.04% 13.68% 11.78% 17.59% 19.25%
Underwriting Profit Margin 55.00% 56.98% 40.14% 31.98% 28.96%
Cost to Income Ratio 174% 93% 88% 94% 67%
Pretax Profit Margin -27.17% 3.75% 35.94% 53.38% 48.30%
ROAE -17.55% 1.54% 6.98% 14.12% 19.93%
ROAA -12.92% 1.38% 6.17% 11.60% 15.34%
EPS -0.04 0.03 0.03 0.16 0.21
DPS 0.00 0.00 0.00 0.00 0.17
Financial Ratios

53BGL Insurance Report | January 2010
Business ProspectWe projected 2008 Gross Premium and PAT of N3.62 billion and N1.5 billion respec-tively for GTA. However, despite the slump in performance by many of its peers, GTA outperformed our projections. The company recorded a Gross Premium of N4.14 billion and PAT of N1.88 billion, surpassing our projections by 14% and 25% respectively. We also projected a slowdown in double digit growth of insurance companies and the emergence of new sector leaders in 2008. However, GTA impres-sively grew by triple digits. The firm grew year on year Gross premium by 101% in 2008 and PAT by 128%. Going forward, we believe the company will continue to use its superior customer service to fully consolidate its emerging leadership status.
Business StrategyIn line with the corporate strategy of its parent company, GTA has adopted a differ-entiation strategy offering attractive products & services in the Nigerian insurance sector. The company pioneered the bancassurance principle to serve the highly fragmented retail segment while not loosing focus on the important high-end clientele of corporate businesses, and oil and energy corporates. So far the Com-pany has done relatively well in both Life and Non-Life businesses. In terms of gross premiums, GTA grew its proportion of premiums from life insurance by 1% in 2008 to 9% relative to 8% in 2008. In 2008, like its peers, Motor Insurance contributed the bulk to premiums with 28%. However, riding on the back of its strong oil and gas banking expertise and the Local Content Policy, premiums from oil and gas closely rival Motor Insurance. Oil and Gas contributions to premiums reached its high at 27%, though its 3% contributions to underwriting profits in contrast to Motor Insurance’s 36% contributions would imply that the latter still holds more value as a more viable option for bottom-line targets.
Motor
28%
Fire
12%
General Accident13%
Marine14%
Bond1%
Engineering
5%
Oil & Energy27%
Aviation
0%
Contribution to Gross Premium, 2008

54 BGL Insurance Report | January 2010
Intercontinental WAPIC Insurance Plc
Company ProfileIntercontinental WAPIC Insurance Plc (WAPIC) was incorporated in 1958 as WAPIC Insurance Plc (West African Provincial Insurance Company Plc); a private limited liability company licensed to transact Life and Non-Life Insurance businesses in Nigeria. It became a publicly quoted company following the divestment of Federal Government holdings in 1990, with its shares quoted on the floor of the Nigerian Stock Exchange. The need to recapitalise and play a major role in the economy culminated in the acquisition of the company by Intercontinental Bank Plc through its subsidiary, Intercontinental Capital Markets Limited in 1997; hence the change of name to Intercontinental WAPIC Insurance Plc.
With an Authorised Share Capital of N3.5 billion and a Paid-up Share Capital of N2.5 billion, Intercontinental WAPIC Insurance is one of the leading underwriting firms in the insurance industry. Gross Premium in 2008 stood at N7.1 billion and asset base was in excess of N12.94 billion. Intercontinental Bank Plc holds about 60% of the company while other (local and foreign) investors hold the remaining 40%.
IntercontinentalBank Plc
58%
Others42%
Following the recapitalization, the company was licensed by NAICOM to under-write Life Insurance business in 2000, transforming it into a composite insurance company. The company offers specialised products and services for corporate, group and individual spanning risks of Fire & Special Perils, Burglary, Engineering Insurance, Marine, Automobile, Money Insurance, Life and Pension and Mortgage Protection Insurance.In accordance with the industry consolidation and to further achieve business ob-jectives, a new company – WAPIC Life Assurance Limited was incorporated to carry on the business of Life and Annuities Insurance.
The Board consists largely of Independent Directors who bring their professional qualifications and business experience to decision making.
Shareholding Structure

55BGL Insurance Report | January 2010
Board of Directors
Performance AnalysisGross Premium grew by 82.15% from N3.89 billion in 2007 to N7.09 billion in 2008, compared to the 37.06% growth in 2007, the CAGR in Premium Income stands at an impressive 57.56%. The significant growth in Gross Premium in 2008 is at-tributable to increased business opportunities resulting from an improved client portfolio spanning several industries such as the oil & gas sector, manufacturing and banking.
0 2,000,000 4,000,000 6,000,000 8,000,000
2003
Feb-05
2006
2007
Dec-07
2008
N'000
Name Position
Engr. Hyacinth U F Enuha Chairman
Segun Balogun Managing Director/CEO
R.A. Adewole Executive Director
Raymond C. Obieri (OON) Director
Erastus B.O. Akingbola (MON) Director
Chris A. Alabi Director
Isyaku Umar (OON) Director
Iheanacho Ugochukwu Director
Daniel Amusan Director
Gross Premium
0 2,000,000 4,000,000 6,000,000 8,000,000 10,000,000
2003
Feb 05
2006
2007
Dec07
2008
N'000
Shareholders’ Fund
The fall in Profit after Tax in 2008 was majorly as a result of NAICOM’s directive to mark-to-market all investments in the capital market to reflect the full effects of the market downturn, as a consequence the value of short term investments on the balance sheet dropped 42.93% from N1.31 billion to N750m. The provision of N593m in short term investment and the write-off of certain debts led to a total provision of N1.48 billion in the profit and loss statement for 2008.

56 BGL Insurance Report | January 2010
WAPIC’s Profitability Ratios declined as a result of market stress and regulatory poli-cies. Although gross premium increased all other profit indicators shrunk with Net Premium margin down from 92.89% in 2007 to 90.46% in 2008, Premium earned as a percentage of Gross Premium at 77.22% in 2008 from 86.92% in 2007 and Un-derwriting Profit margin stable at 35%. Cost of doing business however amplifiedin 2008 with the Cost-to-Income ratio rising to 61.60% from 58.57% in 2007. Pre-tax Profit Margin was at its worst in many years with the company posting a PBT loss and complementing it with tax gains to help buffer the bottom-line in 2008.
Return on Total Assets (ROA) fell from a high of 15.39% in 2005 to a low of -0.12% in 2008, while Return on Equity (ROE) also once at a high of 38.27% in 2005, declined to -0.17% in 2008. Intercontinental WAPIC expanded operations into the Ghanaian market in Q2 2009 with N127m investment in its subsidiary Intercontinental WAPIC (Ghana). 80% of its total assets were kept as cash in banks in 2007 but this figure declined to 52% in 2008 with an increase in fixed assets and debtors profile.
Underwriting Profit per employee grew by 60% in 2008 from N8.76m in 2007 to N14.03m in 2008. Shareholders’ Fund/Total Assets ratio fell from 73% in December 2007 to 67% in 2008. The company also continued its habit of changing its financial year end having varied year ends between February and December thrice in the last 6 years.
Financial Ratios Performance Ratios (Margin) 2004 2005 2006 2007 2008
Change in Gross Premium 122.17% -22.33% 118.10% 37.06% 82.15%
Net Premium Margin 83.86% 87.10% 88.01% 92.89% 90.46%
Premium Earned/Gross Premium 72.02% 87.14% 69.57% 86.92% 77.22%
Claims incurred/Gross Premium 19.39% 25.07% 11.08% 18.03% 19.33%
Underwriting Profit Margin 31.53% 40.24% 40.96% 35.83% 35.24%
Cost to Income Ratio 52.87% 55.51% 60.44% 58.57% 61.60%
Pre-tax Profit Margin 21.35% 24.86% 32.49% 22.50% -0.21%
ROAE 38.27% 24.81% 13.59% 6.61% 2.07%
ROAA 15.39% 9.00% 9.87% 5.08% 1.45%
EPS 0.39 0.29 0.70 0.14 0.04
DPS 0.23 0.17 0.00 0.00 0.00
Operating Profit per Employee 4,892.79 4,328.66 7,133.31 8,767.73 14,029.56
Underwriting Expenses per Employee (1,458.46) (2,200.08) (3,700.08) (7,668.11) (8,406.40)
Asset Quality Ratios 2004 2005 2006 2007 2008Investment Income/Investments 52.17% 69.90% 77.97% 24.55% 70.34%Effective Return on Investment 20.67% 40.56% 63.06% 7.28% -64.05%Cost of Bad and Doubtful Loans 16.83% 4.35% 1.86% 6.29% 47.42%Capital Adequacy Ratios 2004 2005 2006 2007 2008Gross Premium/Insurance Funds 3.18 2.45 2.44 2.61 2.66Debt/Equity Ratio 1.92 1.60 0.24 0.36 0.49Equity/Total Assets 0.34 0.38 0.80 0.73 0.67

57BGL Insurance Report | January 2010
Stock Market AnalysisWAPIC insurance’s strong pedigree in the stock market and within the insurance industry for the relative stability/growth of its share price over the years suffered extremely in 2008, as its price dropped from an all time high of N11.42 in March 2008 to N3.79 by the end of the year. This trend continued in 2009 with its value currently N0.85k (Dec 04, 2009).
0
20
40
60
80
100
120
Price v Index (% Change 2009)
NSE Index Price
Price v Index (% Change 2009)
Business StrategyA top name in the Nigerian insurance industry, WAPIC has become one of the pre-ferred brands relying on its group advantage as a subsidiary of a top commercial bank. Nevertheless support through funding to cover risks and other contingencies from its parent company is expected to shrink in the coming years due to the inher-ent troubles in the banking sector, with the company likely to grow proportionally to the aggregate credit and syndications of its holding company, WAPIC’s rate of growth would predictably slow down as well. WAPIC should continue to seek offshore alliances and expansion to strengthen its technical capacity and boost its business in order to remain one of the biggest insurance companies in the West African sub region. The bancassurance model should also be used to serve the underserved retail segment of the sector using a low cost approach as strategy.
Fire
11%
General
Accident
24%
Engineering
7%
Marine
20%
Motor
38%
Contribution to Gross Premium

58 BGL Insurance Report | January 2010
LASACO Assurance Plc
Company ProfileIncorporated in December 1979, LASACO Assurance Plc (LASACO) commenced business as Lagos State Assurance Company Limited on 1st August 1980, licensed to carry on all businesses of insurance. In July 1988, following the promulgation of the Privatisation and Commercialisation Decree No. 25 of 1988, the company changed its name to LASACO Assurance Plc and was listed on the Nigerian Stock Exchange on 14th June 1991.
The company transacts all classes of insurance businesses which include; Motor, Bond, Contractors-All-Risk, Fire, Burglary, Aviation, Marine, General Accident, Pension Schemes, Engineering, Oil & Gas, and Life Insurance, hitherto carried out through a subsidiary company named LASACO Life Assurance Co. Its other subsidiary company is LASACO Properties Ltd.
LASACO’s shareholding structure includes a 30% share owned by Lagos State Government through its investment vehicles Ibile Holdings Ltd, IHL Ventures and IHL Property Limited.
Ibile Holdings
Ltd 12%
Canon
Properties 10%
IHL Venture 9%
IHL Properties
Ltd 9%
LASBULK Nig.
Ltd 9%
Other
NIGERIANS
51%
Shareholding Structure
Board of Directors Name Position
Chief Edward Akin Leigh Chairman
Mr. Babatunde Durosinmi-Etti Director, Representing Ibile Holdings
Dr. (Mrs) Toyin Adebola Phillips Director
Engineer Ashim Adebowale Oyekan Director
Mrs. Aduke Modupeolu Thorpe Director
Chief Michael Segun Abraham Director, Representing Canon
Properties & Investment Ltd.
Mr. Olusola Olatayo Ladipo-Ajayi Managing Director/CEO
Mr. Babajide Wright Executive Director

59BGL Insurance Report | January 2010
Performance AnalysisLASACO Assurance Plc recorded an underwriting profit of N1.39 billion in 2008 as against N835m achieved in 2007; representing a growth of about 67% from the company’s core insurance business. Gross premium income also increased from N1.77 billion in 2007 to N2.33 billion in 2008; about 32% growth. The actual Premium Earned grew by 56% from N1.33 billion in 2007 to N2.07 billion in 2008, while its Total Assets grew from N8.6 billion in 2007 to N8.74 billion; representing a growth of about 1.35%. The firm incurred net claims of N360m compared to N262m recorded in 2007. This shows an increase of about 37%.
In respect of its life insurance operations, the company raked in Premiums to the tune of N545.46m in 2008, a 43.36% improvement over the N370.15m recorded in 2007. The company had Profit before Taxation of N609.90m, a 29.98% shortfall from the N871.06m recorded the previous year. This followed the write-off of N213.56m lost as a result of the volatility of the capital market, which resulted to diminution in share value.
Perfomance Ratios (Margin) 2004 2005 2006 2007 2008Change in Gross Premium 23.11% 38.51% 67.10% 10.83% 31.59%Net Premium Margin 80.95% 74.11% 67.22% 80.43% 88.26%Premium Earned/Gross Premium 69.71% 64.31% 51.75% 74.70% 89.00%Claims incurred/Gross Premium 8.74% 6.55% 1.12% 14.79% 15.43%Underwriting Profit Margin 49.44% 47.34% 41.52% 49.34% 59.63%Cost to Income Ratio 63.86% 64.33% 65.68% 49.55% 44.96%Pretax Profit Margin 17.87% 14.94% 12.26% 49.44% 26.13%ROAE 9.90% 8.46% 9.97% 18.26% 7.56%ROAA 6.06% 5.38% 5.74% 12.18% 5.27%EPS 0.09 0.08 0.08 0.09 0.05 DPS 0.00 0.00 0.00 0.08 0.00Operating Profit per Employee 3,337.09 4,276.15 6,050.57 13,037.94 10,983.70Underwriting Expenses per Employee (951) (1,217) (1,581) (1,828) (2,260)Asset Quality Ratios 2004 2005 2006 2007 2008Investment Income/Investments 8.63% 7.51% 26.77% 19.34% 14.82%Effective Return on Investment 8.63% 7.51% 26.77% 19.34% 8.59%Cost of Bad and Doubtful Loans 3.61% 4.49% 9.18% 13.59% 15.79%Capital Adequacy Ratios 2004 2005 2006 2007 2008Gross Premium/Insurance Funds 14.83 2.46 3.39 2.80 3.74Debt/Equity Ratio 0.50 0.64 0.83 0.42 0.45
Equity/Total Assets 0.67 0.61 0.55 0.71 0.69
Financial Ratios
2004
2005
2006
2007
2008
0
N'000
1,000,000500,000 1,500,000 2,000,000 2,500,000
Gross Premium
2004
2005
2006
2007
2008
0
N'000
2,000,0001,000,000 3,000,000 4,000,000 5,000,000 6,000,000 7,000,000
Shareholders’ Fund
Gross Premium Shareholders’ Fund

60 BGL Insurance Report | January 2010
Stock Market AnalysisFrom a mute price of N0.90 in early to mid 2007, LASACO’s stock price grew signifi-cantly in the wake of the insurance stocks’ price rally peaking at N5.99 by February 2008 (over 500% growth). The bears’ takeover of the market in March 2008 saw some fundamentally sound stocks loosing their immunities. In line with insurance industry average performance, LASACO Plc share lost 63% in 2009.
0
20
40
60
80
100
120
Price v Index (% Change 2009)
NSE Index Price
Business StrategyRanked 24th in the sector by Gross Premium for 2007, LASACO has strategised to achieve a higher feat in 2008 with its focus on General Accident insurance, which contributed over 68% of Premium Income; Motor and life insurance. The company has a crop of competent experts in its oil and gas department. Hence its appointment by ExxonMobil as the insurer of its ERHA projects for 2010/2011 for US$6m is not surprising. Going forward, the company should also consider focusing on emerg-ing sectors such as Power and Infrastructure to grow income. It should rely on its relationship with the Lagos State Government to take part in several developmental projects nationwide especially in Lagos State.
The management has recently affirmed that its vision for LASACO in the next 10 years is of a cost effective, well governed and efficiently managed company, profit-able and out-performing competition in all segments of its business and delivering high returns to its investors.
Life
23%
Fire
6%
Accident
38%
Motor Vehicles
30%
Marine &
Aviation
3%
Contribution to Gross Premium
Price v Index (% Change 2009)
The percentage of Claims to Gross Premium, historically insignificant at less than 10%, dropped further to a paltry 1% in 2006 but was up to 15.4% in 2008. The issue of agency debtors had a major impact on financial results in 2008 as the magnitude of outstanding debts became alarming and cut across the entire industry.

61BGL Insurance Report | January 2010
Leadway Assurance Company Limited
Company ProfileIn continuation of the development of the erstwhile Gaskiya Insurance Brokers which was started in kaduna in 1967, Leadway Assurance Company Limited (Leadway) was founded in 1970 and commenced business in 1971 as a direct Motor Insurance company. However it has diversified into other insurance classes and now oper-ates as a composite company. At the top of the insurance league table Leadway has established itself as the premier insurance company in Nigeria by way of gross premium, with Premium Income growing from N3.8 billion to N21.71 billion over the five year period between 2004 and 2008. Even with the competitive advantage from bank owned insurance companies, the company maintains a dominant posi-tion in the insurance landscape. Leadway is an unquoted insurance company and has an authorised share capital of N4 billion made up of 8 billion units of which 3.95 billion units are in issue.
The company’s ownership base could be described as relatively small with only 29 shareholders, five of which are corporate investors, and a Trust Corporation. The remaining 24 are individual investors.
In addition to the underwriting business, the company also offers allied financial services like bond, secured credit, miscellaneous financial losses, pension fund administration, real estate investments and fund/portfolio management through its four subsidiaries.
With increasing regulatory oversight and corporate governance standards in Nigeria there is bound to be further improvement in the industry although the sub-sector is still below international best practises. The board of Leadway has more non-executive than executive directors who possess years of experience from diverse backgrounds and are well supported by a technical management team with suf-ficient experience in insurance.
Subsidiary % held Service
Leadway Trustees Limited 53 Trustee
Leadway Hotels Limited 51 Hospitality
Leadway Properties and Investments Limited 100 Real Estate
Leadway Pensure PFA 46 Pensions
Board of Directors Name Position
Alhaji Hassan Hadejia Chairman
Mr. Oye Hassan-Odukale Managing Director
Mr. Tunde Hassan-Odukale Executive Director
Mr. Olawale Oyedele Executive Director
Dr. koyinsola Ajayi Non-Executive Director
Dr. A.B.C Orijako Non-Executive Director
Mr. Jeremy Rowse Non-Executive Director
Mrs. Abimbola Oyebanjo Non-Executive Director
Mallam Umar Yahaya Non-Executive Director

62 BGL Insurance Report | January 2010
Leadway has built a strong local brand and reputation with a customer centric focus. The insurer was rated AA- by Global Credit Rating (GCR), a South African- based risk rating agency, for its claims paying ability. The company has also invested consider-ably in IT infrastructure and has formed strategic business partnerships to emerge a market leader. It has structures in place with its principal banks – Citibank and GT Bank – to use on-line banking and fund transfer services in delivering claim cheques to the local branches within 12 hours of receiving the appropriate discharge vouchers and has in some cases, simplified claim settlement by delegating local branches to make payments to clients within their limits. Leadway has adopted branch network-ing as a major marketing strategy with 21 offices nationwide.
Performance AnalysisLeadway ranked number one by Gross Premium in 2008, with growth from N15.12 billion in 2007 to N21.72 billion, a rate of 43.65%. Shareholders’ Funds dropped from N18.47 billion in 2007 to N12.40 billion in 2008, with a provision for its insurance funds and marking-to-market of investments by far the biggest contributors to the drop in earnings. However, Leadway has continued to pay dividends to its investors, shelling out a N0.06k dividend per share in 2008.
0 5,000,000 10,000,000 15,000,000 20,000,000 25,000,000
2003
2004
2005
2006
2007
2008
N'000
Gross Premium
0 5,000,000 10,000,000 15,000,000 20,000,000
2003
2004
2005
2006
2007
2008
N'000
Shareholders' Fund
Leadway’s earned premium grew by 6.57% in 2008 to N7.60 billion from N7.13 bil-lion in 2007. In its core insurance business, Leadway impressed with underwriting profits growing significantly in 2008 as a result of lower outward insurance premium, provision for unexpired risks even with an increasing underwriting expense profile. Pre-tax Profit slightly improved year on year by 4.05% to N1.26 billion from N1.21 billion in 2007. . Underwriting Profit margin declined by 64% dropping from 18.26% in 2007 to 6.65% in 2008. Interestingly, Claims Incurred as a ratio of Gross Premiums reduced slightly from 20.67% to 19.77% in 2008; Operating Expenses increased by 58.75% year-on-year with an increasing wage bill and depreciation of fixed assets the major contributors, hence the decline in profit after tax. The company should therefore seek ways of reducing its operational expenses as well as management expenses in order to boost profitability.

63BGL Insurance Report | January 2010
Perfomance Ratios (Margin) 2004 2005 2006 2007 2008
Change in Gross Premium 33.46% -17.07% 77.43% 165.00% 43.67%
Net Premium Margin 87.00% 84.34% 88.85% 49.05% 41.45%
Premium Earned/Gross Premium 60.32% 77.02% 72.32% 47.19% 35.01%
Claims incurred/Gross Premium 22.82% 29.20% 31.01% 20.76% 19.77%
Underwriting Profit Margin 21.81% 25.27% 22.08% 18.26% 6.65%
Cost to Income Ratio 60.00% 62.81% 66.48% 44.64% 72.47%
Pretax Profit Margin 13.13% 22.63% 10.96% 8.00% 5.79%
ROAE 14.89% 15.90% 7.36% 7.42% 6.54%
ROAA 6.47% 7.10% 3.89% 4.64% 3.58%
EPS 0.44 0.33 0.13 0.21 0.21
DPS -0.13 -0.06 -0.16 -0.02 -0.06
Operating Profit per Employee 3,610 4,388 6,562 13,312 11,196
Underwriting Expenses per Employee (2,148) (2,553) (4,102) (5,718) (5,914)
Asset Quality Ratios 2004 2005 2006 2007 2008
Investment Income/Investments 3.60% 9.72% 8.70% 5.82% 17.06%
Effective Return on Investment 3.60% 7.61% 5.63% 5.82% 17.06%
Cost of Bad and Doubtful Loans 0.00% 1.09% 0.29% 62.59% 6.16%
Capital Adequacy Ratios 2004 2005 2006 2007 2008
Gross Premium/Insurance Funds 14.83 2.46 3.39 2.80 3.74
Debt/Equity Ratio 0.50 0.64 0.83 0.42 0.45
Equity/Total Assets 0.67 0.61 0.55 0.71 0.69
Financial Ratios
One key strategy has been portfolio diversification across business lines to mitigate risks and boost returns. The company maintains its assets in the securities of quoted and unquoted companies. With an asset size of about N28.23 billion, it earned a larger portion of Income from the sale of investments.
Business StrategyUndoubtedly Leadway’s leadership position in the industry is coming under le-gitimate threat from competitors; for the most part from bank-owned insurance companies riding on the banc assurance strategy. In addition traditional non-bank owned competitors like IGI and AIICO Insurance, are showing serious intent to take over the competitive landscape using the banc assurance model and low cost strat-egy. However, Leadway’s good relationship with insurance brokers who generated about 70% of its business is an advantage that could be explored further.

64 BGL Insurance Report | January 2010
Contribution to Gross Premium (2008)
Motor
16%Fire
7%
General
Accident
6%
Oil & Gas
54%
Life
9%
Engineering
2%
Marine
3%
W/MComp.
1%
Bond
2%
Also, enjoying the strength of its brand and its leadership position in other classes of insurance notably Motor and Life Insurance, Leadway should also use its industry know-how to take advantage of the local content policy in 2010 to grow its busi-ness in Oil and Gas and Infrastructure while also improving on its current product designs and flexibility.

65BGL Insurance Report | January 2010
Mutual Benefits Assurance Plc
Corporate ProfileMutual Benefits Assurance Plc was incorporated as a private limited liability com-pany on April 18th, 1995 and commenced operations on 2nd October of the same year, growing to become a public liability company on 24th May, 2001 – within 6 years of operations.
Mutual Benefits Assurance Plc is registered as a Composite insurer transacting Life and General Insurance business with an Authorised Share Capital of N5 billon and a fully Paid-up Share Capital of N4 billion. The company, which started with Paid-up Share Capital of N20m in 1995, now boasts of Shareholders’ Funds of N7.08 billion.
CIL Risks &
Assets
Management
22%
Arubiewa
Farms Ltd
6%
Akin
Ogunbiyi
5%
Others
67%
Shareholding Structure
Board of Directors Name PositionChief Chamberlain Oyibo ChairmanMr. Akin Opeodu Vice ChairmanMr. Akin Ogunbiyi Group Managing DirectorMr. Godspower Agofure Chief Operating officerMr. Adesoye olatunji Executive DirectorMr. Dipo Owolabi Executive DirectorMr. Gbenga Ogunko Executive DirectorDr. M.O. Ajaja DirectorMrs. I.Z. Aret-Adams DirectorChief Ladi Rotimi-Williams (SAN) DirectorMr. Fisayo Oyedeji DirectorProf. Pat Utomi DirectorMr. David Balogun DirectorMr. Micheal Govan DirectorAmb. Hans H. Hertell Director

66 BGL Insurance Report | January 2010
Performance AnalysisThe company grew Gross Premium by 290% between 2003 and 2008. Increased performance can be observed as there was a sharp rise of 76.86% between 2005 and 2006 followed by a decrease in average of 9.21% ands 40.77% in 2007 and 2008. This can be related to challenges from the global economic environment as there was pressure on interest rates, inflation and exchange rates. Net premium and Premium earned for the period rose accordingly in relation to gross premium, at N2.16 billion in 2008 from N550m in 2003 indicating a change of 294%.
Profit after tax increased from N58m in 2003 to about N1 billion in 2007, growth of about 1660%, after which a loss of N1.5 billion was recorded in 2008. This decline is attributed to the provision made regarding diminution in value of quoted invest-ments. Profit before tax followed the same pattern growing from N75m in 2003 to N1.2 billion in 2007. Return on Equity fluctuated over the period under review with 28.26% in 2004, 16.74% in 2005 and a negative ROE of (19.44%) in 2008. Claims as a percentage of Gross Premium in 2008 was 15.37% down from 17.32% in 2007. Mutual Benefit’s investment strategy seems sub-optimal as Yield on Investment was a meagre 1.97% and 1.72% in 2005 and 2006 respectively despite increase in investment over the years. There may be a need to review the investment mix as almost all the investments were long term. Earnings per Share grew year on year from N0.10 in 2003 to N0.37 in 2006, it then dropped to N0.13 in 2007. In 2008, the company made a loss per share of N0.19. PBT/Staff improved consistently during the period under review; however it reduced considerably to N5.4m in 2008 from N7.6m in 2007. Cost/Staff was also brought down to a comfortable margin against the PBT/Staff.
2004
2005
2006
2007
2008
0
N'000
1,000,000500,000 1,500,000 2,000,000 2,500,000
Gross Premium
2004
2005
2006
2007
2008
0
N'000
10,000,0002,000,000 4,000,000 6,000,000 8,000,000
Shareholders’ Fund
Gross Premium Shareholders’ Fund

67BGL Insurance Report | January 2010
Investment Income/PBT decreased from 42.51% in 2003 to 42.33% in 2007, with a sharp fall to 22.25% in 2008. A significant improvement in Investment Income would cause an increase in the company’s Net Earnings. Cost to Income showed a steady reduction from 49.64% in 2003 to 27.31% in 2007. The company appeared to have improved on its cost saving strategies except for the challenges faced in 2008 which pushed up the ratio to 50.03%. It is however imperative that Mutual Benefits keeps the percentage as low as possible in the face of intense competition in order to enhance its growth prospects.
As the company grew Shareholders’ Funds from N414.2m in 2003 to N7.08 billion in 2008, representing an increase of 1,609%, Shareholders’ Fund/Total Assets also continued to improve, up to 71.29% in 2008 from 40.03% in 2003. Gross Premium covered Insurance Fund 2.79 times in 2008 from a cover of 2.24 in 2003.
The aggressive pursuit of excellence is paying off as the company grows all its indices. By the end of 2008, it grew its Premium to N3.6 billion and reported Net Earnings of N2.1 billion.
Stock Market AnalysisContrary to the experience of most insurance stocks on the Capital Market whose share price grew more than 500% within 3 months in 2007, the price of Mutual Benefit’s stock which declined throughout mid to late-2007 grew only about 30% reaching an all time high of N5.98 in March 2008. The stock has since succumbed to the bearish mood of the market shedding all its gains since the beginning of the year.
Perfomance Ratios (Margin) 2004 2005 2006 2007 2008
Change in Gross Premium 30.63% 9.88% 76.86% 9.21% 40.77%
Net Premium Margin 100.00% 98.81% 99.17% 92.44% 92.57%
Premium Earned/Gross Premium 81.76% 102.52% 83.32% 98.61% 89.64%
Claims incurred/Gross Premium 19.32% 24.06% 10.61% 17.32% 15.37%
Underwriting Profit Margin 58.70% 66.80% 69.42% 76.37% 66.64%
Cost to Income Ratio 46% 37% 24% 27% 50%
Pretax Profit Margin 25.03% 27.80% 48.70% 73.19% -64.42%
ROAE 28.26% 16.74% 23.36% 16.02% -19.44%
ROAA 11.34% 9.94% 17.39% 13.01% -15.01%
EPS 0.45 0.42 0.74 0.36 -0.55
DPS 0.12 0.00 0.00 0.00 0.00
Asset Quality Ratios 2004 2005 2006 2007 2008Investment Income/Investments 3.43% 1.76% 1.61% 47.37% 19.46%Effective Return on Investment 3.43% 1.76% 1.61% 47.37% -136.58%Cost of Bad and Doubtful Loans 0.00% 0.00% 0.00% 0.00% 0.00%Capital Adequacy Ratios 2004 2005 2006 2007 2008Gross Premium/Insurance Funds 2.01 2.09 2.29 2.45 2.79Debt/Equity Ratio 1.49 0.47 0.28 0.21 0.40Equity/Total Assets 0.40 0.68 0.78 0.83 0.71
Financial Ratios

68 BGL Insurance Report | January 2010
0
20
40
60
80
100
120
Price v Index (% Change 2009)
NSE Index Price
Business StrategyThe acclaimed ‘Best Run Insurance Company in Nigeria 2006-2007’ built its success over the years focusing on General Insurance businesses of General Accident, Marine and Aviation, and Life Insurance. With increasing focus on the emerging Oil & Gas and Infrastructure sectors, there may be some gaps in servicing the other sectors in which Mutual Benefit could create a niche by churning out innovative products to attract premium clients. This does not prevent the company from participating in the large transactions of the new sectors.
Life & Pension
35%
Motor
31%
Marine
7%
Fire
4%
General
accident
23%
Contribution to Gross Premium
Price v Index (% Change 2009)

69BGL Insurance Report | January 2010
Niger Insurance Plc
Company ProfileNiger Insurance Plc was established in August 1962 as a specialist Life company under the name Yorkshire Insurance Company. As a result of the Federal Govern-ment’s indigenisation of foreign owned companies, the company was acquired by the then state owned NICON.
In 2002, during the wave of privatisation of government owned companies, NICON’s 29% share of ownership was acquired through an MBO by Management Alliance Company Limited (MACL). MACL was established by the company management and other leading shareholders. As at December 2008, MACL’s shareholding dropped to 18%. Other shareholders are Fidelity Finance Company Ltd (10%) and Chrome Oil Services (13%) with Goldust Investment Ltd no longer a share holder. The remaining 59% are held by other Nigerian corporate and individual investors.
Management
Alliance Co. Ltd.
18%Fidelity
Finance
Company
Ltd
10%
Chrome Oil
Services
13%Other Nigerian
Institution and
Association
59%
Shareholding Structure
Niger Insurance has 3 subsidiaries with a 100% holding in each. These are NIC Properties Ltd, NIC Securities and Trust Ltd and River Plaza and Mall Ltd. The com-pany had over N18.7 billion in Assets in 2008 compared to N13.7 billion in 2007 but their Shareholders’ Funds of N5.7 billion in 2008 represented a decline from N6.4 billion in 2007.
Niger Insurance has maintained a relatively stable Board of Directors and a well defined succession plan. With the exit of P.M.G Soares in May 2003 following the exit of NICON, the incumbent Chief Executive upon retirement occupies the position of Board Chairman. This has led to relative stability on the board and even the entry of new institutional investors has not distorted this arrangement. All the institutional investors with over 3.5% holdings in the company are represented on the board except Fidelity Finance Company Ltd despite its 10% holding.

70 BGL Insurance Report | January 2010
Names Position Shareholding Bala Zakariya’u Chairman 77,229,140 Justus Clinton Uranta Managing Director/CEO 31,395,458 Dauda Kolapo Adedeji Executive Director 14,901,660 Andrew Onyenweuwa Nwaujo Executive Director 4,406,610 Osa Osunde Director 113,333,603 Idris Onaolapo Sulaimon Director 138,928,520 Frederick Nnamdi Udechukwu (Chrome Oil Services - Indirect) Director 497,255,915 Aminu Abubakar (Goldust Investment Ltd. - Indirect) Director (retired wef 21 April 2009) 79,138,391 Yusuf Hamisu Abubakar Director (retired wef 21 April 2009) N/A Jibrin Isah (AIL Securities Ltd. - Indirect) Director 380,127,003
Having recognised the dearth of Insurance presence outside Nigeria’s highly popu-lated urban areas, the company has gone ahead of its competitors to open upcountry locations. Niger Insurance plans to continue using geographic spread to outpace competitors. In fulfilling this objective, it has established about 40 branches across Nigeria. Regional offices are designed to allow considerable autonomy in decisions aimed at solving clients’ problems at even local levels. States previously uncovered by Niger Insurance have been given priority in the location of new branches.
In reaction to the global spread of bancassurance and its latent competitive edge, Niger Insurance Plc and Afribank Plc now possess a “strategic alliance” that would allow the two firms transact banking and assurance businesses jointly, using their various branch networks. Negotiations on the alliance have been on for the past couple of months between top officials of both firms on how to jointly deploy the huge capital base and human capital of the two companies to grow businesses and ensure higher returns to investors.
The major strategic thrust of the alliance would be to assist the two firms cut cost in their businesses, as common branches would be floated by the firms. Under the arrangement, Afribank would market the insurance products of Niger Insurance.
In March 2008, Niger Insurance raised a sum of N480m through a private placement of 181.13m ordinary shares of 50k each at N2.65 per share to Fidelity Finance Com-pany Limited. The offer was for the injection of additional equity towards meeting a deficit in the company’s shareholders funds as directed by NAICOM.
Performance AnalysisAlthough Niger Insurance grew her Gross Premium at an average rate of 25% yearly from N1.43 billion in 2002 to N3.14 billion in 2006, Gross premium dropped to about N2.49 billion in 2007 only to grow by more than 100% to N5.3 billion in 2008. Gross Premium only grew by 12% and 10% in 2004 and 2005 respectively, possibly as a result of the post NICON divestment. Shareholders’ funds on the other hand seemed to increase consistently only to dip slightly in 2008 by about 11% (N5.7 billion) due to the mark to market restrictions which were compelled by the bearish trends in the global market as a whole and the Nigerian market more specifically. This trend is further established when one notices the roughly 164% rise in 2006 of which recapitalisation also had significant input in.
Board of Directors

71BGL Insurance Report | January 2010
2004
2005
2006
2007
2008
2003
N'000
2,000,0001,000,000 3,000,000 4,000,000 5,000,000 6,000,0000
Gross Premium
2004
2005
2006
2007
2008
2003
0
N'000
2,000,000 4,000,000 6,000,000 8,000,000
Shareholders’ Fund
In line with the current financial crisis, performance ratios - return on assets, return on equities, earnings per share, dividend per share dipped in 2008, these are however clear signs of mark to market and a look at the change in gross premium, premium margin and operating profit per employee would reveal growth and a potential to pivot back to competitiveness once the overriding issues of the global meltdown can be gotten over.
Cost to income ratio, which had been reducing consistently in the last 5 years rose to about 76.71% in 2008 from 61.3% in 2007 showing a need for the company to look at their costs without necessarily affecting their liquidity.
Gross Premium Shareholders’ Fund
Perfomance Ratios (Margin) 2004 2005 2006 2007 2008
Change in Gross Premium 11.42% 11.93% 134.82% -20.68% 113.88%
Net Premium Margin 76.87% 75.01% 53.03% 76.53% 82.77%
Premium Earned/Gross Premium 74.15% 73.82% 52.15% 73.79% 80.06%
Claims incurred/Gross Premium 16.23% 13.86% 7.06% 13.05% 13.65%
Underwriting Profit Margin 41.36% 47.73% 36.49% 53.51% 45.76%
Cost to Income Ratio 58.67% 61.66% 53.07% 61.30% 76.71%
Pretax Profit Margin 25.24% 24.18% 23.92% 33.55% 1.20%
ROAE 17.15% 14.50% 15.48% 10.98% -2.44%
ROAA 3.46% 3.43% 5.99% 5.27% -0.91%
EPS 0.27 0.19 0.19 0.17 - 0.04
DPS 0.20 0.05 0.15 0.15 -
Operating Profit per Employee 1,289 1,544 2,636 3,499 6,046
Underwriting Expenses per Employee (403) (322) (508) (317) (2,961)
Asset Quality Ratios 2004 2005 2006 2007 2008Investment Income/Investments 2.09% 2.42% 1.88% 5.43% -0.71%Effective Return on Investment 2.09% 2.42% 1.88% 5.43% -0.71%Cost of Bad and Doubtful Loans 0.99% 1.16% 3.30% 8.37% 3.61%Capital Adequacy Ratios 2004 2005 2006 2007 2008Gross Premium/Insurance Funds 1.01 1.11 2.38 1.48 3.03Debt/Equity Ratio 3.41 3.07 1.02 1.13 2.28Equity/Total Assets 0.23 0.25 0.49 0.47 0.30
Financial Ratios
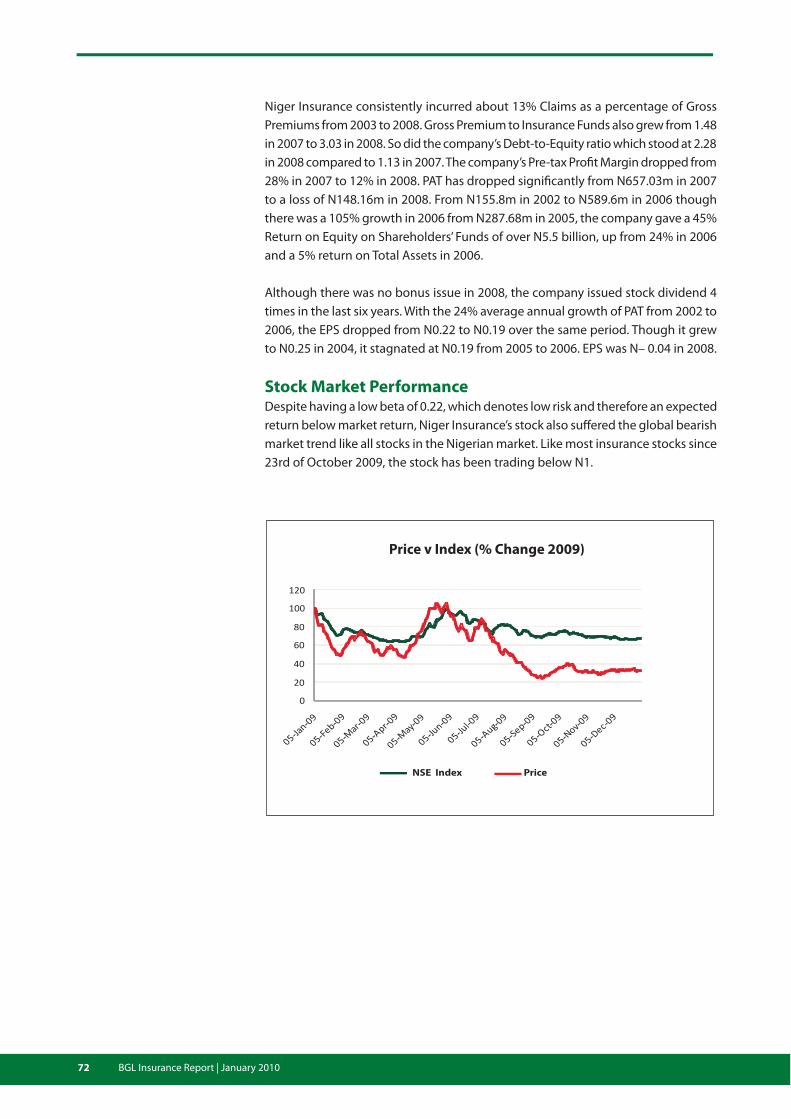
72 BGL Insurance Report | January 2010
Niger Insurance consistently incurred about 13% Claims as a percentage of Gross Premiums from 2003 to 2008. Gross Premium to Insurance Funds also grew from 1.48 in 2007 to 3.03 in 2008. So did the company’s Debt-to-Equity ratio which stood at 2.28 in 2008 compared to 1.13 in 2007. The company’s Pre-tax Profit Margin dropped from 28% in 2007 to 12% in 2008. PAT has dropped significantly from N657.03m in 2007 to a loss of N148.16m in 2008. From N155.8m in 2002 to N589.6m in 2006 though there was a 105% growth in 2006 from N287.68m in 2005, the company gave a 45% Return on Equity on Shareholders’ Funds of over N5.5 billion, up from 24% in 2006 and a 5% return on Total Assets in 2006.
Although there was no bonus issue in 2008, the company issued stock dividend 4 times in the last six years. With the 24% average annual growth of PAT from 2002 to 2006, the EPS dropped from N0.22 to N0.19 over the same period. Though it grew to N0.25 in 2004, it stagnated at N0.19 from 2005 to 2006. EPS was N– 0.04 in 2008.
Stock Market PerformanceDespite having a low beta of 0.22, which denotes low risk and therefore an expected return below market return, Niger Insurance’s stock also suffered the global bearish market trend like all stocks in the Nigerian market. Like most insurance stocks since 23rd of October 2009, the stock has been trading below N1.
0
20
40
60
80
100
120
Price v Index (% Change 2009)
NSE Index Price
Price v Index (% Change 2009)

73BGL Insurance Report | January 2010
Business StrategyNiger Insurance is one of the major players in the insurance industry. Its key business strategy has been to ride on its strengths as an industry giant, depending largely on its old winning formulas. With the increasing competition in the industry, Niger Insurance needs to take more strategic steps to grow its business. The adoption of the bancassurance strategy will complement its geographical spread to serve the underserved retail segments and thus generate more income. Another key business strategy to pursue vigorously is the diversification of its investments from its core insurance business into other burgeoning sectors to achieve maximum returns to shareholders. This is an area in which the company has excelled in recent times; Investment Income accounted for an average of 40% of PBT in the last five years until 2008 when the investment income dropped to a loss of N66.7m – arguably as a result of the global meltdown. Diversifying into other insurance classes like Infra-structure and Real Estate will significantly improve returns. As we projected in the last report, reduction in patronage by government agencies and parastatals due to NICON’s disinvestment and the bullish penetration of the market by hitherto small insurance companies now recapitalised to fund ambitious expansion plans may be the reasons behind the downturn seen in the company’s financial statements.
The industry giant has excelled in Life Insurance which accounts for about 45% of gross premium, Burglary and Accident accounts for about 23%.
Burglary, Fidelity
and Miscellaneous
20.76%
Workmen’s
Compensation
1.43%
Marine, Aviation
and Transit
5.40%
Motor Vehicles
18.02%
Accident
2.48%
Fire
6.84%
Life
45.08%
Contribution to Gross Premium

74 BGL Insurance Report | January 2010
Oasis Insurance Plc
Company ProfileOasis Insurance Plc (Oasis) was incorporated on November 9th, 1992 and is licensed to transact General and Life Insurance business. Oasis currently has about 14 branches as well as a subsidiary – Oasis Asset Management Limited.
In 2006, there was a disinvestment by the then majority shareholder – Trustees of Wema Bank Staff Retirement Pension Fund (Wema) of its 40.91% holding in Oasis Insurance. This was initially taken up by Oasis Group Limited thereby increasing its shareholding to 77.01%. By the end of 2008, Oasis Group Limited owned 26.25% of Oasis Insurance, Harmony Trust and Investment Company Ltd had a 9.99% holding, Mrs. S.O.B. Lulu-Briggs had 10% while other Nigerian institutional and individual investors owned the remaining 53.76%.
Oasis Group
Limited
26%
Harmony
Trust and
Investment
Ltd
10%
Mrs. S.O.B.
Lulu-Briggs
10%
Other Nigerian
Shareholders
54%
The company has authorised share capital of N5 billion made up of 10 billion Ordi-nary Shares of which 5billion shares (N2.5billion share capital) are issued and fully paid. Oasis Insurance was listed on the Nigerian Stock Exchange (NSE) on 24th July, 2007 at N1.83 per share.
Board of Directors Name Position
Chief S.I. Adegbite, OFR Chairman
B.O. Oshadiya Managing Director
O.O Fowora Executive Director
Mrs. Seinye O.B. Lulu-Briggs Director
Chief J.A. Odeyemi, MFR Director
M.O. Sofela Director
O. Okeowo Director
A.G. Adegbite Director
AVM Nura Iman (Rtd), CFR Director
Shareholding Structure

75BGL Insurance Report | January 2010
Performance AnalysisOasis Insurance has recorded a five-year average growth of 7.26% in Gross Premium in an industry characterised with double and triple digit year on year growth. Gross Premium had been on the rise from 2003 to 2005 growing from N348m to N573.7m over the period before the 49% plunge in 2006. The decline was attributed to the twin factors of the divestment of Wema Bank through its Trustees of Wema Bank Staff Retirement Pension Fund prior to which Oasis Insurance had enjoyed signifi-cant business flows from the Bank and the regulatory induced recapitalisation in the insurance sector that left 49 firms surviving out of 103 which led to a crisis of confidence with perceived fringe players the most affected. Between 2006 and 2007, Gross Premiums dipped by 5.34%, from N292m to N277m before rising to N558m in 2008 (a growth of 100.58%) as the company stabilises after the industry recapitalisation.
400,000200,000 600,000 800,0000
N'000
2004
2005
2006
2007
2008
Gross PremiumGross Premium Shareholders’ Fund
In January 2007, the life business was discontinued and transferred to Capital Express Assurance Limited with N6.6m paid for liability transfer. The life insurance business was a hindrance to Oasis Insurance as it had a negative impact on its profits; this was regardless of the enthusiasm caused by the Pension Reform Act of 2004. Insurance Claims settled as a ratio of Gross Premium dropped from its five-year high of 30.33% in 2006 to 16.58% and 10.42% in 2007 and 2008 respectively while Claims paid on Motor insurance stood at 15.90%, the highest of the non life insurance segment, above Fire Insurance (0.80%) and Marine Insurance (2.14%).
The company’s Pre-tax profit for 2007 was N183m which increased by 66.30% when compared with 2006. However, there was a Pre-tax loss of N829m with a margin of -148.57% for 2008. This is due to the loss suffered as a result of substantial diminu-tion in value of investment which had to be charged against profit of the year in line with the requirement of the relevant accounting standard as well as the National Insurance Commission (NAICOM).
2004
2005
2006
2007
2008
0
N'000
3,000,0001,500,000 4,500,000
Shareholders’ Fund

76 BGL Insurance Report | January 2010
Performance Ratios (Margin) 2004 2005 2006 2007 2008
Change in Gross Premium 48.47% 10.99% -48.97% -5.34% 101.48%
Net Premium Margin 79.05% 67.08% 71.04% 92.69% 81.63%
Premium Earned/Gross Premium 66.06% 80.99% 83.25% 98.20% 60.06%
Claims incurred/Gross Premium 8.49% 25.39% 30.33% 16.58% 10.42%
Underwriting Profit Margin 40.60% 38.72% 69.75% 65.36% 32.09%
Cost to Income Ratio 54.41% 46.46% 73.01% 75.72% 115.35%
Pre-tax Profit Margin 31.04% 26.17% 45.17% 66.30% -148.57%
ROAE 45.38% 21.06% 16.20% 6.58% -25.80%
ROAA 24.78% 11.74% 10.19% 5.77% -23.23%
EPS 0.16 0.11 0.10 0.03 -0.17
DPS 0.06 0.07 0.07 0.02 -
Operating Profit per Employee 5,198 5,613 5,162 6,479 8,269
Underwriting Expenses per Employee (1,409) (1,631) (875) (877) (2,178)
Asset Quality Ratios 2004 2005 2006 2007 2008
Investment Income/Investments 15.84% 13.31% 16.38% 7.50% 9.69%
Effective Return on Investment 9.40% 6.70% 11.76% 6.00% -38.75%
Cost of Bad and Doubtful Loans 13.27% 13.08% 4.58% 7.88% 33.31%
Capital Adequacy Ratios 2004 2005 2006 2007 2008
Gross Premium/Insurance Funds 1.76 2.11 2.80 2.30 3.29
Debt/Equity Ratio 0.83 0.77 0.43 0.08 0.15
Equity/Total Assets 0.55 0.57 0.70 0.93 0.87
Total Assets for the company declined by 3.41% in 2008, from N3.71m (2007) to N3.58m. Previously, the company had invested a total of N979.6m representing about 40% of Total Investments in Liquid Investments with non-bank financial institutions. While Total Investments increased from N488.7m in 2003 to N2.45 billion in 2007, a CAGR of 38%, Yield on Investment dipped from 19.31% to 7.50% over the same period.
Stock Market AnalysisThe company was listed on the NSE on 24th July, 2007 at N1.83 and closed trading that year at N2.36, price appreciation of 29%. It enjoyed a more bullish run in 2008, opening trading at N2.47, and appreciating 120% before being placed on Techni-cal Suspension on 25th March 2008 at N5.43 upon an application to the NSE for fresh capital raising. The share price of Oasis Insurance thereafter succumbed to the bearish trend in the market since the suspension was lifted in February 2009, falling to N1.49 by December 31, 2009.
Ratios & Analysis

77BGL Insurance Report | January 2010
0
20
40
60
80
100
120
Price v Index (% Change 2009)
NSE Index Price
Business StrategyHaving relied greatly on its relationship with Wema Bank, the disinvestment of which impacted negatively on Income growth, it appears that the company’s best strategy will be a bancassurance idea using the relationship to service corporate customers of the partner bank, and a strategic focus on branch network expansion to reach out to the retail segment on a broader perspective.Since the company is an even player in most of the classes of insurance, it is also necessary to seek greater strength in some of the classes of business in which it has a competitive advantage.
Price v Index (% Change 2009)

78 BGL Insurance Report | January 2010
Prestige Assurance Plc
Company ProfilePrestige Assurance Plc was established as a branch of the New India Assurance Co. Ltd., Mumbai, India in 1952 and later became a full subsidiary company in 1970. Following the indigenisation decree of 1977, the New India’s holding was reduced to 40% and the name changed to Prestige Assurance Plc in 1980.
The New India Assurance’s shareholding increased to 47.87% in 2004 (due to a change in regulation), and later to 51% in March 2007 during the public offering. Leadway Assurance has a 12.3% holding in Prestige Assurance while 36.68% represents a disperse holding.
New India
Assurance
Company Ltd,
51.00%
Leadway
Assurance
Company Ltd,
12.32%
Free float,
36.68%
Shareholding Structure
Leveraging on its Indian roots (from its largest shareholder); the company has the privilege of insuring lots of business origination from India and is thus referred to as a ‘captive insurer’ for businesses originating directly or indirectly from India.
Prestige Assurance scaled through the recapitalisation hurdle on a stand alone basis, choosing not to engage in merger talks with any other insurance company. With the successful conclusion of the July 2006 capital raising exercise through a N1.7 billion Public Offer in which the company recorded an impressive 153.76% subscription level (New India Assurance took up 54.5% of the shares on offer), Prestige Assurance’s Shareholders’ Funds stood at N3.62 billion. This made the company adequately capitalised for its chosen General Insurance business ahead of the February 2007 deadline. The company currently has Shareholders’ Funds of N4.37 billion.

79BGL Insurance Report | January 2010
Name Position
Chief (Dr.) C. S. Sankey Chairman
Mr. Yugandhara R. Sunkara Managing Director
Mr. J. O. Adewole Director
Mr. O. Hassan-Odukale, MFR Director
Chief H. B. Chanrai Director
Mr. B. Chakrabarti – Indian Director
Mr. Ramesh Hathiramani Director
Mr. J. Kumar Gupta Director
Mr. Hassan T. M. Usman Director
Mr. J. Venkatakrishna Director
Mr. Inderjit S. Phukela Director
Performance AnalysisAmidst the market downturn, Prestige grew Gross Premium from N2.26 billion in 2007 to N3 billion in 2008, representing an increase of 33% while 5 year CAGR reflects 27% growth. Gross premium growth was mainly buoyed by the 98% and 41% growth in Marine and Aviation insurance and General Accident insurance respectively. Fire insurance continued to hold its dominant position as the leading business line of Prestige Assurance with a 36% contribution to Gross Premiums in 2008 (42%, 2007).
2004
2005
2006
2007
2008
2,000,0001,000,000 3,000,000 4,000,000
N'000
Gross Premium
Board of Directors
Shareholders’ FundGross Premium
Shareholders’ Fund
2004
2005
2006
2007
2008
2,000,0001,000,000 3,000,000 4,000,000 5,000,000
N'000

80 BGL Insurance Report | January 2010
Return on Average Equity (ROAE) which had its highest year-on-year fall in 2006 when it dropped by 5.64% to 16.17% from 21.81% in 2005, seems to have attained relative stability between 15% and 16% in the three years from 2006 to 2008 with an average ROAE of 15.76%. ROAE in 2008 was 15.72%. The company’s investment strategy paid off as the Yield on Investment was quite impressive in 2008 despite the downturn in the equity market. Although it fell from a five year high of 30.83% in 2005 to about 19% in 2007, Yields on Investment hit 28.30% in 2008, a moderate 2.5% shortfall from the five year high of 2005. Growth in Investment Yields amidst the equity market downturn was achieved on the back of Prestige Assurance’s port-folio diversification strategy which favours Government Fixed Income securities and other money market instruments over quoted securities. In 2007, the company’s total investment portfolio showed a portfolio mix of 64% in the money market and fixed income instruments and 36% in equities. In 2008 Prestige reduced its stake in the equity market to 29% and increased investments in money market and fixed income instruments to 71%. Despite the reduction in its equity holding, Prestige still recorded N670m diminution in value on its equities portfolio.
Claims as a percentage of Gross Premium increased by about 5% in 2008 to 11.85% from 6.67% the previous year; a result of the year-on-year growth in Claims Incurred outstripping Gross Premium. Gross Premium increased by 33% in 2008 while Claims Incurred increased significantly by 136%.
Despite impressive PAT growth of 12% in 2008, EPS dropped by 11% in 2008 to N0.33 from N0.37 in 2007. This is as a result of the dilutive effect of Bonus Stock Dividends of 1 for 4 declared for 2007 FYE which increased outstanding shares to 2.14 billion from 1.72 billion. In addition, Dividend Payouts increased in 2008 to 60% of PAT from 54% in 2007 thus reduced the retained earnings. However DPS remained constant at N0.15 in 2008 despite higher dividend payout which is also due to the dilutive effect of the Bonus Stock Dividends. In terms of Staff Productivity, Operating Profit per employee dropped in 2008 by 7% but so did Underwriting expenses per employee, with a 12% drop in 2008 from 2007.
Underwriting Profit Margin which infers the ratio of Underwriting Profit to Gross Pre-mium dropped from 31.2% in 2007 to 27.25%. However, management in recognising the difficulties of increasing the company’s bottom-line in 2008, placed substantial focus on cost reduction strategies. This translated to the 10% drop in Cost to Income ratio (using cost to premium earned as the basis) from 93% in 2007 to 83% in 2008.
Both Underwriting Profit and Investment Income grew consistently between 2004 and 2008. While Underwriting Profit rose from N213.7.1m in 2004 to N819.7m in 2008, an increase of over 280% within the 5-year period, Investment Income rose from N322.37m to N911.47m over the same period, representing an increase of over 180%. Pre-tax Profits have grown by a 5 year CAGR of 26% from N311.9m in 2004 to N990m in 2008 with the least annual growth of 10% occurring in 2008.
Return on Average Assets (ROAA) has been relatively stable over the last five years, hovering between 11.5% and 12.8% in the five years from 2004 to 2008 and averag-ing 11.77% over the period. There was modest year on year growth in ROAA in 2008 when it increased by 0.16% to 11.64% from 11.48% in 2007.

81BGL Insurance Report | January 2010
The company’s capital adequacy ratios reflect the management’s ability to maintain stability. In 2008, the ratio of Gross Premium to Insurance Fund increased marginally to 6.66 from 6.59 while the Total Liabilities to Equity ratio increased slightly to 0.36 in 2008 from 0.34 in 2007. Equity to Total Assets, which remained flat from 2006 to 2007 declined slightly to 0.73 in 2008.
Asset Quality Ratios 2004 2005 2006 2007 2008
Investment Income/Investments 26.28% 30.83% 15.97% 19.00% 28.30%
Effective Return on Investment 22.22% 26.72% 14.32% 16.74% 23.78%
Cost of Bad and Doubtful Loans 13.54% 7.73% 5.26% 7.07% 9.15%
Capital Adequacy Ratios 2004 2005 2006 2007 2008
Gross Premium/Insurance Funds 3.58 4.72 5.16 6.59 6.66
Debt/Equity Ratio 0.75 0.68 0.34 0.34 0.36
Equity/Total Assets 0.57 0.60 0.75 0.75 0.73
Financial Ratios Performance Ratios (Margin) 2004 2005 2006 2007 2008Change in Gross Premium 23.30% 40.46% 21.28% 46.89% 33.07%Net Premium Margin 41.39% 70.10% 40.80% 52.23% 52.39%Premium Earned/Gross Premium 38.09% 69.43% 39.53% 51.45% 50.93%Claims incurred/Gross Premium 6.43% 14.91% 11.09% 6.67% 11.85%Underwriting Profit Margin 23.65% 27.62% 31.44% 31.20% 27.25%Cost to Income Ratio 118.99% 92.28% 83.07% 93.43% 83.63%Pre-tax Profit Margin 34.53% 33.43% 39.02% 39.88% 32.91%ROAE 20.58% 21.81% 16.17% 15.38% 15.72%ROAA 11.68% 12.76% 11.28% 11.48% 11.64%EPS 0.41 0.39 0.26 0.37 0.33 DPS 0.11 0.12 - - - Operating Profit per Employee 8,378 11,182 14,303 21,134 19,716Underwriting Expenses per Employee (3,674) (4,503) (6,031) (8,978) (7,862)
Business Prospect Prestige Assurance could expand its business scope by riding on the back of the Lo-cal Content Policy for Oil and Gas insurance. When compared to peers like Leadway and GTA where Oil and Gas insurance contributed 59% and 27% respectively to Gross Premiums, Prestige Assurance will need to develop its Oil and Gas insurance desk. We see great prospects for Prestige Assurance in life insurance business if it can deploy the strength of its brand into retail insurance. Bancassurance could also provide great prospects for Prestige Assurance if it can partner with a bank which currently has no insurance subsidiary.
Business StrategyMajority of the insurance companies in Nigeria derive their income from Motor Insurance and this is due to the high statutory enforcement of vehicle insurance. However Motor Insurance accounted for only 10% of Prestige Assurance’s Gross Premium as at December 2008. Due to the company’s strong alliances with the large Indian business community in Nigeria, Prestige Assurance maintains strong non-involvement in life insurance.

82 BGL Insurance Report | January 2010
Motor
10%
Fire
36%
General Accident
26%
Marine & Aviation
27%
W/M Comp
1%
Contribution to Gross Premium (2008)
focus on corporates in the real sector of the economy. Thus Fire insurance maintained its flagship position, accounting for 36% of Gross Premiums. Marine and Accident insurance accounted for 27% of Gross Premiums and General Accident Insurance for 26%. We believe the company’s poor retail strategy is as result of its

83BGL Insurance Report | January 2010
Sovereign Trust Insurance Plc
Company ProfileSovereign Trust Insurance Plc commenced business in January 1995 with an authorised share capital of N30m and a fully paid-up capital of N20m following the acquisition and recapitalisation of the then Grand Union Assurances Limited. The company is licensed as an insurer by the Federal Government with authority to underwrite all classes of Non-Life insurance and currently operates through a network of 19 branches located in Apapa, Ikeja, Lagos Island, Surulere, Yenogoa, Calabar, Enugu, Umuahia, Aba, Benin, Asaba, Jos, Ado-Ekiti, Port Harcourt, Akure, Ibadan and Abuja. The head office is located in Victoria Island, Lagos.
With current Shareholders’ Funds of about N4.6 billion, making it adequately capi-talised for its chosen General Insurance line of business, the company is owned by diverse shareholders represented by 11 directors on the board.
Bayelsa State
Government
18%
Murphy Shipping &
Comm. Services
7%
Sick
Nigeria
Limited
6%
TEEOF Holdings
Limited
11%
TWSN Limited
6%
Others
52%
Shareholding Structure
Sovereign Trust has a very lofty vision of being a leading brand, providing insurance and financial services of global standards. Its mission of enhancing the everyday life of customers through innovative services to create exceptional value for stake-holders led to the deployment of technology for easy reach and seamless service delivery to its clients.
Following the recapitalisation exercise in which the company merged with 3 other insurance companies namely Coral Insurance, Confidence Insurance and Prime Trust Insurance, Sovereign Trust Insurance Plc received an A- rating from Global Credit Rating Ltd., an international financial rating agency. The A- rating attests to the company’s high claims paying ability in the industry. The considerations for the rating included its business mix across the risk classes, high profile multinational Oil and Gas clients, increased underwriting capacity strengthened by the new capital base and the geographical diversification benefits gained from the merger partners during the recapitalisation process.

84 BGL Insurance Report | January 2010
Performance AnalysisSovereign Trust grew Gross Premium year by year from N951m in 2004 to N3.6 bil-lion in 2008 representing an increase of 278% over the 5-year period, its growth rate of 30.67% in 2006 doubled in 2007 and dropped by 53.22% in 2008. However, Net Premium written grew by 58% from N2.02 billion in 2007 to N3.18 billion in 2008. Investments and other income increased by 68% from 193.25m in 2007 to N324.09m in 2008. Shareholders’ Funds grew from N515m in 2003 to N4.6 billion in 2008.
Underwriting Profit grew from N318m in 2003 to N1.5 billion in 2008 while Profit before Tax also grew marginally from N407.90m in 2007 to N415.7m in 2008; while Profit after Tax was N360.8m as against N357.8m in the proceeding year. Increase in equity and the build up of assets saw Return on Total Assets falling from 11.55% in 2007 to 7.75% in 2008 and Return on Equity dropping from 14.12% in 2007 to 8.89% in 2008. To yield maximum profits, sound investment strategies would be needed. Yield on Investment remained constant at 0.11 in 2007 and 2008. Claims as a percentage of Gross Premium was maintained at an average of 18% between 2007 and 2008. With the exception of 2004 when the company capitalised its earnings, Dividends were paid, with a payout ratio of N0.06K from 2005 to 2007.
Board of Directors Name Position
Chief (Dr) Ephraim F. Faloughi Chairman
Mr. Oluseun O. Ajayi Executive Vice Chairman
Mr. Bolaji Agbabiaka Director
Sir Chike Oyeka Director
Mrs. A.A. Taire (OFR) Director
Mr. Kolapo Lawson Director
Sir. Ogala Osoka (MFR) Director
Mr. Adesola Adebayo Director
Prof. Steve Azaika Director
Mr. Olawale Onaolapo Managing Director
2004
2005
2006
2007
2008
0
N'000
2,000,0001,000,000 3,000,000 4,000,000 5,000,000
Gross PremiumShareholders’ Fund
0
N'000
2,000,0001,000,000 3,000,000 4,000,000 5,000,000
2004
2005
2006
2007
2008
Gross Premium Shareholders’ Fund

85BGL Insurance Report | January 2010
Underwriting Profit compared to PBT shows an average of 40.04% between 2003 and 2008 with a rise to 40.97% in 2008. Operating Margin at an average of 43.50% across 2003-2006 rose to 48.53% in 2007 and fell to 40.03% in 2008; indicating improvement in operational efficiency since the bulk of the company’s earnings comes from underwriting. Increase in equity also led to growth in Shareholders’ Fund/Total Asset, from 56% in 2003 to 0.87% in 2008.
Stock Market AnalysisUpon listing on the Nigerian Stock Exchange in November 2006, the company’s share price appreciated significantly, growing over 400% to N4.45 by the middle of 2007 before falling to less than N3.00 late-2007. The stock benefited from the insurance stock rally of early 2008, with price growing over 100% to N6.51 by mid-February 2008; however, the current lull in the market pulled the share price down to the current price of less than N4.00.
Financial Ratios Performance Ratios (Margin) 2004 2005 2006 2007 2008
Change in Gross Premium 30.63% 9.88% 76.86% 9.21% 40.77%
Net Premium Margin 100.00% 98.81% 99.17% 92.44% 92.57%
Premium Earned/Gross Premium 81.76% 102.52% 83.32% 98.61% 89.64%
Claims incurred/Gross Premium 19.32% 24.06% 10.61% 17.32% 15.37%
Underwriting Profit Margin 58.70% 66.80% 69.42% 76.37% 66.64%
Cost to Income Ratio 46% 37% 24% 27% 50%
Pre-tax Profit Margin 25.03% 27.80% 48.70% 73.19% -64.42%
ROAE 28.26% 16.74% 23.36% 16.02% -19.44%
ROAA 11.34% 9.94% 17.39% 13.01% -15.01%
EPS 0.45 0.42 0.74 0.36 -0.55
DPS 0.12 0.00 0.00 0.00 0.00
Asset Quality Ratios 2004 2005 2006 2007 2008
Investment Income/Investments 9.15% 7.41% 8.08% 10.54% 11.42%
Effective Return on Investment 9.15% 7.41% 4.83% 7.71% -7.43%
Cost of Bad and Doubtful Loans 0.00% 0.00% 4.47% 4.64% 34.00%
Capital Adequacy Ratios 2004 2005 2006 2007 2008
Gross Premium/Insurance Funds 2.94 3.00 4.06 6.57 8.04
Debt/Equity Ratio 0.65 0.63 0.41 0.14 0.15
Equity/Total Assets 0.61 0.61 0.71 0.88 0.87

86 BGL Insurance Report | January 2010
0
20
40
60
80
100
120
Price v Index (% Change 2009)
NSE Index Price
Business StrategyUsing innovation as a competitive advantage, Sovereign Trust has the potential to compete favourably in its industry, and should seek to play in the burgeoning sec-tors of Real Estate (for mortgage backed securities) and Energy (including power) where innovation will be required to structure transactions. With the company’s plans to establish subsidiaries and expand aggressively by opening more branches in some strategic locations across the country, efforts should be made to remain focused on the differentiation strategy which seems the most appropriate strategy for the company to adopt.
Price v Index (% Change 2009)

87BGL Insurance Report | January 2010
Standard Alliance Insurance Plc
Company ProfileStandard Alliance (SA) Insurance Plc was incorporated in July 1981, under the name Jubilee Insurance Company Limited. The company formally commenced full operations in 1982, and in August 1996, after a major transformation of its ownership and management, it was renamed Standard Alliance. While Standard Alliance was involved in the General classes of insurance business, Life Insurance was reserved for its associate company, Standard Life Assurance Company Limited. Standard Alliance became a public limited company in October 2002 and its shares were listed on the Nigerian Stock Exchange (NSE) the following year. In the same year (2003), the company was re-registered by NAICOM, and granted a license to transact life business.
Earlier in 2008, SA raised additional funds on the Capital Market, the proceeds of which were to be used for strategic investment in Asset Management, Mortgages, Properties, Pension Fund Administration and Life Insurance. The exercise was a step towards achieving the company’s objective of becoming a one stop non-bank financial services provider. Prior to the offer, SA had Authorised Share Capital of N6 billion comprising Ordinary Shares of 50k each and Preference Shares of N100 each, and Issued and Fully Paid Capital of N3.57 billion comprising Ordinary Shares of 50k each and Floating Rate, Cumulative, Irredeemable, Convertible, Preference Shares of N100 each; thus making the company well capitalised for the General Insurance business.
Standard Alliance is a full-fledged financial services group, with subsidiaries includ-ing SA Insurance, SA Life, SA Money, SA Pension, SA Mortgage and SA Properties, and is owned by prominent individuals and corporate institutions.
FIRST ATLANTIC
ASSET MANAGEMENT,
20.00%
MR TONY
ELUMELU,
5,71%
SYNETICS TECH.
LTD, 9.72%OLOROGUN
O’TEGA E.
9.29%
MR. OLUSEGUN O.
6.29%
MS EVELYN
OPUTU,
6.06%
MR.HENRY MAC’
PEPPLE,
5.71%
Shareholders with more than 5%

88 BGL Insurance Report | January 2010
Performance AnalysisThe company has grown its Gross Premiums over the past few years, with growth of 6% between 2003 and 2004 and 46% between 2007 and 2008. Over the period (2002-2008), annual growth averaged 27%, with the highest growth (42%) achieved in 2008. With about 2% of the market, its 2006 Gross Premium figure places it in the top half of the industry’s league table. This, coupled with increased retention levels over the same period, has made Net Premium Income (NPI) to grow at a higher rate.
Claims Incurred ratio to Gross Premium grew from 9.34% in 2007 to 14.92% in 2008. Furthermore, net commissions paid declined in absolute terms by 3%, which was driven in part by the rise in commissions received, despite the reduction in reinsur-ance utilisation in 2008. This was due to the receipt of profit commissions.
With about N1.6 billion in 2006, it ranked pretty low in its industry in terms of Shareholders’ Funds. Impressively, Shareholders’ Funds grew over 1000%, to N23 billion as at December 2008.
Standard Alliance grew its Total Assets by over 1000% between 2002 and 2008. The company’s Underwriting Profit has grown consistently, growing an annual aver-age of 29% between 2002 and 2008, with total growth of 210% over the period. Between 2007 and 2008, however, annual growth dropped to 49.25%, from 58.97% in the previous period.
Board of Directors Name PositionAlhaji Aliyu Yahaya Sa’ad ChairmanOlorogun O’tega Emerho; OON Group Chief ExecutiveBode Akinboye Managing DirectorOlusegun Olusanya DirectorBrig. Gen. Dominic Onya (Rtd) DirectorChief Ede Osayande DirectorMr Ante Okwong DirectorChief Olatunji Olutola Director
2004
2005
2006
2007
2008
0 1,000,000500,000 1,500,000 2,000,000 2,500,000 3,000,000 3,500,000
Gross Premium
N'000
2004
2005
2006
2007
2008
0 10,000,0005,000,000 15,000,000 20,000,000 25,000,000
N'000
Shareholders’ Fund
Gross PremiumShareholders’ Fund

89BGL Insurance Report | January 2010
Financial Ratios Performance Ratios (Margin) 2004 2005 2006 2007 2008Change in Gross premium 6.81% 13.67% 29.08% 31.48% 41.85%Net Premium Margin 91.13% 91.93% 90.09% 90.30% 87.60%Premium Earned/Gross Premium 89.74% 96.31% 91.39% 89.96% 85.84%Claims incurred/Gross Premium 14.21% 11.33% 10.63% 9.34% 14.92%Underwriting Profit Margin 53.77% 66.42% 60.98% 58.97% 49.25%Cost to Income Ratio 65.59% 62.56% 75.13% 66.97% 72.78%Pre-tax Profit Margin 13.07% 18.84% 18.64% 20.96% 37.37%ROAE 16.22% 16.41% 15.29% 10.45% 6.82%ROAA 8.30% 10.43% 8.96% 7.82% 6.35%EPS 0.18 0.20 0.17 0.06 0.08DPS 0.00 0.00 0.00 0.00 0.00Operating Profit per Employee 3,635.21 5,514.25 6,231.21 6,511.18 15,975.96Underwriting Expenses (1,454.24) (1,620.19) (2,049.72) (2,448.86) (3,708.50Per EmployeeAsset Quality Ratios 2004 2005 2006 2007 2008Investment Income/Invests 8.81% 4.12% 6.72% 1.05% 7.75%Effective Return on Investment -10.69% -9.88% 6.72% -1.19% 4.82%Cost of Bad and Doubtful Loans 17.86% 16.13% 0.00% 10.27% 2.78%Capital Adequacy Ratios 2004 2005 2006 2007 2008Gross Premium/Insurance Funds 2.65 3.14 3.73 5.12 5.44Debt/Equity Ratio 0.90 0.42 0.99 0.17 0.05Equity/Total Assets 0.52 0.70 0.50 0.86 0.95
Cognisance is taken of the improvement in the management expense ratio since 2002, with annual growth in Operating Expenses dropping from 24% between 2002 and 2003 to 16% between 2005 and 2006 on the back of a number of cost control policies imposed by management, as well as the reduction in cessions to reinsur-ers over the period. Policies implemented include predetermined departmental overhead costs, and an improvement in the IT platform, which reduces stationery expenses. The company has also re-structured its marketing department (to com-prise largely commission based staff) and compensation is performance tied. It has controlled costs effectively over the past few years. According to recently released results, however, expenses rose 41% in 2008.
SA’s Profit after Tax margin grew an annual average of 22% between 2002 and 2008, ranking in the top half of its industry’s league table in 2008. The highest growth was 37% recorded in 2008.
The company’s Earnings per Share (EPS), declined from a high of to N0.20 in 2005 to N0.06 in 2007 as a result of accretion in equity. However, a sign of recovery was shown in 2008 when EPS grew to N0.08.
Increase in equity also put pressure on Return on Equity (ROE) which declined from 21.89% to 7.05% between 2002 and 2004; it however showed a return to good per-formance in later years, growing to 10.17% in 2005 and 13.34% in 2006. As a result of the significant increase in Shareholders’ Funds in 2007, ROE again fell to 6.35% in 2008. Effective investment of the funds should have resulted in a significant increase in returns to shareholders.
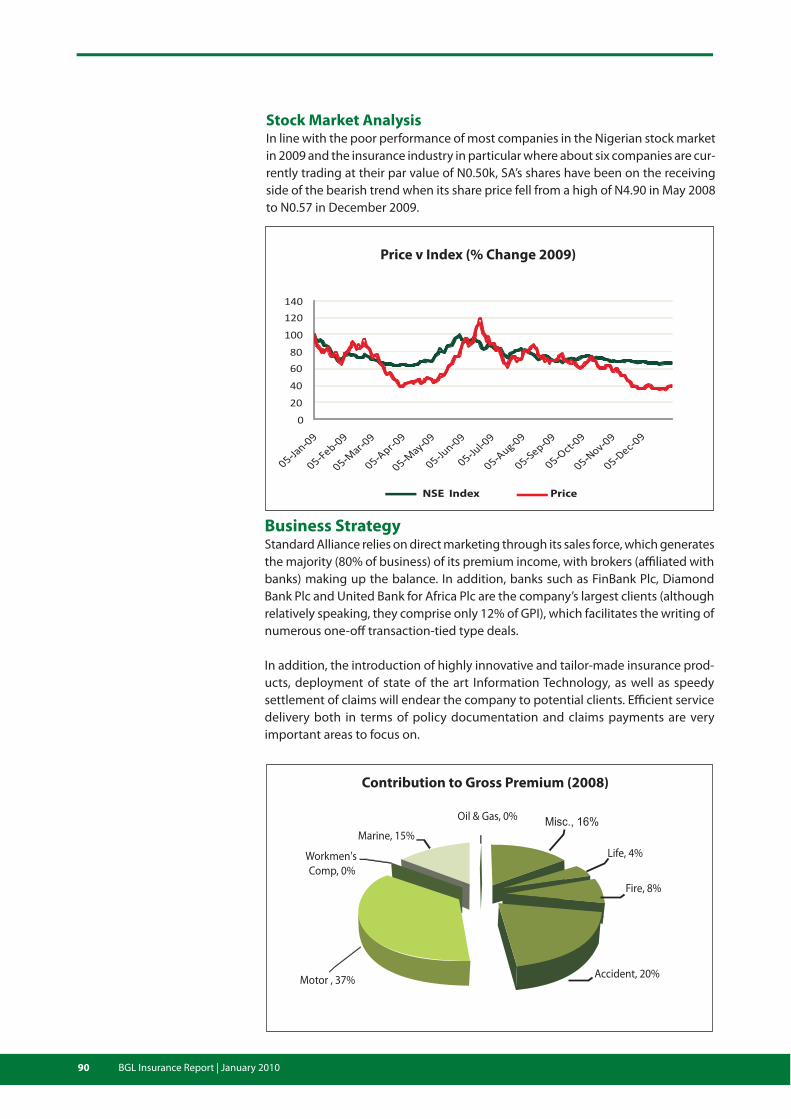
90 BGL Insurance Report | January 2010
0
20
40
60
80
100
120
140
Price v Index (% Change 2009)
NSE Index Price
Business StrategyStandard Alliance relies on direct marketing through its sales force, which generates the majority (80% of business) of its premium income, with brokers (affiliated with banks) making up the balance. In addition, banks such as FinBank Plc, Diamond Bank Plc and United Bank for Africa Plc are the company’s largest clients (although relatively speaking, they comprise only 12% of GPI), which facilitates the writing of numerous one-off transaction-tied type deals.
In addition, the introduction of highly innovative and tailor-made insurance prod-ucts, deployment of state of the art Information Technology, as well as speedy settlement of claims will endear the company to potential clients. Efficient service delivery both in terms of policy documentation and claims payments are very important areas to focus on.
Misc., 16%
Life, 4%
Fire, 8%
Accident, 20%Motor , 37%
Workmen's
Comp, 0%
Marine, 15%
Oil & Gas, 0%
Contribution to Gross Premium (2008)
Price v Index (% Change 2009)
Stock Market AnalysisIn line with the poor performance of most companies in the Nigerian stock market in 2009 and the insurance industry in particular where about six companies are cur-rently trading at their par value of N0.50k, SA’s shares have been on the receiving side of the bearish trend when its share price fell from a high of N4.90 in May 2008 to N0.57 in December 2009.

91BGL Insurance Report | January 2010
STACO Insurance Plc
Company ProfileSTACO Insurance Plc emerged in July 1994 from the successful restructuring of Al-pha Insurance Plc, and is licensed to carry out non-life Insurance and Special Risks Business. The restructuring of Alpha Insurance led to increases in the company’s Share Capital from N5m to N15m initially, and then to N70m by 2000. In 2003, the Authorised and Paid-up Share Capital was increased to N200m. By 2006, the Share Capital had been increased to N1.5 billion of which N400m was issued and fully paid-up. In compliance with the regulatory induced recapitalisation exercise the company went to the market to raise N1.65 billion through a private placement in May 2006. In an increasingly competitive and dynamic environment, STACO acknowledges the need to review and constantly improve processes and procedures in a bid to reach customers quicker and more efficiently. In addition to staying at the forefront of technological changes that affect their businesses, STACO plans to continuously build strategic alliances which will place it in target locations in both private and public sector environments.
In its drive to be the “natural first choice provider of services in the Nigerian market”, a set of corporate objectives emerged, including developing at least one conspicu-ously different product each year, adding genuine value to customers’ needs par-ticularly on claims settlements, extending the concentration of existing products and services and continuing the emphasis on cost effectiveness.
Seaforce
Investment
Ltd, 11.04%
S.O
Oyefeso, 7.56%
O.S
Otubu, 5.79%
Other
Nigerians, 75.6%
Shareholding Structure

92 BGL Insurance Report | January 2010
Performance AnalysisSTACO has consistently grown its Gross Premium over the past few years. Annual growth averaged 49% between 2002 and 2006, with actual annual growth grow-ing from 29% between 2002 and 2003, to 67% between 2005 and 2006 and 55% between 2007 and 2008. With Gross Premiums of N4.3 billion in 2008, the com-pany competes fairly in its industry, controlling about 2.05% of the market. It grew Shareholders’ Funds by over 2000%, from N130m to N3.3 billion, between 2002 and 2006. Between 2005 and 2006, following the recapitalisation exercise in the insurance industry in 2006, Shareholders’ Funds went up 358% from N945.92m to N4.33 billion between 2005 and 2008.
Board of Directors Name Position
Dere Otubu Chairman
S. O. Oyefeso MD/CEO
Pius Olanrewaju Director
I. G. Ogan Director
Emmanuel Chiejina Director
L. O. Ojakovo Director
Babatunde Okoturo Director
Collins Chikeluba Director
2004
2005
2006
2007
2008
0 2,000,0001,000,000 3,000,000 4,000,000 5,000,000
Gross Premium
N'000
Shareholders’ Fund
2004
2005
2006
2007
2008
0
N'000
2,000,0001,000,000 3,000,000 4,000,000 5,000,000
Gross PremiumShareholders’ Fund
Total Assets grew by over 1000% between 2002 and 2006, from N338m to N4.3 billion and then to N7.4 billion in 2008. Consequently, Return on Total Assets (ROA) grew from 5.4% to 18.6% between 2002 and 2005 but declined to 11.5% in 2006 and 7% in 2008.
STACO Insurance Profit before Tax (PBT) in 2008 declined to N623m from N868m in 2007, a 28.19% drop. The drop was partly as a result of the diminution in the value of its investment in the capital market and accounted for according to the national insurance guidelines. The Underwriting Profit in 2008 was N2.10 billion,

93BGL Insurance Report | January 2010
By the end of 2007, STACO had grossed a total Premium Income of N2.8 billion and PBT of N868m, 67% and 59% respectively above N1.68 billion and N547m respectively in 2006. Its first quarter 2008 results revealed growth of over 100% in Premium and PBT over the corresponding period of 2007. Our projection for the company to record Gross Premium Income in excess of N4 billion was met. However, PBT slipped to N623m below the N1.2 billion we projected for 2008. We are not strong on the relative financial performance of STACO for 2009 giving the difficult macroeconomic and operating environment throughout the year.
Stock Market AnalysisFollowing its Private Placement in 2006, STACO’s shares were listed on the Nigerian Stock Exchange (NSE) in June 2007. As an indication of its impressive performance, return on STACO’s shares significantly outperformed the market, returning over
Financial Ratios Performance Ratios (Margin) 2004 2005 2006 2007 2008Change in Gross premium 35.49% 62.83% 66.52% 67.13% 55.43%Net Premium Margin 90.87% 89.24% 91.30% 93.75% 99.13%Premium Earned/Gross Premium 90.87% 85.35% 82.23% 87.93% 91.69%Claims incurred/Gross Premium 17.79% 15.85% 16.89% 7.78% 20.57%Underwriting Profit Margin 41.20% 50.03% 43.89% 55.22% 48.10%Cost to Income Ratio 54.86% 50.47% 48.68% 58.11% 54.96%Pre-tax Profit Margin 22.92% 30.01% 32.47% 30.84% 14.25%ROAE 29.93% 37.16% 23.02% 19.69% 12.45%ROAA 17.33% 23.38% 17.23% 13.90% 7.84%EPS 0.21 0.22 0.11 0.16 0.11DPS 0.03 0.00 0.03 0.00 0.00Operating Profit per Employee 2,656.18 4,977.78 7,883.97 7,625.13 9,163.63Underwriting Expenses per Employee (1,607.74) (2,187.25) (3,816.90) (3,231.01) (3,464.38)Asset Quality Ratios 2004 2005 2006 2007 2008Investment Income/Investments 8.19% 5.40% 3.20% 6.52% 16.97%Effective Return on Investment 8.19% 0.21% 2.56% 0.84% -9.33%Cost of Bad and Doubtful Loans 0.00% 4.74% 5.11% 13.88% 44.40%Capital Adequacy Ratios 2004 2005 2006 2007 2008Gross Premium/Insurance Funds 2.35 3.19 3.35 4.37 4.15Debt/Equity Ratio 0.72 0.52 0.28 0.52 0.66Equity/Total Assets 0.58 0.66 0.78 0.66 0.60
an increase of 35% over the N1.55 billion recorded in 2007. The company incurred and paid N899m in 2008 as against N218m it paid to customers in 2007, an increase of over 311%.
Greater efficiency in the underwriting business improved Operating Margins which grew from 24.78% in 2002 to 43.89% in 2006 and 48% in 2008; it was however as high as 50% in 2005. While the Operating Margin grew, Operating Cost/Gross Premium was brought down consistently from 24% in 2002 to 16% in 2006 and 11% in 2008 resulting in improved profitability. Underwriting business remains the mainstay of the company accounting for the entire profit of the company over the period analysed.
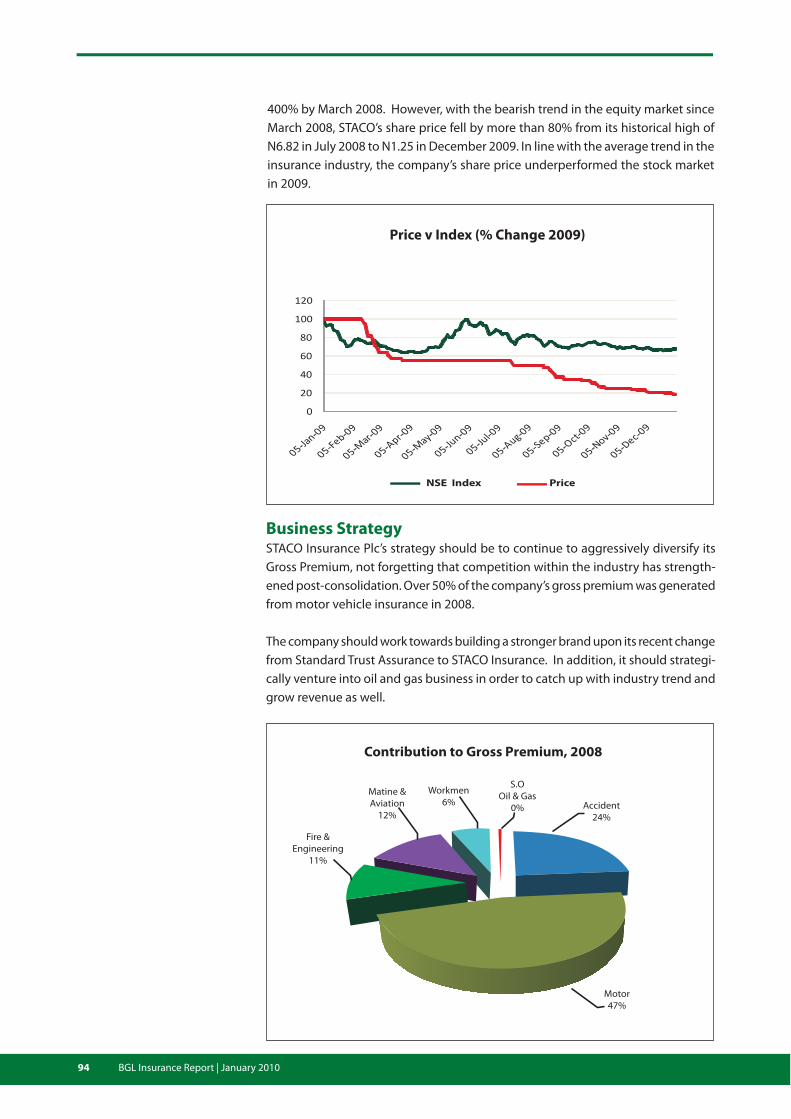
94 BGL Insurance Report | January 2010
0
20
40
60
80
100
120
Price v Index (% Change 2009)
NSE Index Price
Price v Index (% Change 2009)
400% by March 2008. However, with the bearish trend in the equity market since March 2008, STACO’s share price fell by more than 80% from its historical high of N6.82 in July 2008 to N1.25 in December 2009. In line with the average trend in the insurance industry, the company’s share price underperformed the stock market in 2009.
Business StrategySTACO Insurance Plc’s strategy should be to continue to aggressively diversify its Gross Premium, not forgetting that competition within the industry has strength-ened post-consolidation. Over 50% of the company’s gross premium was generated from motor vehicle insurance in 2008.
The company should work towards building a stronger brand upon its recent change from Standard Trust Assurance to STACO Insurance. In addition, it should strategi-cally venture into oil and gas business in order to catch up with industry trend and grow revenue as well.
S.O
Oil & Gas
0%
Workmen
6%
Matine &
Aviation
12%
Fire &
Engineering
11%
Motor
47%
Accident
24%
Contribution to Gross Premium, 2008

95BGL Insurance Report | January 2010
Appendix

96 BGL Insurance Report | January 2010
Insurance Trends in Other JurisdictionsIn order to situate Nigeria’s insurance industry, a review of the trend in some similar and more developed economies will be ideal. Nigeria follows Latin America and Asia closely in terms of development and is a major economy in Sub-Saharan Af-rica after South Africa. The biggest insurance economies in the world are US, UK, Europe and Japan.
Estimated at US$1.24 billion by December 2009, Nigeria represents only 0.3% of gross premium written globally. Nigeria’s insurance penetration measured by per-centage of gross premium to GDP is very low at 0.71%; indicating huge potential. Gross premium per capita at US$8.30 (N1,200) is very low compared to fellow African country, South Africa with US$867.65, Latin American peers, Brazil (US$239.02) and Chile (US$348.37) and China with US$105.20.
The US, Japan and UK are the largest economies for insurance accounting for 29.06%, 11.08% and 10.54% of the world premium written respectively; jointly accounting for half of the world total. The UK, Netherlands and Japan have the highest insurance penetration with over 10% of GDP each. Gross premium per capita is highest for the UK, Netherlands and France at US$6,854, US$6,130 and US$4,308 respectively.
Source: Insurance Information Institute: http://www2.iii.org/international/rankings/, CEA: www.cea.eu
Nigeria’s insurance penetration measured by percentage of gross premium to GDP is very low at 0.71%; indicating huge potential.
Countries Popultn Working GDP Per GDP PPP Gross Gross Gross % of % Gross Gross Gross (Millions) Population Capital (US$ Written Written Life Wirtten Total Premium Premium Premium (Millions) (US$) Billions) Premium Premium Non-Life World to GDP per Capital per ($ millions) ($ million) Premium Premium ($) Worker ($ million)
DEVELOPING COUNTRIES
Nigeria 149.1 51.0 1,176 175.4 1,237.0 193.00 1,045.00 0.03 0.71% 8.30 24.25
South Africa 49.0 18.2 9,994 489.7 42,515.00 34,525.00 7,990.0 1.00 8.68% 867.65 2,335.99
Argentina 40.9 16.2 14,073 575.6 8,396.0 1,920.00 6,476.00 0.20 1.46% 205.28 518.27
Brazil 198.7 100.9 10,015 1,990.0 47,493.0 22,419.00 25,074.00 1.11 2.39% 239.02 470.69
Chile 16.6 7.3 10,187 169.1 5,783.0 3,457.00 2,325.00 0.14 3.42% 348.37 792.19
Mexico 111.2 45.5 14,020 1,559.0 19,023.0 8,328.00 10,695.00 0.45 1.22% 171.07 418.09
China 1338.6 807.7 5,827 7,800.0 140,818.0 95,831.00 44,987.00 3.30 1.81% 105.20 174.34
DEVELOPED COUNTRIES
Germany 82.3 43.6 44,629 3,673.0 247,194.15 119,614.92 127,579.23 5.69 6.73% 3,003.57 5,669.59
Italy 58.1 25.0 39,828 2,314.0 138,272.44 81,994.83 56,277.62 3.30 5.98% 2,379.90 5,530.90
France 64.0 28.5 44,797 2,867.0 275,742.44 184,155.89 91,586.56 6.39 9.62% 4,308.48 9,675.17
Netherlands 16.7 7.7 52,515 877.0 114,468.17 39,067.19 75,400.98 2.64 13.05% 6,854.38 14,866.00
Spain 40.5 23.1 39,556 1,602.0 88,062.73 39,079.22 48,983.51 2.04 5.50% 2,174.39 3,812.24
UK 61.1 31.2 43,863 2,680.0 374,522.43 283,141.74 91,380.69 10.54 13.97% 6,129.66 12,003.92
Canada 33.4 18.2 44,880 1,499.0 105,174.00 47,855.00 57,319.00 2.64 7.02% 3,148.92 5,785.15
USA 307.2 155.2 47,008 14,441.0 1,240,643.00 578,211.00 662,432.00 29.06 8.59% 4,038.55 7,993.83
Australia 21.2 11.2 37,759 800.5 70,951.00 42,697.00 28,254.00 1.66 8.86% 3,346.75 6,334.91
Japan 127.0 66.1 34,236 4,348.0 473,197.00 367,112.00 106,085.00 11.08 10.88% 3,725.96 7,158.80
Singapore 4.6 2.9 52,174 240.0 16,528.00 11,445.00 5,083.00 0.39 6.89% 3,593.04 5,699.31
Global Insurance Statistics - Selected Countries
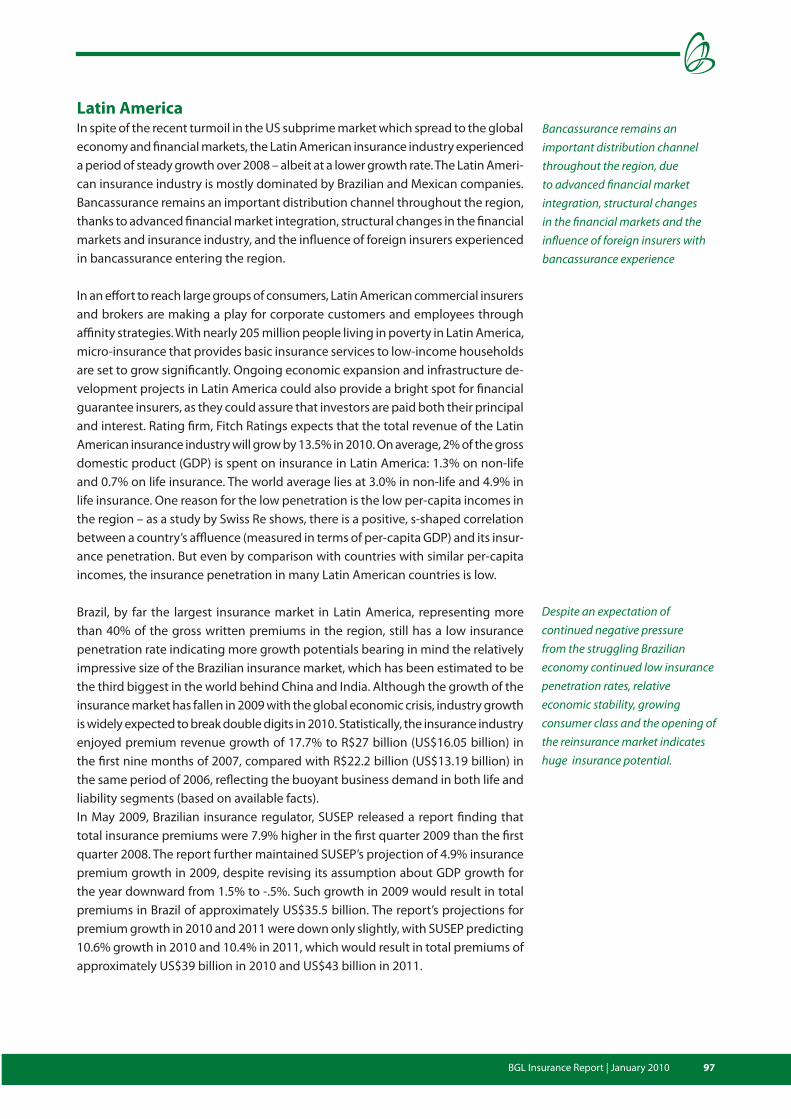
97BGL Insurance Report | January 2010
Latin AmericaIn spite of the recent turmoil in the US subprime market which spread to the global economy and financial markets, the Latin American insurance industry experienced a period of steady growth over 2008 – albeit at a lower growth rate. The Latin Ameri-can insurance industry is mostly dominated by Brazilian and Mexican companies. Bancassurance remains an important distribution channel throughout the region, thanks to advanced financial market integration, structural changes in the financial markets and insurance industry, and the influence of foreign insurers experienced in bancassurance entering the region.
In an effort to reach large groups of consumers, Latin American commercial insurers and brokers are making a play for corporate customers and employees through affinity strategies. With nearly 205 million people living in poverty in Latin America, micro-insurance that provides basic insurance services to low-income households are set to grow significantly. Ongoing economic expansion and infrastructure de-velopment projects in Latin America could also provide a bright spot for financial guarantee insurers, as they could assure that investors are paid both their principal and interest. Rating firm, Fitch Ratings expects that the total revenue of the Latin American insurance industry will grow by 13.5% in 2010. On average, 2% of the gross domestic product (GDP) is spent on insurance in Latin America: 1.3% on non-life and 0.7% on life insurance. The world average lies at 3.0% in non-life and 4.9% in life insurance. One reason for the low penetration is the low per-capita incomes in the region – as a study by Swiss Re shows, there is a positive, s-shaped correlation between a country’s affluence (measured in terms of per-capita GDP) and its insur-ance penetration. But even by comparison with countries with similar per-capita incomes, the insurance penetration in many Latin American countries is low.
Brazil, by far the largest insurance market in Latin America, representing more than 40% of the gross written premiums in the region, still has a low insurance penetration rate indicating more growth potentials bearing in mind the relatively impressive size of the Brazilian insurance market, which has been estimated to be the third biggest in the world behind China and India. Although the growth of the insurance market has fallen in 2009 with the global economic crisis, industry growth is widely expected to break double digits in 2010. Statistically, the insurance industry enjoyed premium revenue growth of 17.7% to R$27 billion (US$16.05 billion) in the first nine months of 2007, compared with R$22.2 billion (US$13.19 billion) in the same period of 2006, reflecting the buoyant business demand in both life and liability segments (based on available facts).In May 2009, Brazilian insurance regulator, SUSEP released a report finding that total insurance premiums were 7.9% higher in the first quarter 2009 than the first quarter 2008. The report further maintained SUSEP’s projection of 4.9% insurance premium growth in 2009, despite revising its assumption about GDP growth for the year downward from 1.5% to -.5%. Such growth in 2009 would result in total premiums in Brazil of approximately US$35.5 billion. The report’s projections for premium growth in 2010 and 2011 were down only slightly, with SUSEP predicting 10.6% growth in 2010 and 10.4% in 2011, which would result in total premiums of approximately US$39 billion in 2010 and US$43 billion in 2011.
Despite an expectation of continued negative pressure from the struggling Brazilian economy continued low insurance penetration rates, relative economic stability, growing consumer class and the opening of the reinsurance market indicates huge insurance potential.
Bancassurance remains an important distribution channel throughout the region, due to advanced financial market integration, structural changes in the financial markets and the influence of foreign insurers with bancassurance experience

98 BGL Insurance Report | January 2010
In July 2009, Fitch released a report on the Brazilian insurance market that balanced bad news about the Brazilian economy with continued optimism as to the country’s insurance industry. The report found that, despite an expectation of continued negative pressure from the struggling economy in the near-term, continued low insurance penetration rates (3.3% of GDP in 2008 and 3.5% for the first four months of 2009) combined with relative economic stability, a growing consumer class and the opening of the reinsurance market indicates that the insurance market has sub-stantial potential for growth in the coming years. The Brazilian insurance industry comprised 131 companies, with six leading companies, accounting for 68.9% of total market share, as of June 2007.
The Mexican insurance market remained the region’s second largest insurance mar-ket, generating more than 25% of the total premiums in the region. In Mexico, there was a 16% increase in net written premiums to MEX$192 billion (US$17.9 billion) in the first nine months of 2007 from the corresponding period of 2006, largely due to life product sales through the Bancassurance channel and higher property and casualty (P&C) premium prices.
While the third largest insurance market, Argentina still had the highest numbers of insurers in the region, with about 180 insurers in 2007, it could only generate about 10% of total premium in the region. The devastating floods and earthquakes in mid 2007 boosted growth in Peru and Chile’s insurance businesses, making more people aware of the need for Property & Casualty and Life insurance coverage.
Asia - ChinaThe Chinese insurance industry has experienced rapid expansion over the past de-cade, with annual life-insurance premiums growing from US$10 billion in 1999 to US$46 billion in 2006. In addition to steadily increasing demand, two major supply-side trends have encouraged the development of the industry:
1) Under the World Trade Organisation (WTO) framework, the Chinese govern-ment lowered entry barriers to foreign insurers, allowing them to establish joint-venture insurance firms in China; and
2) Domestic insurers strengthened themselves through IPOs and other market developments.
Countries Population Working GDP Per GDP PPP Gross Gross Gross % of % Gross Gross Gross (Millions) Population Capital (US$ Written Written Life Wirtten Total Premium Premium Premium (Millions) (US$) Billions) Premium Premium Non-Life World to GDP per Capital per ($ millions) ($ million) Premium Premium ($) Worker ($ million)
China 1338.6 807.7 5,827 7,800.0 140,818.0 95,831.00 44,987.00 3.30 1.81% 105.20 174.34
Japan 127.0 66.1 32,236 4,348.0 473.197 367,112.00 106,085.00 11.08 10.88% 3,725.96 7,158.80 Singapore 4.6 2.9 52,174 240.0 16,528.00 11,445.00 5,083.00 0.39 6.89% 3,593.04 5,699.31
ASIAN COUNTRIES
Source: Insurance Information Institute: http://www2.iii.org/international/rankings/, CEA: www.cea.eu
Regional Insurance Statistics - Selected Asian Countries
99BGL Insurance Report | January 2010
As of 2007, China had 100 insurance companies, 59 of which were domestic-funded and the remaining 41 were foreign-funded. Five Chinese insurance companies including the People’s Insurance Company of China, China Life Insurance, Ping An Insurance Company of China, China Insurance International Holdings Co., Ltd. (CIIH) and the Ming An Insurance (China) Co., Ltd. have listed at home and abroad. China Life Insurance had about a 50% share of the life insurance market; Ping An Life Insurance and Ping An Property Insurance share 16% and 12% of correspond-ing insurance markets, respectively ranking 2nd and 3rd.
In Jan-May 2007, the increased insurance assets reached RMB450 billion (US$66 bil-lion), without calculating the value-added of substantive financial assets. At present, the Gross Assets of China Life Insurance exceed RMB1 trillion (US$146.70 billion). The total capital of the insurance industry exceeds RMB200 billion (US$29.34), 5.6 times that of 2002.
During the first three quarters of 2009 China’s insurance companies had gener-ated RMB36.9 billion (US$5.4 billion) in profit, of which the seven largest insurers accounted for 90% of these profits.
JapanJapan’s insurance market used to operate under a tariff system and enjoyed steady growth and profitability. Premiums were fixed at the same rate for all companies, and product forms were generally undifferentiated. Many of the larger commercial risks were controlled by the “keiretsu” system, under which representatives from all of the major industrial and financial sectors – including banks, suppliers, manufacturers, insurers, and so forth – joined together to form large corporate groups.Falling stock prices as a result of the financial crisis, has strongly impacted on the Japanese insurance industry. In particular, both life and non-life insurers posted very large devaluation losses on investment securities, which caused a number of insurance companies to report net losses for fiscal 2008.
In the meantime, the Japanese aging society’s reducing demand for insurance, is causing a consistent downward trend at life and non-life insurance companies. In the non-life insurance industry, decreasing vehicle ownership and reduced vehicle production as a result of the financial crisis has led to a drop in new motor insurance policies. Moreover, Japan’s falling birth-rate and aging population have resulted in a decrease in sales of death benefit coverage in the life insurance industry. These factors have stalled sales of the main products that support earnings in both the life and non-life insurance sectors. In the life insurance industry, Yamato Life Insur-ance Company became insolvent and other companies implemented measures to increase their capital as their operating capabilities weakened. Beset by this challenging environment, Japan’s insurance industry is seeking new approaches to management as the financial crisis affects the real economy. Moreover, insurance companies, pursuing low-cost operations, accelerated the movement to replace the conventional channels such as agencies or salespersons with direct sales, which intensified competition for customers.
The largest change in Japan’s insurance industry in 2009 has been the trend toward restructuring in the non-life insurance industry. In January 2009, Aioi Insurance Co., Ltd., Nissay Dowa General Insurance Co., Ltd. and Mitsui Sumitomo Insurance Co.,
Beset by aging population and falling birth rate, Japan’s insurance industry is seeking new approaches to management as the financial crisis affects the real economy.

100 BGL Insurance Report | January 2010
Ltd. agreed to integrate their management with the aim of forming a new insurance and financial group. Moreover, in February 2009 Sompo Japan Insurance Inc. and NIPPONKOA Insurance Co., Ltd. reached an agreement to establish a joint holding company for management integration. These were among the industry’s moves to reorganise under a new structure. Against the backdrop of the collapse of the bubble economy, the non-life insurance industry conducted mergers and combinations during the 2000s to reorganise into six major domestic companies (Tokio Marine & Nichido Fire Insurance, Mitsui Sumitomo Insurance, Sompo Japan, Aioi Insurance, NIPPONKOA Insurance, and Nissay Dowa). However, the impact of the contraction of the Japanese insurance market and the global financial crisis has put an end to the six-company structure. In the six non-life insurance companies mentioned earlier, recognised valuation losses on investment securities were in excess of ¥400 billion (US$4.45 billion) in the nine months ended December 31, 2008. Japan’s population as of April 2009 was 127.6 million, a decrease of 90,000 from a year earlier. Conversely, the senior demographic of people aged 65 and older increased 2.78% from a year earlier to 28.289 million, and is projected to increase to 35.7% of the total popula-tion in 2050. (Source: April 2009 Population Estimates for Monthly Report, Statistics Bureau, Ministry of Internal Affairs and Communications.)
This changing environment has especially affected motor insurance, a mainstream product supporting earnings in the non-life insurance industry. The drop in the number of vehicles owned and the September 2008 financial crisis have caused vehicle production and sales to decrease dramatically, and significant growth is not projected for the domestic market. Therefore, non-life insurance companies are concentrating on strengthening their domestic life insurance subsidiaries and raising the efficiency of their non-life insurance operations by reducing operating expenses. At the same time, the industry is executing a concurrent strategy of aggressively investing their management resources in businesses overseas, particularly by using mergers, acquisitions and other means to expand into other Asian markets.
Africa - South AfricaIn 2008, the South African Insurance industry reported underwriting profit of R1.1 billion (US$150.5m) down 36.5% from R1.7 billion (US$232.6m) in 2007. Incurred loss ratio increased by 150 basis points to 65.9% in 2008. One of the key contribu-tors is the usual suspect; motor insurance. Over the past few years, insurers annu-ally expressed their concern over the poor performance of the motor book citing worsening driving conditions, the increase in the number of unlicensed drivers on the roads and the increased repair costs associated with the large range of vehicles available in South Africa and specifically imported vehicles. In 2007, this was further exacerbated by the extensive upgrading of road infrastructure in and around main centres. Significant corrective action is taking place ranging from premium increases in excess of 20% to improved management of claims costs. 2008 saw an increase in the number of commercial fire claims. This calls into question the existence of sound risk management, the effectiveness of maintenance activities as well as the capacity and ability of emergency services to respond. 2008 also saw a significant increase in management and other expenses to R7.7 billion (US$1.05 billion) from R6.4 billion (US$875.7m) in 2007.
Japan’s insurance industry is executing a concurrent strategy of aggressively investing their management resources in businesses overseas, using mergers, acquisitions.

101BGL Insurance Report | January 2010
The industry suffered a loss of R0.9 billion (US$123.1m) in 2008 with regard to realised and unrealised fair value adjustments compared to a profit of R2.0 billion (US$273.6m) in 2007. Dividend income also declined as corporate South Africa started to feel the pinch of the global credit crisis. Interest income was up as a result of larger cash and near cash holdings as insurers moved to limit the volatility of their investment portfolios, and higher interest rates. Profit after tax fell by 41.3% to R3.2 billion (US$473.8m).
United States of AmericaThe U.S insurance industry’s net premiums written totalled US$1.1 trillion in 2008, with premiums recorded by life/health (L/H) insurers accounting for 59% and premiums by property/casualty (P/C) insurers accounting for 41%, according to Highline Data, LLC. P/C insurance consists primarily of auto, home and commercial insurance. Net premiums written for the sector totalled US$441 billion in 2008. L/H insurance sector consists primarily of annuities and life insurance. Net premiums written for the sector totalled US$628 billion in 2008.Private health insurance is generally considered separately. It accounted for US$609.2 billion in premiums in 2008, according to the National Association of Insurance Commissioners. This includes premiums from health insurers as well as smaller amounts from L/H and P/C insurers. There were 2,741 P/C insurance com-panies and 1,128 L/H insurance companies in the United States in 2008.
Insurance carriers and related activities accounted for $333 billion or 2.4% of U.S. gross domestic product in 2007. The U.S. insurance industry employed 2.3m million people in 2008, of which 1.4m million worked for insurance companies, including life, health and medical insurers (804,200 workers) P/C insurers (569,200 workers) and reinsurers (28,400 workers). The remaining 907,000 worked for insurance agen-cies, brokers and other insurance related enterprises.
Total P/C cash and invested assets were US$1.2 trillion in 2008. L/H cash and in-vested assets totalled US$3.0 trillion in 2008. The majority of these assets were in bonds (68% of P/C assets; 71% of L/H assets). P/C and L/H insurance companies paid US$15.7 billion in premium taxes in 2008, or US$52 for every person living in the United States. P/C insurers paid out US$27.0 billion to their policyholders for insured losses from catastrophes in 2008, the highest since the record US$62.3 billion in 2005, the year of Hurricane Katrina. 2008 losses include US$12.5 billion caused by Hurricane Ike.
Countries Population Working GDP Per GDP PPP Gross Gross Gross % of % Gross Gross Gross (Millions) Population Capital (US$ written written Life wirtten total Premium Premium Premium (Millions) (US$) Billions) premium Premium non-Life premium to GDP per Capital per ($ millions) ($ million premium ($) ($) worker
USA 307.2 155.2 47,008 14,441.0 1,240,643.00 578,211.00 662,432.00 29.06 8.59% 4,038.55 7,993.83
Canada 33.4 18.2 44,880 1,499.0 105,174.00 47,855.00 57,319.00 2.64 7.02% 3,148.92 5,785.15
Regional Insurance Statistics - North America
Source: Insurance Information Institute: http://www2.iii.org/international/rankings/, CEA: www.cea.eu

102 BGL Insurance Report | January 2010
United KingdomThe insurance industry makes important contributions to the UK’s economy. It is a major employer and source of overseas income. It is the third largest insurance indus-try in the world with its premium income at 10.54% of the world’s total. It is still some way behind the United States insurance industry which had 29% of the premium income in 2008 and a little behind the Japanese insurance industry with 11% of the world premium income. With 1,017 companies approved by the Financial Services Authority to carry out insurance work - many are part of larger corporations - the industry employs over 309,000 people; almost one third of all financial services jobs.
The insurance industry is a substantial investor and controlled 15% of all investment on the London Stock Exchange in 2006, and before the recent difficulties in the stock market, in December 2007 had £1,599 billion (US$2,661 billion) invested in company shares and other assets. Of this, £121 billion (US$201 billion) was general insurance investments and £1,478 billion (US$2.46 billion), long-term investments. In 2007 the insurance industry paid out £211m (US$348m) each day in pension and life insurance benefits, and £59m (US$97.4m) in general insurance claims. The general insurance claims are made up of £17.1m (US$28.21m) for motor claims (private cars), £12.4m (US$20.5m) for householders’ insurance claims such as property damage, £5.9m (US$9.7m) for business claims such as property damage, and £6.2m for liability claims such as accidents on commercial premises or at work. Motor insurance premiums represented the largest source of premiums on the general insurance business side at £10.5 billion (US$17.3 billion) with claims totalling £8.2 billion (US$13.5 billion).
The Association of British Insurers (ABI) represents over 400 members of the insur-ance industry in the UK. The above statistics and further statistics can be found on the ABI website.
EuropeIn order to respond to the challenges of higher claims and lower investment returns, insurers in Europe have improved their data collection, their efforts to model, mea-sure and manage risks, and their disclosure of individual risk profiles and related risk management practices in their annual reports. Similarly, regulators have also been more careful in monitoring solvency to ensure that policyholders are protected in jurisdictions where insurers’ solvency levels are low. With respect to capital adequacy and solvency requirements, the IAIS has developed a range of principles, standards and guidelines which involve an increase in communication, transparency, coopera-tion and coordination between the stakeholders involved. With respect to valuation standards, the International Accounting and Standards Board (IASB), based on the current values for valuing insurers assets and liabilities, have a close liaison with European bodies not only because of the standard for insurance contracts but also more generally on the rules for financial instruments.

103BGL Insurance Report | January 2010
Country Popultn
Working
Total Total Life
Total non-Life GDP Per
GDP PPP %
of Insurance No. of
Gross written Gross
Gross %
of %
Gross Gross
Gross
(Million)
Popultn Insurance
Insurance Investm
ent Capital
(US $ Insurance
Invt. Insurance
Premium
W
ritten Life W
ritten Total
Premium
Prem
ium
Premium
(Million)
Investment
Investment
Portolio (US $)
Billions) Coy to
Portfolio Coys
($ millions)
Premium
non-Life
world to GDP
per Capital per
Portfolio
Portfolio ($ m
illions)
other
as % of
($ million
Premium
Prem
ium
($)
Worker
($ billions)
($ millions)
Coy
GDP
($ millions)
EURO
PEAN
COU
NTRIES
Germ
any 82.3
43.6 1,896.35
1,035,581.20 882,403.47
44,629 3,673.0
12.0 52%
606.0
247,194.15 119,614.92
127,579.23 5.69
6.73%
3,003.57 5,669.59
Italy 58.1 25.0 653.19
538,276.16 114,911.47 39,828
2,314.0 5.0
28%
247.0 138,272.44
81,994.83 56,277.62
3.30 5.98%
2,379.90
5,530.90
France 64.0 28.5 2,238.65
1,987,340.29 251,305.54 44,797 2,867.0
9.0 78%
460.0
275,742.44 184,155.89
91,586.56 6.39
9.62%
4,308.48 9,675.17
Netherlands
16.7 7.7 483.91 426,102.61 57,804.36
52,515 877.0
6.0 55%
335.0
114,468.17 39,067.19
75,400.98 2.64
13.05%
6,854.38 14,866.00
Spain 40.5 23.1 286.76
189,738.42 51,407.37 39,556 1,602.0
6.0 18%
296.0
88,062.73 39,079.22
48,983.51 2.04
5.50%
2,174.39 3,812.24
UK
61.1 31.2 2,520.03
2,328,564.38 191,465.02 43,863
2,680.0 21.0
94%
1,096.0 374,522.43
283,141.74 91,380.69
10.54 13.97%
6,129.66
12,003.92
Volatile stock prices, declining interest rates, industry de-regulation and increased globalisation have put pressure on insurance industries to restructure. Despite an overall decline in the number of insurance companies in Europe in the last decade, the European insurance market is still relatively fragmented with about 5,170 companies in 2008. After five successive years of decline, caused mainly by consolidation, the number of people employed in the Eu-ropean insurance industry grew by 0.5% in 2007 to slightly under 1million. Provisional figures for 2008 indicate that the number of employees working in insurance companies has remained stable, with the bulk of employees working full-time. According to these statistics, the 33 European countries represented by the CEA gross written premiums declined in nominal terms and at constant exchange rates by 6% (-10% at current exchange rates) to just under €1,060 billion (US$1,560 billion). This shrinkage is mainly driven by the life sector, which accounts for more than 60% of all premiums. It follows an expansion in premiums of more than 6% a year since 2002.
In the life market, the impact of the financial crisis has been quite significant, with term-life and unit-linked products hardest hit. Total European life premiums recorded a drop of 11% in nominal terms and at constant exchange rates (-16% at current exchange rates) in 2008, amounting to €644 billion (US$971.9 billion) compared with €766 billion (US$1,156 billion) in 2007. However, non-life premiums have generally been little affected by the economic down-turn except for a small number of lines of business, such as credit insurance, that have strong links to economic activity. In 2008, European non-life premiums totalled €415 billion (US$626.3 billion), corresponding to a 2% nominal growth at constant exchange rates. This mirrors developments observed in 2007.
In the context of distribution channels, Bancassurance is the major distribution channel for life insurance products in many western countries and in Turkey. In the UK, how-ever, Bancassurance is practically non-existent for the pro-vision of life policies. Agents are particularly widespread in Slovakia, Bulgaria, the Netherlands, Germany and Slovenia, and are common in Poland and Croatia. Brokers lead the life insurance market in the UK and Ireland, and are also quite common in Belgium. Direct writing prevails in Ireland and is also popular in Croatia, Sweden, the Netherlands, Poland, Austria and Belgium.
Regional Insurance Statistics - Selected European Countries
Source: Insurance Information Institute: http://w
ww
2.iii.org/international/rankings/, CEA: ww
w.cea.eu

104 BGL Insurance Report | January 2010
The distribution of non-life insurance products changed little in 2007 and agents and brokers remained the largest suppliers of such products. As in the life sector, agents play an important role in the distribution of non-life policies. They are very well established in Italy, Turkey, Slovenia and Portugal. Although brokers remain much less important than agents in most European countries, they are particularly prevalent in Belgium, Ireland and the UK. Unlike life insurance, sales of non-life insur-ance products through bancassurance are not really widespread in Europe. Direct writing appears to be more common in non-life insurance than in life insurance, where products are much more complex.
Source: Business Insights
Country Banks/bancassurers Tied agents Direct sales-force IFAs/brokers Others France 61% 8% 6% 9% 16% Germany 19% 51% 9% 21% 0% Italy 56% 34% 9% 1% 0% Spain 77% 0% 3% 20% 0% UK 18% 17% 0% 56% 9%
Distribution of Life Assurance by distribution Channels

105BGL Insurance Report | January 2010
Required Disclosure
BGL Research Certification/ DisclaimerThis publication has been produced by BGL Research to provide information on all issues which form the subject matter of the document. BGL Research hereby certifies that all the views expressed in this document accurately reflect its views based on information from various sources that it believes are reliable; however, no representation is made that it is accurate or complete. The views expressed in the document are solely for users who are expected to make their own invest-ment decision without undue reliance on any information or opinions contained herein. The document does not constitute any offer or solicitation to any person to enter into any transaction. Whilst reasonable care has been taken in preparing this document, no responsibility or liability is accepted for errors of fact or for any views expressed herein by any member of the BGL Group for actions taken as a result of information provided in this publication. Any ratings, forecasts, estimates, opinions or views herein constitute a judgment as at the date of this document. If the date of this document is not current, the views and contents may not reflect the BGL Research’s current thinking.


Group Head Office Millennium House 12A Catholic Mission Street Lagos Island, Lagos, Nigeria T +234 1 462 2606 F +234 1 462 2628 Customer Care: +234 1 280 5544 W http://www.bglgroupng.com E [email protected]
Abuja Office Plot 417, Tigris Crescent Maitama, Abuja-FCT, Nigeria T +234 9 781 7729 F +234 9 234 8539
Port Harcourt Office 59B King Perekule Street GRA Phase II, Port Harcourt Rivers State, Nigeria T +234 84 462 359F +234 84 462 359
Victoria Island Office Plot 1061, Abagbon Close Off Olorogun Agbaje Street Victoria Island, Lagos, Nigeria T +234 1 481 0894-6 F +234 1 462 7562


![The -Glucoside (bgl) Operon of Escherichia coli Is ... · MA200 F lacX174 thi bglR1(bglR::IS1) srl::Tn10 recA56 dbglR7 bglG= lacZ lacY (Bgl lac) (Bgl ) 15 MA200-1 MA200 bglF201 [BglG(Con)]](https://static.fdocuments.us/doc/165x107/601abb4c82611216fb7d038c/the-glucoside-bgl-operon-of-escherichia-coli-is-ma200-f-lacx174-thi-bglr1bglris1.jpg)