Benefit Cost Analysis at EPA: Confessions of an Errant ...
59
Benefit Cost Analysis at EPA: Confessions of an Errant Economist Al McGartland (with contribution by Bryan Hubbell) New York University Law School November 10, 2009
Transcript of Benefit Cost Analysis at EPA: Confessions of an Errant ...

Benefit Cost Analysisat EPA: Confessions of an
Errant Economist
Al McGartland(with contribution by Bryan Hubbell)
New York University Law School
November 10, 2009

2
A Letter from Benjamin Franklin to Joseph Priestly, Sept 19, l772
In the affair of so much importance to you, wherein you ask my advice, I cannot …advise you what to determine, but if you please I will tell you how. … my way is to divide half a sheet of paper by a line into two columns; writing over the one Pro, and over the other Con. Then, during three or four days consideration, I put down under the different heads short hints of the different motives, that at different times occur to me, for or against the measure. When I have thus got them all together in one view, I endeavor to estimate their respective weights; and where I find two, one on each side, that seem equal, I strike them both out. If I find a reason pro equal to some two reasons con, I strike out the three. … and thus proceeding I find at length where the balance lies; and … I come to a determination accordingly. And, though the weight of the reasons cannot be taken with the precision of algebraic quantities, yet when each is thus considered, separately and comparatively, and the whole lies before me, I think I can judge better, and am less liable to make a rash step, and in fact I have found great advantage from this kind of equation, and what might be called moral or prudential algebra.

3
Presentation Overview
• A Little Interpretative History– The Birth of EPA: 1970– EPA’s Early Years: 1970-1980– Economics Comes to the Fore: 1980-2000– EPA Economists’ Current Role
• The Environmental Policy Process Today and Benefit-Cost Analysis
• Science and Economics’ mutually supportive roles• Two Case Studies – feedback in action • Future Challenges
4
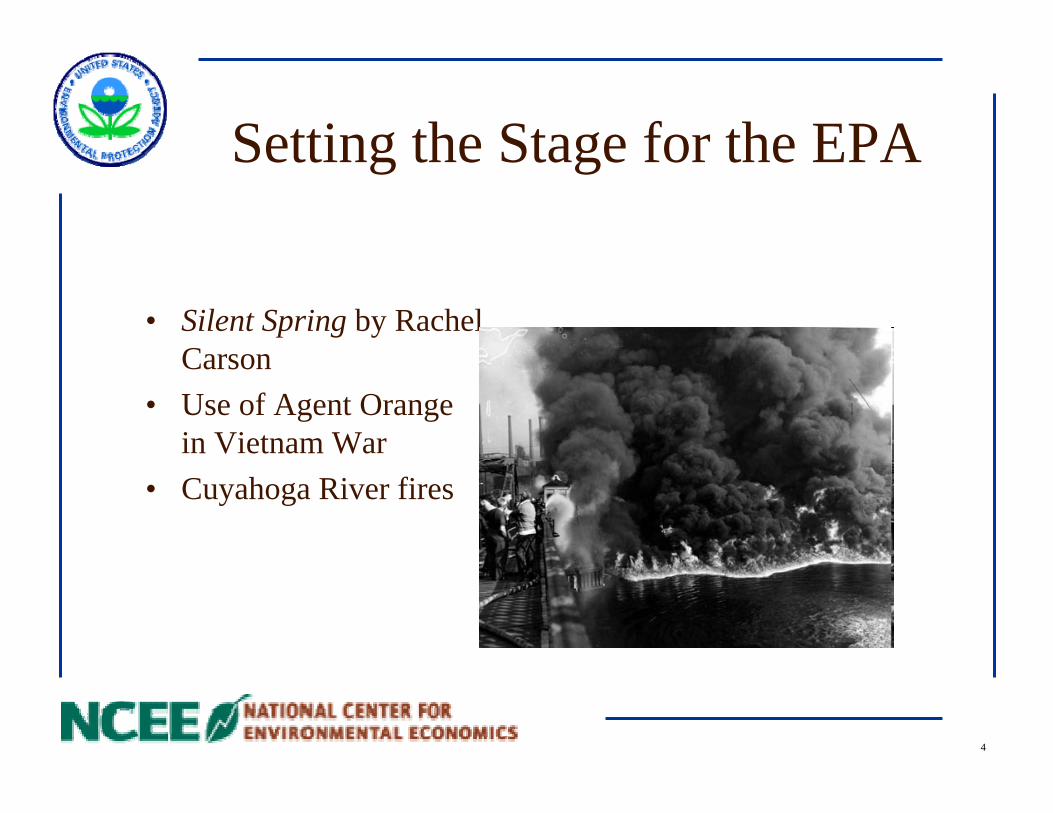
Setting the Stage for the EPA
• Silent Spring by Rachel Carson
• Use of Agent Orange in Vietnam War
• Cuyahoga River fires

5
EPA’s Early Years: 1970-1980
6
The EPA is Born
• July 1970: EPA established by President Nixon• Combined environmental programs from across government
agencies, including:– Department of Agriculture (USDA)– Department of Health, Education and Welfare– Department of Interior
• Consisted of mostly lawyers, toxicologists, engineers and chemists, but few economists

7
A Minimal Role for Economics• Initially, little role in EPA for economics
– Early idea that safe—even pristine—levels of environmental quality were achievable at a reasonable cost
– Public demand for action– Little or no demand at EPA for economics in regulatory analysis– Clean Air Act, forbid EPA from considering costs in setting air quality
standards.• Required standards “requisite to protect the public welfare from any
known or anticipated adverse effects associated with the presence of such air pollutants in ambient air.”
– Clean Water Act included similar ambitious water quality setting goals
8
Early EPA Economics
• Environmental economists faced more difficulty in public policy than other types of economists.– Public goods vs. market goods– Definitions of environmental commodities far from
standardized• No standard method to measure quantity and quality of
each commodity– Vague notions of cost, social value, and income and price
elasticity– Existing benefit and cost estimates rendered obsolete by
changes in technology, income, and taste
9
Early Years: An EPA without Economics
• Economists experienced minimal representation in EPA compared to other federal agencies
• Economic analysis not undertaken by EPA• Policy promulgated with a strong mandate to protect the
environment (thought they didn’t need benefit-cost analysis).

10
Economics Comes to the Fore: 1980-2000

11
Reagan’s Executive Order
• President Reagan pens Executive Order 12291– Requires a Regulatory Impact Analysis for all “economically
significant” rules– To extent allowed by law, the policy option that maximizes net
benefits should be selected– Office of Management and Budget tasked with reviewing
regulations for compliance with E.O.• E.O. 12291 was the major reason economics became an important
part of the policy process in the 1980s.

12
Consequences of E.O. 12291• Linked OMB regulatory review and BCA• Some saw OMB review as process and BCA as the tool for rolling
back environmental protection– Made BCA and economics controversial and misunderstood
• Needed clear division between the two– BCA as a scientific tool– OMB review as a normative policy exercise
13
Further Consequences of the E.O.
• Economics became a political tool, not a science• Few at EPA believed economic analysis could be used to justify
more regulation• Many at EPA and outside stakeholders argued against and resisted
economics in the regulatory process

14
EPA Response to the E.O.
• Program offices built economics staffs for analysis• Policy office created an economics branch• Economists earned senior leadership roles in the policy office• Uncovered several cases for additional regulation
– Controlling stratospheric ozone depletion– Alar, a plant growth regulator– Lead in gasoline, other lead rules
• Slowly Economics became a science within EPA, BCA became accepted as governed by Economics

15
Economists’ Other Contributions: 1980-2000
• Recognizing problems with differentiated regulations (i.e., new source bias)
• Critique of wide-spread use of ordinal measures to indicate risk of pollution
• Completing comparative risk studies• Analyzing benefits of performance standards and emissions
trading over strict technology standards• Examining risk-risk tradeoffs• Completing Clean Air Act Retrospective Study• Making improvements to risk-assessment

16
Economics at the EPA Today

17
Economics is a ScienceEPA Science Advisory Board has Environmental Economics
Advisory Board, composed of leading environmental economists– EPA Guidelines for Preparing Economic Analysis govern proper conduct of
economics
• Discussions with OMB, Congress, other stakeholders is on the economics – what is the appropriate economic treatment– Example: indirect emissions from biofuels
• Tremendous responsibility to do “good” science

18
Economists Participate in the Regulatory Process
• For every new rule, EPA forms a work group • If rule is economically significant, an economic subgroup is
created– On average, 6 to 12 rules per year deemed “economically significant”—
costs or benefits exceed $100 million.• Economics has a seat at the table, though its importance depends
on the decision maker.
• BCA has helped standardize and organize the risk assessments and other analysis supporting regulations

19
Four Important Types of Economic Analyses at EPA
• Benefit-Cost Analysis - Examines change in overall social welfare by summing individual changes in welfare– Social benefit - improvements in welfare– Social cost - declines in welfare
• Cost Effectiveness Analysis – Compare costs of alternatives for achieving a given objective by calculating the cost per unit benefit
• Economic Impact Analysis - Examines the magnitudes of specific economic changes and who they affect
– Environmental Justice
• BCA is one part of a complete “Economic Analysis” (which used to be called a Regulatory Impact Analysis) in addition to an impacts analysis, equity assessment, and cost-effectiveness analysis

20
Why Conduct Benefit-Cost Analysis?
• E.O. 12866 - assess benefits and costs of regulatory alternatives for significant actions (>$100m annually)
• Regulatory Right-to-Know Act (2001) - Benefits and costs of Federal rules (a) in the aggregate (b) by agency and agency program; and (c) by major rule.
• Other E.O.s and statutes - Two examples:– Regulatory Flexibility Act as amended by The Small Business Regulatory
Enforcement Fairness Act (1996) – E.O. 13045 “Children’s Health”

21
Efficiency of the Private Market
• Adam Smith showed that the private market can allocate and distribute resources efficiently. Inefficient users of resources go out of business.
• Economics identifies several market failures that justify government intervention:o Externalitieso Common propertyo Imperfect information– Income Redistribution, paternalism
Adam Smith (1723-1790)

22
Benefit-Cost Analysis as a Market Test
• Problem:– We cannot package clean air or clean water – they are public goods. – How can we apply the discipline of the private market to publicly provided or
mandated commodities?
• BCA simulates the private market test for public goods: Is society as a whole, better off with the regulatory action?– BCA quantifies all of the benefits and costs of producing environmental protection.– Consistent with private markets, the efficient outcome is the option that maximizes
net benefits.
• BCA is, therefore, an efficiency test for the production of environmental protection. It says very little about equity and fairness.

23
Economic Analysis Is One of Many Decision Criteria
• Political Concerns• Statutory Instruction• Institutional Feasibility• Technical Feasibility• Enforceability• Ethics
– Distributive Justice– Environmental Justice
• Sustainability• Benefits and Costs (Economic Efficiency)

24
Damage Function Approach
Benefits analysis draws upon results of other disciplines:– Epidemiology– Toxicology– Chemistry– Biology– Risk Assessment– Sociology
Emissions Exposure
Effects(dose-response)
Benefits($ for each effect)
Environmental concentrations

25
Co-benefits of Benefit Cost Analysis
• Contributions to Risk Assessment– Question use of threshold model for risk assessment, which fails to see that
additional benefits exist for reducing exposure beyond RfD
• Thinking on the Margin– Economists trained to think on margin– Lawyers, ecologists, health scientists, etc. are not
• “Anti-Trading”• Assessment of Climate Legislation• Green Jobs• Environmental Justice

26
26
The U.S. Environmental Management Process
IMPLEMENT CONTROL PROGRAMS
IMPLEMENT CONTROL PROGRAMS
ESTABLISHGOALS
ESTABLISHGOALS
DESIGN CONTROL STRATEGIES
DESIGN CONTROL STRATEGIESEVALUATE
RESULTS
EVALUATE
RESULTS
Scientific ResearchScientific Research
DETERMINE NECESSARY REDUCTIONS
DETERMINE NECESSARY REDUCTIONS

27
Past and Present Standards
27
00.20.40.60.81
1.21.41.6
1978 2008
1.5
0.15
U.S. Lead Standard
0
0.02
0.04
0.06
0.08
0.1
0.12
19791997
2008
0.12 0.12 0.12
0.080.075
U.S. Ozone Standards
1‐hour
8‐hour
No change for 30 years, order of magnitude change in level during the review
this year!
0
50
100
150
200
250
300
1971 1987 1997 2006
U.S. Particulate Matter Standards
TSP‐daily
TSP‐annual
PM10‐daily
PM10‐annual
PM2.5‐daily
PM2.5‐annual
Major changes in form and levels over time
28
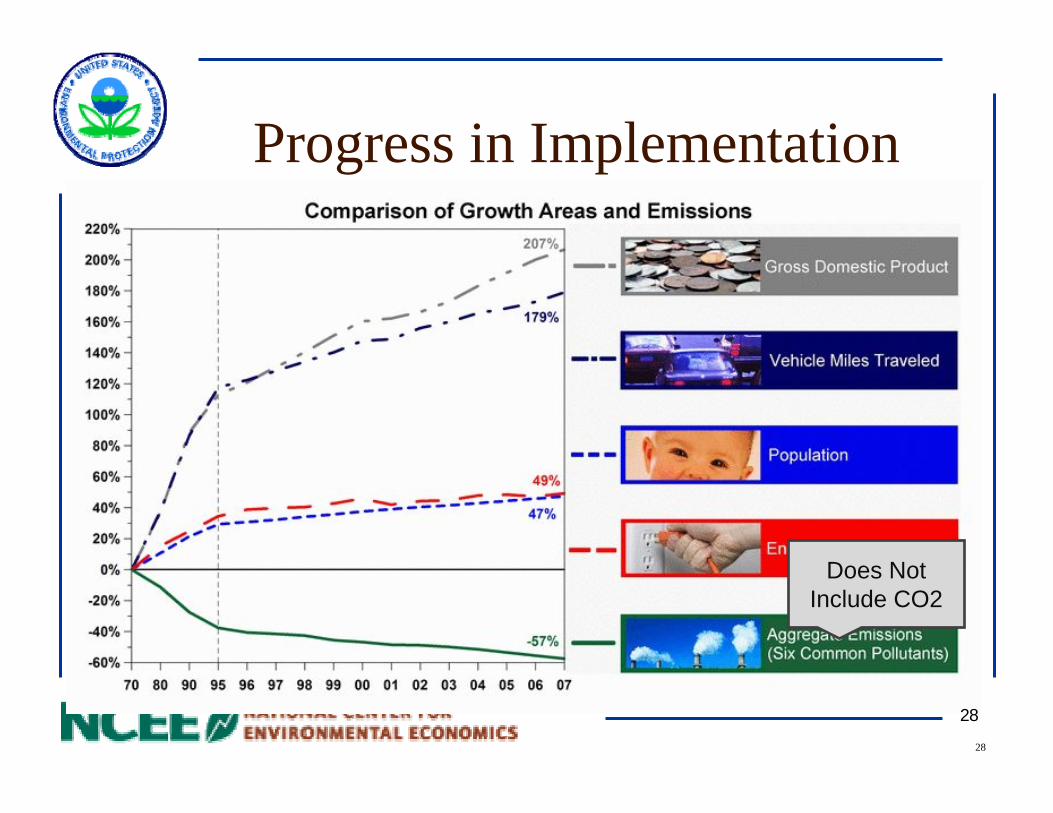
Progress in Implementation
28
Does Not Include CO2

29
29
Trends in the Levels of the Six Principle Pollutants Relative to U.S. National Standards: 1980 - 2006

30
30
1
3
4
32
23
180
1004
0 200 400 600 800 1000 1200
Agriculture
Visibility
Soiling
Lost IQ
Other Morb & RADs
Chronic Bronchitis
Mortality
Cost
Billions of 1990$
Annual Benefits and Costs of the 1970 Clean Air Act in 1990
26

31
31
<1
3
<1
2
6
100
27
0 20 40 60 80 100 120
Agriculture
Visibility
Productivity
Other Morbidity
Chronic Bronchitis
Mortality
Cost
Billions of 1990$
Projected Additional Annual Benefits and Costs of the 1990 Clean Air Act Amendments in
2010

32
One-Atmosphere Approach
Mobile Mobile SourcesSources
Industrial Industrial SourcesSources
Area Area SourcesSources
(Cars, trucks, planes,boats, etc.)
(Power plants, refineries/chemical plants, etc.)
(Residential, farmingcommercial, biogenic, etc.)
Chemistry
Meteorology
Air Toxics
PM
Acid Rain
Visibility
Ozone
Atmospheric Deposition
Climate Change

33
Nexus of PM, Ozone, and Toxics in the U.S.
33

34
34
NOx 36.50%
SO2 26.92%
CO 25.15%
PM10 6.12%
PM2.5 2.79% VOC
1.49%
HAP 0.95%
Ammonia 0.07%
NOx SO2 CO PM10 PM2.5 VOC HAP Ammonia
Multipollutant Emissions: Cement Manufacturing Sector

35
35
Air Pollution Control in the 21st Century
1920 1950 1970 1980 1990 2000
City County StateRegional-National-International
Los Angeles “photochemical smog”

36
Typical Elements of a Policy Analysis
Base Year Inventory
Control Strategies
and Costing
Air QualityModeling
BenefitsAnalysis
Economic Impact
Analysis
Projection YearInventories
(Base&Control)
Social Costs Social Benefits
Emissions Inventory Modeling & Development
EngineeringCosts
Modeled Concentration Changes
Model-ReadyEmissions Inventories
Policy ControlFactors
Growth Rates (economic, population)Future Control Factors
Air QualityData
Analysis
Future Air Quality Characterization
Policy Scenario
Development
Policy Scenarios
Ambient Monitoring Data
Meteorological Data
PolicyConcentration Changes
Health & Demographic DataValuation Functions

37
Benefits Analysis the EPA Way
38
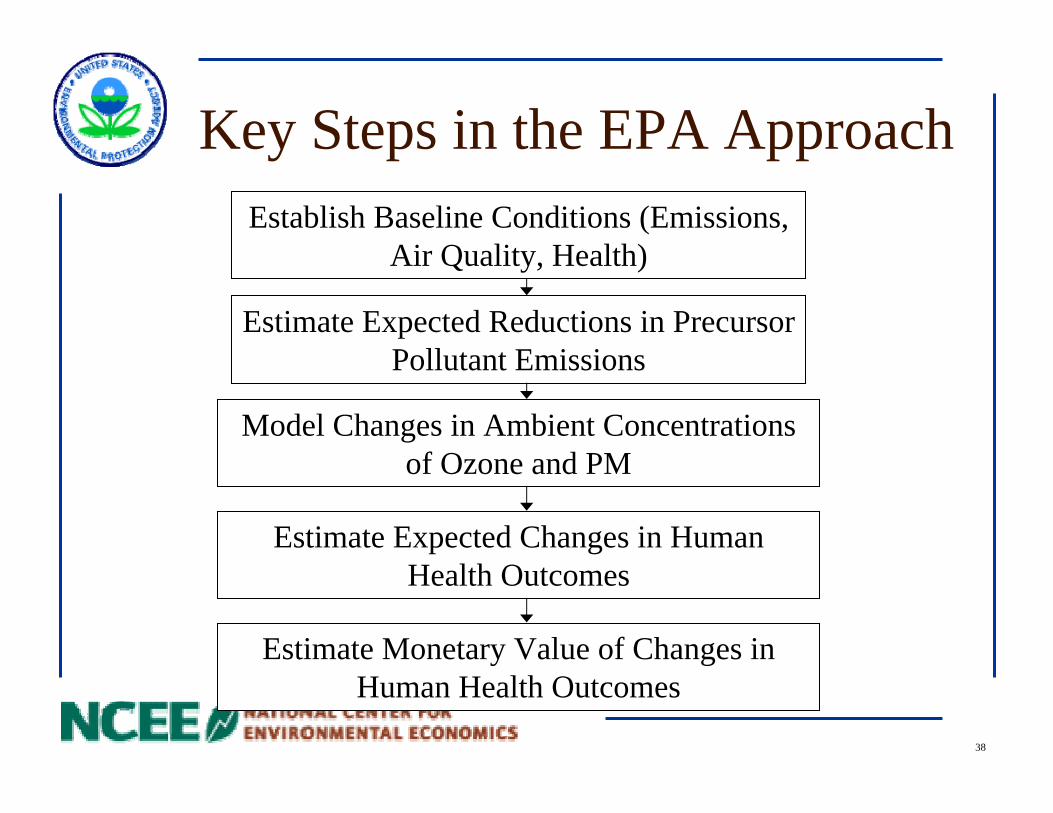
Key Steps in the EPA ApproachEstablish Baseline Conditions (Emissions,
Air Quality, Health)
Estimate Expected Reductions in Precursor Pollutant Emissions
Model Changes in Ambient Concentrations of Ozone and PM
Estimate Expected Changes in Human Health Outcomes
Estimate Monetary Value of Changes in Human Health Outcomes

39
What Are the Benefits of Reduced Air Pollution?
• Health– Reduced risk of premature death– Reduced risk of chronic illness, for example chronic bronchitis– Reduced risk of hospitalization– Reduced risk of respiratory illnesses and symptoms– Reduced sick days– Increased productivity for outdoor workers
• Welfare– Visibility improvements– Improved agricultural and forest yields– Reduced damage to structures– Reduced cleaning costs– Reduced ecosystem damages

40
How do we measure these benefits?
• Air quality models tell us how air quality is expected to change• Epidemiology studies give us concentration-response relationships
to predict how health effects will change• Economic studies tell us how much the changes in health and
welfare effects are worth

41
How does EPA choose health and welfare effects to include in a benefits analysis?
• Advice from the Science Advisory Board• Consistency with PM and ozone Criteria Documents and Staff Papers• Well established concentration-response functions available from the peer-reviewed
epidemiological literature• No double-counting of benefits• Focus on public health impacts rather than physiological responses• Focus on well defined changes in environmental quality that people can value

42
What do we report?• Nationally aggregated estimates of health and welfare
benefits for criteria air pollutants• For some regulations, regional or state level analyses are
conducted• In some recent analyses, information on air quality benefits
for subpopulations has been reported – may be useful in informing discussions on environmental justice or children’s health issues.
• Some health endpoints, such as asthma symptoms, may be focused on children or others with enhanced susceptibility to air pollution.

43
What health effects do we quantify?
Cardiovascular ER visits
School absence rates
Myocardial infarctions
Worker productivity
Work loss days
Asthma attacks
Acute respiratory symptoms
Asthma ER visits
Hospital Admissions
Chronic bronchitis
Mortality
OzonePM

44
What welfare effects do we quantify?
(not monetized)Improved Forest Yields
Improved Agricultural Yields
Reductions in Acid Deposition
Reductions in Nitrogen Deposition to Sensitive Estuaries
Reductions in Household Cleaning Expenditures
Visibility in Residential Areas
(complete coverage) (partial coverage)Visibility in National Parks
SensitivityBase

45
Dealing with Emerging Public Health Impacts
• Infant mortality/low birth weight• Attention Deficit Disorder, autism, and other diseases where
environmental contaminants may contribute to incidence• Decreased lung development• Doctor visits• New incidence of asthma• Mercury neurological impacts on children and cardiac impacts in
children and adults
• Not quantified due to– Lack of appropriate baseline incidence rates– Not enough weight of evidence– Not easily monetized or characterized in terms of public health
significance

46
Role of Transparency
• EPA must characterize the “science” well in BCA• Analysis must be transparent on how estimates were generated;
what science was used• Difference of opinion
– Peer review, public comment– EPA “brand”

47
Willingness to Pay• Measures a more complete value of avoiding a health outcome• Relies on either revealed or stated preferences for risk reductions
– Revealed preferences from labor market studies provide values for fatal risk reductions
– Stated preferences from “contingent valuation” studies provide values for chronic illnesses and acute respiratory effects
• Scientific exercise – not a normative assessment!!!

48
Current values for health effects• Premature death: $6.3 million• Chronic bronchitis: $340,000• Heart attacks: $66,000 - $140,000• Hospital admissions: $6,000 - $18,000• ER visits: $300• Respiratory symptoms $15 - $60• Asthma attacks $40• Work loss days $100• School absences $75

49
Results of recent analyses
• Reduction in utility SO2 by 5.4 million tons in 2015. Reduction in utility NOx by 2 million tons in 2015.
• 17,000 premature mortalities avoided• 8,700 cases of chronic bronchitis avoided• 13,000 hospital admissions avoided• Millions of respiratory symptoms days avoided• Millions of work loss days avoided• Valued at $100 billion (relative to $2.6 billion in costs)
Clean Air Interstate Rule
50
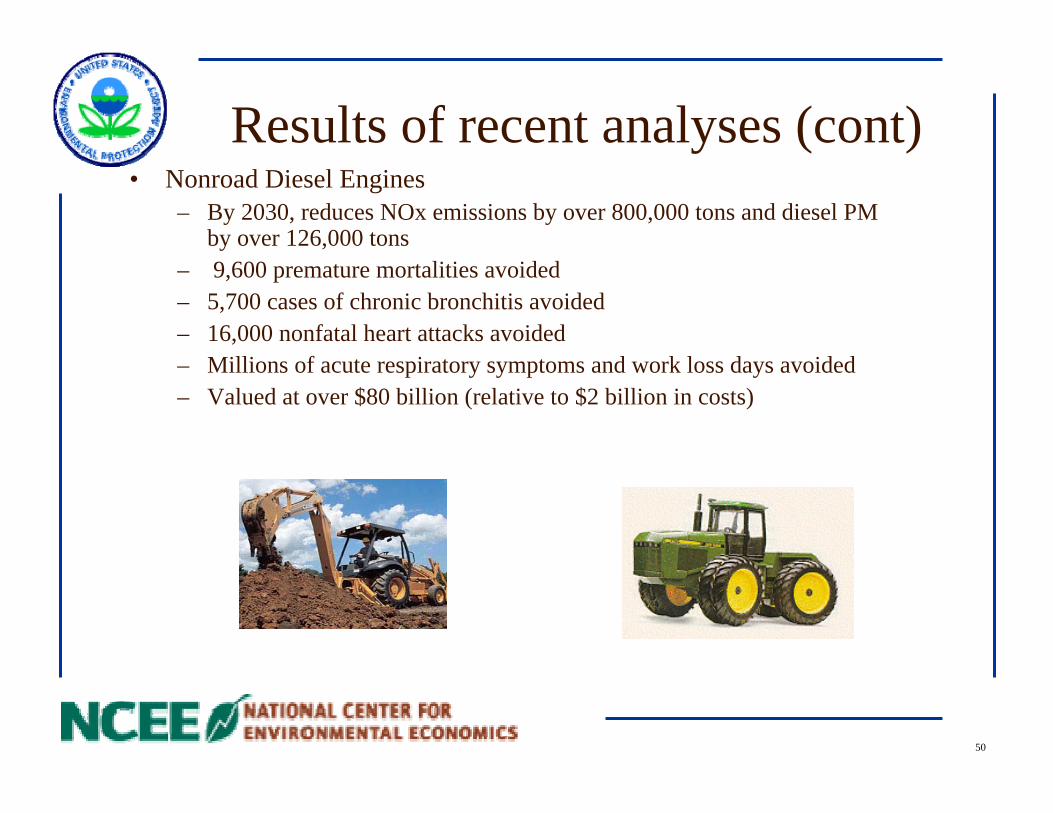
Results of recent analyses (cont)• Nonroad Diesel Engines
– By 2030, reduces NOx emissions by over 800,000 tons and diesel PM by over 126,000 tons
– 9,600 premature mortalities avoided– 5,700 cases of chronic bronchitis avoided– 16,000 nonfatal heart attacks avoided– Millions of acute respiratory symptoms and work loss days avoided– Valued at over $80 billion (relative to $2 billion in costs)

51
Examples of Feedback in Action
• Epidemiology: The case of fine particulate matter and prematuredeath
• Economics: The case of the “Senior Death Discount”

52
Case Example 1• Research
– Particulate Matter and Premature Death• Results
– Limited number of statistical studies showing a link between fine particulate matter and premature death, little supporting clinical or toxicological data
• Interpretation– EPA set new PM2.5 standards in 1997.– EPA estimated the new standards would result in 15,000 fewer deaths from PM2.5 in 2010.
• Reaction– Claims of “junk science” from industry and conservative stakeholders, demands for release of
research data, support from ALA and environmental groups, and hundreds of articles in the press and academic journals

53
• Outcomes– General Accounting Office Report: Use of Precautionary Assumptions in Health Risk
Assessments and Benefits Estimates• Found that EPA had not generally adopted precautionary assumptions in estimating
benefits of NAAQS– HEI Reanalysis costing ~ $2 million
• Affirmed findings of original studies• Suggested areas for additional research
– Extension of Freedom of Information Act• Requires agencies to “ensure that all data produced under a [Federal] award will be
made available to the public through procedures established under the FOIA.”• Still causing concerns within scientific community over confidentiality of subject
data and proprietary data– Appropriations bill language requesting NAS study of benefits analysis methods
• NAS study completed in 2002• Confirmed that EPA’s approach is generally reasonable• Recommended enhanced treatment of uncertainty, including that surrounding the
PM-mortality relationship• Suggested using “expert judgment” to help characterize uncertainty
– Hundreds of new studies examining the relationship between PM and health effects, sponsored by EPA, HEI, industry, and environmental or public health groups.
– Scientific foundation upheld– New, even tighter standards set in 2006
54
The “Senior Death Discount”• Analytical issue: Most of the premature mortality associated with air pollution occurs in
the elderly population, yet the value placed on reductions in premature mortality (the value of a statistical life or VSL) is based on working age adults.
• Research: How does the value of reductions in mortality risk (the value of a statistical life) vary with age?
• Results: Mixed, with some limited evidence from the UK and Canada suggesting individuals over the age of 65 have a VSL around a third lower than individuals aged 40. Research in the U.S. did not seem to support this relationship.

55
• Interpretation– EPA’s Science Advisory Board first suggested that if adjustments to
VSL for age are made they should be based on age specific willingness to pay for mortality risk reductions. Upon additional review, suggested we not correct for age. Other stakeholder groups suggested thatadditional adjustments could be made by using the value of life years gained rather than premature deaths avoided.
– EPA included a sensitivity analysis in an appendix to the RIA for the Heavy Duty Engines rule in 1999 showing the impact of different assumptions about the relationship between age and VSL. In the Clear Skies analysis of 2001, EPA constructed an “alternative estimate” of benefits that, among other assumptions, reduced the VSL for individuals over 65 by 35 percent. The alternative estimate was only 10 percent of the magnitude of the base estimate

56
• Outcomes– In early May, 2003, the EPA administrator announced EPA would not use age-adjusted
values in decision making– On May 30, 2003, OMB issued a memo directing federal agencies to cease using age-
adjusted VSL values in regulatory analysis– In July 2003, an amendment to a house appropriations bill was passed that forbid EPA from
using different values of VSL for different age groups (sponsored by Rep Allen and Waxman)
– In November 2003, an amendment to a senate appropriations bill was passed with similar provisions (sponsored by Sens Durbin, Snowe, Jeffords, Boxer, Lautenberg, Cantwell, and Lieberman)
– Research continues into the relationship between age and VSL– The most recent SAB advice is for EPA to use the same VSL for all ages, and to avoid
using the VSLY approach
• Reaction– Because of the large difference between the base and
alternative estimates, environmental groups became aware of the assumptions being used in the alternative analysis
– The term “Senior Death Discount” was coined and public outcry over the practice became pronounced.
– Dozens of articles in major newspapers and journals were published criticizing the use of lower VSL for older individuals.

57
So How Do We Improve the Process?
• Clear from the two examples that we need a better understanding of uncertainty in the translation of scientific results into policy analysis
• Also need better communication with stakeholder groups to explain our choices of assumptions
• Moving forward in both areas through tool development

58
What About Climate?• Climate analysis is even more complicated
– Current techniques are limited to aggregate impacts -- generally global or regional $/ton of CO2
– Significant omitted categories and large data gaps– Hard to deal with highly uncertain events with large impacts, e.g. collapse of ice shelf– Not clear how to treat global vs. domestic impacts
• Important issue of how to treat intergenerational benefits

59
Observations
• Do you want bureaucrats or political leaders free to make up values or benefits of environmental regulations?– Use of stated preference surveys to measure benefits is a customer survey
• Do you want a black box? (No benefit-cost analysis)• Should the public know what a regulation will cost? How it will
improve our lives?• Should Congress know about benefits and costs when determining
budgets, writing laws? • In addition to benefits and costs, distributive justice, legal,
enforcement, and political concerns are also on the table. Analysis that falls out of the BCA informs these concerns as well