Bending strength of delaminated aerospace...
18
Phil. Trans. R. Soc. A (2012) 370, 1780–1797 doi:10.1098/rsta.2011.0337 Bending strength of delaminated aerospace composites BY MOUSTAFA KINAWY,RICHARD BUTLER* AND GILES W. HUNT Composites Research Unit, Department of Mechanical Engineering, University of Bath, Bath BA27AY, UK Buckling-driven delamination is considered among the most critical failure modes in composite laminates. This paper examines the propagation of delaminations in a beam under pure bending. A pre-developed analytical model to predict the critical buckling moment of a thin sub-laminate is extended to account for propagation prediction, using mixed-mode fracture analysis. Fractography analysis is performed to distinguish between mode I and mode II contributions to the final failure of specimens. Comparison between experimental results and analysis shows agreement to within 5 per cent in static propagation moment for two different materials. It is concluded that static fracture is almost entirely driven by mode II effects. This result was unexpected because it arises from a buckling mode that opens the delamination. For this reason, and because of the excellent repeatability of the experiments, the method of testing may be a promising means of establishing the critical value of mode II fracture toughness, G IIC , of the material. Fatigue testing on similar samples showed that buckled delamination resulted in a fatigue threshold that was over 80 per cent lower than the static propagation moment. Such an outcome highlights the significance of predicting snap-buckling moment and subsequent propagation for design purposes. Keywords: buckling; delamination bending; fracture toughness; fatigue; mixed mode 1. Introduction Propagation of damage owing to buckling of delaminations is one of the critical causes of failure in composite laminates. Such internal delaminations can originate from manufacturing defects or during service where low-velocity impact damage can result in barely visible sub-layer delaminations. These may significantly decrease the load-carrying capacity of the structure concerned. Modelling of buckling-driven delaminations has been studied by many researchers. A good deal of work has investigated buckled delaminations under compressive loading. A one-dimensional mathematical model for delamination growth in a strut under compression was developed by Chai et al. [1]. They introduced a formula calculating the strain energy release rate in terms of buckling and propagation strains of a thin sub-laminate in the strut. Chai et al.[2] extended *Author for correspondence ([email protected]). One contribution of 15 a Theme Issue ‘Geometry and mechanics of layered structures and materials’. This journal is © 2012 The Royal Society 1780 on May 31, 2018 http://rsta.royalsocietypublishing.org/ Downloaded from
Transcript of Bending strength of delaminated aerospace...

Phil. Trans. R. Soc. A (2012) 370, 1780–1797doi:10.1098/rsta.2011.0337
Bending strength of delaminated aerospacecomposites
BY MOUSTAFA KINAWY, RICHARD BUTLER* AND GILES W. HUNT
Composites Research Unit, Department of Mechanical Engineering,University of Bath, Bath BA27AY, UK
Buckling-driven delamination is considered among the most critical failure modes incomposite laminates. This paper examines the propagation of delaminations in a beamunder pure bending. A pre-developed analytical model to predict the critical bucklingmoment of a thin sub-laminate is extended to account for propagation prediction,using mixed-mode fracture analysis. Fractography analysis is performed to distinguishbetween mode I and mode II contributions to the final failure of specimens. Comparisonbetween experimental results and analysis shows agreement to within 5 per cent in staticpropagation moment for two different materials. It is concluded that static fracture isalmost entirely driven by mode II effects. This result was unexpected because it arisesfrom a buckling mode that opens the delamination. For this reason, and because of theexcellent repeatability of the experiments, the method of testing may be a promisingmeans of establishing the critical value of mode II fracture toughness, GIIC, of thematerial. Fatigue testing on similar samples showed that buckled delamination resulted ina fatigue threshold that was over 80 per cent lower than the static propagation moment.Such an outcome highlights the significance of predicting snap-buckling moment andsubsequent propagation for design purposes.
Keywords: buckling; delamination bending; fracture toughness; fatigue; mixed mode
1. Introduction
Propagation of damage owing to buckling of delaminations is one of the criticalcauses of failure in composite laminates. Such internal delaminations can originatefrom manufacturing defects or during service where low-velocity impact damagecan result in barely visible sub-layer delaminations. These may significantlydecrease the load-carrying capacity of the structure concerned.
Modelling of buckling-driven delaminations has been studied by manyresearchers. A good deal of work has investigated buckled delaminations undercompressive loading. A one-dimensional mathematical model for delaminationgrowth in a strut under compression was developed by Chai et al. [1]. Theyintroduced a formula calculating the strain energy release rate in terms of bucklingand propagation strains of a thin sub-laminate in the strut. Chai et al. [2] extended
*Author for correspondence ([email protected]).
One contribution of 15 a Theme Issue ‘Geometry and mechanics of layered structures andmaterials’.
This journal is © 2012 The Royal Society1780
on May 31, 2018http://rsta.royalsocietypublishing.org/Downloaded from

Bending of delaminated composites 1781
their previous model to incorporate parameters affecting delamination growth oftwo-dimensional delaminated plates under compression. An analytical model byShan & Pelegri [3] accounted for forces and moments at the delamination tipswhen the local buckling of the sub-laminate interacted with global buckling ofthe specimen.
More recently, fatigue failure of composites has been predicted, followingbuckling of the thin sub-laminate created by delamination. Rhead et al. [4]concluded that when the applied compressive strain is sufficiently above the thinsub-laminate buckling strain level, the failure of a delaminated composite plateunder compression occurs. They also gave an approximate, model-based methodfor predicting the fatigue strain level below which propagation would not occur.Their so-called Strip model was validated using experimental tests and nonlinearfinite-element analysis [5].
Pure compression of structures in real loading scenarios is less frequent thanbending-induced compression. Delamination opening owing to bending has beeninvestigated. A low-dimensional model developed by Murphy & Nichols [6] wasintroduced to obtain the critical moment at which buckling of a thin sub-laminatecreated by a delamination could occur within a cantilever beam under bending.Buckling owing to pure bending was studied by Kardomateas [7] who derived aformula for snap-buckling moment level at which delaminations instantaneouslyswitch from closing to opening.
Curved composite beams with delamination were examined by Wang &Shenoi [8] who developed an analytical model to study the propagation of adelamination placed near the outer surface under an opening moment. In theirwork, they concluded that the initial beam curvature and the arc angle of thedelamination have significant effects on propagation. The delamination problemhas also been covered in the analysis of microelectro mechanical systems. Koselet al. [9] presented a mathematical model predicting the level of axial force fordelamination of the top layer of a two-layer plate. Their model included the elasto-plastic effect between the bonded layers. The model was solved numerically andverified by experimental testing. Shan & Pelegri [10] introduced an analyticalmodel of fracture behaviour for a cross-ply composite cantilever beam with anartificially embedded delamination. They also modelled the effect of loadingasymmetry in the delamination contact zones by finite elements. They concludedthat failure was dominated by mode II effects owing to a large contact zoneand that the deeper the delamination, the weaker the structure would becomewith respect to propagation. Kinawy et al. [11] gave a lower bound predictionof the critical moment for snap-buckling moment for a thin sub-laminate ina composite beam under pure bending. The model assumed isotropic materialfor both the sub-laminate and the base laminate. It also distinguished thebifurcation behaviour of the sub-laminate, which switches from a closing to anopening mode.
This paper will investigate the post-buckling of a delaminated beam in bendingand predict the moment at which the delamination propagates. A three degreeof freedom Rayleigh–Ritz model for post-buckling is used to determine themode I and II strain energy release rates, from which propagation is predicted.A comparison of the analytical model with experiments will be presented forpropagation of unidirectional laminates constructed from two types of compositematerial. The results of a series of fatigue tests will also be presented.
Phil. Trans. R. Soc. A (2012)
on May 31, 2018http://rsta.royalsocietypublishing.org/Downloaded from

1782 M. Kinawy et al.
M
at
Q1
L
w1,2x1,2
–Q2
1
2
t
M
Figure 1. Delaminated beam coordinates and variables.
2. Analytical modelling
(a) Post-buckling analysis
Although the post-buckling analysis has been presented by Kinawy et al. [11], itis briefly described here because it forms the basis for subsequent propagationmodelling. The model assumes that the beam is isotropic and the undelaminatedend laminates are ignored in the prediction of the snap-buckling (or opening)moment, whereas the delaminated parts are modelled with bending and in-planestiffness. Further assumptions are that rotation of the undelaminated region andeach delaminated part is the same at their intersection, and that there is nofriction between laminates at the interface. The end rotation forms one of thedegrees of freedom Q2. A second degree of freedom represents the end-shorteningof the sub-laminates over the delaminated region. A further degree of freedom isused to describe the buckling displacement of the delaminated parts Q1. Figure 1shows a schematic of the delaminated beam and the applied moment. Note thatpositive Q1 and negative Q2 produce opening.
The displacement functions for the delaminated and base parts are givenas follows:
w1(x) = Q1 sin2(px1
L
)+ Q2 x1
(L − x1
L
)(2.1)
and
w2(x) = Q2x2
(L − x2
L
). (2.2)
The effect of initial imperfection was introduced to the model to investigatehow the inclusion of an idealized polytetrafluoroethylene (PTFE) layer used tocreate a delamination within the composite layers would affect snap-buckling.The imperfection is assumed to have a sine-squared function of the form
w0(x) = Q0 sin2(px1
L
). (2.3)
In order to calculate the stretching energies in the system, the axial endshortening for the thin and thick sub-laminates is as follows:
d1 = D − 12
∫L
0
(d(w1 − wo)
dx1
)2
dx1 − Q2(1 − a)t (2.4)
Phil. Trans. R. Soc. A (2012)
on May 31, 2018http://rsta.royalsocietypublishing.org/Downloaded from

Bending of delaminated composites 1783
and
d2 = D − 12
∫L
0
(dw2
dx2
)2
dx2 + Q2at. (2.5)
The strain energy of the system is obtained in terms of bending (UB) andstretching (US) energy as follows:
UB = EI1
2
∫L
0
(d2(w1 − wo)
dx21
)2
dx1 + EI2
2
∫L
0
(d2w2
dx22
)2
dx2 (2.6)
and
US = t2L
(Ead21 + E(1 − a)d2
2). (2.7)
The total potential energy of the system is
V = UB + US − 2MQ2. (2.8)
Substituting the displacement equations into the former equation leads to apotential function, including three degrees of freedom in addition to the loadingmoment, V (Q1, Q2, D, M ). By solving the partial equilibrium equation withrespect to D, i.e. vV (Q1, Q2, D, M )/vD = 0 and substituting the resulting terminto V, we obtain a two degree of freedom term V (Q1, Q2, M ), i.e. vV /vQ1 = 0,vV /vQ2 = 0.
Solving the adapted system of equations as reported previously by Huntet al. [12], the buckling displacement and rotation (Q1, Q2) are evaluated asfunctions of applied bending moment (M ). The derivation process was carriedout with mathematical manipulation software.
(b) Propagation prediction using thin-film analysis
As the sub-laminate length to thickness ratio was approximately 80 for theexample considered here, it can be approximated as an Euler strut, whichis compressed under bending. For predicting the propagation moment of thesub-laminate, a one-dimensional mode by Chai et al. [1] was initially used. Thismodel assumes that the ends of the thin sub-laminate do not rotate and calculatesthe critical strain energy release rate for the propagation of a compressedsub-laminate as follows:
G = Eat2
(3 − 3C)(3 + 33C). (2.9)
The model ignores any bending energy that is released from the thick lowersub-laminate or from the end laminates. The buckling strain 3C for the sub-laminate was calculated using the Euler formula for buckling of a strut fixedat each end, equation (2.10), whereas the applied strain 3 was formulated usingequation (2.11),
3C = p2a2t2
3L2(2.10)
and
3 = 6M (1 − a)Et2
. (2.11)
Phil. Trans. R. Soc. A (2012)
on May 31, 2018http://rsta.royalsocietypublishing.org/Downloaded from

1784 M. Kinawy et al.
MM1
at(1
– a)
t
M2P1
P1
Figure 2. Force and moment components at the delamination edge. (Online version in colour.)
(c) Mixed-mode propagation
Existence of curvature at the sub-laminate ends indicates that both mode I andmode II effects should be taken into consideration. The strain energy release rates(GI and GII) are calculated based on the stress intensities factors (KI and KII)near the delamination tips using the approach taken by Hutchinson & Suo [13],which assumed homogeneous isotropic layers and that force components are perunit width. The stress intensity factors are as follows:
KI = P√2atU
cos u + M ∗√
2a3t3Vsin(u + g) (2.12)
and
KII = P√2atU
sin u − M ∗√
2a3t3Vcos(u + g), (2.13)
where P and M ∗ are the linear combinations of the applied force P1, and momentsM and M1 at the delamination edges shown in figure 2,
P = P1 − CMat
and M ∗ = M1 − C ∗M ,
and the geometrical factors are
C = 6/h
(1/h + 1)3, C ∗ = 1
(1/h + 1)3, h = a
1 − a,
1U
= 1 + 4h + 6h2 + 3h3 and1V
= 12(1 + h3).
g and u are obtained through
u = 52.1◦ − 3◦h and sin g = 6h2(1 + h)√
UV ,
from which the following strain energy release rates are obtained:
GI = K 2I
2Eand GII = K 2
II
2E, (2.14)
where E is the effective longitudinal modulus for the layer material. The divisionby 2 in equation (2.14) is added assuming that propagation occurs at bothdelamination fronts simultaneously as a result of symmetry.
Phil. Trans. R. Soc. A (2012)
on May 31, 2018http://rsta.royalsocietypublishing.org/Downloaded from

Bending of delaminated composites 1785
15 15120
rollers
double screw
specimen
pivot
Figure 3. Four-point bending test fixture showing specimen with delamination open (loaded abovesnap-buckling moment). Dimensions are in millimetres.
In order to obtain the strain energy release rates in equation (2.13), the forceP1 and moment M1 at the left end of the thin sub-laminate are required. Thethin sub-laminate is assumed to carry only the critical buckling load, i.e.
P1 = 3CEat, (2.15)
where 3C is derived using equation (2.10). M1 is calculated from the curvature ofthe thin sub-laminate, obtained by evaluating the second derivative of equation(2.1) at x1 = 0.
3. Experimental setup and methodology
Static tests were performed on specimens made from two different materialsto understand their buckling and propagation behaviour. Specimens with 4 mmnominal thickness were manufactured from a 16 ply unidirectional T800/M21and a 32 ply unidirectional IM7/8552, where each had fibres aligned alongthe specimen length. In order to form a through-width delamination, a PTFElayer of 0.02 mm thickness was placed at the mid-length of each plate at adepth of thickness ratio a = 0.125, i.e. between the second and third ply for theT800/M21 plate and between the fourth and fifth ply for the IM7/8552 plate.The delamination length in both arrangements was 40 mm. The plates were laidup, bagged and then cured using an autoclave. The cured plates were cut intospecimens with dimensions of 220 × W × t mm, where W and t are given intables 1 and 2. Each specimen had two strain gauges positioned on the centreof the top and bottom surfaces to measure the strain at which buckling of thesub-laminate occurred. An INSTRON-1332 servo-hydraulic machine with 10 kNload cell was used for loading application. The strain gauges and loading channelfrom the servo-hydraulic machine were connected to a SPIDER-8 data-acquisitionsystem, which was attached to a PC. The specimens were then loaded throughthe four-point bending fixture shown in figure 3 under displacement control. The
Phil. Trans. R. Soc. A (2012)
on May 31, 2018http://rsta.royalsocietypublishing.org/Downloaded from

1786 M. Kinawy et al.
Table 1. Static test results for T800/M21 specimens.
snap-buckling propagationwidth, thickness, moment moment
test no. W (mm) t (mm) (N m m−1) (N m m−1)
1 8.38 4.22 668 27792 8.41 4.31 273 26453 8.14 4.17 247 28244 9.15 4.22 273 25735 10.98 4.27 267 26756 10.78 4.30 320 28537 10.95 4.24 298 —8 10.94 4.33 261 —9 11.00 4.22 221 —average 10.27 4.25 270 2725CV (%) 1 1 12 4
Table 2. Static test results for IM7/8552 specimens.
snap-buckling propagationwidth, thickness, moment moment
test no. W (mm) t (mm) (N m m−1) (N m m−1)
1 10.40 3.96 152 22002 10.34 3.97 221 23003 10.18 3.99 287 23004 10.25 3.97 283 21505 10.24 3.96 184 23446 10.20 3.95 176 2230average 10.27 3.97 217 2254CV (%) 1 1 30 3
fixture had movable supports to adjust the inter distances and a pivot to ensureuniform bending load application. The centre of delaminations was positioned atthe centre of the fixture upper and lower parts.
4. Experimental results
Strain gauges were used to observe the change in strain value on top and bottomsurfaces of the specimen, where a sudden change of the top strain gauge indicatedbuckling of the sub-laminate. The slopes of both gauge lines were shown to belinear up to snap-buckling. The change in strain was found to occur suddenly insome specimens and with small smooth transition in others. The snap-bucklingmoment was taken as the moment at which the surface strain switched fromcompression to tension. Tables 1 and 2 show snap-buckling moment values fordifferent tested specimens manufactured from both materials. In table 1, it isshown that the moment values for the snap-buckling had an average value of
Phil. Trans. R. Soc. A (2012)
on May 31, 2018http://rsta.royalsocietypublishing.org/Downloaded from

Bending of delaminated composites 1787
3500
3000
2500
1500
500
M (
N m
m–1
)
0 0.5 1.5 2.51.0 2.0actuator displacement (mm)
3.0 4.0
propagation
3.5
1000
2000 specimenfailure
Figure 4. Applied moment versus displacement for T800/M21 specimen.
270 N m m−1 for T800/M21 specimens, whereas one test showed a higher momentvalue of 668 N m m−1. The average measured strain on the compression surface atbuckling was around 510 microstrain. Table 2 presents an average snap-bucklingmoment of 217 N m m−1 for IM7/8552 specimens. The sub-laminate bucklingmode tended to have the form of a clamped–clamped buckling mode in bothspecimen sets. Note that specimens number 7, 8 and 9 in table 1 were initiallyloaded under static moment to acquire the snap-buckling level, and then werefurther tested in fatigue under higher loading cycles.
(a) Propagation moment results
While increasing the load, the strain gauges failed to give any reading abovea strain level of about 6000 microstrain. Hence, in order to observe the momentvalue at which propagation occurred, a load versus actuator displacement plot wasacquired. Figure 4 shows a plot for one of the T800/M21 specimens. Propagationoccurred as displacement increased, whereas load was constant. Simultaneousdelamination growth at both ends was observed during this region until thespecimen reached its full failure. The propagation moment values for bothspecimen sets are shown in tables 1 and 2. The average propagation momentvalues were 2725 and 2254 N m m−1 for T800/M21 and IM7/8552 specimens,respectively.
(b) Electron scanning microscopy
The images in figure 5 show electron scanning microscopy (ESM) scans of twospecimens made of the T800/M21 material system. Images in figure 5a,b are fora specimen tested in pure mode I conditions using the double cantilever beam(DCB) test, according to American Society for Testing and Materials D-5528. Theimages show the damage propagated in the resin rich areas and as the distancefrom the crack edges increases, the proportion of resin damage decreases and thedamage was dominated by fibre bridging [14]. Figure 5c,d shows images obtainedfor one of the through-width centred-delamination specimens tested under four-point bending, as described earlier. Such loading allowed the top delaminated
Phil. Trans. R. Soc. A (2012)
on May 31, 2018http://rsta.royalsocietypublishing.org/Downloaded from

1788 M. Kinawy et al.
(a) (b)
(c) (d )
0° 0°
0°0°
Figure 5. Electron scanning microscopy (ESM) images of fracture surfaces for T800/M21 material.(a) Double cantilever beam (DCB) specimen near delamination front. (b) DCB specimen 20 mmaway from delamination front. (c) Four-point bending specimen near delamination front. (d) Four-point bending specimen 20 mm away from delamination front. In all cases, the fibre direction isshown.
layer to buckle and then to propagate as the load advanced. The image of figure5c shows that damage was dominated by shear cusps, which characterize failurefor mode II fracture [14]. The cusps are distributed within the resin area withvalleys perpendicular to the fibre direction. Figure 5d, taken around 20 mm awayfrom the delamination front, shows that the proportion of fractured zones issimilar to that near the delamination front. This suggests that the delaminationis also dominated by mode II fracture away from the delamination front owingto the large contact area at this front.
5. Fatigue test results
In order to study the fatigue strength, a series of fatigue tests was performed underfour-point bending. A varying pure bending moment was applied to investigatethe delamination growth. The loading moment was applied so that the sub-laminate was kept under compression throughout the fatigue cycle. The loadingratio R is defined as the ratio between the maximum to minimum applied
Phil. Trans. R. Soc. A (2012)
on May 31, 2018http://rsta.royalsocietypublishing.org/Downloaded from

Bending of delaminated composites 1789
40
35
30
25
20
15
10
102 103 104 105 106 107
dela
min
atio
n ex
tens
ion
(mm
)
5
cycles (N)
0.1725
0.245
0.750.60
0.21
0.85
0
Figure 6. Delamination extension versus number of cycles for T800/M21 specimens at a range ofseverities. Note that the severity level of 1.0 indicates a maximum value of moment = 2725 N m m−1.(Online version in colour.)
35
30
25
20
15
10
102 103 104 105 106 107
dela
min
atio
n ex
tens
ion
(mm
)
5
cycles (N)
0.175
0.25
0.80.6 0.3
0
Figure 7. Delamination extension versus number of cycles for IM7/8552 specimens at a range ofseverities. Note that the severity level of 1.0 indicates a maximum value of moment = 2254 N m m−1.(Online version in colour.)
moment within the cycle. For all tests, the loading ratio was kept at R = 10with a test frequency of 4 Hz. The severity is calculated as the ratio betweenthe maximum applied moment during the cycle to the average propagationmoment from the static tests for both material specimens. Specimens were testedunder loading control. The loading severity ranged from 0.85 to 0.17, so thata part of the loading cycle always passed through the average critical snap-buckling moment value observed in static tests. The tested specimens had similardimensions to those tested under static loading with their sides marked with 1 mmgratings around the delamination ends in order to monitor the total delaminationextension during testing. They were loaded by the four-point bend fixture shownin figure 3. The tests were stopped after 106 cycles or if specimen failure occurred.Figures 6 and 7 represent the delamination extension versus number of cycles for
Phil. Trans. R. Soc. A (2012)
on May 31, 2018http://rsta.royalsocietypublishing.org/Downloaded from

1790 M. Kinawy et al.
Table 3. Mechanical properties for T800/M21 and IM7/8552 carbon prepregs.
E11 GIC GIIC cured ply thicknessmaterial (GPa) (J m−2) (J m−2) (mm)
T800/M21 139 550 1400 0.260IM7/8552 161 210 1000 0.123
different severities of load applied to specimens made from the two materials.The delamination growth decreased as the severity level decreased until reachingno delamination growth at a severity level of 0.1725 and 0.175 after 106 cycles forthe T800/M21 and IM7/8552 materials, respectively.
6. Analytical model results
The model was verified through three steps: first to check the snap-bucklingmoment level, second to check the kinematics during the post-buckling processand finally to check the propagation moment value. For the sake of verification,the two delaminated beam specimens described earlier were analysed. The firstset was manufactured from 16 layers of unidirectional T800/M21 carbon fibreprepreg, whereas the second was from 32 layers of unidirectional IM7/8552 carbonprepreg. Mechanical properties for each material system are listed in table 3.
(a) Snap-buckling moment
By minimizing the energy of equation (2.8) with respect to Q1 and Q2, thesnap-buckling amplitude Q1 and end rotation Q2 are obtained as functionsof the applied bending moment, M . The system of equations was solved forboth material systems assuming an initial imperfection value Q0 = 0.02 mm inequation (2.3). Average moduli and cured ply thicknesses (table 3) were used asthe model assumes the material to be isotropic. The resulting solution of Q1 forthe T800/M21 beam configuration is shown in figure 8. Note that the infeasiblesolution (negative side) corresponds to the thin and thick sub-laminates passingthrough each other.
As seen in figure 8, the critical moment for the equilibrium solution does notappear as a distinct point on the moment versus Q1 plot. The critical moment foran unstable system is characterized by more rapid growth of the deflections asthe critical moment of the perfect system is approached [15]. In order to obtainthis point, a parametric study was carried out on the system of equations bychanging the initial imperfection value (Q0) to produce the convergence trendof the resulting (Q1) plots (figure 8). For the aforementioned delaminated beamsystem, the imperfection was changed from 0.02 to 0.07 mm, which showed thatthe critical moment level converged around a value of 300 N m m−1 for T800/M21specimen configuration. Running similar analysis, a value of 230 N m m−1 wasobtained for snap-buckling of the IM7/8552 specimen configuration. Note that,in reality, the tests contained varying amounts of geometrical imperfection and
Phil. Trans. R. Soc. A (2012)
on May 31, 2018http://rsta.royalsocietypublishing.org/Downloaded from

Bending of delaminated composites 1791
800
700
600
500
400
300
200
100
M (
N m
m–1
)
00
Q1 (mm)
Q0 (mm)
4
0.020.030.040.050.060.07
6 82
unfeasiblesolution
unstablebuckling
stablebuckling
criticalmoment
–4 –2
Figure 8. Equilibrium solutions showing analytical displacement Q1 against applied moment perunit width M for a range of imperfections Q0 (T800/M21 specimen). (Online version in colour.)
manufacturing defects, hence the scatter in snap-buckling moments in tables 1and 2. For both types of laminates, some specimens exhibited a higher snap-buckling moment above the average value, whereas others were below it. Hence,in order to confirm the difference between the experimental and theoretical value,further experiments are required.
(b) Kinematic results
The kinematics of the model are important in order to obtain the force andmoment components at the delaminated fronts. Such components were used tocalculate the strain energy release rate at propagation. This was performed bymeasuring the out-of-plane displacement (Q1) experimentally and comparing itagainst the analytical value. A high-resolution camera was used to take snapshotscentred and focused on one side of the specimen at different loads. Each image wasthen enlarged to its maximum resolution capacity to reduce the measuring error.Finally, vector image manipulation software was used to measure the requiredvalue. The opening displacement (Q1) was measured between the innermostedges of the upper and lower sub-laminates and then compared with the totalthickness of the specimen at a marked place that was initially measured using adigital vernier. Figure 9a,b shows graphical comparisons between experimentallyacquired values for opening displacement (Q1) and the predicted values by themodel. There is good agreement between the experiment and model for both theT800/M21 and the IM7/8552 material specimens.
Phil. Trans. R. Soc. A (2012)
on May 31, 2018http://rsta.royalsocietypublishing.org/Downloaded from

1792 M. Kinawy et al.
3000(a)
(b)
2500
1500
500
0
0.5 1.0 2.0 3.02.51.5
2000
1000M (
N m
m–1
)
3000
2500
1500
500
0
2000
1000M (
N m
m–1
)
Q1 (m m)
Q1M M
Q11
2
1
2
M M
Figure 9. Out-of-plane displacement Q1 comparison for (a) T800/M21 specimen and (b) IM7/8552specimen. In both analyses, Q0=0.02 mm. (a, b) Diamonds denote analytical; squares denoteexperimental. (Online version in colour.)
(c) Propagation moment
After investigating the model kinematics, the post-buckling results of theanalytical model were used to predict the propagation moment using twoanalytical methods. The first method was based on thin-film analysis [1]. As aninitial approximation, mode I critical values of GIC for T800/M21 and IM7/8552configurations were substituted in equation (2.9), then equations (2.10) and(2.11) were used to calculate moment levels for propagation. They were foundto be 1430 and 850 N m m−1 for T800/M21 and IM7/8552, respectively, whichare significantly less than the average value from static tests results. Such acomparison suggests that mode II has more influence upon propagation thanmode I, and so two mixed-mode analyses are considered next.
The second analytical method was based on the assumption of an isotropicmaterial. The key material properties for predicting the propagation usingthe latter method were axial modulus, critical fracture toughness for mode Iand critical fracture toughness for mode II. The model calculates the mode I andmode II energy components using the moment and force values at thedelaminated edge, as described through equations (2.12)–(2.14). Such valueswere calculated from the post-buckling analysis. The values of Q1 and Q2
Phil. Trans. R. Soc. A (2012)
on May 31, 2018http://rsta.royalsocietypublishing.org/Downloaded from

Bending of delaminated composites 1793
1200
1400
1600
1800
2000
1000
800
600
400
200stra
in e
nerg
y re
leas
e ra
te (
J m–2
)
00 500 1000 1500 2000
3.6%
M (N m m-1)
30002500
mix
ed m
ode
buck
ling
aver
age
expe
rim
enta
lpr
opag
atio
n m
omen
t
mixed mode analysis (GI)mixed mode analysis (GII)thin-film analysis
GIIC
GIC
Figure 10. Strain energy release rate using the thin-film and mixed-mode analyses for thedelaminated, post-buckled beam: T800/M21 specimens. (Online version in colour.)
1200
1000
800
600
400
200
stra
in e
nerg
y re
leas
e ra
te (
J m–2
)
00 500 1000 1500 2000
M (N m m-1)30002500
mix
ed m
ode
buck
ling
aver
age
expe
rim
enta
lpr
opag
atio
n m
omen
t
2%
mixed mode analysis (GI)mixed mode analysis (GII)thin-film analysis
GIIC
GIC
Figure 11. Strain energy release rate using the thin-film and mixed-mode analyses for thedelaminated, post-buckled beam: IM7/8552 specimens. (Online version in colour.)
were extracted for the stable branch of the equilibrium diagram in figure 8 byminimizing the energy of equation (2.8). Strain energy release rate for mode Iand mode II components (GI and GII) were evaluated using equation (2.14).
The critical mode II toughness value GIIC is generally thought to be anunpredictable material property. Therefore, it was checked against resultsobtained elsewhere for the M21 resin and found to range from 1200 [16] to1600 J m−2 [17]. For analysis of T800/M21 specimens, the critical value for GIICwas taken as 1400 J m−2, similar to a characterization test by Ilias [18]. Fracturetoughness values, GIC and GIIC, for IM7/8552 material were assumed to be210 and 1000 J m−2, respectively [19]. The failure index (GI/GIC + GII/GIIC) wascalculated for specimens made from both material configurations.
Phil. Trans. R. Soc. A (2012)
on May 31, 2018http://rsta.royalsocietypublishing.org/Downloaded from
1794 M. Kinawy et al.
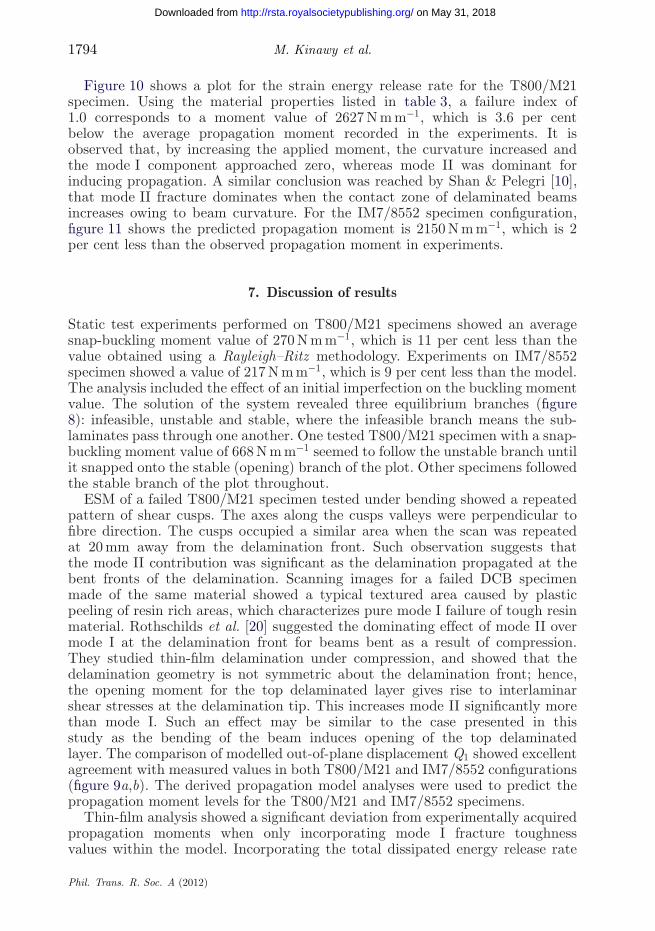
Figure 10 shows a plot for the strain energy release rate for the T800/M21specimen. Using the material properties listed in table 3, a failure index of1.0 corresponds to a moment value of 2627 N m m−1, which is 3.6 per centbelow the average propagation moment recorded in the experiments. It isobserved that, by increasing the applied moment, the curvature increased andthe mode I component approached zero, whereas mode II was dominant forinducing propagation. A similar conclusion was reached by Shan & Pelegri [10],that mode II fracture dominates when the contact zone of delaminated beamsincreases owing to beam curvature. For the IM7/8552 specimen configuration,figure 11 shows the predicted propagation moment is 2150 N m m−1, which is 2per cent less than the observed propagation moment in experiments.
7. Discussion of results
Static test experiments performed on T800/M21 specimens showed an averagesnap-buckling moment value of 270 N m m−1, which is 11 per cent less than thevalue obtained using a Rayleigh–Ritz methodology. Experiments on IM7/8552specimen showed a value of 217 N m m−1, which is 9 per cent less than the model.The analysis included the effect of an initial imperfection on the buckling momentvalue. The solution of the system revealed three equilibrium branches (figure8): infeasible, unstable and stable, where the infeasible branch means the sub-laminates pass through one another. One tested T800/M21 specimen with a snap-buckling moment value of 668 N m m−1 seemed to follow the unstable branch untilit snapped onto the stable (opening) branch of the plot. Other specimens followedthe stable branch of the plot throughout.
ESM of a failed T800/M21 specimen tested under bending showed a repeatedpattern of shear cusps. The axes along the cusps valleys were perpendicular tofibre direction. The cusps occupied a similar area when the scan was repeatedat 20 mm away from the delamination front. Such observation suggests thatthe mode II contribution was significant as the delamination propagated at thebent fronts of the delamination. Scanning images for a failed DCB specimenmade of the same material showed a typical textured area caused by plasticpeeling of resin rich areas, which characterizes pure mode I failure of tough resinmaterial. Rothschilds et al. [20] suggested the dominating effect of mode II overmode I at the delamination front for beams bent as a result of compression.They studied thin-film delamination under compression, and showed that thedelamination geometry is not symmetric about the delamination front; hence,the opening moment for the top delaminated layer gives rise to interlaminarshear stresses at the delamination tip. This increases mode II significantly morethan mode I. Such an effect may be similar to the case presented in thisstudy as the bending of the beam induces opening of the top delaminatedlayer. The comparison of modelled out-of-plane displacement Q1 showed excellentagreement with measured values in both T800/M21 and IM7/8552 configurations(figure 9a,b). The derived propagation model analyses were used to predict thepropagation moment levels for the T800/M21 and IM7/8552 specimens.
Thin-film analysis showed a significant deviation from experimentally acquiredpropagation moments when only incorporating mode I fracture toughnessvalues within the model. Incorporating the total dissipated energy release rate
Phil. Trans. R. Soc. A (2012)
on May 31, 2018http://rsta.royalsocietypublishing.org/Downloaded from

Bending of delaminated composites 1795
(GIC + GIIC) would lead to closer predicted values for both material configurations(figures 10 and 11). Such approximations may be valid for the current problemas the thin sub-laminate has a high ratio between length and cross-sectionaldimensions. This suggests that Euler strut relations can be used. But for shorterlengths, thin-film analysis may not be recommended.
Mixed-mode analysis was investigated. It includes two different expressionsfor mode I and mode II fracture toughness energies GI and GII. Both energyterms depend on the force and moment components at the delamination edge.A failure index (GI/GIC + GII/GIIC) was used to predict the propagation momentlevel. While mode I fracture toughness GIC was of small influence, GIIC wasa key parameter in the analysis and the predicted propagation moment value.Consequently, using power-based failure indices such as (GI/GIC)2 + (GII/GIIC)2,the propagation results will not significantly differ from the results obtained usingthe current failure index.
The experimentally determined value of mode II fracture toughness, GIIC, isknown to vary between tests in fibre epoxy materials, so the GIIC values for thetwo materials were checked against different values found in the literature tobe in the region of 1400 and 1000 J m−2 for T800/M21 and IM7/8552 specimens,respectively. By incorporating a mixed-mode strategy developed by Hutchinson &Suo [13] for the example considered earlier, mode I had a similar influence to modeII immediately after the snap-buckling moment level. The mode I contributionthen diminishes as the load increased. Finally, the propagation failure wasdominated by mode II owing to the increase in curvature of the beam duringbending, which gives rise to shear stress at the contact surface. The deviationbetween analytical prediction and experiments was 3.6 per cent and 2 per centfor T800/M21 and IM7/8552 configurations, respectively.
Fatigue tests were performed on both specimen types using the same statictest configurations. No fatigue growth was observed when the applied momentwas 80 per cent below the static strength value in both cases. Fatigue growthof the delamination occurred after 106 cycles at a moment that was 75 per centabove the snap-buckling moment. This is a lower moment than might be expectedconsidering that static propagation did not occur until about 10 times thesnap-buckling moment.
8. Conclusions and future work
Delaminated beams made from unidirectional carbon fibre composites werestudied under pure bending moment. A nonlinear mathematical model was usedto predict the moment level for snap-buckling of the upper sub-laminate whileincluding the effect of the initial imperfection created by the PTFE used todelaminate the beam. The method showed two types of sub-laminate behaviour:opening (stable) and closing (unstable). The predicted moment levels for snap-buckling were 11 per cent and 9 per cent less than an average experimentalvalue for unidirectional T800/M21 and IM7/8552 beams, respectively. A mixed-mode technique [13] was applied, and the propagation moment was found tobe approximately 3.6 per cent and 2 per cent compared with experimentallyobtained values for the T800/M21 and IM7/8552 beams, respectively. As observedby ESM, mode II failure characterized the bend T800/M21 beams in question
Phil. Trans. R. Soc. A (2012)
on May 31, 2018http://rsta.royalsocietypublishing.org/Downloaded from

1796 M. Kinawy et al.
compared with a previous DCB test specimen failure, which is a pure mode Ifailure. A similar outcome was predicted by the model, which suggested thatmode II has more influence than mode I behaviour in static propagation.
One interesting outcome of the current combined analytical technique is thatit represents a promising method to determine mode II fracture toughnessproperties because tested specimens showed propagation in a repeatable mannerfor both types of material systems. Such repeatability is not the case for GIICvalues obtained by typical mode II characterizing tests, such as end-notchedflexure and four-point-notched flexure. Consequently, by applying the mixed-mode methodology, along with the obtained propagation moment results fromexperiments, GIIC values of 1480 (J m−2) and 1030 (J m−2) would correspond toT800/M21 and IM7/8552 material systems, respectively.
Fatigue tests showed that crack growth occurred at a comparatively lowlevel of severity (around 20% of the static propagation moment) before 1million cycles, which highlights the importance of predicting the likelihood ofan opening mode for a near-surface delamination. Such a low growth level mightbe due to the geometry of the tested beam, i.e. it had a near-surface through-width delamination. In real applications, damage usually consists of encloseddelaminations distributed within the thickness of the laminate. However, theresult underlines the weakness of composites when subject to moments causingdelamination opening.
For future work, specimens containing circular delamination should be testedin both static and fatigue loading to check for applicability of the analyticalmethods used in this study.
The authors acknowledge Rolls-Royce and Agusta-Westland for their funding and support of thework.
References
1 Chai, H., Babcock, C. D. & Knauss, W. 1981 One dimensional modelling of failure inlaminated plates by delamination buckling. Int. J. Solids Struct. 17, 1069–1083. (doi:10.1016/0020-7683(81)90014-7)
2 Chai, H. & Babcock, C. D. 1985 Two-dimensional modelling of compressive failure indelaminated laminates. J. Compos. Mater. 19, 67–98. (doi:10.1177/002199838501900105)
3 Shan, B. & Pelegri, A. 2003 Approximate analysis of the buckling behavior of composites withdelamination. J. Compos. Mater. 37, 673–685. (doi:10.1177/002199803029733)
4 Rhead, A., Butler, R. & Hunt, G. W. 2008 Post-buckled propagation model for compressivefatigue of impact damaged laminates. Int. J. Solids Struct. 38, 4349–4361. (doi:10.1016/j.ijsolstr.2008.03.014)
5 Butler, R., Rhead, A. T., Liu, W. & Kontis, N. 2012 Compressive strength of delaminatedaerospace composites. Phil. Trans. R. Soc. A 370, 1759–1779. (doi:10.1098/rsta.2011.0339)
6 Murphy, K. D. & Nichols, J. M. 2008 A low-dimensional model for delamination in compositestructures: theory and experiment. Int. J. Nonlin. Mech. 45, 13–18.
7 Kardomateas, G. A. 1990 Snap buckling of delaminated composites under pure bending.J. Compos. Sci. Technol. 39, 63–74. (doi:10.1016/0266-3538(90)90033-2)
8 Wang, W. & Shenoi, R. A. 2003 Delamination modelling of a curved composite beam subjectedto an opening bending moment. J. Strain Anal. 38, 453–457. (doi:10.1243/03093240360713504)
9 Kosel, F., Petrisic, J., Kuselj, B., Kosel, T., Sajn, V. & Brojan, M. 2005 Local buckling anddebonding problem of a bonded two-layer plate. J. Appl. Mech. 74, 704–726. (doi:10.1007/s00419-005-0381-x)
Phil. Trans. R. Soc. A (2012)
on May 31, 2018http://rsta.royalsocietypublishing.org/Downloaded from

Bending of delaminated composites 1797
10 Shan, B. & Pelegri, A. 2003 Assessment of the fracture behavior of an asymmetrically loadedcantilever composite structure. J. Eng. Mater. Technol. 125, 353–360. (doi:10.1115/1.1605108)
11 Kinawy, M., Butler, R. & Hunt, G. W. 2011 Buckling and postbuckling of a delaminatedcomposite beam in bending. AIAA J. 49, 670–672. (doi:10.2514/1.J050784)
12 Hunt, G. W., Hu, B., Butler, R., Almond, D. P. & Wright, J. E. 2004 Nonlinear modeling ofdelaminated struts. AIAA J. 42, 2364–2372. (doi:10.2514/1.5981)
13 Hutchinson, J. W. & Suo, Z. 1991 Mixed mode cracking in layered materials. Adv. Appl. Mech.29, 63–191. (doi:10.1016/S0065-2156(08)70164-9)
14 Greenhalgh, E. S. 2009 Failure analysis and fractography of polymer composites. Cambridge,UK: Woodhead Publishing Limited.
15 Thompson, J. M. & Hunt, G. W. 1973 A general theory of elastic stability. London, UK: Wiley-Interscience.
16 Zitoune, R. & Collombet, F. 2007 Numerical prediction of the thrust force responsible ofdelamination during the drilling of the long-fibre composite structures. Compos. A Appl. Sci.Manuf. 38, 858–866. (doi:10.1016/j.compositesa.2006.07.009)
17 Bouvet, C., Rivallant, S. & Barrau J. J. 2010 Modelling of impact damage and permanentindentation on laminate composite plate. In 14th European Conf. on Composite Materials(ECCM-14), Budapest, Hungary, 7–10 June 2010.
18 Ilyas, M. 2010 Damage modeling of carbon/epoxy laminated composites submitted to impactloading. PhD thesis, L’Universite de Toulouse, Toulouse, France.
19 May, M. & Hallett, S. R. 2010 A combined model for initiation and propagation of damage underfatigue loading for cohesive interface elements. Compos. A Appl. Sci. Manuf. 41, 1787–1796.(doi:10.1016/j.compositesa.2010.08.015)
20 Rothschilds, R. J., Gillespie, J. W. & Carlsson, L. A. 1988 Instability-related delaminationgrowth in thermoset and thermo-plastic composites. In Proc. Composite Materials: Testing andDesign Conf., ASTM STP 972 (ed. J. D. Whitcomb). Philadelphia, PA: ASTM.
Phil. Trans. R. Soc. A (2012)
on May 31, 2018http://rsta.royalsocietypublishing.org/Downloaded from