Benchmarking YOUR BUSINESS - NPMA Pestworld Center... · benchmarking your business, an exercise...
12
SPONSORED BY A COLLABORATIVE EFFORT OF PCT and NPMA teamed up to survey the industry about a variety of operating ratio benchmarks. We talked to PMPs about everything from vehicle expenses and employee costs to add-on services revenues and material/supply costs. How does your company compare? Benchmarking YOUR BUSINESS
Transcript of Benchmarking YOUR BUSINESS - NPMA Pestworld Center... · benchmarking your business, an exercise...
SPONSORED BY
A COLLABORATIVE EFFORT OF
PCT and NPMA teamed up to survey the industry about a variety of operating
ratio benchmarks. We talked to PMPs about everything from vehicle expenses and employee costs to add-on services
revenues and material/supply costs.How does your company compare?
BenchmarkingYOUR BUSINESS
SPONSORED BY
A s a pest control business owner how do you define success? Is it in the total number of satisfied customers you’ve provided pest control services to during the past 12 months? Is it in
successfully achieving your list of corporate goals and objectives established at the beginning of the previous year? Or is it simply a matter of assessing your bottom-line performance when reviewing your company’s year-end financials?
Chances are it’s a combination of all those things, but to get a truly accurate sense of how your company performed this past year wouldn’t it be helpful to know how you stacked up against your industry peers?
That’s the theory — and enormous value — behind the process of benchmarking your business, an exercise that allows you to com-pare your company’s performance against others in the industry, helping to identify those areas where you can make improvements in the coming year. And isn’t that what long-term business success is all about … continuous improvement?
Last year, BASF Professional & Specialty Solutions partnered with the National Pest Management Association and PCT magazine to be the corporate sponsor for a comprehensive Operating Cost Ratio Survey designed to assist pest control companies in benchmarking their businesses. Given our longtime commitment to supporting the advancement of the professional pest management industry, not only from a product perspective but from a business perspective, we welcomed the opportunity.
The results of that survey appear in an exclusive executive summary in this month’s issue of PCT magazine. We would like to thank all those randomly selected pest management professionals who took the time to participate in the survey. We’re confident you’ll find the results of the survey beneficial in benchmarking your business, lay-ing the groundwork for a successful 2015!
Sincerely,
Jonathan K. SweatJonathan K. SweatDirector, BASF Professional & Specialty Solutions
BUSINESS BENCHMARKING: A VALUABLE EXERCISE
JONATHAN K. SWEAT
Benchmarking YOUR BUSINESS
2 /// JANUARY 2015 WWW.PCTONLINE.COM

SPONSORED BY
E ver wonder if you’re paying higher (or lower) wages than others in the industry? If your spend-
ing ratio for liability insurance, gasoline or chemical is comparable…or off the charts? What
about revenue streams and profit margins: How exactly do you measure up?
Find out in this in-depth look at business operating ratios, based on a first-of-its-kind survey by
PCT magazine and the National Pest Management Association. You’ll get peer insights on a host of
business issues to help you manage cash flow and expenses.
Completed in November, the survey was sponsored by BASF and compiled by Readex Research.
BenchmarkingYOUR BUSINESS
BY ANNE NAGRO
A SURVEY SAMPLE of 8,889 owners/operators of pest control businesses was selected randomly from the databases of PCT magazine and the National Pest Management Association. The survey was conducted by Readex Research, a privately held research firm based in Stillwater, Minn., that conducts hundreds of mail and web-based surveys every year for publishers,
advertisers, association executives and corporate researchers. Data was collected from November 11 to 24, 2014. The survey was closed for tabulation with 573 usable responses — a 6.4 percent response rate. The margin of error for percentages based on 573 usable responses is plus or minus 4.0 percentage points at the 95 percent confidence level.
ABOUT THIS REPORT
Benchmarking YOUR BUSINESS
WWW.PCTONLINE.COM JANUARY 2015 /// 3

SPONSORED BY
The last fiscal year was a good one with companies aver-aging a nearly 17 percent average growth rate for their termite/general pest control business, according to PMPs whose companies generated at least half of their revenue
from termite control and/or general pest control services in their most recently completed fiscal year (hereafter referred to as key companies or key respondents).
General pest control accounted for more than 71 percent of company revenue on average; termite control and add-on servic-es generated 15.3 percent and 13.3 percent, respectively.
Some PMPs worried the long, cold winter, which in many places lasted into spring, would drag down growth. “It actually turned out to be a great summer,” reported Lance Griggs, owner of Spectrum Pest Management, Madison, Ala. The season took a “little while to kick in, but once it did it was gangbusters,” he said.
Bad weather didn’t prevent PMPs from doing weekly, monthly and quarterly service calls for customers. “If they’re open for busi-ness, we’ve got to go service,” regardless of how much snow is on the ground, said Sam Soto, president, First Rate Solutions, New Windsor, N.Y. Soto saw a 15 percent jump in revenue because “we stick to what we know” and nurture customer relationships. Brian Reynolds, president of Reynolds Pest Management, Port Saint Lucie, Fla., said his 20 percent revenue jump came from “crazy customer service,” which he defined as “going over the top to make sure the customer is happy” even if that means losing money on that customer in the short term.
Ken Yarrington, owner of KenX Pest Control, Chariton, Iowa, saw revenue double in 2014 and expects “nothing but huge
REVENUE INCREASED; OUTLOOK IS POSITIVE
RATE OF GROWTH FOR TERMITE/GENERAL PEST CONTROL BUSINESS IN THE LAST FISCAL YEAR
100% or more 50% - 99% 25% - 49% 10% - 24% 1% - 9% None Negative growth No answer
NUMBER OF KEY RESPONDENTS: 531
4% 5% 8% 30% 33% 11% 1% 7%
AVERAGE: 16.8%
growth” ahead for his two-year-old company. Soto is planning for 20 percent growth by expanding his commercial business.
Chicago’s A-Alert Exterminating had revenue of $1.5 million in 2014 and is planning for “fairly slow but steady, upward growth” next year, said General Manager Kevin Connelly. The poor qual-ity work some companies provide is an opportunity to grow his business, he said.
Anti Pest & Veitch, Minden, La., has “big plans and good peo-ple,” said President Jason Veitch. The company is expanding its service area and hiring a new technician this spring to grow its revenue of $576,000.
Benchmarking YOUR BUSINESS
4 /// JANUARY 2015 WWW.PCTONLINE.COM

SPONSORED BY
BETTER PROFITS BOOST THE BOTTOM LINEMORE THAN HALF of pest management companies’ termite/general pest control businesses were more profitable in the last fiscal year than the year prior, reported key PMPs in the PCT-NPMA 2014 Business Operating Ratio Survey.
Some attributed the gain to improved efficiencies. First Rate Solutions had profit increase 20 percent due to better routing and realigned back-office operations, said Sam Soto. As productivity increased, so did wages and bonuses, which spurred employee engagement and more improvements, he said.
Reynolds Pest Management increased productivity and reduced driving costs with routing software, said Brian Reynolds. Saving an hour here and there with eight technicians on the road “adds up to 40 hours a week in no time,” he said.
Profits were “up considerably higher” for A-Alert Exterminating, said Kevin Connelly. In 2013, the company incurred $100,000 in legal fees defending itself against two disgruntled employees. But even with those savings, profits are better, said Connelly. The company closely tracks and adjusts expenses within set percentages “so we can be profitable even if revenue is down,” he said.
Marty Overline, president of Aardvark Pest Management in Philadelphia, maintained 10 percent profitability while paying 100 percent of employee healthcare costs.
Other PMPs funneled profit back into the business. Jason Veitch of Anti Pest & Veitch gave employees “substantial” raises in 2014. Ken Yarrington’s five-year plan is to reinvest profit in equipment, products and growing KenX Pest Control.
CHANGE IN PROFITABILITY FOR TERMITE/GENERAL PEST CONTROL
BUSINESS FROM THE LAST FISCAL YEAR
More profitable
Equally profitable
Less profitableNo answer
2%
55%
32%
11%
AVERAGE SOURCES OF REVENUE IN THE LAST FISCAL YEAR
NUMBER OF KEY RESPONDENTS: 531
Percentages total more than 100 percent due to a number of companies operating in multiple regions.
NUMBER OF RESPONDENTS: 573
WHO ARE YOU?MORE THAN 570 owners and senior managers of pest management companies participated in the 2014 business operating ratio survey, sponsored by BASF.
Nearly 60 percent of key respondents reported less than $300,000 in termite/general pest control revenue in the last fiscal year. Most (88 percent) operate one branch office. Nearly three-fourths (73 percent) of companies are doing business in one state; 26 percent operate in two or more states. Sixty-three percent of responding companies are organized as corporations.
Respondents operate companies in the Southeast (27 percent), Great Lakes and Plains region (23 percent), Mid-Atlantic, including Delaware, Washington, D.C., Maryland, New Jersey, New York and Pennsylvania (17 percent), Southwest (16 percent), Far West (13 percent), New England states (8 percent), and Rocky Mountain region (6 percent).
Approximately half of responding companies are members of NPMA.
GENERAL PEST CONTROL ......................................(including mosquito control, bed bug control, rodents, etc.)
TERMITE CONTROL .................................................... 15.3%13.3%OTHER ANCILLARY SERVICES ...............................
(wildlife control, fumigation, lawn & ornamental, handyman services, deck/pool cleaning, insulation, holiday lights, etc.)
71.4%
27%
23%
17%
8%
16%
13%6%
Southeast Great Lakes & Plains Mid-Atlantic Southwest Far West New England Rocky Mountain
Benchmarking YOUR BUSINESS
WWW.PCTONLINE.COM JANUARY 2015 /// 5
SPONSORED BY
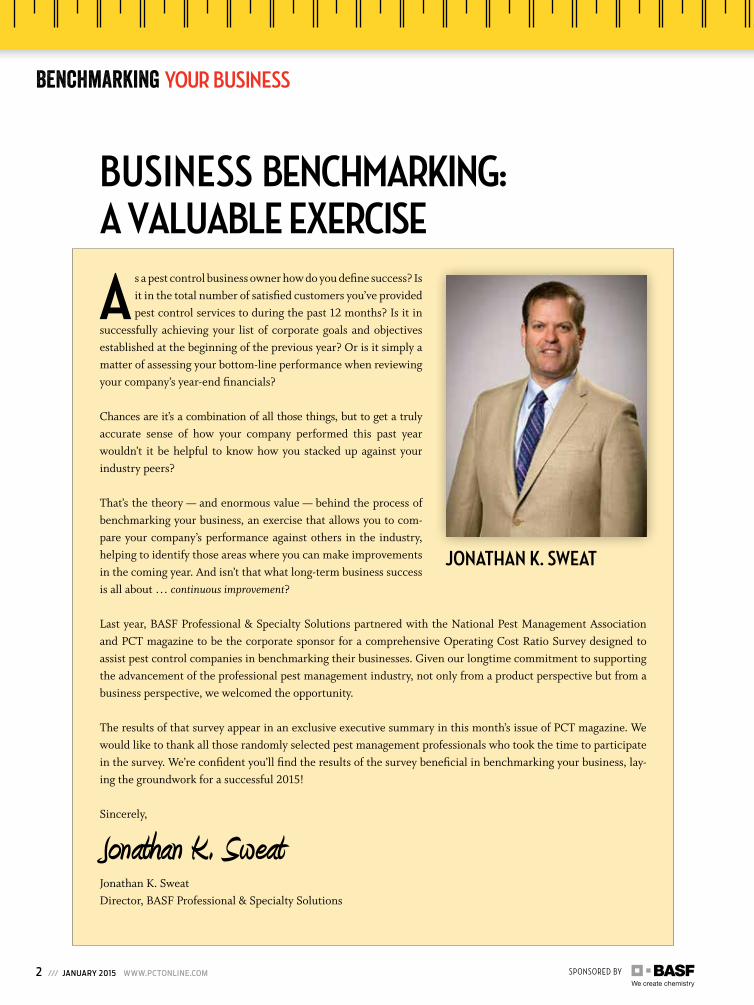
According to the PCT-NPMA 2014 Business Operating Ratio Survey, many key pest management companies (28 percent) paid out less than $50,000 in total
expenses for its termite/general pest control business. Eleven percent incurred $50,000 to $99,999 in expenses, and 12 percent had expenses that ranged from $100,000 to $199,999.
On average, the biggest single business expense among all responding companies was wages, salaries and bonuses (34.2 percent), followed by material/supply (15.6 percent) and vehicle (14.4 percent) expenses.
“Gas and chemical are our two biggest expenses,” noted Jason Veitch of Anti Pest & Veitch. Product costs and li-ability insurance, an operating expense, rose for Ken Yar-rington, KenX Pest Control. “You have to know how to bill” to manage these increases, he advised.
Expenses have a direct impact on profit. “People don’t understand this and don’t know what their costs are,” said Kevin Connelly, A-Alert Exterminating, which carefully tracks and adjusts expense ratios. To be successful, “we need to be as good at business as we are at pest control,” he said.
TOTAL TERMITE/GENERAL PEST CONTROL BUSINESS
EXPENSES FOR THE LAST FISCAL YEAR
NUMBER OF KEY RESPONDENTS: 531
4% 4% 7% 6% 6% 12% 11% 28% 3% 19%
$2.0 million or more $1.0 - $1.9 million $500,000 - $999,999 $300,000 - $499,999 $200,000 - $299,999
AVERAGE: $622,000
AVERAGE DISTRIBUTION OF EXPENSES IN THE LAST FISCAL YEAR
Wages/salaries/bonuses Material/supply expenses Vehicle expenses Operating expenses Marketing/advertising
expenses
NUMBER OF RESPONDENTS: 573
34.2% 15.6% 14.4% 9.3% 5.2% 4.6% 4.0% 3.5% 1.8%7.3%
Most Have Less Than $50,000 in Expenses
$100,000 - $199,999 $50,000 - $99,999 Less than $50,000 Nothing No Answer
Employee expenses (other than wages/salaries)
Building expenses Administrative expenses Technology expenses Other ©
TH
OM
AS
_EY
EDES
IGN
| IS
TOCK
.CO
M
MEDIAN: $96,000
Benchmarking YOUR BUSINESS
6 /// JANUARY 2015 WWW.PCTONLINE.COM

SPONSORED BY
On average, more than 64 percent of general pest control service revenue is generated by controlling common insect pests, according to the PCT-NPMA 2014 Business Operat-
ing Ratio Survey. Ants were the number one insect pest for Marsha Ipsen, own-
er of Summit Pest Control, Savannah, Ga., and Brian Reynolds, Reynolds Pest Management. A wetter spring may have caused Argentine and little black ants to move indoors, said Ipsen. Reyn-olds saw an increase in big-headed ants nesting under concrete slab foundations and tawny crazy ants in wall voids.
Cockroaches are the biggest money maker for Ken Yarrington, KenX Pest Control. His business card displays a German cock-roach to help customers identify the pest. This can save him from driving 50 miles to a free inspection for a wayward ground beetle.
Calls for Australian, American and Oriental cockroaches, called palmetto bugs in Florida, were up for Reynolds. He said homes are aging so pests have more opportunities to get into wall voids, and people haven’t taken steps to prevent their entry.
According to the PCT-NPMA survey, rodent control accounted for more than 19 percent of general pest revenue on average. In Chicago, A-Alert Exterminating has “15 intensive rat programs going on right now,” reported Kevin Connelly. His crew recently removed 40 Norway rats from one $1.5 million Lincoln Park home, alone. Neighborhood gentrification, new road projects
64.1%19.4% 13.2% 3.3%
Rodent control
Bed bug control
Mosquito control
Other general pest control
NUMBER OF RESPONDENTS: 552
AVERAGE DISTRIBUTION OF GENERAL PEST CONTROL REVENUE IN THE LAST FISCAL YEAR
USUAL SUSPECTS DRIVE GENERAL PEST REVENUE
and cuts in city sanitation budgets contribute to the problem, he said.
Bed bug work contributed more than 13 percent to general pest revenue, on average, found the survey. Marty Overline, Aardvark Pest Management, said infestations are increasing in office complexes, hospitals and residential properties. He recent-ly had 48 calls in one week. The pest is “absolutely” an opportu-nity for revenue growth in 2015, said Overline.
“Bed bugs are just a monster,” agreed Connelly, who has three technicians doing nothing but bed bug work, mainly in work-places.
GENERALPEST
REVENUE
Benchmarking YOUR BUSINESS
WWW.PCTONLINE.COM JANUARY 2015 /// 7
SPONSORED BY
Wildlife control Lawn & ornamental Additional service offerings
(deck/pool cleaning, insulation, holiday lights, etc.)
Handyman services Fumigation Other
NUMBER OF RESPONDENTS: 318
AVERAGE DISTRIBUTION OF ADD-ON SERVICE REVENUE IN THE LAST FISCAL YEAR
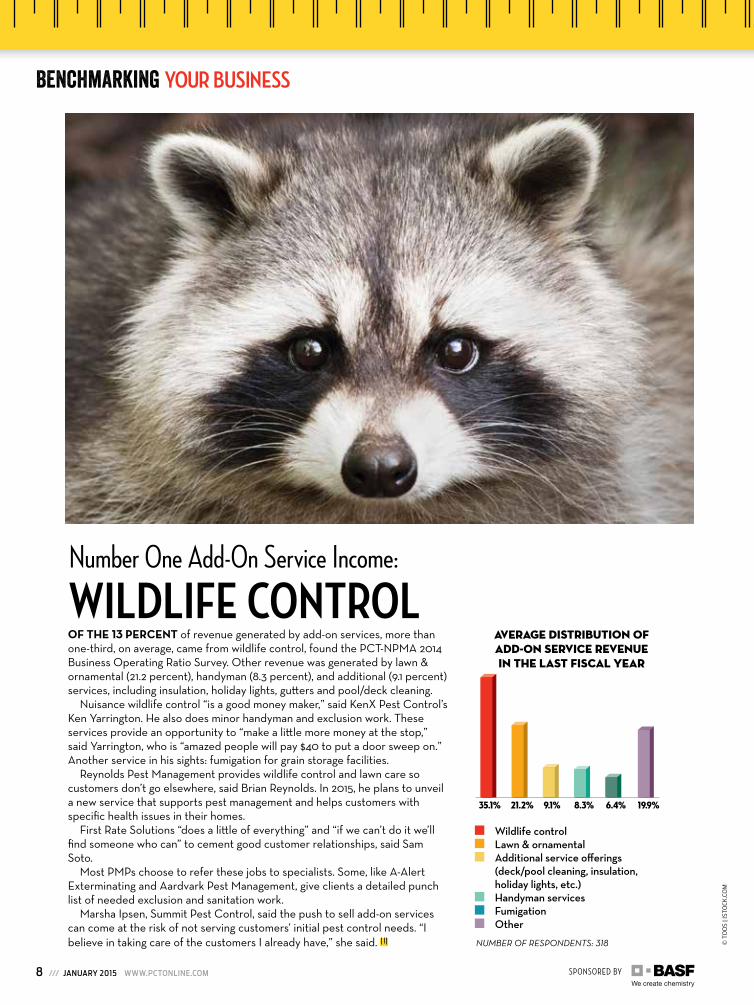
OF THE 13 PERCENT of revenue generated by add-on services, more than one-third, on average, came from wildlife control, found the PCT-NPMA 2014 Business Operating Ratio Survey. Other revenue was generated by lawn & ornamental (21.2 percent), handyman (8.3 percent), and additional (9.1 percent) services, including insulation, holiday lights, gutters and pool/deck cleaning.
Nuisance wildlife control “is a good money maker,” said KenX Pest Control’s Ken Yarrington. He also does minor handyman and exclusion work. These services provide an opportunity to “make a little more money at the stop,” said Yarrington, who is “amazed people will pay $40 to put a door sweep on.” Another service in his sights: fumigation for grain storage facilities.
Reynolds Pest Management provides wildlife control and lawn care so customers don’t go elsewhere, said Brian Reynolds. In 2015, he plans to unveil a new service that supports pest management and helps customers with specific health issues in their homes.
First Rate Solutions “does a little of everything” and “if we can’t do it we’ll find someone who can” to cement good customer relationships, said Sam Soto.
Most PMPs choose to refer these jobs to specialists. Some, like A-Alert Exterminating and Aardvark Pest Management, give clients a detailed punch list of needed exclusion and sanitation work.
Marsha Ipsen, Summit Pest Control, said the push to sell add-on services can come at the risk of not serving customers’ initial pest control needs. “I believe in taking care of the customers I already have,” she said.
Number One Add-On Service Income:
WILDLIFE CONTROL
35.1% 21.2% 9.1% 8.3% 6.4% 19.9%
© T
OO
S |
ISTO
CK.C
OM
Benchmarking YOUR BUSINESS
8 /// JANUARY 2015 WWW.PCTONLINE.COM
SPONSORED BY
GENERAL PEST CONTROL PRODUCTS ARE TOP MATERIAL AND SUPPLY EXPENSEON AVERAGE, PEST CONTROL companies spent nearly 47 percent of funds for pest control materials/sup-plies on chemical products and other items for general insect pest control, found the PCT-NPMA 2014 Business Operating Ratio Survey.
Jason Veitch of Anti Pest & Veitch spent more on chemical products this year compared to last. Some of his go-to products went off the market so he had to use more expensive ones, though generic products helped miti-gate some costs, he said.
Marsha Ipsen, Summit Pest Control, was able to offset “typical inflationary price increase on products” by being “more efficient in my transportation.”
On average, nearly 15 percent of material/supply funds were spent on rodent control supplies, according to the survey. “Even snap traps are expensive if you’re going to buy qual-ity ones,” reminded Ken Yarrington of KenX Pest Control.
Other top spends were for general equipment (12.5 percent) and termite post-construction materials (11.8 per-cent), on average.
46.7% 14.7% 12.5% 9.3% 2.3%11.8% 2.6%
Other pest control material supplies Rodent control material supplies Equipment Termite post-construction material
supplies Material/supply expenses for add-on
service offerings (including wildlife control, insulation, handyman services, etc.)
Termite pre-treat material supplies Mosquito control material supplies
NUMBER OF RESPONDENTS: 573
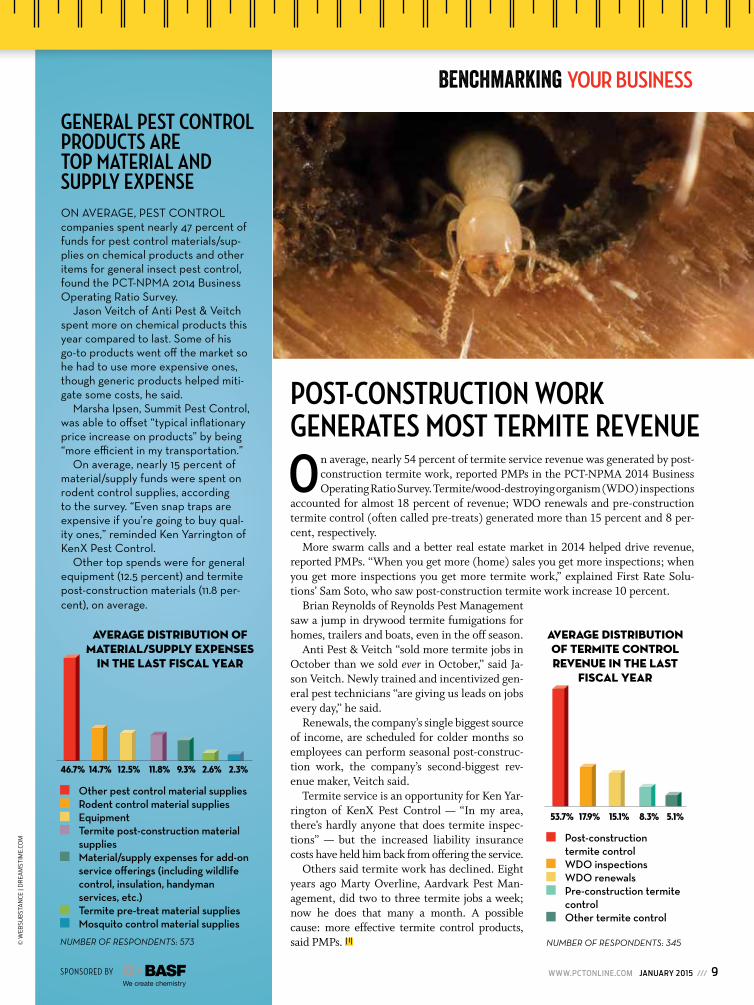
On average, nearly 54 percent of termite service revenue was generated by post-construction termite work, reported PMPs in the PCT-NPMA 2014 Business Operating Ratio Survey. Termite/wood-destroying organism (WDO) inspections
accounted for almost 18 percent of revenue; WDO renewals and pre-construction termite control (often called pre-treats) generated more than 15 percent and 8 per-cent, respectively.
More swarm calls and a better real estate market in 2014 helped drive revenue, reported PMPs. “When you get more (home) sales you get more inspections; when you get more inspections you get more termite work,” explained First Rate Solu-tions’ Sam Soto, who saw post-construction termite work increase 10 percent.
Brian Reynolds of Reynolds Pest Management saw a jump in drywood termite fumigations for homes, trailers and boats, even in the off season.
Anti Pest & Veitch “sold more termite jobs in October than we sold ever in October,” said Ja-son Veitch. Newly trained and incentivized gen-eral pest technicians “are giving us leads on jobs every day,” he said.
Renewals, the company’s single biggest source of income, are scheduled for colder months so employees can perform seasonal post-construc-tion work, the company’s second-biggest rev-enue maker, Veitch said.
Termite service is an opportunity for Ken Yar-rington of KenX Pest Control — “In my area, there’s hardly anyone that does termite inspec-tions” — but the increased liability insurance costs have held him back from offering the service.
Others said termite work has declined. Eight years ago Marty Overline, Aardvark Pest Man-agement, did two to three termite jobs a week; now he does that many a month. A possible cause: more effective termite control products, said PMPs.
AVERAGE DISTRIBUTION OF MATERIAL/SUPPLY EXPENSES
IN THE LAST FISCAL YEAR
53.7% 17.9% 15.1% 8.3% 5.1%
Post-construction termite control
WDO inspections WDO renewals Pre-construction termite
control Other termite control
NUMBER OF RESPONDENTS: 345
AVERAGE DISTRIBUTION OF TERMITE CONTROL REVENUE IN THE LAST
FISCAL YEAR
POST-CONSTRUCTION WORK GENERATES MOST TERMITE REVENUE
© W
EBSU
BST
AN
CE |
DR
EAM
STIM
E.CO
M
Benchmarking YOUR BUSINESS
WWW.PCTONLINE.COM JANUARY 2015 /// 9
SPONSORED BY
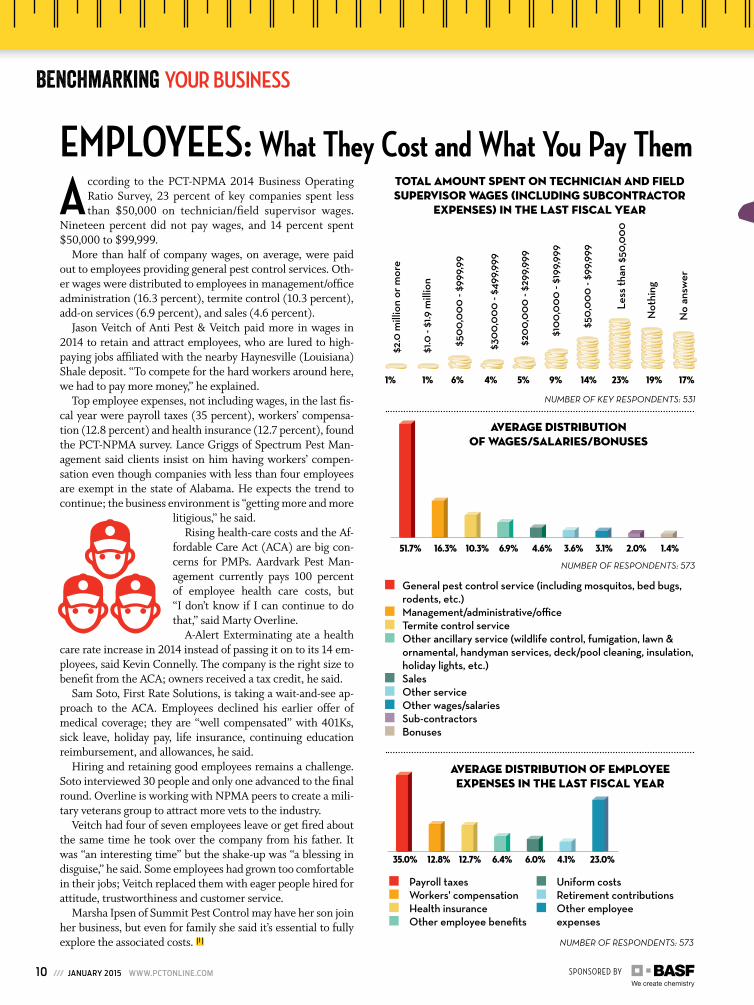
According to the PCT-NPMA 2014 Business Operating Ratio Survey, 23 percent of key companies spent less than $50,000 on technician/field supervisor wages.
Nineteen percent did not pay wages, and 14 percent spent $50,000 to $99,999.
More than half of company wages, on average, were paid out to employees providing general pest control services. Oth-er wages were distributed to employees in management/office administration (16.3 percent), termite control (10.3 percent), add-on services (6.9 percent), and sales (4.6 percent).
Jason Veitch of Anti Pest & Veitch paid more in wages in 2014 to retain and attract employees, who are lured to high-paying jobs affiliated with the nearby Haynesville (Louisiana) Shale deposit. “To compete for the hard workers around here, we had to pay more money,” he explained.
Top employee expenses, not including wages, in the last fis-cal year were payroll taxes (35 percent), workers’ compensa-tion (12.8 percent) and health insurance (12.7 percent), found the PCT-NPMA survey. Lance Griggs of Spectrum Pest Man-agement said clients insist on him having workers’ compen-sation even though companies with less than four employees are exempt in the state of Alabama. He expects the trend to continue; the business environment is “getting more and more
litigious,” he said.Rising health-care costs and the Af-
fordable Care Act (ACA) are big con-cerns for PMPs. Aardvark Pest Man-agement currently pays 100 percent of employee health care costs, but “I don’t know if I can continue to do that,” said Marty Overline.
A-Alert Exterminating ate a health care rate increase in 2014 instead of passing it on to its 14 em-ployees, said Kevin Connelly. The company is the right size to benefit from the ACA; owners received a tax credit, he said.
Sam Soto, First Rate Solutions, is taking a wait-and-see ap-proach to the ACA. Employees declined his earlier offer of medical coverage; they are “well compensated” with 401Ks, sick leave, holiday pay, life insurance, continuing education reimbursement, and allowances, he said.
Hiring and retaining good employees remains a challenge. Soto interviewed 30 people and only one advanced to the final round. Overline is working with NPMA peers to create a mili-tary veterans group to attract more vets to the industry.
Veitch had four of seven employees leave or get fired about the same time he took over the company from his father. It was “an interesting time” but the shake-up was “a blessing in disguise,” he said. Some employees had grown too comfortable in their jobs; Veitch replaced them with eager people hired for attitude, trustworthiness and customer service.
Marsha Ipsen of Summit Pest Control may have her son join her business, but even for family she said it’s essential to fully explore the associated costs.
Payroll taxes Workers' compensation Health insurance Other employee benefits
General pest control service (including mosquitos, bed bugs, rodents, etc.)
Management/administrative/office Termite control service Other ancillary service (wildlife control, fumigation, lawn &
ornamental, handyman services, deck/pool cleaning, insulation, holiday lights, etc.)
Sales Other service Other wages/salaries Sub-contractors Bonuses
1% 1% 6% 4% 5% 9% 14% 23% 19% 17%
TOTAL AMOUNT SPENT ON TECHNICIAN AND FIELD SUPERVISOR WAGES (INCLUDING SUBCONTRACTOR
EXPENSES) IN THE LAST FISCAL YEAR
NUMBER OF KEY RESPONDENTS: 531
No
answ
er
Not
hing
Less
than
$50
,000
$50,
000
- $99
,999
$10
0,00
0 - $
199,
999
$2.0
mill
ion
or m
ore
$1.0
- $1
.9 m
illio
n
$500
,000
- $9
99,9
9
$300
,000
- $4
99,9
99
$200
,000
- $2
99,9
99
51.7% 16.3% 10.3% 6.9% 4.6% 3.6% 3.1% 2.0% 1.4%
AVERAGE DISTRIBUTION OF WAGES/SALARIES/BONUSES
NUMBER OF RESPONDENTS: 573
EMPLOYEES: What They Cost and What You Pay Them
AVERAGE DISTRIBUTION OF EMPLOYEE EXPENSES IN THE LAST FISCAL YEAR
35.0% 12.8% 12.7% 6.4% 6.0% 4.1% 23.0%
Uniform costs Retirement contributions Other employee
expenses
NUMBER OF RESPONDENTS: 573
Benchmarking YOUR BUSINESS
10 /// JANUARY 2015 WWW.PCTONLINE.COM
SPONSORED BY
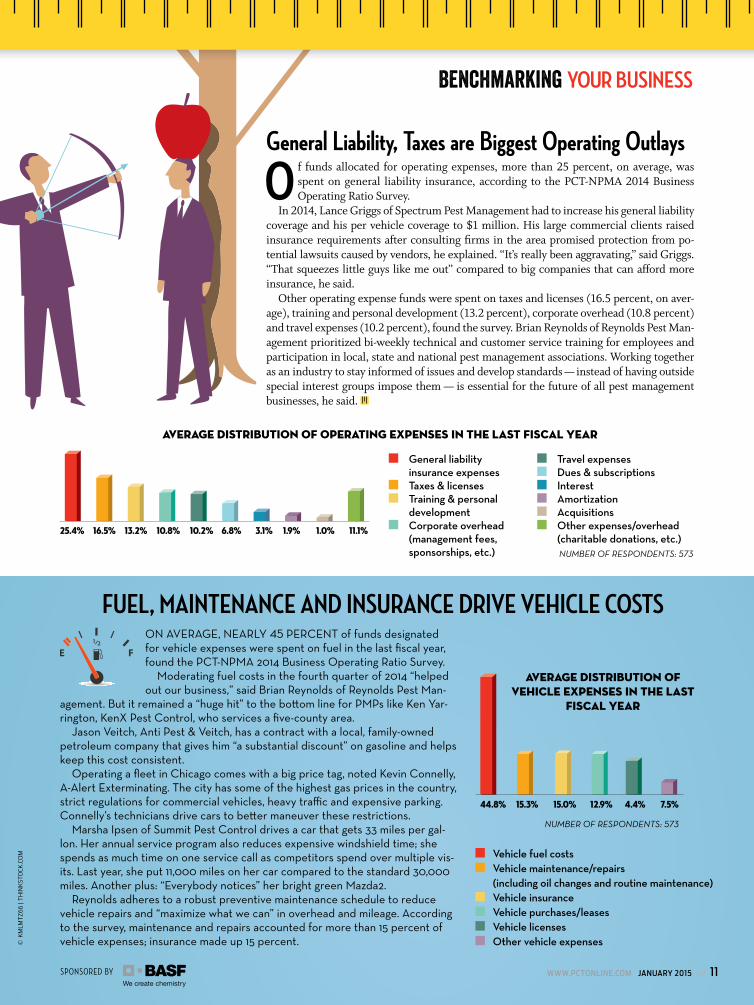
O f funds allocated for operating expenses, more than 25 percent, on average, was spent on general liability insurance, according to the PCT-NPMA 2014 Business Operating Ratio Survey.
In 2014, Lance Griggs of Spectrum Pest Management had to increase his general liability coverage and his per vehicle coverage to $1 million. His large commercial clients raised insurance requirements after consulting firms in the area promised protection from po-tential lawsuits caused by vendors, he explained. “It’s really been aggravating,” said Griggs. “That squeezes little guys like me out” compared to big companies that can afford more insurance, he said.
Other operating expense funds were spent on taxes and licenses (16.5 percent, on aver-age), training and personal development (13.2 percent), corporate overhead (10.8 percent) and travel expenses (10.2 percent), found the survey. Brian Reynolds of Reynolds Pest Man-agement prioritized bi-weekly technical and customer service training for employees and participation in local, state and national pest management associations. Working together as an industry to stay informed of issues and develop standards — instead of having outside special interest groups impose them — is essential for the future of all pest management businesses, he said.
Vehicle fuel costs Vehicle maintenance/repairs
(including oil changes and routine maintenance) Vehicle insurance Vehicle purchases/leases Vehicle licenses Other vehicle expenses
General liability insurance expenses
Taxes & licenses Training & personal
development Corporate overhead
(management fees, sponsorships, etc.)
FUEL, MAINTENANCE AND INSURANCE DRIVE VEHICLE COSTSON AVERAGE, NEARLY 45 PERCENT of funds designated for vehicle expenses were spent on fuel in the last fiscal year, found the PCT-NPMA 2014 Business Operating Ratio Survey.
Moderating fuel costs in the fourth quarter of 2014 “helped out our business,” said Brian Reynolds of Reynolds Pest Man-
agement. But it remained a “huge hit” to the bottom line for PMPs like Ken Yar-rington, KenX Pest Control, who services a five-county area.
Jason Veitch, Anti Pest & Veitch, has a contract with a local, family-owned petroleum company that gives him “a substantial discount” on gasoline and helps keep this cost consistent.
Operating a fleet in Chicago comes with a big price tag, noted Kevin Connelly, A-Alert Exterminating. The city has some of the highest gas prices in the country, strict regulations for commercial vehicles, heavy traffic and expensive parking. Connelly’s technicians drive cars to better maneuver these restrictions.
Marsha Ipsen of Summit Pest Control drives a car that gets 33 miles per gal-lon. Her annual service program also reduces expensive windshield time; she spends as much time on one service call as competitors spend over multiple vis-its. Last year, she put 11,000 miles on her car compared to the standard 30,000 miles. Another plus: “Everybody notices” her bright green Mazda2.
Reynolds adheres to a robust preventive maintenance schedule to reduce vehicle repairs and “maximize what we can” in overhead and mileage. According to the survey, maintenance and repairs accounted for more than 15 percent of vehicle expenses; insurance made up 15 percent.
AVERAGE DISTRIBUTION OF VEHICLE EXPENSES IN THE LAST
FISCAL YEAR
44.8% 15.0% 12.9% 4.4% 7.5%15.3%
NUMBER OF RESPONDENTS: 573
AVERAGE DISTRIBUTION OF OPERATING EXPENSES IN THE LAST FISCAL YEAR
25.4% 13.2% 10.8% 10.2% 6.8%16.5% 3.1% 1.9% 1.0% 11.1%
Travel expenses Dues & subscriptions Interest Amortization Acquisitions Other expenses/overhead
(charitable donations, etc.) NUMBER OF RESPONDENTS: 573
General Liability, Taxes are Biggest Operating OutlaysEMPLOYEES: What They Cost and What You Pay Them
© K
MLM
TZ
66
| T
HIN
KST
OCK
.CO
M
Benchmarking YOUR BUSINESS
WWW.PCTONLINE.COM JANUARY 2015 /// 11

SPONSORED BY
According to the PCT-NPMA 2014 Business Operating Ratio Survey, PMPs spend nearly equal amounts of marketing/advertising
funds on Yellow Pages (21.9 percent), websites (21.1 percent) and Internet advertising (20 per-cent), on average.
Lance Griggs, Spectrum Pest Management, pulled out of Yellow Pages directories after three years of “nobody calling me.” Most of his new business comes from referrals or online searches, so he plans to invest his directory spend on on-line marketing and search engine optimization in 2015.
Marty Overline, Aardvark Pest Management, invested $20,000 in a new website and search engine optimization in 2014. Anti Pest & Veitch, had advertising costs increase with first-time ra-dio ads, which are “pretty expensive,” noted Presi-dent Jason Veitch. More than 42 percent of funds al-
located for technology expenses were spent on computers and
hardware, reported PMPs in the PCT-NPMA 2014 Business Operating Ratio Survey. Technology maintenance and re-pairs secured 23 percent of those funds; software got more than 20 percent.
Sam Soto, First Rate Solutions, completed a “100 percent overhaul” of his technology platform in early 2014.
Anti Pest & Veitch invested in GPS systems for service vehicles. It was a “bad call” for the company, as it’s been “uber-expensive” and “not easy to use,” said Jason Veitch of the legacy decision. He said a different vendor may have been a better choice, but he also doesn’t want his service techni-cians to feel like they’re under surveil-lance while on the job. As long as em-ployees get their jobs done, he said he doesn’t mind them running home to eat lunch.
KenX Pest Control’s Ken Yarrington, who has a degree in electrical en-gineering, may work with an industry software provider as his company grows; he also might write his own KenX-specific program and apps.
42.3% 23.0% 20.3% 14.5%
Computers/hardware Technology
maintenance/repairs Software Other technology expense
NUMBER OF RESPONDENTS: 573
AVERAGE DISTRIBUTION OF TECHNOLOGY EXPENSES IN THE LAST FISCAL YEAR
21.9% 21.1% 20.0% 9.3% 4.7% 22.9%
Yellow pages Website Internet advertising (pay per click,
banner ads, social media, blogs, etc.)
Direct mail (print materials, brochures, etc.)
Broadcast media (TV, radio, billboard, etc.)
Other marketing/advertising expenses
NUMBER OF RESPONDENTS: 573
AVERAGE DISTRIBUTION OF MARKETING/ADVERTISING EXPENSES
IN THE LAST FISCAL YEAR
Yellow Pages, Websites, Internet Ads Consume Nearly Equal Marketing Dollars
Top Technology Expenditure: COMPUTERS AND HARDWARE
© S
ERG
EY N
IVEN
S |
ISTO
CK.C
OM
Benchmarking YOUR BUSINESS
12 /// JANUARY 2015 WWW.PCTONLINE.COM