Benchmarking Social Media Tools/ Benchmarking herramentas Social Media
1
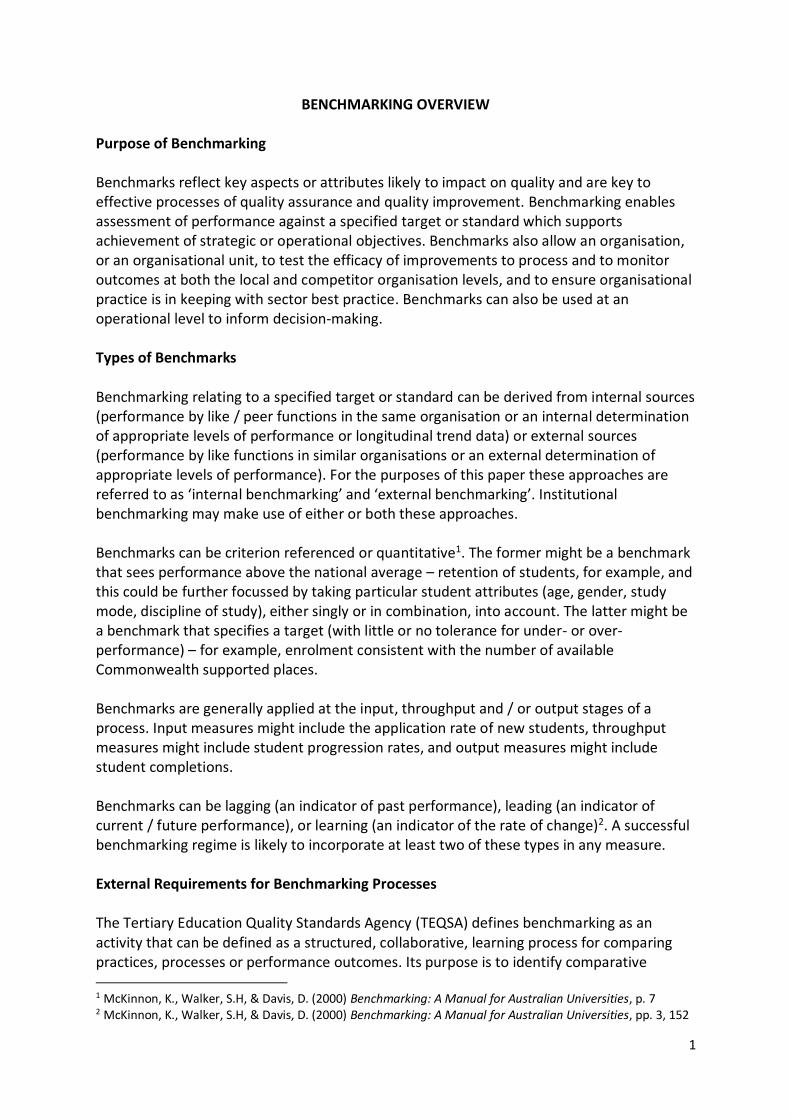
BENCHMARKING OVERVIEW Purpose of Benchmarking Benchmarks reflect key aspects or attributes likely to impact on quality and are key to effective processes of quality assurance and quality improvement. Benchmarking enables assessment of performance against a specified target or standard which supports achievement of strategic or operational objectives. Benchmarks also allow an organisation, or an organisational unit, to test the efficacy of improvements to process and to monitor outcomes at both the local and competitor organisation levels, and to ensure organisational practice is in keeping with sector best practice. Benchmarks can also be used at an operational level to inform decision-making. Types of Benchmarks Benchmarking relating to a specified target or standard can be derived from internal sources (performance by like / peer functions in the same organisation or an internal determination of appropriate levels of performance or longitudinal trend data) or external sources (performance by like functions in similar organisations or an external determination of appropriate levels of performance). For the purposes of this paper these approaches are referred to as ‘internal benchmarking’ and ‘external benchmarking’. Institutional benchmarking may make use of either or both these approaches. Benchmarks can be criterion referenced or quantitative1. The former might be a benchmark that sees performance above the national average – retention of students, for example, and this could be further focussed by taking particular student attributes (age, gender, study mode, discipline of study), either singly or in combination, into account. The latter might be a benchmark that specifies a target (with little or no tolerance for under- or over-performance) – for example, enrolment consistent with the number of available Commonwealth supported places. Benchmarks are generally applied at the input, throughput and / or output stages of a process. Input measures might include the application rate of new students, throughput measures might include student progression rates, and output measures might include student completions. Benchmarks can be lagging (an indicator of past performance), leading (an indicator of current / future performance), or learning (an indicator of the rate of change)2. A successful benchmarking regime is likely to incorporate at least two of these types in any measure. External Requirements for Benchmarking Processes The Tertiary Education Quality Standards Agency (TEQSA) defines benchmarking as an activity that can be defined as a structured, collaborative, learning process for comparing practices, processes or performance outcomes. Its purpose is to identify comparative 1 McKinnon, K., Walker, S.H, & Davis, D. (2000) Benchmarking: A Manual for Australian Universities, p. 7 2 McKinnon, K., Walker, S.H, & Davis, D. (2000) Benchmarking: A Manual for Australian Universities, pp. 3, 152
2
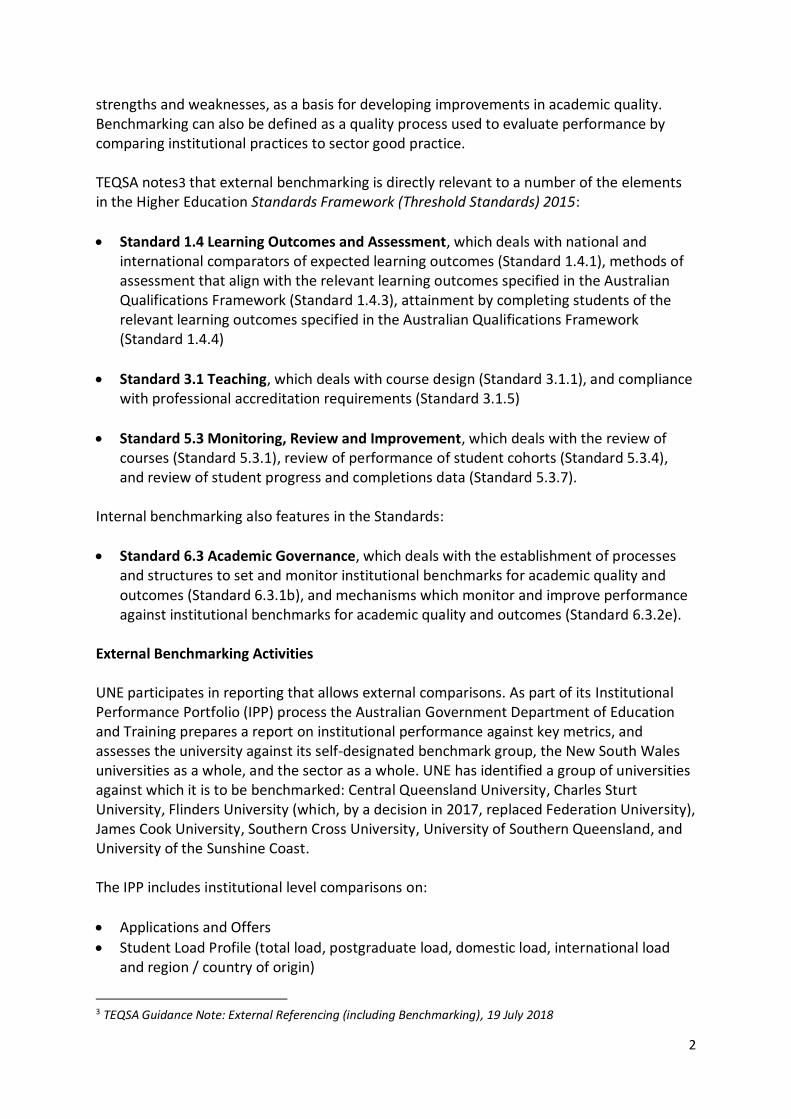
strengths and weaknesses, as a basis for developing improvements in academic quality. Benchmarking can also be defined as a quality process used to evaluate performance by comparing institutional practices to sector good practice. TEQSA notes3 that external benchmarking is directly relevant to a number of the elements in the Higher Education Standards Framework (Threshold Standards) 2015:
Standard 1.4 Learning Outcomes and Assessment, which deals with national and international comparators of expected learning outcomes (Standard 1.4.1), methods of assessment that align with the relevant learning outcomes specified in the Australian Qualifications Framework (Standard 1.4.3), attainment by completing students of the relevant learning outcomes specified in the Australian Qualifications Framework (Standard 1.4.4)
Standard 3.1 Teaching, which deals with course design (Standard 3.1.1), and compliance with professional accreditation requirements (Standard 3.1.5)
Standard 5.3 Monitoring, Review and Improvement, which deals with the review of courses (Standard 5.3.1), review of performance of student cohorts (Standard 5.3.4), and review of student progress and completions data (Standard 5.3.7).
Internal benchmarking also features in the Standards:
Standard 6.3 Academic Governance, which deals with the establishment of processes and structures to set and monitor institutional benchmarks for academic quality and outcomes (Standard 6.3.1b), and mechanisms which monitor and improve performance against institutional benchmarks for academic quality and outcomes (Standard 6.3.2e).
External Benchmarking Activities UNE participates in reporting that allows external comparisons. As part of its Institutional Performance Portfolio (IPP) process the Australian Government Department of Education and Training prepares a report on institutional performance against key metrics, and assesses the university against its self-designated benchmark group, the New South Wales universities as a whole, and the sector as a whole. UNE has identified a group of universities against which it is to be benchmarked: Central Queensland University, Charles Sturt University, Flinders University (which, by a decision in 2017, replaced Federation University), James Cook University, Southern Cross University, University of Southern Queensland, and University of the Sunshine Coast. The IPP includes institutional level comparisons on:
Applications and Offers
Student Load Profile (total load, postgraduate load, domestic load, international load and region / country of origin)
3 TEQSA Guidance Note: External Referencing (including Benchmarking), 19 July 2018
3
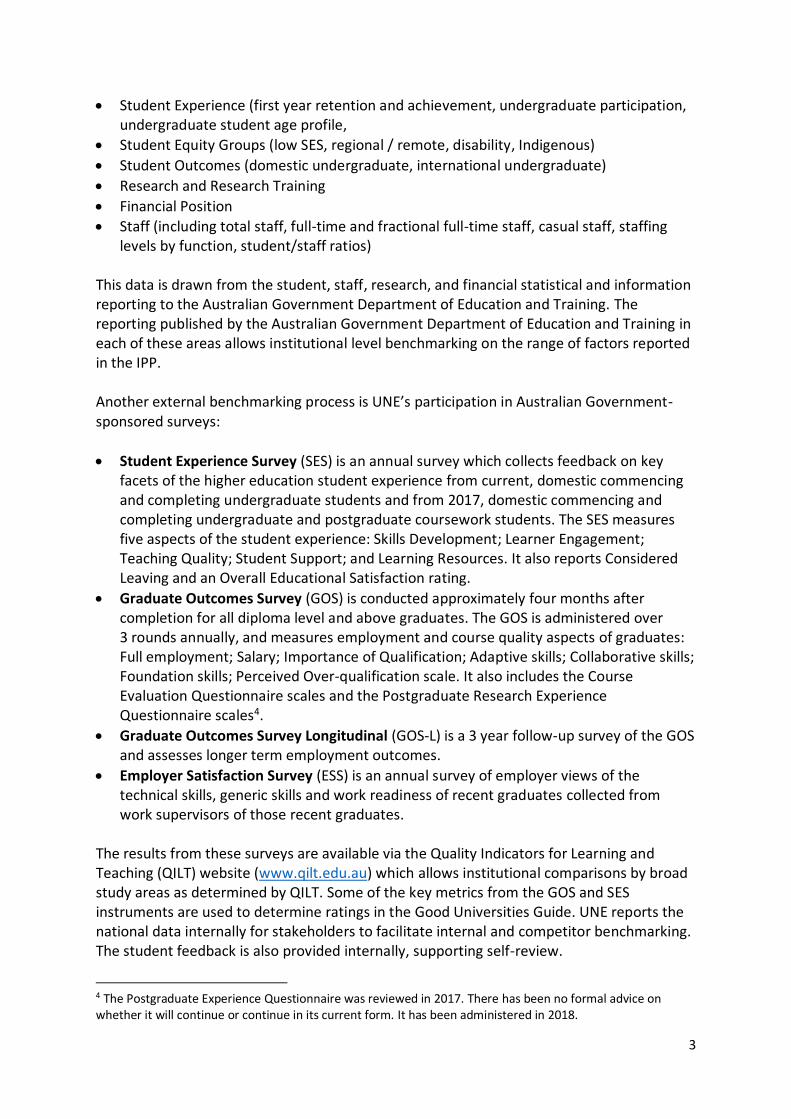
Student Experience (first year retention and achievement, undergraduate participation, undergraduate student age profile,
Student Equity Groups (low SES, regional / remote, disability, Indigenous)
Student Outcomes (domestic undergraduate, international undergraduate)
Research and Research Training
Financial Position
Staff (including total staff, full-time and fractional full-time staff, casual staff, staffing levels by function, student/staff ratios)
This data is drawn from the student, staff, research, and financial statistical and information reporting to the Australian Government Department of Education and Training. The reporting published by the Australian Government Department of Education and Training in each of these areas allows institutional level benchmarking on the range of factors reported in the IPP. Another external benchmarking process is UNE’s participation in Australian Government-sponsored surveys:
Student Experience Survey (SES) is an annual survey which collects feedback on key facets of the higher education student experience from current, domestic commencing and completing undergraduate students and from 2017, domestic commencing and completing undergraduate and postgraduate coursework students. The SES measures five aspects of the student experience: Skills Development; Learner Engagement; Teaching Quality; Student Support; and Learning Resources. It also reports Considered Leaving and an Overall Educational Satisfaction rating.
Graduate Outcomes Survey (GOS) is conducted approximately four months after completion for all diploma level and above graduates. The GOS is administered over 3 rounds annually, and measures employment and course quality aspects of graduates: Full employment; Salary; Importance of Qualification; Adaptive skills; Collaborative skills; Foundation skills; Perceived Over-qualification scale. It also includes the Course Evaluation Questionnaire scales and the Postgraduate Research Experience Questionnaire scales4.
Graduate Outcomes Survey Longitudinal (GOS-L) is a 3 year follow-up survey of the GOS and assesses longer term employment outcomes.
Employer Satisfaction Survey (ESS) is an annual survey of employer views of the technical skills, generic skills and work readiness of recent graduates collected from work supervisors of those recent graduates.
The results from these surveys are available via the Quality Indicators for Learning and Teaching (QILT) website (www.qilt.edu.au) which allows institutional comparisons by broad study areas as determined by QILT. Some of the key metrics from the GOS and SES instruments are used to determine ratings in the Good Universities Guide. UNE reports the national data internally for stakeholders to facilitate internal and competitor benchmarking. The student feedback is also provided internally, supporting self-review.
4 The Postgraduate Experience Questionnaire was reviewed in 2017. There has been no formal advice on whether it will continue or continue in its current form. It has been administered in 2018.
4
The Tertiary Education Quality and Standards Agency (TEQSA), using information provided by the University through the Higher Education Information Management System (HEIMS) and gathered from the external survey results, provides UNE with an annual risk assessment. TEQSA assesses the University’s performance on a range of indicators (student growth, student attrition, student progression, course completions, graduate satisfaction, graduate destinations, staffing data, and financial data) and assigns a level of risk, at least in part based on the overall performance of the higher education sector. Higher education external benchmarks tend to be lagging. In some cases the data is more than two years’ old and is reported at a whole-of-institution level. It is this delay, and the level of aggregation of data, which requires us to adopt an enhanced internal benchmarking approach. Internal Requirements for Benchmarking Processes The revised committee governance structures include requirements for benchmarking processes. In addition to internal requirements drawn from governance responsibilities, key decision-making individuals will also require access to benchmarking information. Benchmark information for this group will need to be more timely to ensure that operational decisions are taken on the basis of the latest available information. They are also more likely to be a subset of the institutional level data (i.e., organisational unit specific). These requirements, however, do not feature in this paper. Internal Benchmarking Activities UNE undertakes internal benchmarking processes which meet its external obligations, in particular under the Higher Education Standards Framework (Threshold Standards) 2015:
Unit Monitoring Report (by teaching period and annually) which examines unit modes (other than those related to honours or research)delivered in a specified teaching period, reporting on student participation, unit attrition, unit grade distribution, student satisfaction indicators (Clear Learning Outcomes, Learning Outcomes Achieved, Intellectual Stimulation, Helpful Resources Provided, Constructive Feedback Received, Timely Feedback Provided, Appropriate Amount of Work, Overall Satisfaction). The findings are reported in the Unit Monitoring Report which highlights the percentage change from the previous year and the percentage change from the 5th previous year. The data for the student satisfaction indicators are collected via Unit Evaluation Surveys which are conducted mandatorily on units offered in the teaching period, with the
exception of reading units, special topics, field, work or practical based units, special options or research-based units.
Commencing Domestic Bachelor-Pass Student Progress and Success Annual Report which examines the progress and success of commencing domestic bachelor-pass students. The report provides a number of metrics (pass rates, GPA, progress rates, retention rates) by demographic indicators (internal/external, equity group, over/under 25 years, gender, full-time/part-time, international, basis of admission) and highlights the change from previous years.
5
Commencing Domestic Masters by Coursework Student Progress and Success Annual Report which examines the progress and success of Commencing Domestic Masters by Coursework (CDMC) students. The report provides a number of metrics (pass rates, GPA, progress rates, retention rates) by demographic indicators (internal/external, equity group, over/under 25 years, gender, full-time/part-time, international) and highlights the change from previous years.
Domestic Bachelor-Pass & Domestic Masters by Coursework Annual Student Completions Report which examines the completions/graduations of domestic bachelor-pass students and domestic masters-by-coursework students.
Domestic Higher Degrees by Research Student Progress and Success Annual Report (new – proposed for 2018) which examines the progress and completions of Domestic Higher Degree by Research students.
Student Survey Outcomes Report which examines the outcomes from the QILT administered Student Experience Survey and the Graduate Outcomes Survey, and analyses the verbatim from both.
Teaching Evaluation Surveys are conducted on an opt-in basis and are usually conducted in conjunction with unit evaluations. Results are provided to the unit coordinator / lecturer, allowing them to benchmark the data with previous iterations of the unit which they have delivered.
Intensive School Evaluation Surveys are conducted on a request basis only and collect information on arrangements for the intensive, the level of understanding of the preparation required on the part of the student, and the experience of the student at the intensive.
Unit Reviews are usually conducted by an expert panel on a three-yearly basis and examine the currency of content and learning outcomes, relevancy for the courses that it relates to, pedagogy and assessment, achievement of learning outcomes, and benchmarking of the curriculum and assessment standards.
Course Reviews are usually conducted by an expert panel on a seven-yearly basis and examine the overarching philosophy of the course, the structure of the course including how the Course Learning Outcomes and Graduate Attributes are being achieved, the quality of the teaching and learning including assessment and learning materials, the relevance of the course to the requirements of employers and students, the relationship of the course to the strategic goals of the University, and future directions for the course.
Focus of Benchmarking Institutional benchmarks are set at key points of the student life-cycle, with a focus on those that relate to an area of concern, identified through external benchmarking, and / or related to university level strategies, and / or related to likely areas of performance for growth in CSPs. In some cases the benchmark relates to the University’s previous performance, in others it will relate to the University’s benchmark group or to a national average. In all cases the intent is to discover gaps in capabilities and identify opportunities for improvement and provide a basis on which action on these can be prioritised. Each of these key life-cycle points is discussed below. The measures, sources and benchmarks are contained in Attachment A.
6
Student Admissions Student admissions is a key process for predicting the achievement of target student load – both for Commonwealth supported places (CSPs) and fee-paying places. The relevant benchmark is the number of planned places, often determined as part of a broader load forecasting process and linked to institutional budgeting. As such, target load has not been included as part of this proposal. The different profiles for higher degree by research, postgraduate by coursework and bachelor students requires that these be monitored and reported on separately. For bachelor course admissions the Australian Tertiary Admission Rank (ATAR) is often seen as a useful measure on which to base selection of school leavers, or recent school leavers, for entry to undergraduate programs. ATARs are seen, by Government, as a proxy for the quality of those admitted to courses of study, and will be a feature of the data published on the National Higher Education Admissions Information Platform. From 2020 all Australian states and territories will use the ATAR to rank students in relation to the student body for that year across that state or territory. The ATAR is a rank that is not readily susceptible to influence by institutional strategies. The different stages of the student admissions process - applications, offers, acceptances and enrolments - provide a cascading view enabling early prediction of achievement of student load targets. These stages are proposed as the basis for student admissions benchmark measures, reflecting the current measures on the Course Monitoring dashboard. Student Attrition and Retention Student attrition (and its flip-side, retention) is a key performance indicator of interest to Government and a concern for the University. The Higher Education Standards Panel (HESP) released its final report on Improving Retention, Completion and Success in Higher Education on 7 June 2018. The report recommends to Government that an adjusted attrition rate be used as the primary measure of attrition. Adjusted attrition accounts for students who change higher education institution. The student is only counted as an attrition if they withdraw entirely from higher education study. Unit level attrition is a feature of the Unit Monitoring process and this allows tracking of attrition rates from the end of the first day of teaching in Week 2 to the end of the trimester census date. The Unit Monitoring report identifies the number of unit modes with high (> 20%) attrition by (from 2018) discipline with five-year trend data. It also identifies the average unit mode attrition rate, also by discipline and showing five-year trend data. The lowest level of student retention tends to be from first year to second year, and with greater numbers in undergraduate courses, this is a logical focus for benchmarking.
7
Student Success Student success is a key performance indicator of interest to Government and to the University, particularly as an early indicator of / antecedent to student completions. The student success rate is calculated by identifying the EFTSL of units passed by commencing students as a percentage of the EFTSL of all units attempted (enrolled + passed + failed + withdrawn) by commencing students in a given teaching period (trimester or annually). It is related to the concept of student progression but is more straightforward to calculate and doesn’t require an analysis of each student’s progress to completion against a, sometimes non-linear, pathway. Unit level pass rates are a feature of the Unit Monitoring process. The Unit Monitoring report identifies the pass rates for each discipline in the teaching period and graphs show five-year trend data. Course level student success rates are reported on the Course Monitoring dashboard and represent enrolments rather than load. As with student attrition and retention, the most significant movement is likely to occur from first year to second year and the greater numbers in undergraduate courses makes this a logical focus for benchmarking. National data collection and reporting by Government enables system level comparisons to be made. Student Satisfaction Student satisfaction is an indicator of interest to the University as well as to Government. It can provide useful feedback on the design of units and courses and is a potential indicator of student attrition. The UNE Unit Monitoring process measures undergraduate and postgraduate by coursework student satisfaction. This process collects non-mandatory feedback from students at the end of each teaching period for the units in which they have been enrolled during that teaching period. The survey comprises single item scales which cover: Clear Learning Outcomes; Learning Outcomes Achieved; Intellectual Stimulation; Helpful Resources Provided; Constructive Feedback Received; Timely Feedback Provided; Appropriate Amount of Work; and Overall Satisfaction. Students respond to each item on a 5-point Likert-type scale. As well as being reported at a unit level, data is aggregated and reported at the discipline level. At course level student satisfaction is measured as part of the Student Experience Survey, run annually under the Quality Indicators for Learning and Teaching suite of surveys. Results are published on the QILT website. The data is drawn from current domestic commencing and completing undergraduate students, and from 2017, domestic commencing and completing undergraduate and postgraduate coursework students. The survey seeks feedback on a range of key areas: Skills Development; Learner Engagement; Teaching Quality; Student Support; and Learning Resources. It also reports Considered Leaving and an Overall Educational Satisfaction rating. There is a slight lag in the data with the survey results being published around March of the year following the data collection.
8
Graduate Satisfaction Graduate satisfaction is an indicator of interest to the University as well as to Government. It can provide useful feedback on the design of units and courses and is a potential indicator for prospective students in selecting a course and a higher education provider. Undergraduate and postgraduate graduate satisfaction (for all diploma level and above graduates) is measured at the course level as part of the GOS, run over 3 rounds annually under the Quality Indicators for Learning and Teaching suite of surveys. Results are published on the QILT website. The GOS measures employment and course quality aspects of graduates: Full employment; Salary; Importance of Qualification; Adaptive skills; Collaborative skills; Foundation skills; Perceived Over-qualification scale. It also includes the Course Evaluation Questionnaire scales and the Postgraduate Research Experience Questionnaire (PREQ) scales. The PREQ provides data on HDR graduate satisfaction on: Supervision; Intellectual Climate; Skills Development; Infrastructure; Thesis Examination Process; Clarity of Goals and Expectations; and Overall Satisfaction. The PREQ was reviewed last year and the sector is yet to be advised whether it will continue in its current form or, in fact, continue. There is little from it which has been published, and then only at a high level. Employer Satisfaction Employer satisfaction is an indicator of interest to the University as well as to Government. It can provide useful feedback from work supervisors of recent graduates regarding technical skills, generic skills and work readiness, and is a potential indicator of employability. The Employer Satisfaction Survey is conducted annually under the Quality Indicators for Learning and Teaching suite of surveys. Results are provided on the QILT website. The data is drawn from participating direct work supervisors of recent graduates who have completed the GOS. The survey seeks feedback on a range of key areas: Foundation skills; Adaptive skills; Collaborative skills; Technical skills; and Employability skills. It also reports Overall Satisfaction. Course Completions Student course completions is an area of focus for the Australian Government Department of Education and Training and is a potential area of performance that Government may apply for allocation of growth places. From an institutional perspective, it is a useful indicator of the success of the University’s teaching and support services. The Australian Government Department of Education and Training published its finding on completion rates for cohorts in Completion Rates of Higher Education Students – Cohort Analysis, 2005-2015 report (November 2017). The report tracks how many commencing students have completed their studies, how many are still studying, and how many have not completed an award course after identified periods of time (four, six and nine years).
9
The University’s Domestic Bachelor-Pass & Domestic Masters by Coursework Annual Student Completions Report examines the completions/graduations of domestic bachelor-pass students and domestic masters-by-coursework students and reports on annual, but not longitudinal, data. Course level course completions, based on commencing year, are reported on the Course Monitoring dashboard. Similar (lag) data provided by the Australian Government Department of Education and Training through its annual Award Course Completions report may allow for some comparisons but these would not be timely. Benchmark Reporting Reports detailing performance against the benchmarks detailed in Attachment A are provided to the Academic Board as relevant updated data becomes available.
10
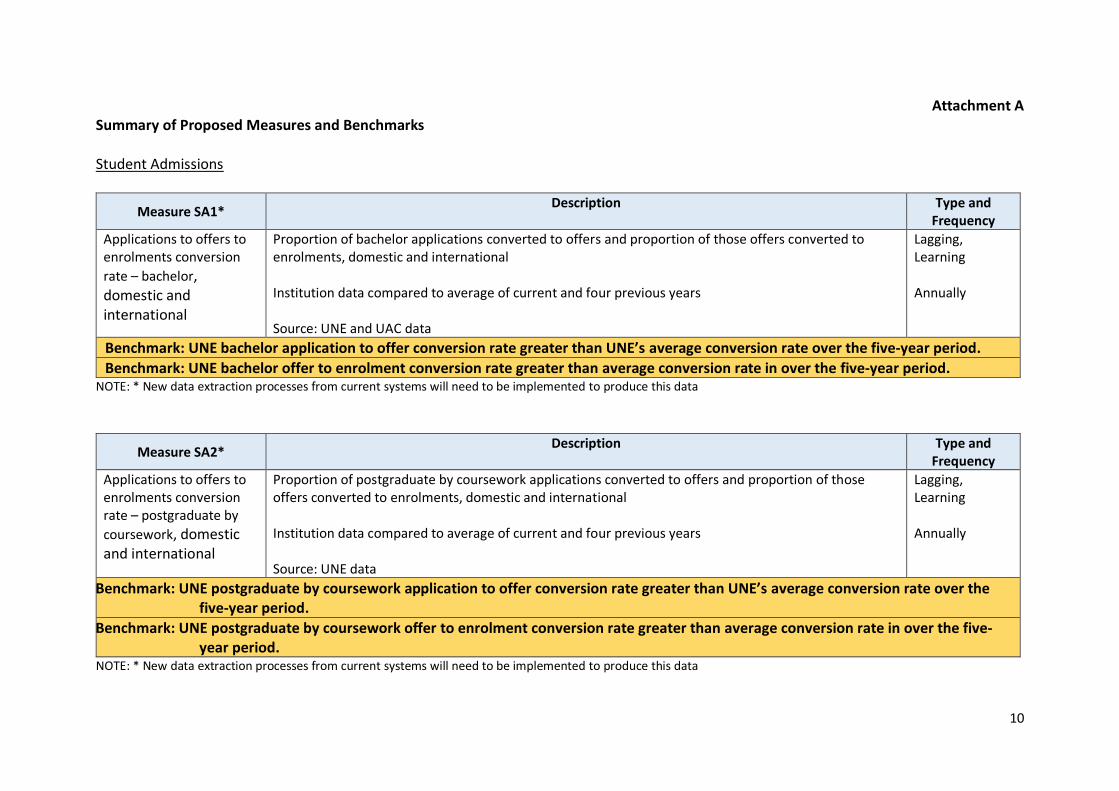
Attachment A Summary of Proposed Measures and Benchmarks Student Admissions
Measure SA1* Description Type and
Frequency
Applications to offers to enrolments conversion
rate – bachelor, domestic and international
Proportion of bachelor applications converted to offers and proportion of those offers converted to enrolments, domestic and international Institution data compared to average of current and four previous years Source: UNE and UAC data
Lagging, Learning Annually
Benchmark: UNE bachelor application to offer conversion rate greater than UNE’s average conversion rate over the five-year period.
Benchmark: UNE bachelor offer to enrolment conversion rate greater than average conversion rate in over the five-year period. NOTE: * New data extraction processes from current systems will need to be implemented to produce this data
Measure SA2* Description Type and
Frequency
Applications to offers to enrolments conversion rate – postgraduate by
coursework, domestic and international
Proportion of postgraduate by coursework applications converted to offers and proportion of those offers converted to enrolments, domestic and international Institution data compared to average of current and four previous years Source: UNE data
Lagging, Learning Annually
Benchmark: UNE postgraduate by coursework application to offer conversion rate greater than UNE’s average conversion rate over the five-year period.
Benchmark: UNE postgraduate by coursework offer to enrolment conversion rate greater than average conversion rate in over the five-year period.
NOTE: * New data extraction processes from current systems will need to be implemented to produce this data
11
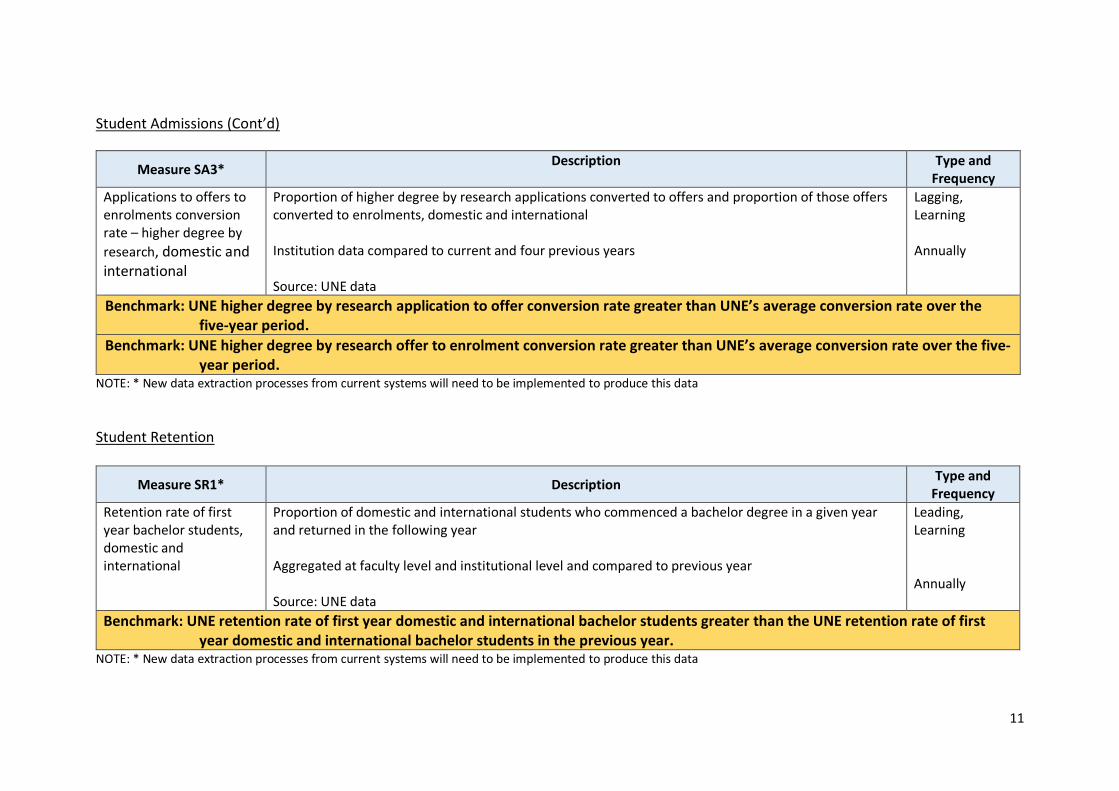
Student Admissions (Cont’d)
Measure SA3* Description Type and
Frequency
Applications to offers to enrolments conversion rate – higher degree by
research, domestic and international
Proportion of higher degree by research applications converted to offers and proportion of those offers converted to enrolments, domestic and international Institution data compared to current and four previous years Source: UNE data
Lagging, Learning Annually
Benchmark: UNE higher degree by research application to offer conversion rate greater than UNE’s average conversion rate over the five-year period.
Benchmark: UNE higher degree by research offer to enrolment conversion rate greater than UNE’s average conversion rate over the five-year period.
NOTE: * New data extraction processes from current systems will need to be implemented to produce this data
Student Retention
Measure SR1* Description Type and
Frequency
Retention rate of first year bachelor students, domestic and international
Proportion of domestic and international students who commenced a bachelor degree in a given year and returned in the following year Aggregated at faculty level and institutional level and compared to previous year Source: UNE data
Leading, Learning Annually
Benchmark: UNE retention rate of first year domestic and international bachelor students greater than the UNE retention rate of first year domestic and international bachelor students in the previous year.
NOTE: * New data extraction processes from current systems will need to be implemented to produce this data
12
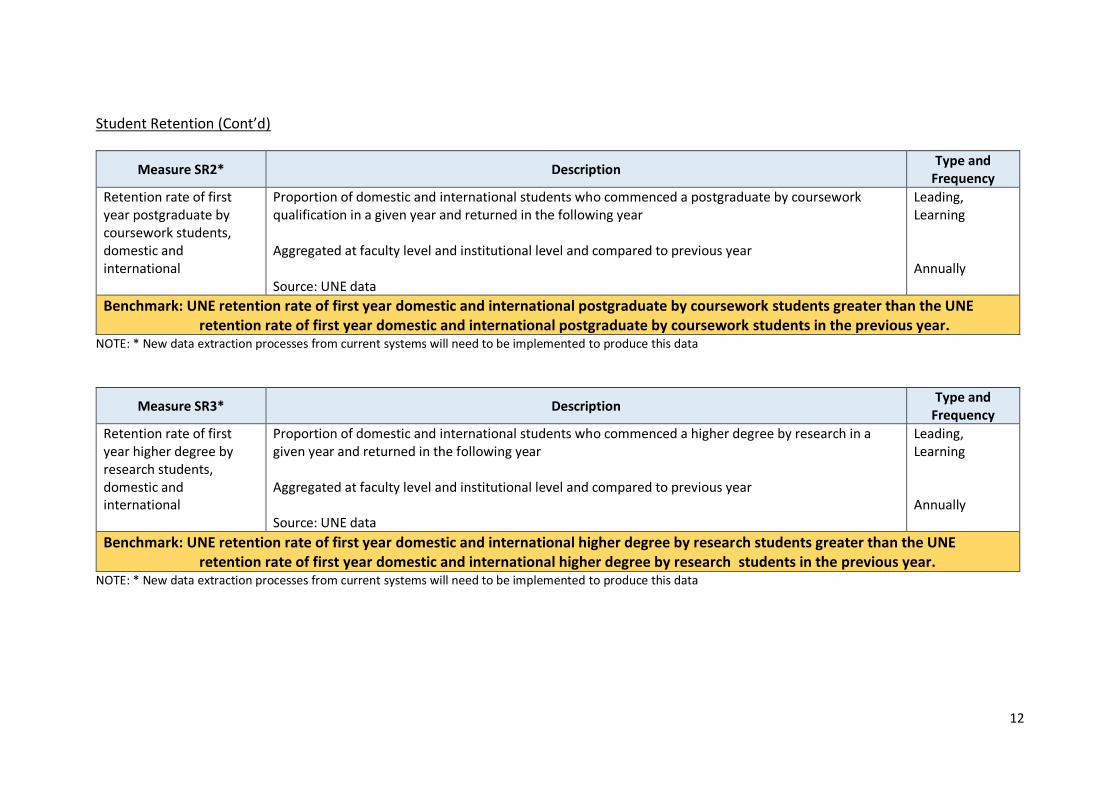
Student Retention (Cont’d)
Measure SR2* Description Type and
Frequency
Retention rate of first year postgraduate by coursework students, domestic and international
Proportion of domestic and international students who commenced a postgraduate by coursework qualification in a given year and returned in the following year Aggregated at faculty level and institutional level and compared to previous year Source: UNE data
Leading, Learning Annually
Benchmark: UNE retention rate of first year domestic and international postgraduate by coursework students greater than the UNE retention rate of first year domestic and international postgraduate by coursework students in the previous year.
NOTE: * New data extraction processes from current systems will need to be implemented to produce this data
Measure SR3* Description Type and
Frequency
Retention rate of first year higher degree by research students, domestic and international
Proportion of domestic and international students who commenced a higher degree by research in a given year and returned in the following year Aggregated at faculty level and institutional level and compared to previous year Source: UNE data
Leading, Learning Annually
Benchmark: UNE retention rate of first year domestic and international higher degree by research students greater than the UNE retention rate of first year domestic and international higher degree by research students in the previous year.
NOTE: * New data extraction processes from current systems will need to be implemented to produce this data

13
Student Retention (Cont’d)
Measure SR4 Description Type and
Frequency
Retention rate of first year bachelor students, domestic and international [Sectoral Comparison]
Proportion of domestic and international students who commenced a bachelor degree in a given year and returned in the following year Aggregated at institutional level and compared to sector, NSW and benchmark institutions for current year and five-year trend Source: Institutional Performance Portfolio
Lagging, Learning Annually
Benchmark: UNE retention rate of first year domestic and international bachelor students greater than the combined retention rate of first year domestic and international bachelor students of other universities in the UNE benchmark group.
Student Success
Measure SU1* Description Type and
Frequency
First year success rate of bachelor students, domestic and international
The EFTSL of units passed by first year domestic and international bachelor students as a percentage of the EFTSL of all units attempted (enrolled + passed + failed + withdrawn) by first year domestic and international bachelor students in the given year Aggregated at faculty level and institutional level and compared to same period in the previous year Source: UNE data
Leading, Learning Annually
Benchmark: UNE success rate of first year domestic and international bachelor students greater than UNE’s success rate of first year domestic bachelor and international students in the previous year.
NOTE: * New data extraction processes from current systems will need to be implemented to produce this data
14
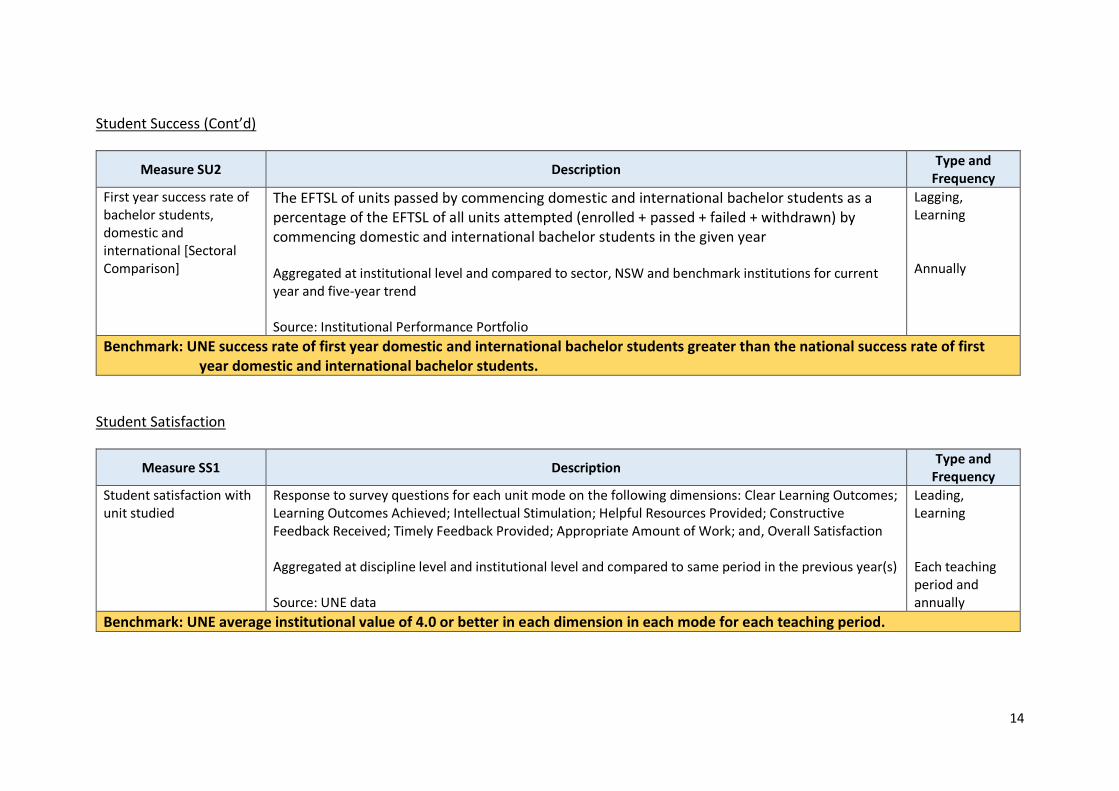
Student Success (Cont’d)
Measure SU2 Description Type and
Frequency
First year success rate of bachelor students, domestic and international [Sectoral Comparison]
The EFTSL of units passed by commencing domestic and international bachelor students as a percentage of the EFTSL of all units attempted (enrolled + passed + failed + withdrawn) by commencing domestic and international bachelor students in the given year Aggregated at institutional level and compared to sector, NSW and benchmark institutions for current year and five-year trend Source: Institutional Performance Portfolio
Lagging, Learning Annually
Benchmark: UNE success rate of first year domestic and international bachelor students greater than the national success rate of first year domestic and international bachelor students.
Student Satisfaction
Measure SS1 Description Type and
Frequency
Student satisfaction with unit studied
Response to survey questions for each unit mode on the following dimensions: Clear Learning Outcomes; Learning Outcomes Achieved; Intellectual Stimulation; Helpful Resources Provided; Constructive Feedback Received; Timely Feedback Provided; Appropriate Amount of Work; and, Overall Satisfaction Aggregated at discipline level and institutional level and compared to same period in the previous year(s) Source: UNE data
Leading, Learning Each teaching period and annually
Benchmark: UNE average institutional value of 4.0 or better in each dimension in each mode for each teaching period.
15
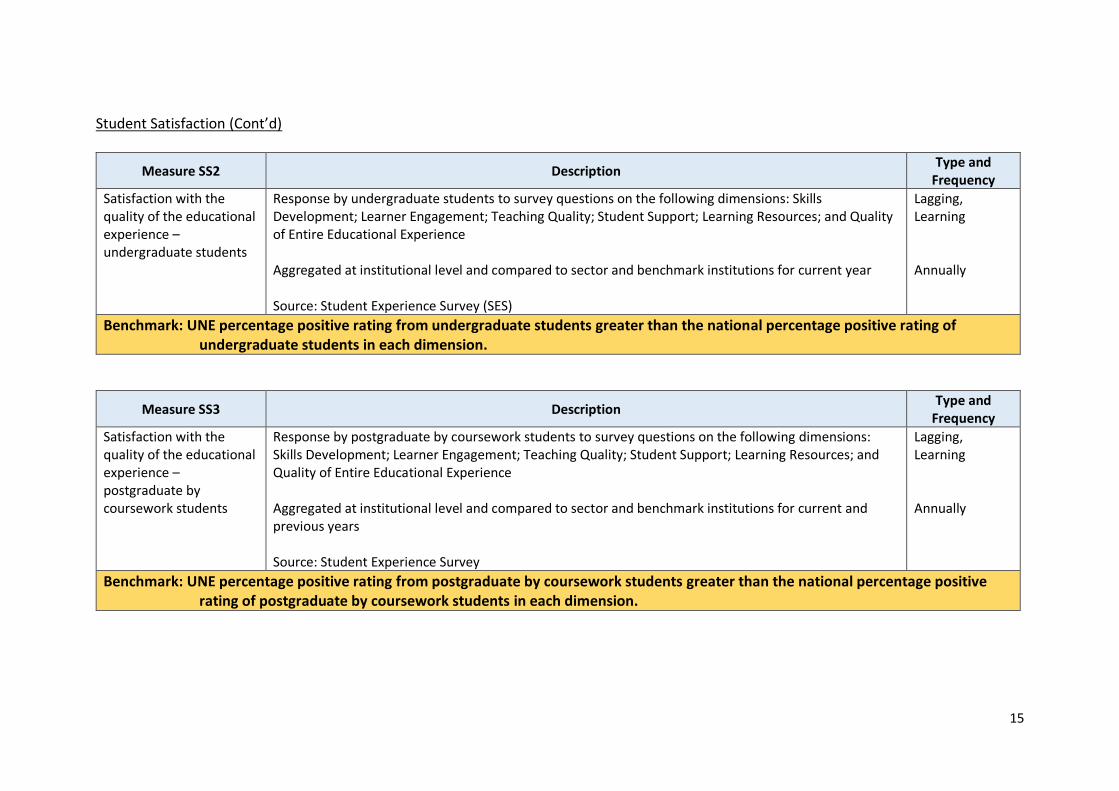
Student Satisfaction (Cont’d)
Measure SS2 Description Type and
Frequency
Satisfaction with the quality of the educational experience – undergraduate students
Response by undergraduate students to survey questions on the following dimensions: Skills Development; Learner Engagement; Teaching Quality; Student Support; Learning Resources; and Quality of Entire Educational Experience Aggregated at institutional level and compared to sector and benchmark institutions for current year Source: Student Experience Survey (SES)
Lagging, Learning Annually
Benchmark: UNE percentage positive rating from undergraduate students greater than the national percentage positive rating of undergraduate students in each dimension.
Measure SS3 Description Type and
Frequency
Satisfaction with the quality of the educational experience – postgraduate by coursework students
Response by postgraduate by coursework students to survey questions on the following dimensions: Skills Development; Learner Engagement; Teaching Quality; Student Support; Learning Resources; and Quality of Entire Educational Experience Aggregated at institutional level and compared to sector and benchmark institutions for current and previous years Source: Student Experience Survey
Lagging, Learning Annually
Benchmark: UNE percentage positive rating from postgraduate by coursework students greater than the national percentage positive rating of postgraduate by coursework students in each dimension.
16
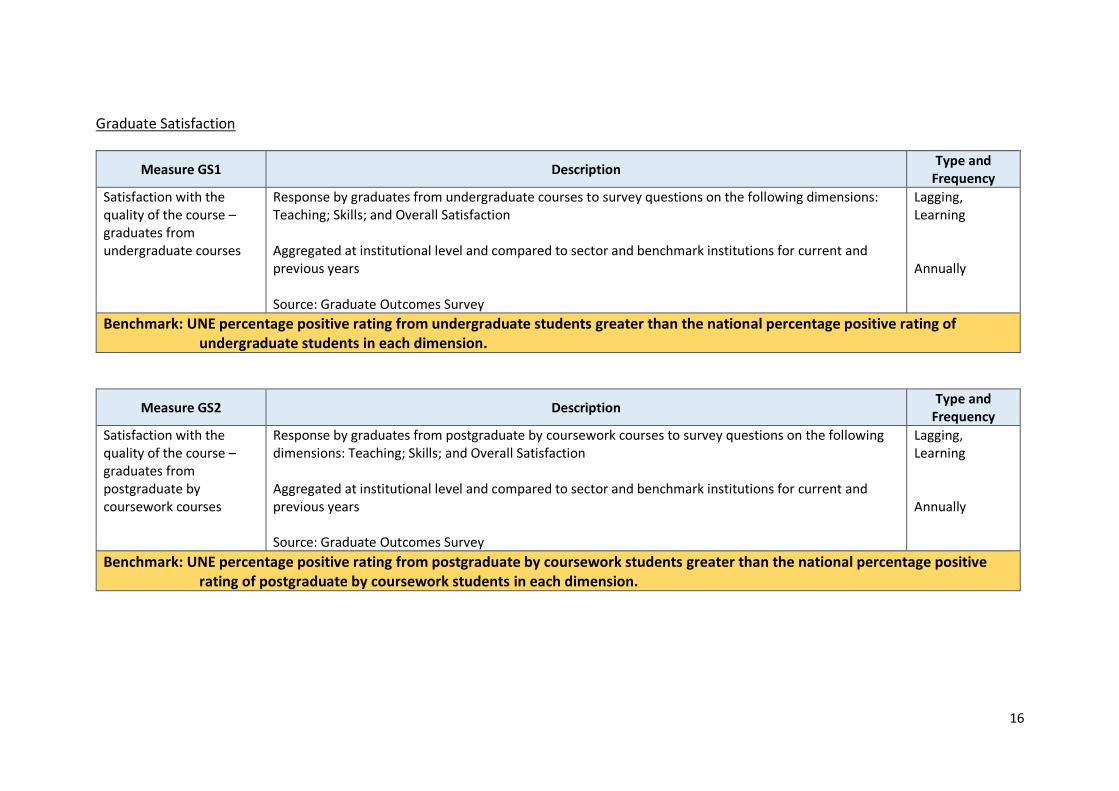
Graduate Satisfaction
Measure GS1 Description Type and
Frequency
Satisfaction with the quality of the course – graduates from undergraduate courses
Response by graduates from undergraduate courses to survey questions on the following dimensions: Teaching; Skills; and Overall Satisfaction Aggregated at institutional level and compared to sector and benchmark institutions for current and previous years Source: Graduate Outcomes Survey
Lagging, Learning Annually
Benchmark: UNE percentage positive rating from undergraduate students greater than the national percentage positive rating of undergraduate students in each dimension.
Measure GS2 Description Type and
Frequency
Satisfaction with the quality of the course – graduates from postgraduate by coursework courses
Response by graduates from postgraduate by coursework courses to survey questions on the following dimensions: Teaching; Skills; and Overall Satisfaction Aggregated at institutional level and compared to sector and benchmark institutions for current and previous years Source: Graduate Outcomes Survey
Lagging, Learning Annually
Benchmark: UNE percentage positive rating from postgraduate by coursework students greater than the national percentage positive rating of postgraduate by coursework students in each dimension.
17
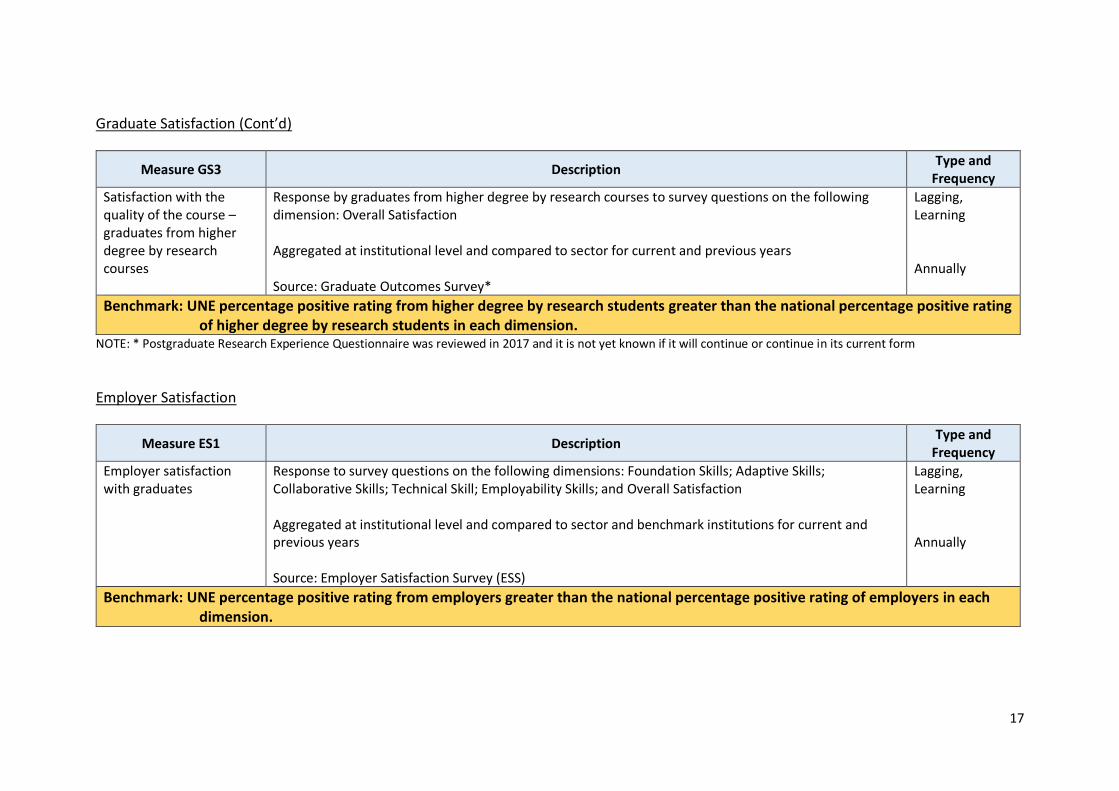
Graduate Satisfaction (Cont’d)
Measure GS3 Description Type and
Frequency
Satisfaction with the quality of the course – graduates from higher degree by research courses
Response by graduates from higher degree by research courses to survey questions on the following dimension: Overall Satisfaction Aggregated at institutional level and compared to sector for current and previous years Source: Graduate Outcomes Survey*
Lagging, Learning Annually
Benchmark: UNE percentage positive rating from higher degree by research students greater than the national percentage positive rating of higher degree by research students in each dimension.
NOTE: * Postgraduate Research Experience Questionnaire was reviewed in 2017 and it is not yet known if it will continue or continue in its current form
Employer Satisfaction
Measure ES1 Description Type and
Frequency
Employer satisfaction with graduates
Response to survey questions on the following dimensions: Foundation Skills; Adaptive Skills; Collaborative Skills; Technical Skill; Employability Skills; and Overall Satisfaction Aggregated at institutional level and compared to sector and benchmark institutions for current and previous years Source: Employer Satisfaction Survey (ESS)
Lagging, Learning Annually
Benchmark: UNE percentage positive rating from employers greater than the national percentage positive rating of employers in each dimension.
18
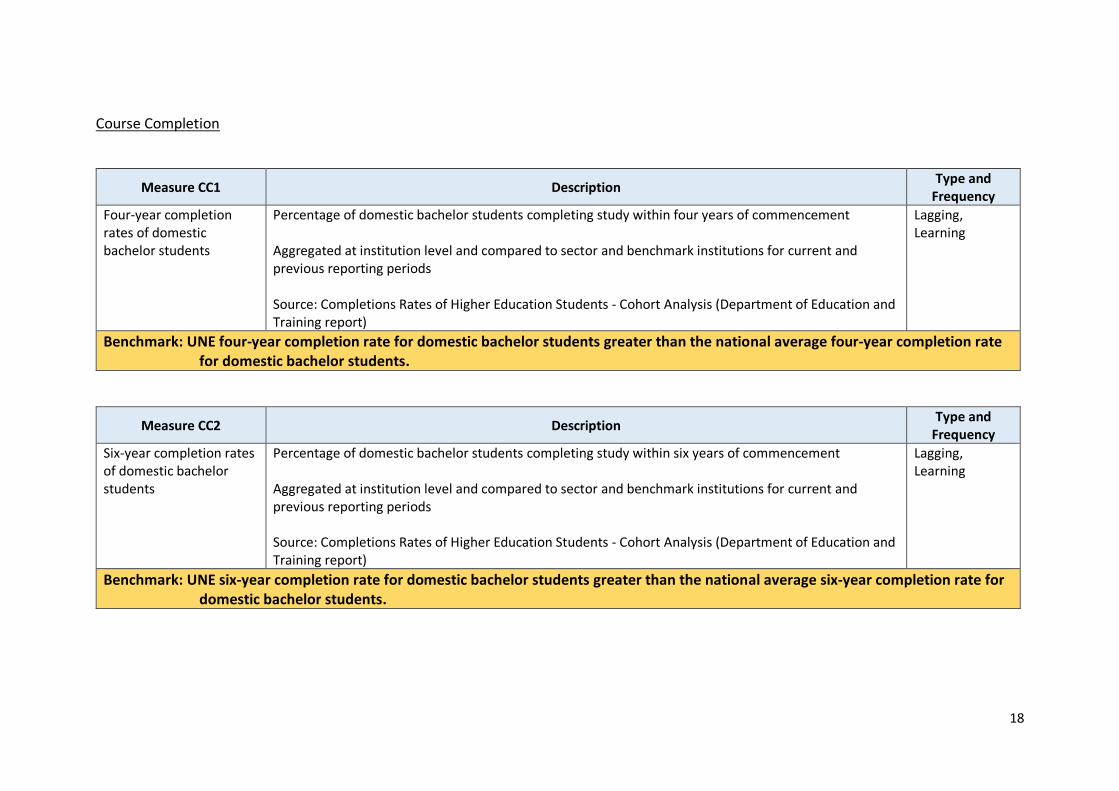
Course Completion
Measure CC1 Description Type and
Frequency
Four-year completion rates of domestic bachelor students
Percentage of domestic bachelor students completing study within four years of commencement Aggregated at institution level and compared to sector and benchmark institutions for current and previous reporting periods Source: Completions Rates of Higher Education Students - Cohort Analysis (Department of Education and Training report)
Lagging, Learning
Benchmark: UNE four-year completion rate for domestic bachelor students greater than the national average four-year completion rate for domestic bachelor students.
Measure CC2 Description Type and
Frequency
Six-year completion rates of domestic bachelor students
Percentage of domestic bachelor students completing study within six years of commencement Aggregated at institution level and compared to sector and benchmark institutions for current and previous reporting periods Source: Completions Rates of Higher Education Students - Cohort Analysis (Department of Education and Training report)
Lagging, Learning
Benchmark: UNE six-year completion rate for domestic bachelor students greater than the national average six-year completion rate for domestic bachelor students.
19
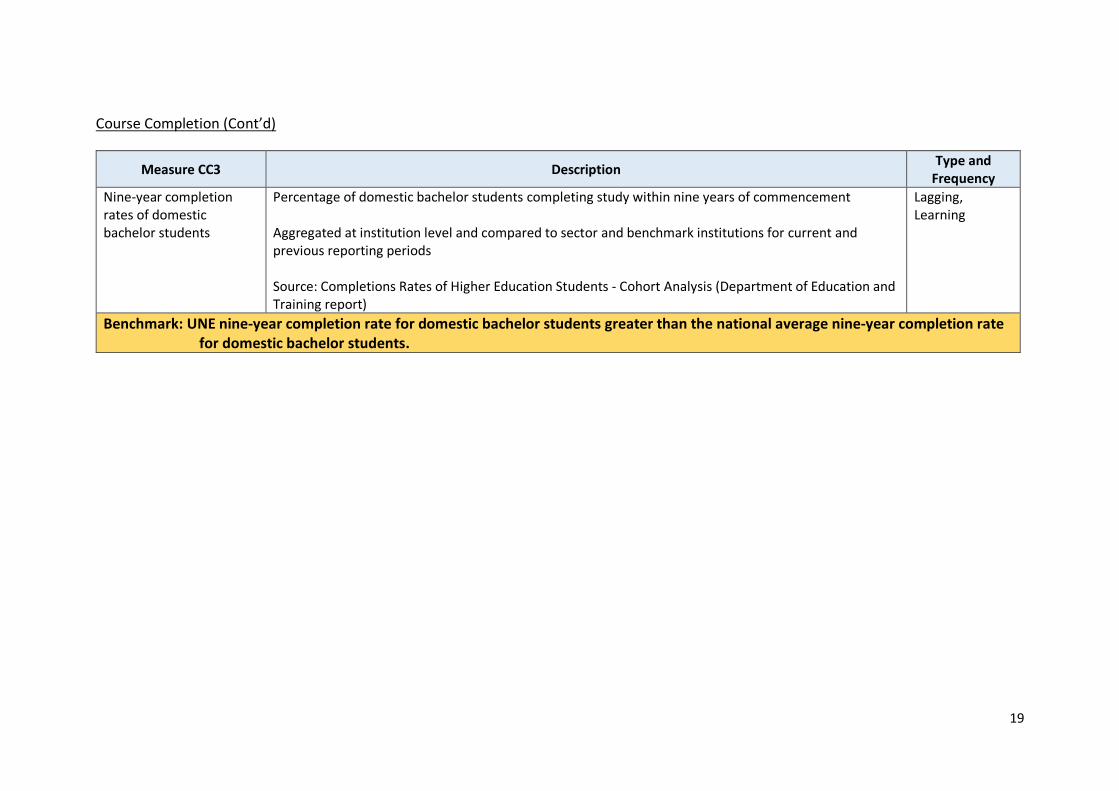
Course Completion (Cont’d)
Measure CC3 Description Type and
Frequency
Nine-year completion rates of domestic bachelor students
Percentage of domestic bachelor students completing study within nine years of commencement Aggregated at institution level and compared to sector and benchmark institutions for current and previous reporting periods Source: Completions Rates of Higher Education Students - Cohort Analysis (Department of Education and Training report)
Lagging, Learning
Benchmark: UNE nine-year completion rate for domestic bachelor students greater than the national average nine-year completion rate for domestic bachelor students.