Benchmarking of selected technologies for … Standard Norge, 10 September 2015 Benchmarking of...
15
Workshop, Standard Norge, 10 September 2015 Benchmarking of selected technologies for industrial-scale CO 2 capture in cement plants Lars-André Tokheim Associate Professor at TUC & Project manager at Tel-Tek
Transcript of Benchmarking of selected technologies for … Standard Norge, 10 September 2015 Benchmarking of...

Workshop, Standard Norge, 10 September 2015
Benchmarking of selected technologies for industrial-scale CO2 capture in cement plants
Lars-André TokheimAssociate Professor at TUC & Project manager at Tel-Tek
Outline
1. Purpose of the benchmark study2. Approach3. Selected benchmarking results4. Sensitivity analysis

Purpose of the benchmark study• Compare technologies with regard to technical, economical and
environmental impacts – when applied to a cement kiln• Norcem Brevik as a case study• Technology providers (TP’s):
• About «industrial scale»:– Different technologies applied to a medium size cement plant– Not necessarily 85 or 90 % capture, could be for example 30 og
40 % capture – if this makes more sense from an economic, environmental and technical point of view
– Maturity Technology readiness level
MC = Membrane consortium: NTNU, DNV-GL and Yodfat
TP Technology
Aker Amine absorption
RTI Low-temperature capture using a solid sorbent
MC Membrane separation
Alstom High-temperature capture using a solid sorbent («Regenerative Carbonate Cycling» (RCC), i.e. Calcium Looping)

Cementkiln
system
CO2capture
plant
FuelsChemicals
Process waterCooling water
Pressurized airSteam
Uncleaned gasClean gas
Waste
Effluents
Byproducts
CO2Waste heat integration?
El. power
Fuel integration?
Byproduct integration?
EquipmentDynamics
In-streams
Space req.HSE aspects
Clinker
Approach: The system
El. power

Approach: Preconditions• Characteristics of uncleaned gas same as for Kiln #6 at Norcem
Brevik• CO2 stream:
– > 95 % CO2– Compression to 100 bar and ambient temperature– Guidance values for concentrations of other species
• CO2 capture ratio – three cases:1. 85 % without waste heat utilization2. 85 % with Norcem waste heat utilization3. x %, with Norcem waste heat as the only regeneration energy, x
defined by TP• Tel-Tek cost estimation
– Basis: Equipment units from TP’s– Adjust scope / equipment size when necessary– Same cost estimation method applied to all technologies
Basis for comparing technologies

TP SRD* [GJ/tCO2]Generic MEA 4.2 and 3.7Aker 2.7Alstom (calc.) 2.5RTI 2.4MC 0
Approach: Scope adjustment• Thermal energy
Coal-fired steam generation plant– Capture of additional
CO2– Equipment size
adjustment when required
– Potential change in pollutant concentrations not considered in the scale-up
• Same CO2 compression unit for all technologies
* SRD: Specific Regenerator Duty
Two cases calculated by Tel-Tek to compare
with «standard technology»
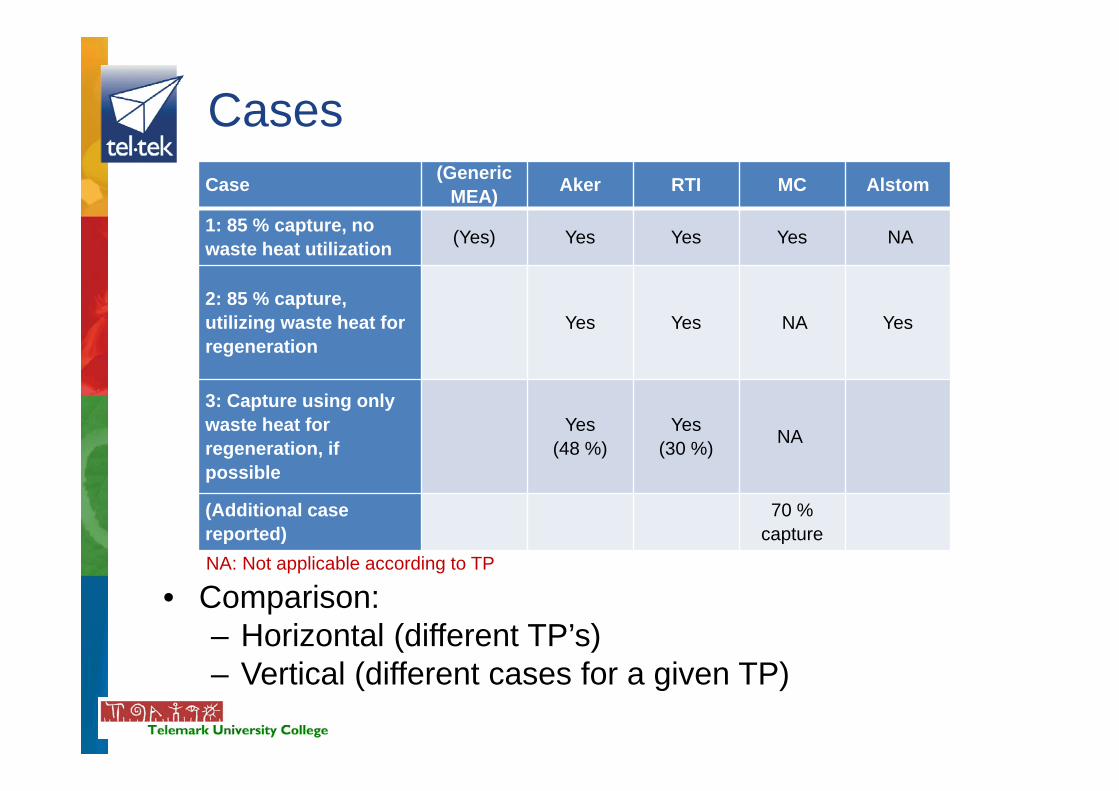
Cases
• Comparison:– Horizontal (different TP’s)– Vertical (different cases for a given TP)
Case (Generic MEA) Aker RTI MC Alstom
1: 85 % capture, no waste heat utilization (Yes) Yes Yes Yes NA
2: 85 % capture, utilizing waste heat for regeneration
Yes Yes NA Yes
3: Capture using only waste heat for regeneration, if possible
Yes(48 %)
Yes(30 %) NA
(Additional case reported)
70 % capture
NA: Not applicable according to TP

12 13 13 16 21 9 10
24 21 9
19 23
31 27 23 24
23
17 17
23 38
32
35
12
‐
10
20
30
40
50
60
70
Capture cost (Coal price 500 NOK/ton and El price 0.5 NOK/kWh)
CAPEX [EUR/tCO2] OPEX [EUR/tCO2]
Cost comparison: Capture cost
OPEX > CAPEX
Cost annualization: 25 years, 8 % interest rate

20 20 17 16 21 11 13
24 21 9
19 31
52 43
31 24
23
22 21
23 38
32
35 16
‐
10
20
30
40
50
60
70
80Avoided cost (plant level) (Coal price 500 NOK/ton and El price 0.5 NOK/kWh)
CAPEX [EUR/tCO2] OPEX [EUR/tCO2]
Cost comparison: Avoided costTakes into account additional CO2 generated in the energy plant required for regeneration

23 22 18 18 23 12 14
26 26 11
24 28
60 48
34 27 26 24 23
25 48
40
44 14
‐ 10 20 30 40 50 60 70 80 90
Avoided cost incl. power CO2 footprint (Coal price 500 NOK/ton and El price 0.5 NOK/kWh; El. power emission factor 500 gCO2/kWh)
CAPEX [EUR/tCO2] OPEX [EUR/tCO2]
Cost comparison: Avoided cost, including effect of power CO2 footprint
Takes into account additional CO2 generated in the energy plant required for regeneration + the CO2 footprint of electricity

Sensitivity analysis
Electricity footprint: 500 gCO2/kWh
Parameter Low value High valueEl. power price
NOK/kWh(€/kWh)
0.3(0.0375)
0.8(0.10)
Coal priceNOK/t(€/t)
300(37.5)
1000(125)
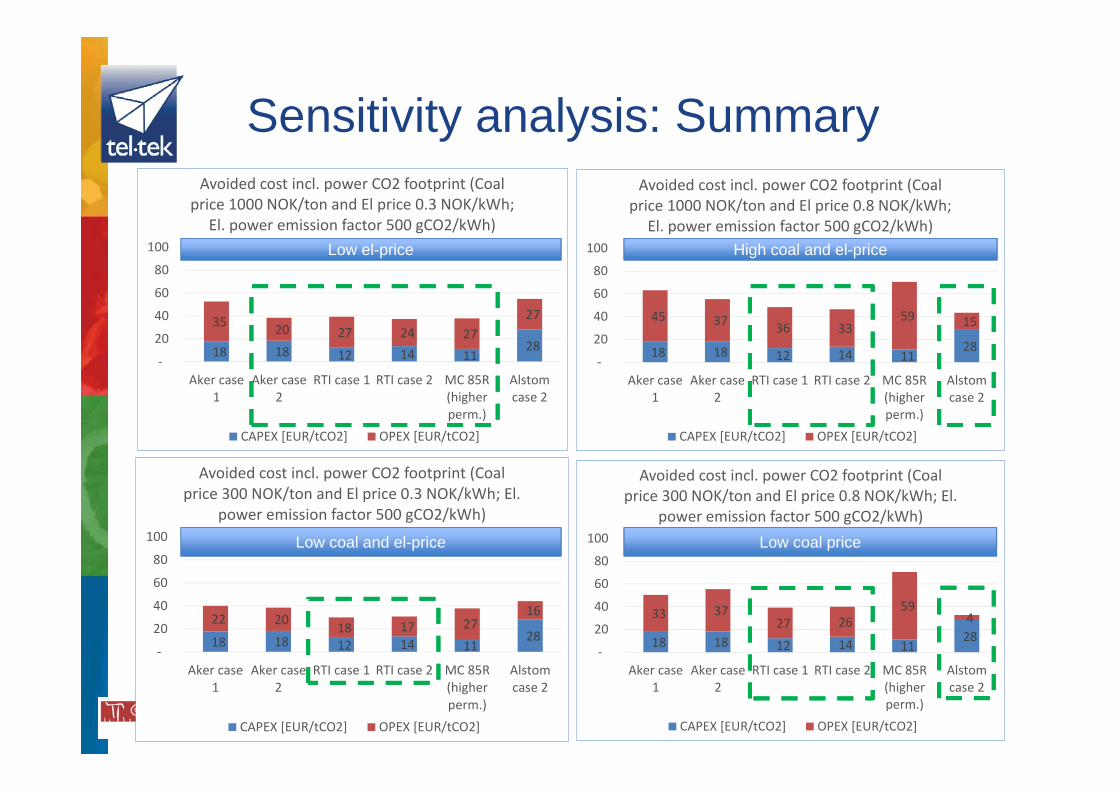
18 18 12 14 11 28
33 37 27 26
59 4
‐
20
40
60
80
100
Aker case1
Aker case2
RTI case 1 RTI case 2 MC 85R(higherperm.)
Alstomcase 2
Avoided cost incl. power CO2 footprint (Coal price 300 NOK/ton and El price 0.8 NOK/kWh; El.
power emission factor 500 gCO2/kWh)
CAPEX [EUR/tCO2] OPEX [EUR/tCO2]
18 18 12 14 11 28
45 37 36 33 59 15
‐
20
40
60
80
100
Aker case1
Aker case2
RTI case 1 RTI case 2 MC 85R(higherperm.)
Alstomcase 2
Avoided cost incl. power CO2 footprint (Coal price 1000 NOK/ton and El price 0.8 NOK/kWh;
El. power emission factor 500 gCO2/kWh)
CAPEX [EUR/tCO2] OPEX [EUR/tCO2]
18 18 12 14 11 28
35 20 27 24 27 27
‐
20
40
60
80
100
Aker case1
Aker case2
RTI case 1 RTI case 2 MC 85R(higherperm.)
Alstomcase 2
Avoided cost incl. power CO2 footprint (Coal price 1000 NOK/ton and El price 0.3 NOK/kWh;
El. power emission factor 500 gCO2/kWh)
CAPEX [EUR/tCO2] OPEX [EUR/tCO2]
18 18 12 14 11 28
22 20 18 17 27 16
‐
20
40
60
80
100
Aker case1
Aker case2
RTI case 1 RTI case 2 MC 85R(higherperm.)
Alstomcase 2
Avoided cost incl. power CO2 footprint (Coal price 300 NOK/ton and El price 0.3 NOK/kWh; El.
power emission factor 500 gCO2/kWh)
CAPEX [EUR/tCO2] OPEX [EUR/tCO2]
Sensitivity analysis: Summary
Low coal priceLow coal and el-price
Low el-price High coal and el-price
Cost estimate comments
• The cost estimates are mainly based on equipment lists supplied by the technology providers
• The energy consumption of the less mature technologies (RTI, MC, Alstom) have not been verified in pilot plant tests
• The estimates of the less mature technologies are uncertain and may increase when the technology readiness level (TRL) increases
• A high TRL level reduces the risk of implementing a given technology
21.09.2015

Technology Readiness Level (TRL)
RTI: 4-5
Aker: 8
MC: 4-5
Pilot at Norcem?
Alstom: 3-4

www.CO2-lab.com