Hay Benefits Benchmarking Report · Hay Benefits Benchmarking Report _____ Comparisons of Benefits...
63
Hay Benefits Benchmarking Report _________________________________________________________ Comparisons of Benefits Value ABC Company Versus Selected Organizations February 2005
Transcript of Hay Benefits Benchmarking Report · Hay Benefits Benchmarking Report _____ Comparisons of Benefits...
Hay Benefits Benchmarking Report _________________________________________________________
Comparisons of Benefits Value
ABC Company Versus
Selected Organizations
February 2005
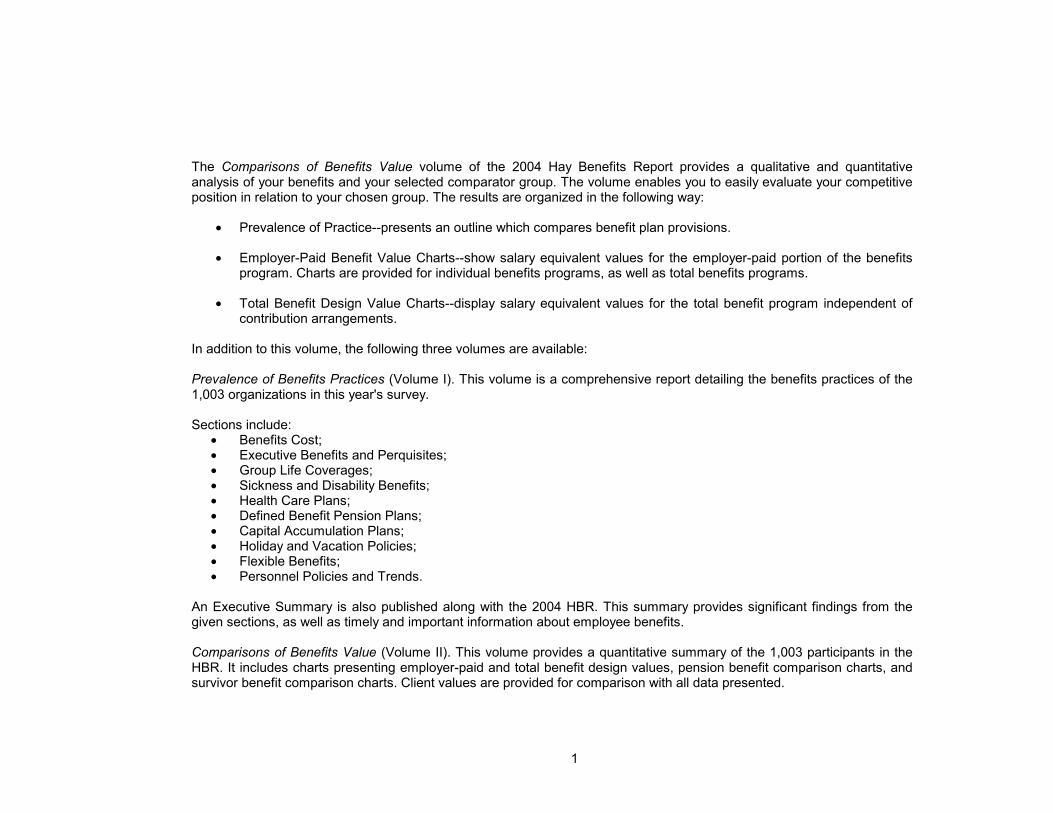
Table of Contents I. Introduction..................................................................................................................................................................................................I Explanation and Use.......................................................................................................................................................................................2 List of Participants ..........................................................................................................................................................................................6 II. Total Benefits Comparison.......................................................................................................................................................... II III. Individual Benefits Areas Comparisons ..............................................................................................................................................III Death Benefits..............................................................................................................................................................................................12 Disability Benefits .........................................................................................................................................................................................19 Health Care Benefits ....................................................................................................................................................................................25 Retirement Benefits ......................................................................................................................................................................................36 Defined Benefit Pension Benefits.........................................................................................................................................................36 Capital Accumulation Benefits .............................................................................................................................................................41 Total Retirement Benefits ....................................................................................................................................................................46 Holiday and Vacation Benefits ......................................................................................................................................................................48 Other Benefits ..............................................................................................................................................................................................51 Statutory Benefits .........................................................................................................................................................................................53
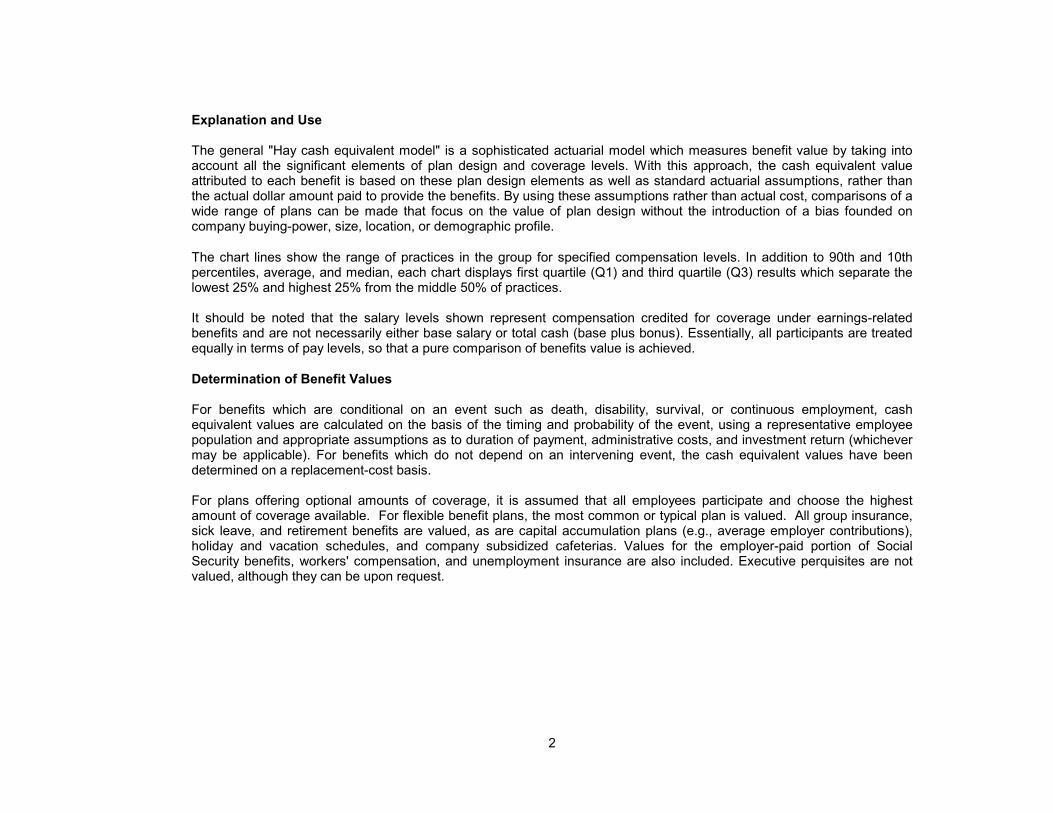
The Comparisons of Benefits Value volume of the 2004 Hay Benefits Report provides a qualitative and quantitative analysis of your benefits and your selected comparator group. The volume enables you to easily evaluate your competitive position in relation to your chosen group. The results are organized in the following way:
• Prevalence of Practice--presents an outline which compares benefit plan provisions.
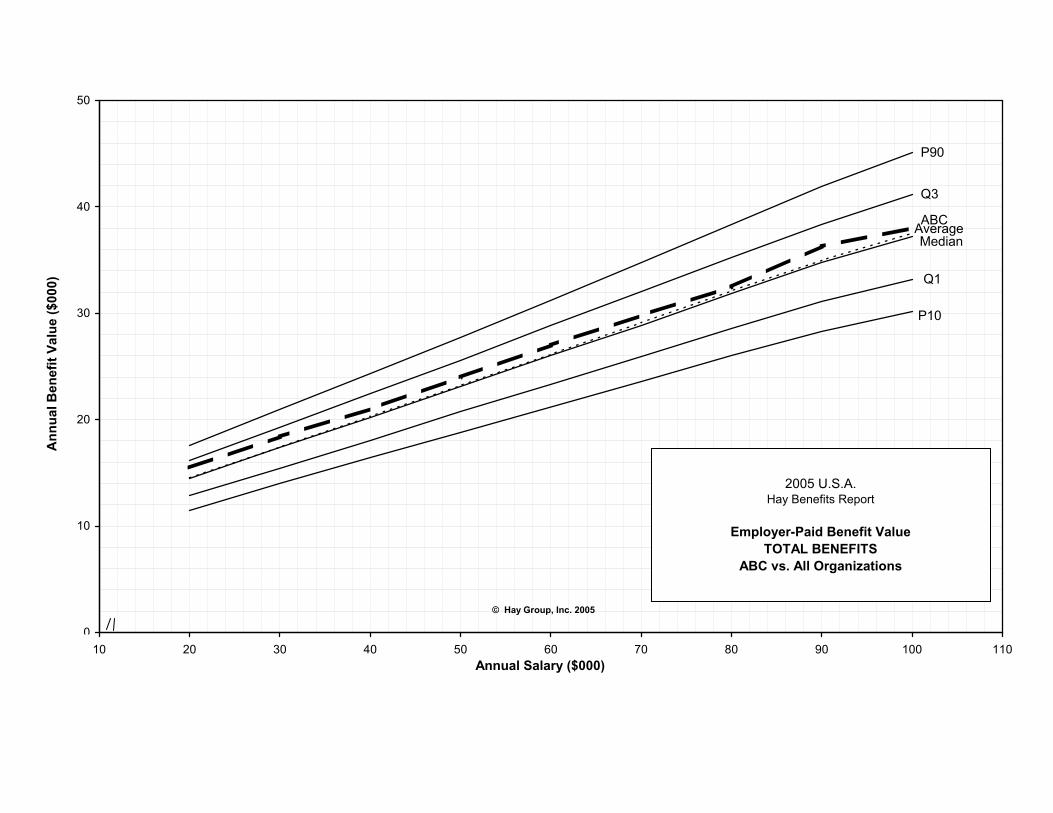
• Employer-Paid Benefit Value Charts--show salary equivalent values for the employer-paid portion of the benefits program. Charts are provided for individual benefits programs, as well as total benefits programs.
• Total Benefit Design Value Charts--display salary equivalent values for the total benefit program independent of contribution arrangements.
In addition to this volume, the following three volumes are available: Prevalence of Benefits Practices (Volume I). This volume is a comprehensive report detailing the benefits practices of the 1,003 organizations in this year's survey. Sections include:
• Benefits Cost; • Executive Benefits and Perquisites; • Group Life Coverages; • Sickness and Disability Benefits; • Health Care Plans; • Defined Benefit Pension Plans; • Capital Accumulation Plans; • Holiday and Vacation Policies; • Flexible Benefits; • Personnel Policies and Trends.
An Executive Summary is also published along with the 2004 HBR. This summary provides significant findings from the given sections, as well as timely and important information about employee benefits. Comparisons of Benefits Value (Volume II). This volume provides a quantitative summary of the 1,003 participants in the HBR. It includes charts presenting employer-paid and total benefit design values, pension benefit comparison charts, and survivor benefit comparison charts. Client values are provided for comparison with all data presented.
1
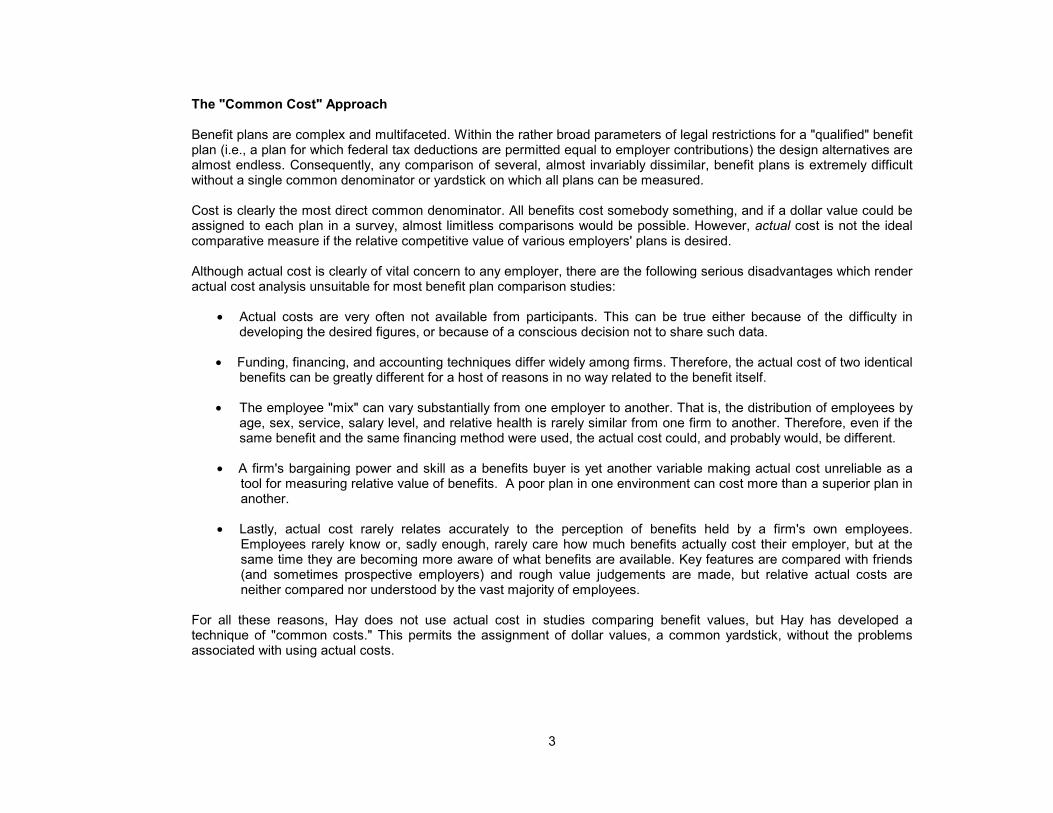
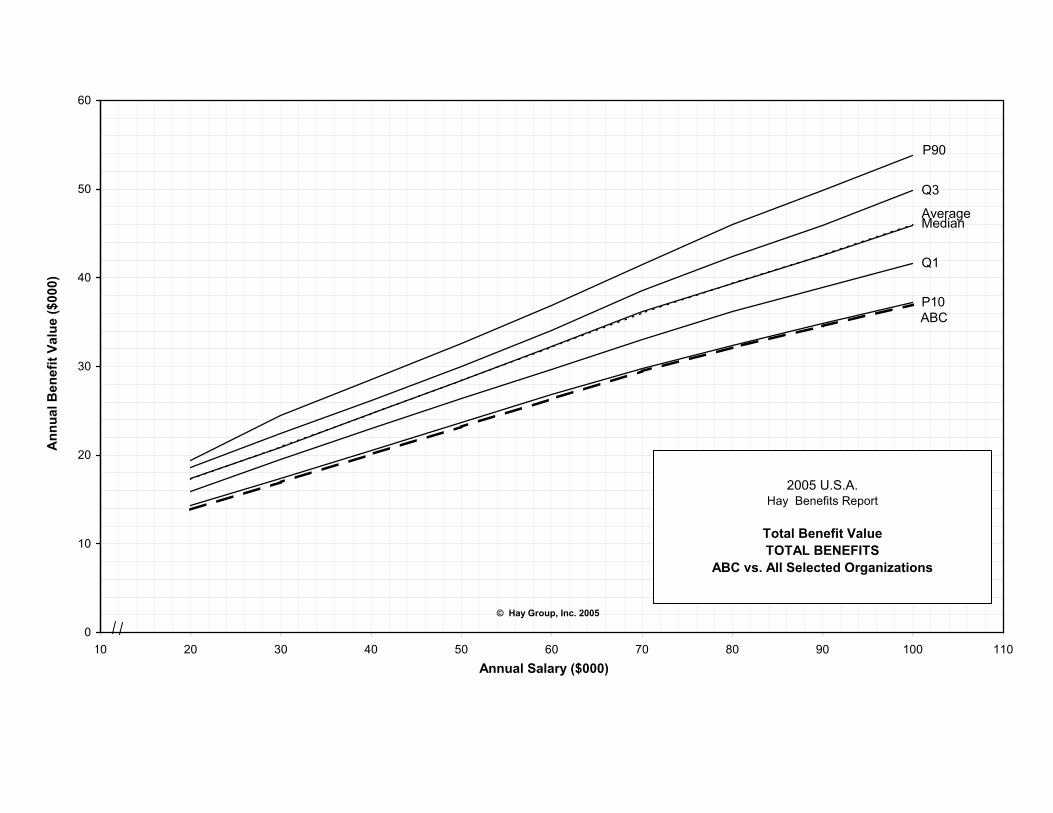
Explanation and Use The general "Hay cash equivalent model" is a sophisticated actuarial model which measures benefit value by taking into account all the significant elements of plan design and coverage levels. With this approach, the cash equivalent value attributed to each benefit is based on these plan design elements as well as standard actuarial assumptions, rather than the actual dollar amount paid to provide the benefits. By using these assumptions rather than actual cost, comparisons of a wide range of plans can be made that focus on the value of plan design without the introduction of a bias founded on company buying-power, size, location, or demographic profile. The chart lines show the range of practices in the group for specified compensation levels. In addition to 90th and 10th percentiles, average, and median, each chart displays first quartile (Q1) and third quartile (Q3) results which separate the lowest 25% and highest 25% from the middle 50% of practices. It should be noted that the salary levels shown represent compensation credited for coverage under earnings-related benefits and are not necessarily either base salary or total cash (base plus bonus). Essentially, all participants are treated equally in terms of pay levels, so that a pure comparison of benefits value is achieved. Determination of Benefit Values For benefits which are conditional on an event such as death, disability, survival, or continuous employment, cash equivalent values are calculated on the basis of the timing and probability of the event, using a representative employee population and appropriate assumptions as to duration of payment, administrative costs, and investment return (whichever may be applicable). For benefits which do not depend on an intervening event, the cash equivalent values have been determined on a replacement-cost basis. For plans offering optional amounts of coverage, it is assumed that all employees participate and choose the highest amount of coverage available. For flexible benefit plans, the most common or typical plan is valued. All group insurance, sick leave, and retirement benefits are valued, as are capital accumulation plans (e.g., average employer contributions), holiday and vacation schedules, and company subsidized cafeterias. Values for the employer-paid portion of Social Security benefits, workers' compensation, and unemployment insurance are also included. Executive perquisites are not valued, although they can be upon request.
2
The "Common Cost" Approach Benefit plans are complex and multifaceted. Within the rather broad parameters of legal restrictions for a "qualified" benefit plan (i.e., a plan for which federal tax deductions are permitted equal to employer contributions) the design alternatives are almost endless. Consequently, any comparison of several, almost invariably dissimilar, benefit plans is extremely difficult without a single common denominator or yardstick on which all plans can be measured. Cost is clearly the most direct common denominator. All benefits cost somebody something, and if a dollar value could be assigned to each plan in a survey, almost limitless comparisons would be possible. However, actual cost is not the ideal comparative measure if the relative competitive value of various employers' plans is desired. Although actual cost is clearly of vital concern to any employer, there are the following serious disadvantages which render actual cost analysis unsuitable for most benefit plan comparison studies:
• Actual costs are very often not available from participants. This can be true either because of the difficulty in developing the desired figures, or because of a conscious decision not to share such data.
• Funding, financing, and accounting techniques differ widely among firms. Therefore, the actual cost of two identical benefits can be greatly different for a host of reasons in no way related to the benefit itself.
• The employee "mix" can vary substantially from one employer to another. That is, the distribution of employees by age, sex, service, salary level, and relative health is rarely similar from one firm to another. Therefore, even if the same benefit and the same financing method were used, the actual cost could, and probably would, be different.
• A firm's bargaining power and skill as a benefits buyer is yet another variable making actual cost unreliable as a tool for measuring relative value of benefits. A poor plan in one environment can cost more than a superior plan in another.
• Lastly, actual cost rarely relates accurately to the perception of benefits held by a firm's own employees.
Employees rarely know or, sadly enough, rarely care how much benefits actually cost their employer, but at the same time they are becoming more aware of what benefits are available. Key features are compared with friends (and sometimes prospective employers) and rough value judgements are made, but relative actual costs are neither compared nor understood by the vast majority of employees.
For all these reasons, Hay does not use actual cost in studies comparing benefit values, but Hay has developed a technique of "common costs." This permits the assignment of dollar values, a common yardstick, without the problems associated with using actual costs.
3
The key to the Hay "common cost" approach is the use of a single, realistic method for all plans being valued. All plans in the study are, in effect, "purchased" for the same group of employees from the same source using the same financing technique. The "employees" used are a typical mix of employees as might be found in a large industrial environment. The "providers" are a hypothetical group of insurance companies and/or trustees who are "selling" coverage using the same average group rates, actuarial assumptions, and experience ratings for all the plans in the study. The result is an actuarial derived "common cost" for each plan, expressed as a dollar value. As an example of this approach, assume two employers have life insurance plans which provide a single death benefit and no other features. At a salary level of $20,000 per year, the comparison could be as follows:
Death Benefit Employer Formula Amount Actual Cost Per Month A 1 x Pay $20,000 50¢ per $1,000 of Benefit B 2 x Pay $40,000 25¢ per $1,000 of Benefit On an actual cost basis and a "common cost" basis (using a rate of 37.5¢ per month per $1,000), the comparison would be: Employer Actual Cost/Year Common Cost/Year A $120.00 (50¢ x 20 x 12) $ 90.00 (37.5¢ x 20 x 12) B $120.00 (25¢ x 40 x 12) $180.00 (37.5¢ x 40 x 12) Clearly, the actual cost distorts the relative value of the two plans showing them to be the same, whereas the "common cost" technique shows plan B to be "twice as good" as plan A--which it is, on the basis of either benefit level provided or perceived value to covered employees. Although this example is oversimplified and most plans involve many complex calculation steps, it does describe the "common cost" method of value comparison. Effect of Employee Contributions On a perceived basis to employees, plans which are contributory have a lesser value than those which are provided entirely at employer expense. For this reason, Hay has chosen to present all its "common cost" comparisons in two ways whenever a benefit plan area involves employee contributions on the part of at least some of the participants in a survey.
4
In these instances, one set of comparisons is made on a "total value" basis where the existence of employee contributions is totally ignored. These provide a pure look at comparative design, but not at financing or, probably, perceived value. The other set of comparisons is made on an "employer-provided" basis where the total value of any plan is discounted to reflect the relationship of required employee contributions to total cost. For fully employee-paid plans, the discount is 90% (some value remains due to group purchasing power, the absence of any requirement for a physical, and similar things). For a fully employer-paid plan, there is no discount; and for cost shared plans, a proration is applied. Effect of Employee Salaries on Values For salaried employees, most benefit plans are indexed by salary (e.g., a 1 x salary life insurance benefit). This is true because the intent of the benefit is to replace some desired portion of the employee's income, or standard of living, in the event of death, disability, or retirement. For this reason, Hay feels it is not sufficient to compare benefits at a single earnings level, even if such level represents a weighted average salary for the firm. A quick example, using two hypothetical life insurance plans, illustrates this point.
Actual Benefit at Salary of: Employer Benefit Formula $20,000 $40,000 A 1 x Salary $20,000 $40,000 B Flat $20,000 $20,000 $20,000 Were a comparison made at only the $20,000 salary level, these two plans would appear equal, which they are at that level. However, a comparison at both salary levels quickly reveals the comparative weakness in the design of plan B relative to the self-adjusting formula of plan A. This difference is, of course, obvious in this oversimplified example. In more complex, integrated plans, such differences are often not so obvious, but can be equally critical from the standpoint of internal equity. For those plans where salary is not an issue, like medical or dental, single values are used. However, for any benefit plan where salary-related coverage exists, the Hay methodology will display relative value at multiple salary levels to provide a comparison of both external competitiveness and internal equity.
5
Participant List
6
Amerada Hess
Butler Manufacturing
Caxton Associates, LLC Cingular Wireless
Erie Insurance Group
Huntington Bancshares
Kellogg USA, Inc.
Saks, Inc.
Susquehanna Bancshares, Inc.
Toll Brothers, Inc.
P90
Q3
MedianAverage
Q1
P10
ABC
0
10
20
30
40
50
10 20 30 40 50 60 70 80 90 100 110Annual Salary ($000)
Ann
ual B
enef
it Va
lue
($00
0)
2005 U.S.A. Hay Benefits Report
Employer-Paid Benefit ValueTOTAL BENEFITS
ABC vs. All Organizations
© Hay Group, Inc. 2005
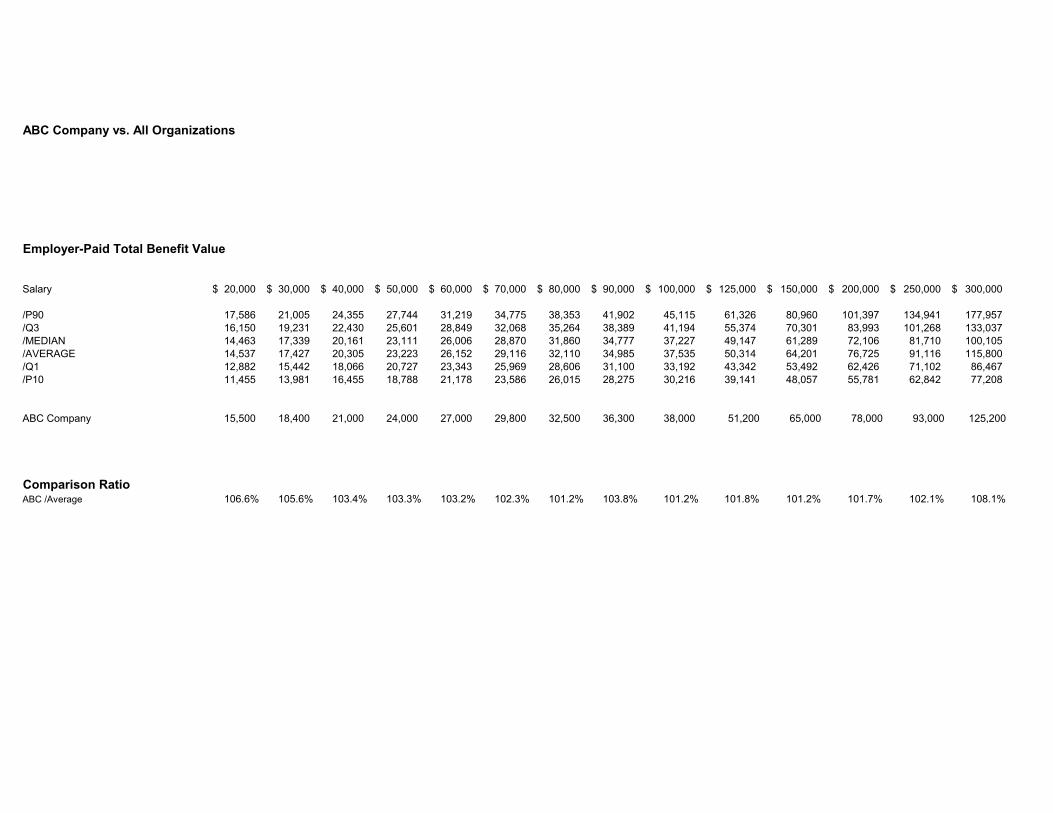
ABC Company vs. All Organizations
Employer-Paid Total Benefit Value
Salary 20,000$ 30,000$ 40,000$ 50,000$ 60,000$ 70,000$ 80,000$ 90,000$ 100,000$ 125,000$ 150,000$ 200,000$ 250,000$ 300,000$
/P90 17,586 21,005 24,355 27,744 31,219 34,775 38,353 41,902 45,115 61,326 80,960 101,397 134,941 177,957 /Q3 16,150 19,231 22,430 25,601 28,849 32,068 35,264 38,389 41,194 55,374 70,301 83,993 101,268 133,037 /MEDIAN 14,463 17,339 20,161 23,111 26,006 28,870 31,860 34,777 37,227 49,147 61,289 72,106 81,710 100,105 /AVERAGE 14,537 17,427 20,305 23,223 26,152 29,116 32,110 34,985 37,535 50,314 64,201 76,725 91,116 115,800 /Q1 12,882 15,442 18,066 20,727 23,343 25,969 28,606 31,100 33,192 43,342 53,492 62,426 71,102 86,467 /P10 11,455 13,981 16,455 18,788 21,178 23,586 26,015 28,275 30,216 39,141 48,057 55,781 62,842 77,208
ABC Company 15,500 18,400 21,000 24,000 27,000 29,800 32,500 36,300 38,000 51,200 65,000 78,000 93,000 125,200
Comparison RatioABC /Average 106.6% 105.6% 103.4% 103.3% 103.2% 102.3% 101.2% 103.8% 101.2% 101.8% 101.2% 101.7% 102.1% 108.1%

P90
Q3
MedianAverage
Q1
P10
ABC
0
10
20
30
40
50
60
70
10 20 30 40 50 60 70 80 90 100 110Annual Salary ($000)
Ann
ual B
enef
it Va
lue
($00
0)
2005 U.S.A. Hay Benefits Report
Total Benefit ValueTOTAL BENEFITS
ABC vs. All Organizations
© Hay Group, Inc. 2005
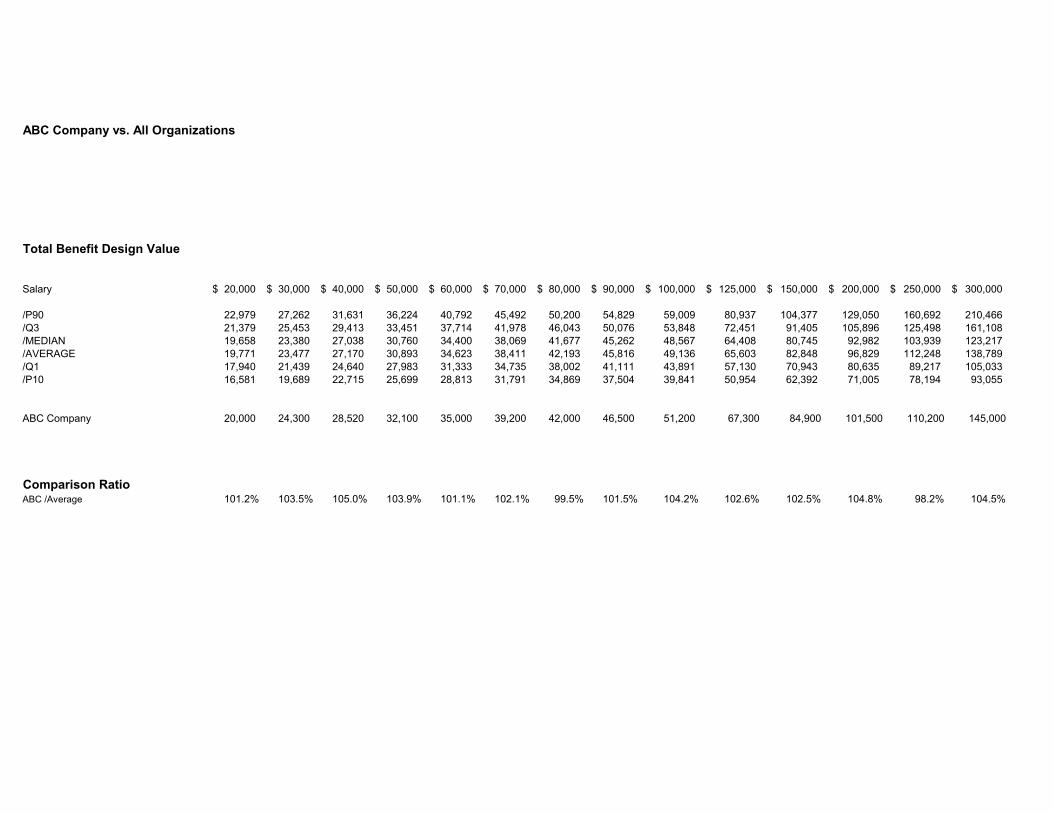
ABC Company vs. All Organizations
Total Benefit Design Value
Salary 20,000$ 30,000$ 40,000$ 50,000$ 60,000$ 70,000$ 80,000$ 90,000$ 100,000$ 125,000$ 150,000$ 200,000$ 250,000$ 300,000$
/P90 22,979 27,262 31,631 36,224 40,792 45,492 50,200 54,829 59,009 80,937 104,377 129,050 160,692 210,466 /Q3 21,379 25,453 29,413 33,451 37,714 41,978 46,043 50,076 53,848 72,451 91,405 105,896 125,498 161,108 /MEDIAN 19,658 23,380 27,038 30,760 34,400 38,069 41,677 45,262 48,567 64,408 80,745 92,982 103,939 123,217 /AVERAGE 19,771 23,477 27,170 30,893 34,623 38,411 42,193 45,816 49,136 65,603 82,848 96,829 112,248 138,789 /Q1 17,940 21,439 24,640 27,983 31,333 34,735 38,002 41,111 43,891 57,130 70,943 80,635 89,217 105,033 /P10 16,581 19,689 22,715 25,699 28,813 31,791 34,869 37,504 39,841 50,954 62,392 71,005 78,194 93,055
ABC Company 20,000 24,300 28,520 32,100 35,000 39,200 42,000 46,500 51,200 67,300 84,900 101,500 110,200 145,000
Comparison RatioABC /Average 101.2% 103.5% 105.0% 103.9% 101.1% 102.1% 99.5% 101.5% 104.2% 102.6% 102.5% 104.8% 98.2% 104.5%
II. Total Benefits Comparison
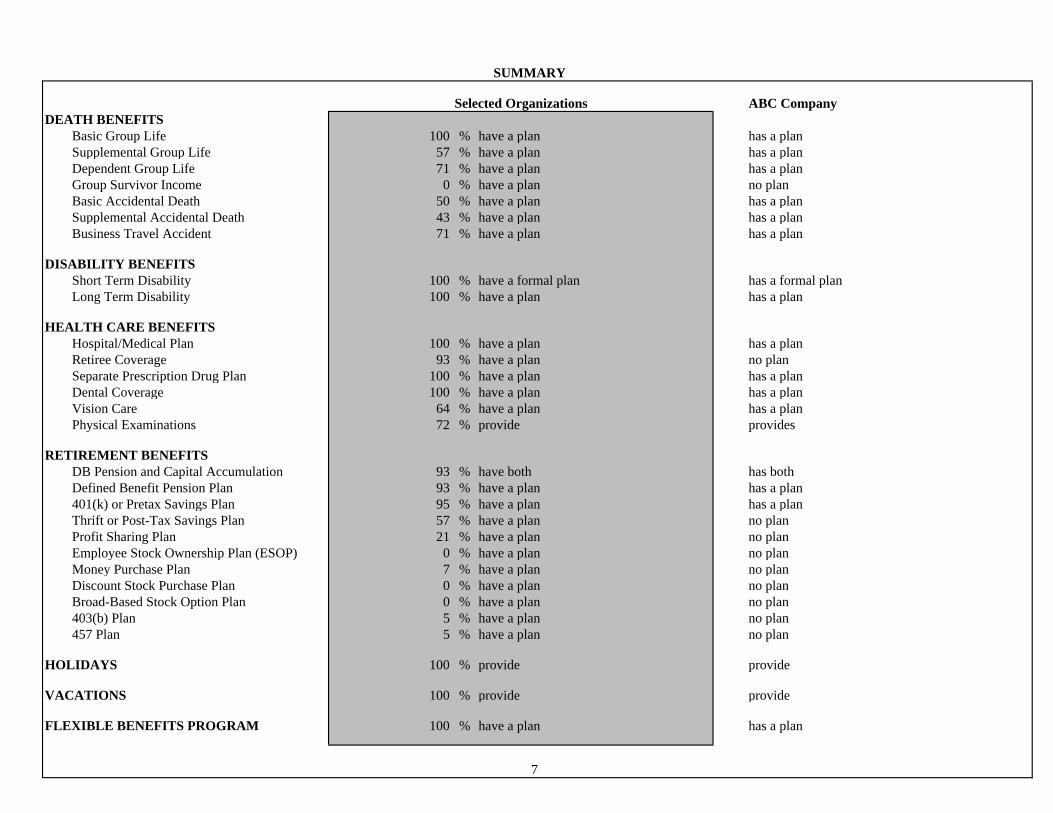
SUMMARY
Selected Organizations ABC Company
DEATH BENEFITS Basic Group Life 100 % have a plan has a plan Supplemental Group Life 57 % have a plan has a plan Dependent Group Life 71 % have a plan has a plan Group Survivor Income 0 % have a plan no plan Basic Accidental Death 50 % have a plan has a plan Supplemental Accidental Death 43 % have a plan has a plan Business Travel Accident 71 % have a plan has a plan DISABILITY BENEFITS Short Term Disability 100 % have a formal plan has a formal plan Long Term Disability 100 % have a plan has a plan
HEALTH CARE BENEFITS Hospital/Medical Plan 100 % have a plan has a plan Retiree Coverage 93 % have a plan no plan Separate Prescription Drug Plan 100 % have a plan has a plan Dental Coverage 100 % have a plan has a plan Vision Care 64 % have a plan has a plan Physical Examinations 72 % provide provides
RETIREMENT BENEFITS DB Pension and Capital Accumulation 93 % have both has both Defined Benefit Pension Plan 93 % have a plan has a plan 401(k) or Pretax Savings Plan 95 % have a plan has a plan Thrift or Post-Tax Savings Plan 57 % have a plan no plan Profit Sharing Plan 21 % have a plan no plan Employee Stock Ownership Plan (ESOP) 0 % have a plan no plan Money Purchase Plan 7 % have a plan no plan Discount Stock Purchase Plan 0 % have a plan no plan Broad-Based Stock Option Plan 0 % have a plan no plan 403(b) Plan 5 % have a plan no plan 457 Plan 5 % have a plan no plan
HOLIDAYS 100 % provide provide
VACATIONS 100 % provide provide
FLEXIBLE BENEFITS PROGRAM 100 % have a plan has a plan
7
P90
Q3
MedianAverage
Q1
P10ABC
0
10
20
30
40
50
60
10 20 30 40 50 60 70 80 90 100 110Annual Salary ($000)
Ann
ual B
enef
it Va
lue
($00
0)
2005 U.S.A. Hay Benefits Report
Total Benefit ValueTOTAL BENEFITS
ABC vs. All Selected Organizations
© Hay Group, Inc. 2005
ABC Company vs. All Selected Organizations
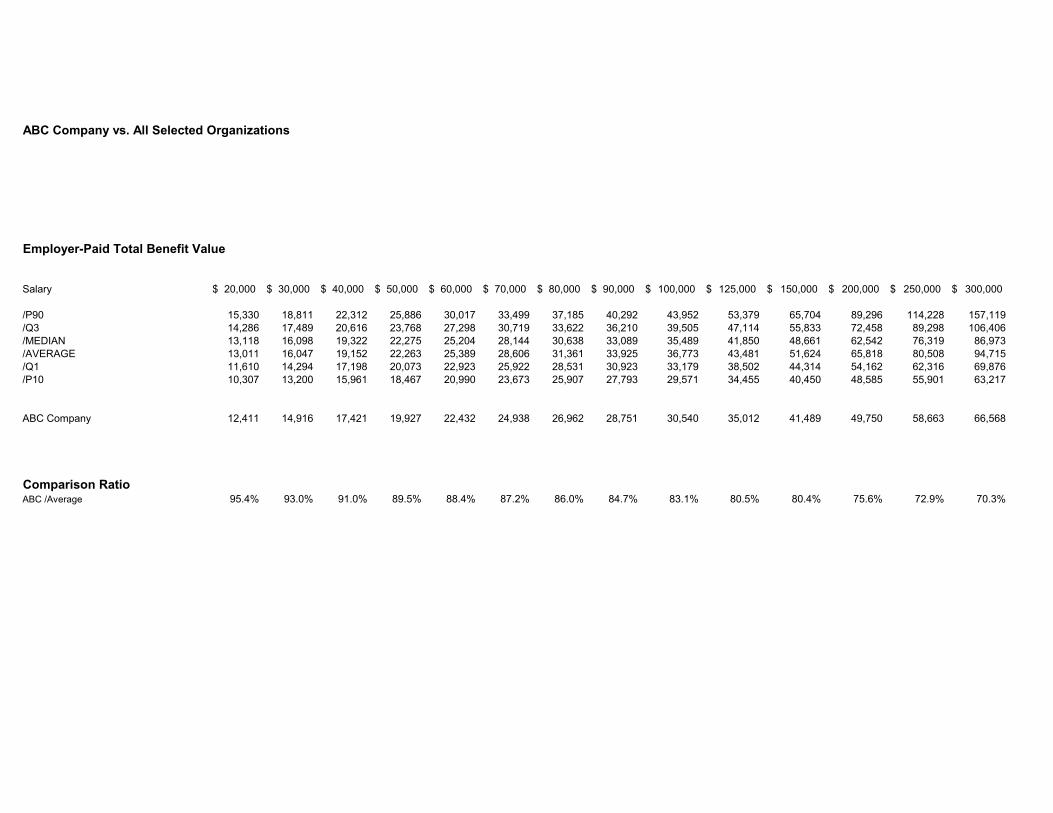
Employer-Paid Total Benefit Value
Salary 20,000$ 30,000$ 40,000$ 50,000$ 60,000$ 70,000$ 80,000$ 90,000$ 100,000$ 125,000$ 150,000$ 200,000$ 250,000$ 300,000$
/P90 15,330 18,811 22,312 25,886 30,017 33,499 37,185 40,292 43,952 53,379 65,704 89,296 114,228 157,119/Q3 14,286 17,489 20,616 23,768 27,298 30,719 33,622 36,210 39,505 47,114 55,833 72,458 89,298 106,406/MEDIAN 13,118 16,098 19,322 22,275 25,204 28,144 30,638 33,089 35,489 41,850 48,661 62,542 76,319 86,973/AVERAGE 13,011 16,047 19,152 22,263 25,389 28,606 31,361 33,925 36,773 43,481 51,624 65,818 80,508 94,715/Q1 11,610 14,294 17,198 20,073 22,923 25,922 28,531 30,923 33,179 38,502 44,314 54,162 62,316 69,876/P10 10,307 13,200 15,961 18,467 20,990 23,673 25,907 27,793 29,571 34,455 40,450 48,585 55,901 63,217
ABC Company 12,411 14,916 17,421 19,927 22,432 24,938 26,962 28,751 30,540 35,012 41,489 49,750 58,663 66,568
Comparison RatioABC /Average 95.4% 93.0% 91.0% 89.5% 88.4% 87.2% 86.0% 84.7% 83.1% 80.5% 80.4% 75.6% 72.9% 70.3%

P90
Q3
MedianAverage
Q1
P10ABC
0
10
20
30
40
50
60
10 20 30 40 50 60 70 80 90 100 110Annual Salary ($000)
Ann
ual B
enef
it Va
lue
($00
0)
2005 U.S.A. Hay Benefits Report
Total Benefit ValueTOTAL BENEFITS
ABC vs. All Selected Organizations
© Hay Group, Inc. 2005

ABC Company vs. All Selected Organizations
Total Benefit Design Total
Salary 20,000$ 30,000$ 40,000$ 50,000$ 60,000$ 70,000$ 80,000$ 90,000$ 100,000$ 125,000$ 150,000$ 200,000$ 250,000$ 300,000$
/P90 19,450 24,475 28,536 32,597 36,901 41,524 46,065 49,855 53,789 63,511 84,865 108,084 139,114 178,988/Q3 18,608 22,414 26,214 30,043 34,095 38,609 42,363 45,865 49,881 58,842 69,322 85,324 103,366 121,402/MEDIAN 17,334 20,810 24,711 28,472 32,280 36,173 39,369 42,461 45,965 54,227 62,322 75,564 89,741 100,273/AVERAGE 17,286 20,947 24,668 28,430 32,181 36,016 39,388 42,567 46,028 54,250 63,772 79,406 95,153 110,293/Q1 15,958 19,484 22,999 26,411 29,611 33,087 36,183 38,922 41,678 48,437 54,850 66,483 76,801 84,232/P10 14,304 17,428 20,563 23,701 26,839 29,723 32,365 34,848 37,239 43,216 50,067 61,214 68,430 75,849
ABC Company 13,853 16,958 20,084 23,213 26,342 29,470 32,128 34,556 36,984 43,054 50,116 58,934 67,847 75,752
Comparison RatioABC /Average 80.1% 81.0% 81.4% 81.6% 81.9% 81.8% 81.6% 81.2% 80.4% 79.4% 78.6% 74.2% 71.3% 68.7%
III. Individual Benefits Areas Comparisons
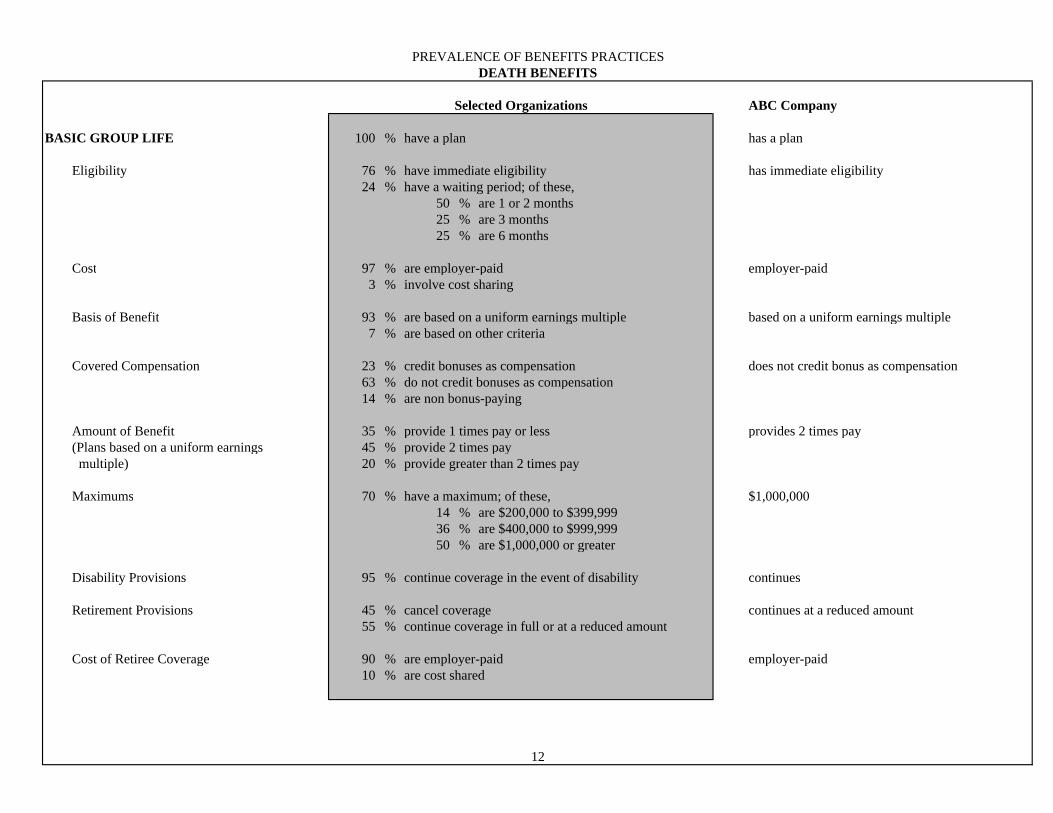
PREVALENCE OF BENEFITS PRACTICESDEATH BENEFITS
Selected Organizations ABC Company
BASIC GROUP LIFE 100 % have a plan has a plan
Eligibility 76 % have immediate eligibility has immediate eligibility24 % have a waiting period; of these,
50 % are 1 or 2 months25 % are 3 months25 % are 6 months
Cost 97 % are employer-paid employer-paid
3 % involve cost sharing Basis of Benefit 93 % are based on a uniform earnings multiple based on a uniform earnings multiple
7 % are based on other criteria
Covered Compensation 23 % credit bonuses as compensation does not credit bonus as compensation63 % do not credit bonuses as compensation14 % are non bonus-paying
Amount of Benefit 35 % provide 1 times pay or less provides 2 times pay (Plans based on a uniform earnings 45 % provide 2 times pay multiple) 20 % provide greater than 2 times pay Maximums 70 % have a maximum; of these, $1,000,000
14 % are $200,000 to $399,999 36 % are $400,000 to $999,99950 % are $1,000,000 or greater
Disability Provisions 95 % continue coverage in the event of disability continues
Retirement Provisions 45 % cancel coverage continues at a reduced amount 55 % continue coverage in full or at a reduced amount
Cost of Retiree Coverage 90 % are employer-paid employer-paid10 % are cost shared
12
PREVALENCE OF BENEFITS PRACTICESDEATH BENEFITS
Selected Organizations ABC Company
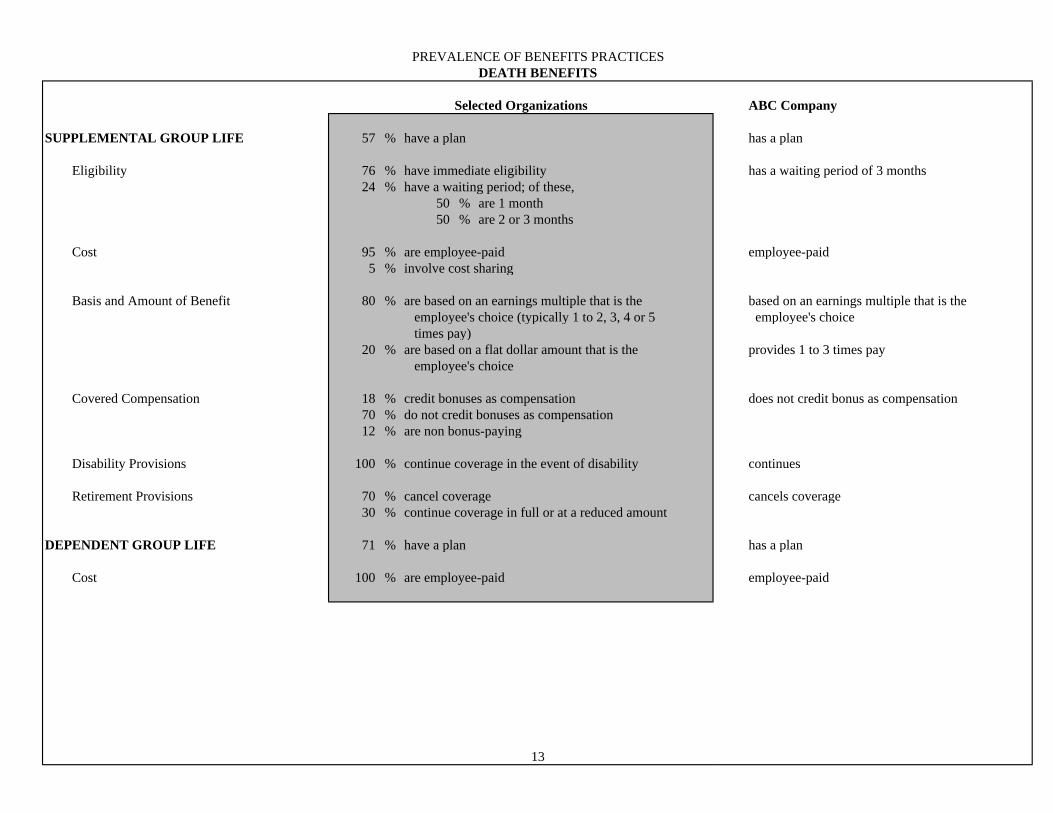
SUPPLEMENTAL GROUP LIFE 57 % have a plan has a plan Eligibility 76 % have immediate eligibility has a waiting period of 3 months
24 % have a waiting period; of these, 50 % are 1 month50 % are 2 or 3 months
Cost 95 % are employee-paid employee-paid5 % involve cost sharing
Basis and Amount of Benefit 80 % are based on an earnings multiple that is the based on an earnings multiple that is the employee's choice (typically 1 to 2, 3, 4 or 5 employee's choice times pay) 20 % are based on a flat dollar amount that is the provides 1 to 3 times pay employee's choice
Covered Compensation 18 % credit bonuses as compensation does not credit bonus as compensation70 % do not credit bonuses as compensation12 % are non bonus-paying
Disability Provisions 100 % continue coverage in the event of disability continues
Retirement Provisions 70 % cancel coverage cancels coverage30 % continue coverage in full or at a reduced amount
DEPENDENT GROUP LIFE 71 % have a plan has a plan Cost 100 % are employee-paid employee-paid
13
PREVALENCE OF BENEFITS PRACTICESDEATH BENEFITS
Selected Organizations ABC Company
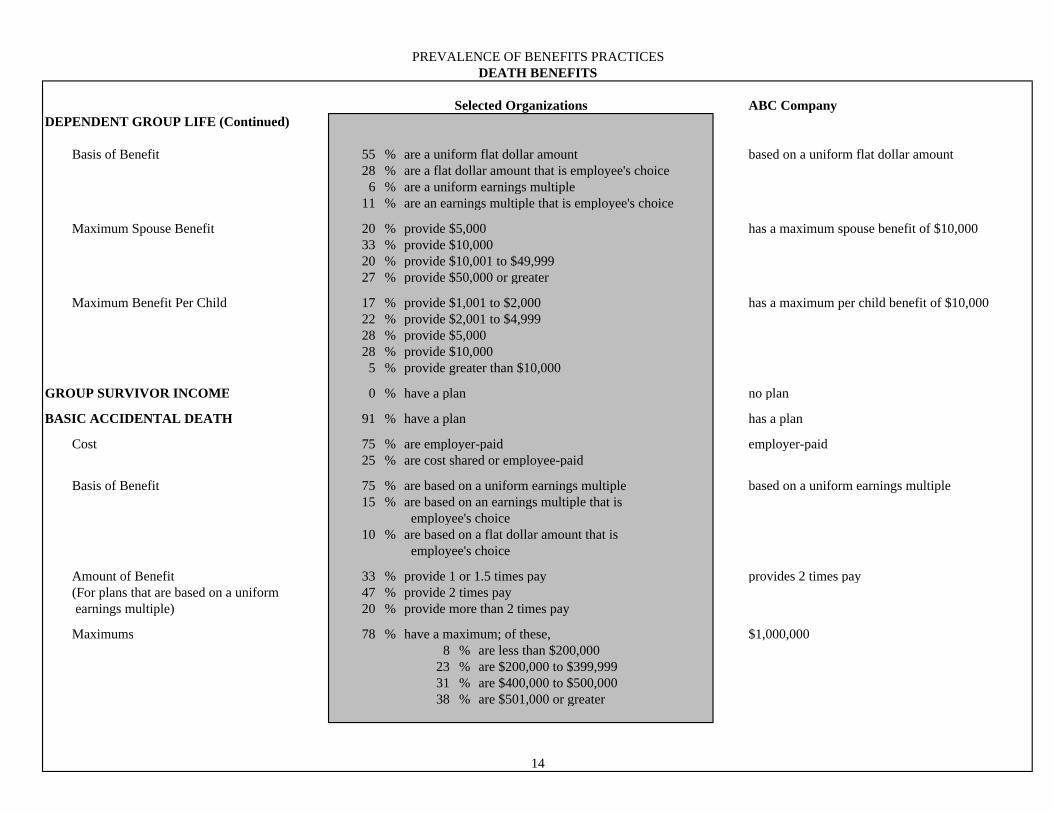
DEPENDENT GROUP LIFE (Continued)
Basis of Benefit 55 % are a uniform flat dollar amount based on a uniform flat dollar amount 28 % are a flat dollar amount that is employee's choice
6 % are a uniform earnings multiple11 % are an earnings multiple that is employee's choice
Maximum Spouse Benefit 20 % provide $5,000 has a maximum spouse benefit of $10,00033 % provide $10,000
20 % provide $10,001 to $49,99927 % provide $50,000 or greater
Maximum Benefit Per Child 17 % provide $1,001 to $2,000 has a maximum per child benefit of $10,00022 % provide $2,001 to $4,999
28 % provide $5,00028 % provide $10,000
5 % provide greater than $10,000
GROUP SURVIVOR INCOME 0 % have a plan no plan
BASIC ACCIDENTAL DEATH 91 % have a plan has a plan Cost 75 % are employer-paid employer-paid
25 % are cost shared or employee-paid Basis of Benefit 75 % are based on a uniform earnings multiple based on a uniform earnings multiple 15 % are based on an earnings multiple that is
employee's choice 10 % are based on a flat dollar amount that is
employee's choice
Amount of Benefit 33 % provide 1 or 1.5 times pay provides 2 times pay (For plans that are based on a uniform 47 % provide 2 times pay earnings multiple) 20 % provide more than 2 times pay
Maximums 78 % have a maximum; of these, $1,000,0008 % are less than $200,000
23 % are $200,000 to $399,99931 % are $400,000 to $500,00038 % are $501,000 or greater
14
PREVALENCE OF BENEFITS PRACTICESDEATH BENEFITS
Selected Organizations ABC Company
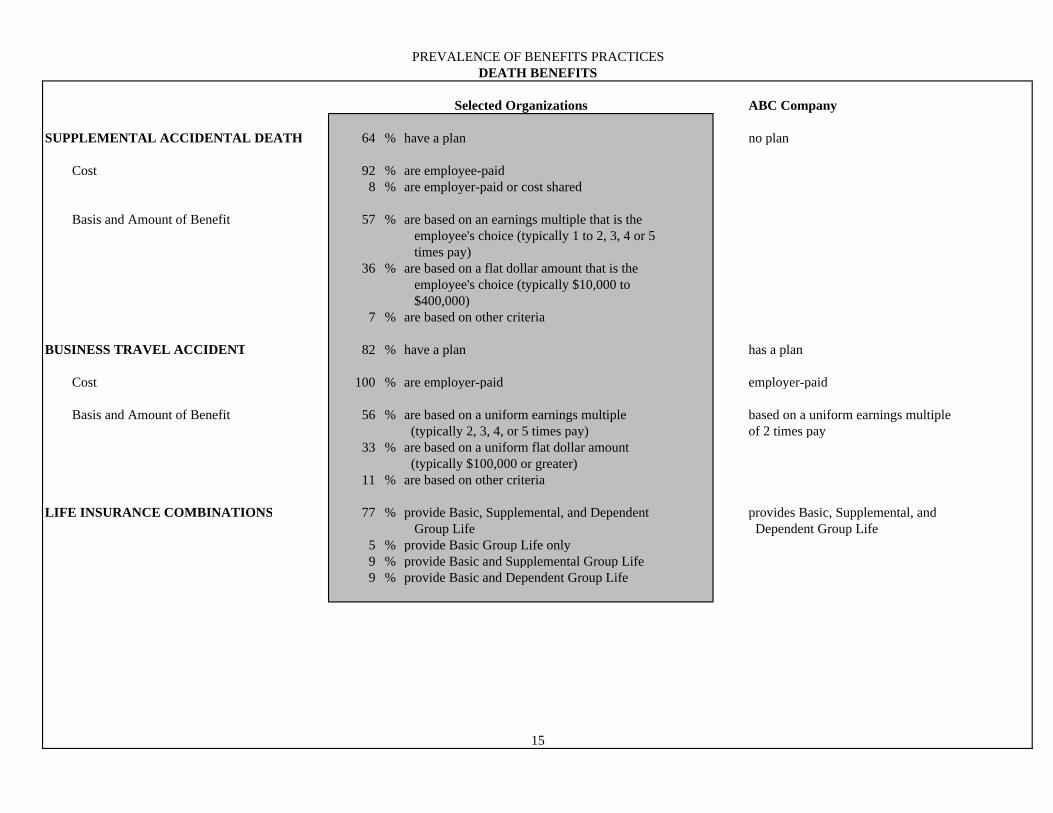
SUPPLEMENTAL ACCIDENTAL DEATH 64 % have a plan no plan Cost 92 % are employee-paid 8 % are employer-paid or cost shared
Basis and Amount of Benefit 57 % are based on an earnings multiple that is the employee's choice (typically 1 to 2, 3, 4 or 5 times pay)
36 % are based on a flat dollar amount that is the employee's choice (typically $10,000 to $400,000)
7 % are based on other criteria BUSINESS TRAVEL ACCIDENT 82 % have a plan has a plan
Cost 100 % are employer-paid employer-paid Basis and Amount of Benefit 56 % are based on a uniform earnings multiple based on a uniform earnings multiple
(typically 2, 3, 4, or 5 times pay) of 2 times pay33 % are based on a uniform flat dollar amount
(typically $100,000 or greater)11 % are based on other criteria
LIFE INSURANCE COMBINATIONS 77 % provide Basic, Supplemental, and Dependent provides Basic, Supplemental, and Group Life Dependent Group Life
5 % provide Basic Group Life only9 % provide Basic and Supplemental Group Life9 % provide Basic and Dependent Group Life
15
PREVALENCE OF BENEFITS PRACTICESDEATH BENEFITS
Selected Organizations ABC Company
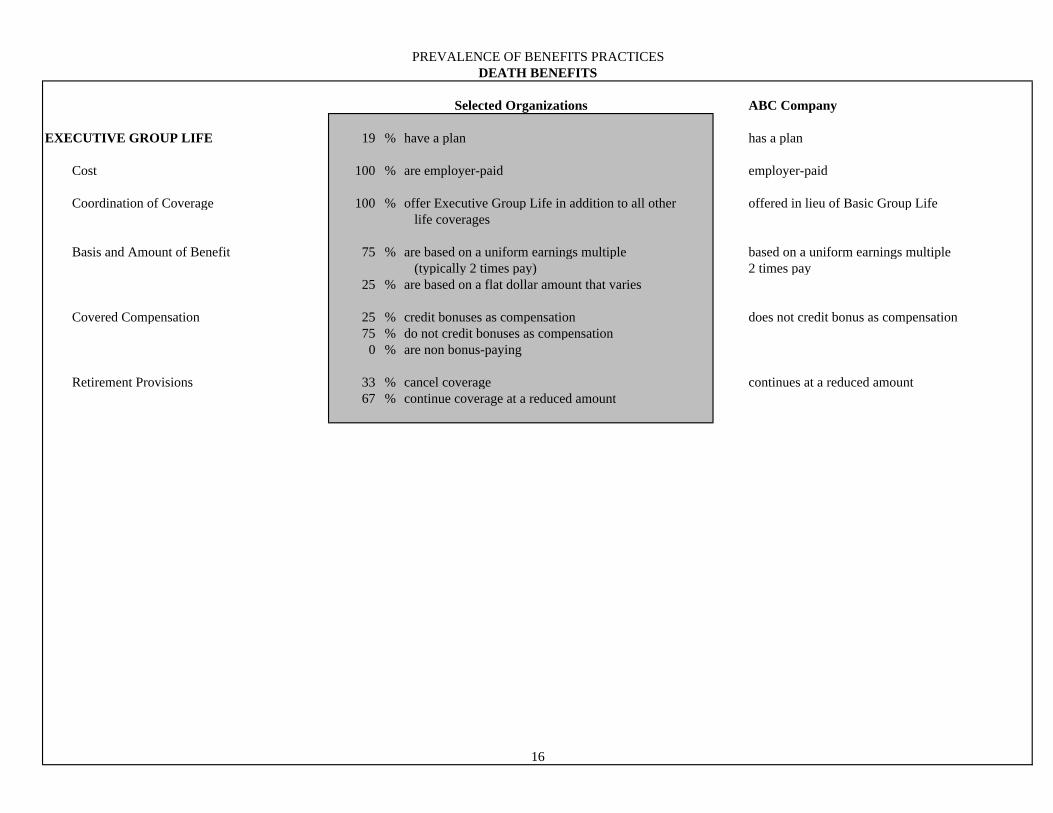
EXECUTIVE GROUP LIFE 19 % have a plan has a plan
Cost 100 % are employer-paid employer-paid
Coordination of Coverage 100 % offer Executive Group Life in addition to all other offered in lieu of Basic Group Life life coverages
Basis and Amount of Benefit 75 % are based on a uniform earnings multiple based on a uniform earnings multiple (typically 2 times pay) 2 times pay
25 % are based on a flat dollar amount that varies
Covered Compensation 25 % credit bonuses as compensation does not credit bonus as compensation75 % do not credit bonuses as compensation
0 % are non bonus-paying
Retirement Provisions 33 % cancel coverage continues at a reduced amount67 % continue coverage at a reduced amount
16
P90
Q3
Median
Average
Q1
P10
ABC
0
1
2
3
4
5
6
7
8
9
10
11
12
13
10 20 30 40 50 60 70 80 90 100 110Annual Salary ($000)
Ann
ual B
enef
it Va
lue
($00
)
2005 U.S.A. Hay Benefits Report
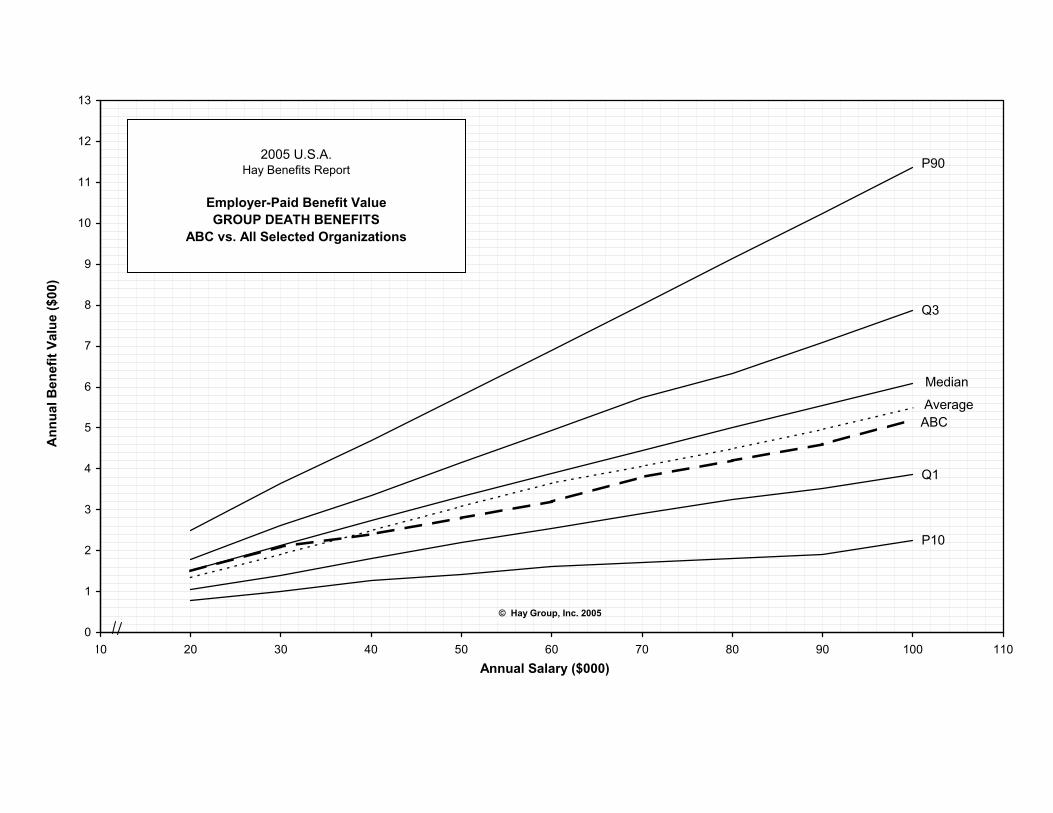
Employer-Paid Benefit ValueGROUP DEATH BENEFITS
ABC vs. All Selected Organizations
© Hay Group, Inc. 2005
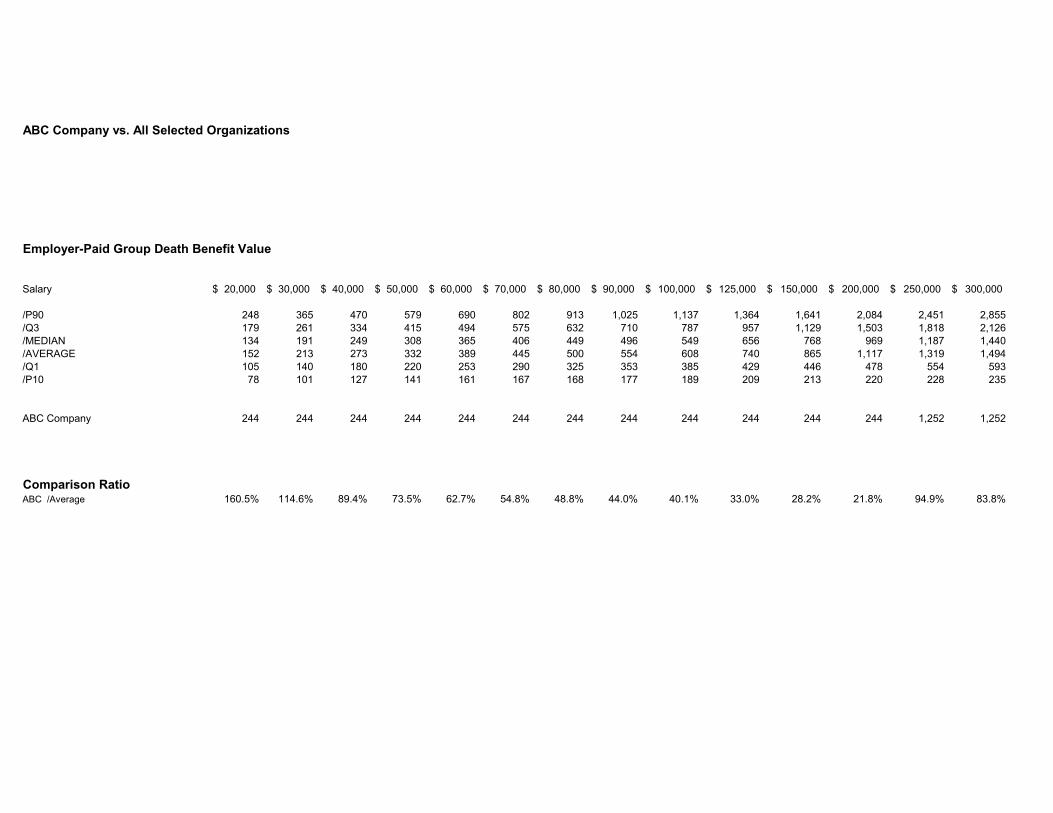
ABC Company vs. All Selected Organizations
Employer-Paid Group Death Benefit Value
Salary 20,000$ 30,000$ 40,000$ 50,000$ 60,000$ 70,000$ 80,000$ 90,000$ 100,000$ 125,000$ 150,000$ 200,000$ 250,000$ 300,000$
/P90 248 365 470 579 690 802 913 1,025 1,137 1,364 1,641 2,084 2,451 2,855/Q3 179 261 334 415 494 575 632 710 787 957 1,129 1,503 1,818 2,126/MEDIAN 134 191 249 308 365 406 449 496 549 656 768 969 1,187 1,440/AVERAGE 152 213 273 332 389 445 500 554 608 740 865 1,117 1,319 1,494/Q1 105 140 180 220 253 290 325 353 385 429 446 478 554 593/P10 78 101 127 141 161 167 168 177 189 209 213 220 228 235
ABC Company 244 244 244 244 244 244 244 244 244 244 244 244 1,252 1,252
Comparison RatioABC /Average 160.5% 114.6% 89.4% 73.5% 62.7% 54.8% 48.8% 44.0% 40.1% 33.0% 28.2% 21.8% 94.9% 83.8%
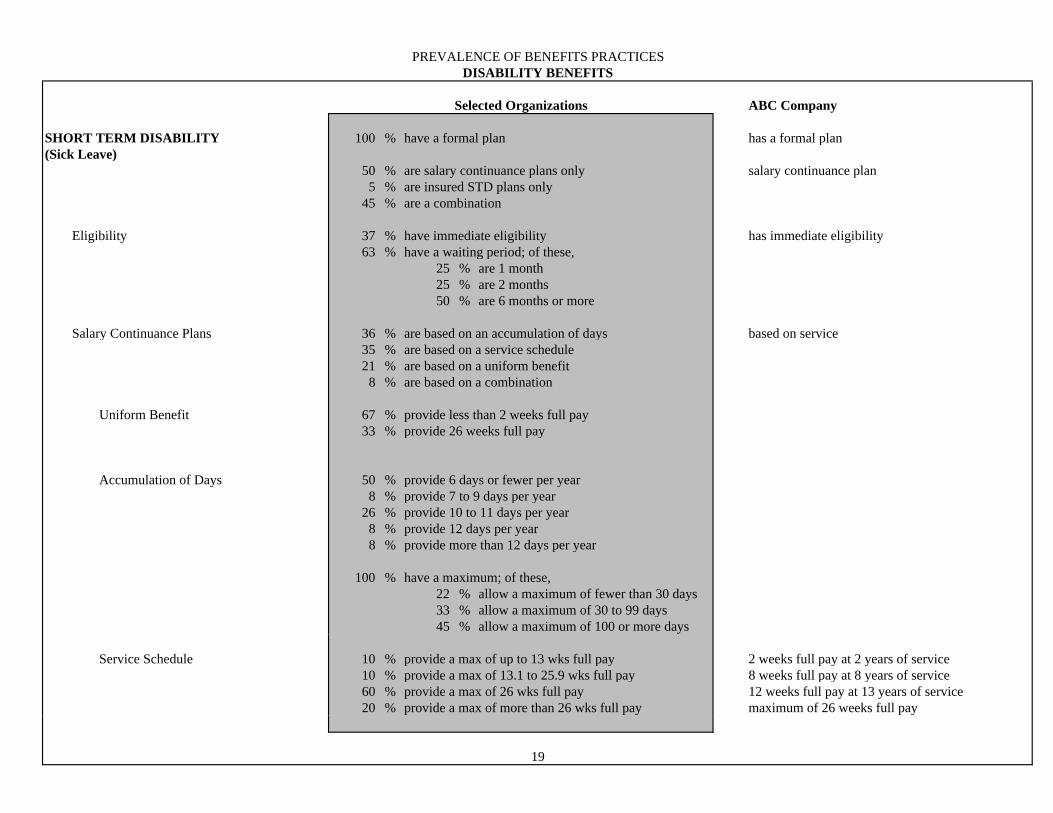
PREVALENCE OF BENEFITS PRACTICESDISABILITY BENEFITS
Selected Organizations ABC Company
SHORT TERM DISABILITY 100 % have a formal plan has a formal plan(Sick Leave)
50 % are salary continuance plans only salary continuance plan5 % are insured STD plans only
45 % are a combination
Eligibility 37 % have immediate eligibility has immediate eligibility63 % have a waiting period; of these,
25 % are 1 month25 % are 2 months50 % are 6 months or more
Salary Continuance Plans 36 % are based on an accumulation of days based on service 35 % are based on a service schedule 21 % are based on a uniform benefit 8 % are based on a combination
Uniform Benefit 67 % provide less than 2 weeks full pay33 % provide 26 weeks full pay
Accumulation of Days 50 % provide 6 days or fewer per year
8 % provide 7 to 9 days per year26 % provide 10 to 11 days per year
8 % provide 12 days per year 8 % provide more than 12 days per year
100 % have a maximum; of these,22 % allow a maximum of fewer than 30 days33 % allow a maximum of 30 to 99 days45 % allow a maximum of 100 or more days
Service Schedule 10 % provide a max of up to 13 wks full pay 2 weeks full pay at 2 years of service
10 % provide a max of 13.1 to 25.9 wks full pay 8 weeks full pay at 8 years of service60 % provide a max of 26 wks full pay 12 weeks full pay at 13 years of service20 % provide a max of more than 26 wks full pay maximum of 26 weeks full pay
19
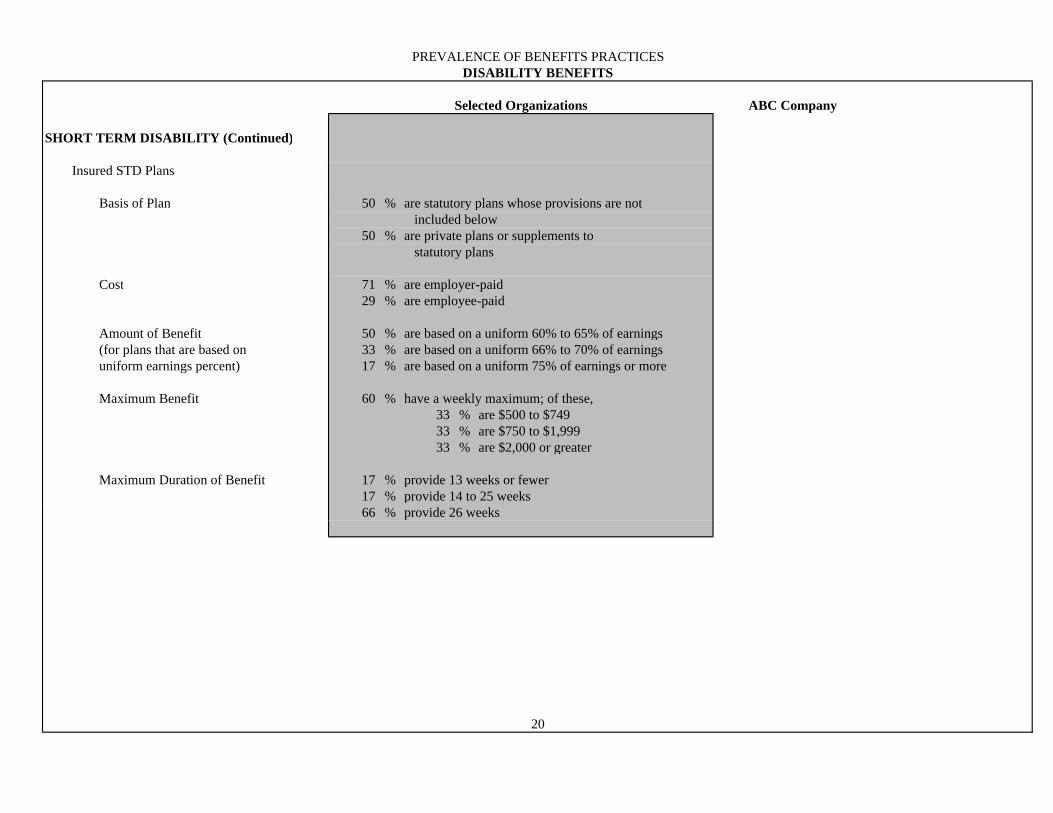
PREVALENCE OF BENEFITS PRACTICESDISABILITY BENEFITS
Selected Organizations ABC Company
SHORT TERM DISABILITY (Continued) Insured STD Plans Basis of Plan 50 % are statutory plans whose provisions are not
included below50 % are private plans or supplements to
statutory plans
Cost 71 % are employer-paid29 % are employee-paid
Amount of Benefit 50 % are based on a uniform 60% to 65% of earnings (for plans that are based on 33 % are based on a uniform 66% to 70% of earnings uniform earnings percent) 17 % are based on a uniform 75% of earnings or more
Maximum Benefit 60 % have a weekly maximum; of these,33 % are $500 to $74933 % are $750 to $1,99933 % are $2,000 or greater
Maximum Duration of Benefit 17 % provide 13 weeks or fewer17 % provide 14 to 25 weeks66 % provide 26 weeks
20
PREVALENCE OF BENEFITS PRACTICESDISABILITY BENEFITS
Selected Organizations ABC Company
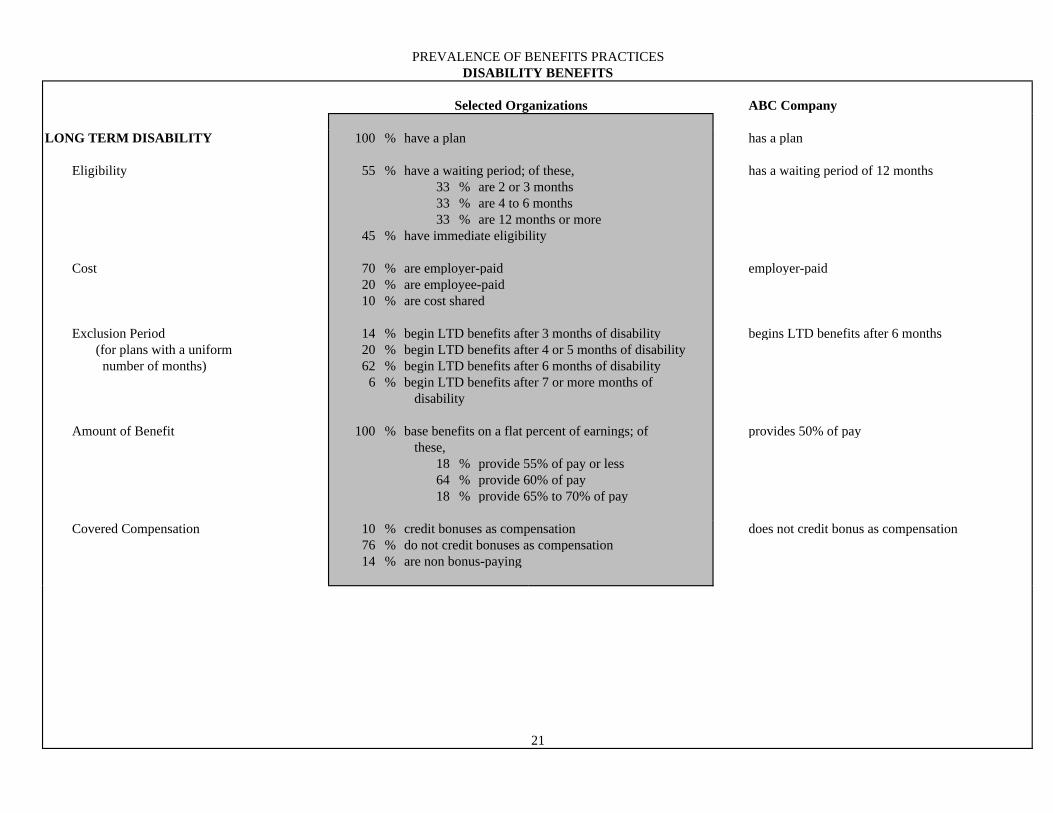
LONG TERM DISABILITY 100 % have a plan has a plan
Eligibility 55 % have a waiting period; of these, has a waiting period of 12 months33 % are 2 or 3 months33 % are 4 to 6 months33 % are 12 months or more
45 % have immediate eligibility Cost 70 % are employer-paid employer-paid 20 % are employee-paid
10 % are cost shared
Exclusion Period 14 % begin LTD benefits after 3 months of disability begins LTD benefits after 6 months (for plans with a uniform 20 % begin LTD benefits after 4 or 5 months of disability number of months) 62 % begin LTD benefits after 6 months of disability
6 % begin LTD benefits after 7 or more months of disability
Amount of Benefit 100 % base benefits on a flat percent of earnings; of provides 50% of pay these,
18 % provide 55% of pay or less64 % provide 60% of pay18 % provide 65% to 70% of pay
Covered Compensation 10 % credit bonuses as compensation does not credit bonus as compensation76 % do not credit bonuses as compensation14 % are non bonus-paying
21
PREVALENCE OF BENEFITS PRACTICESDISABILITY BENEFITS
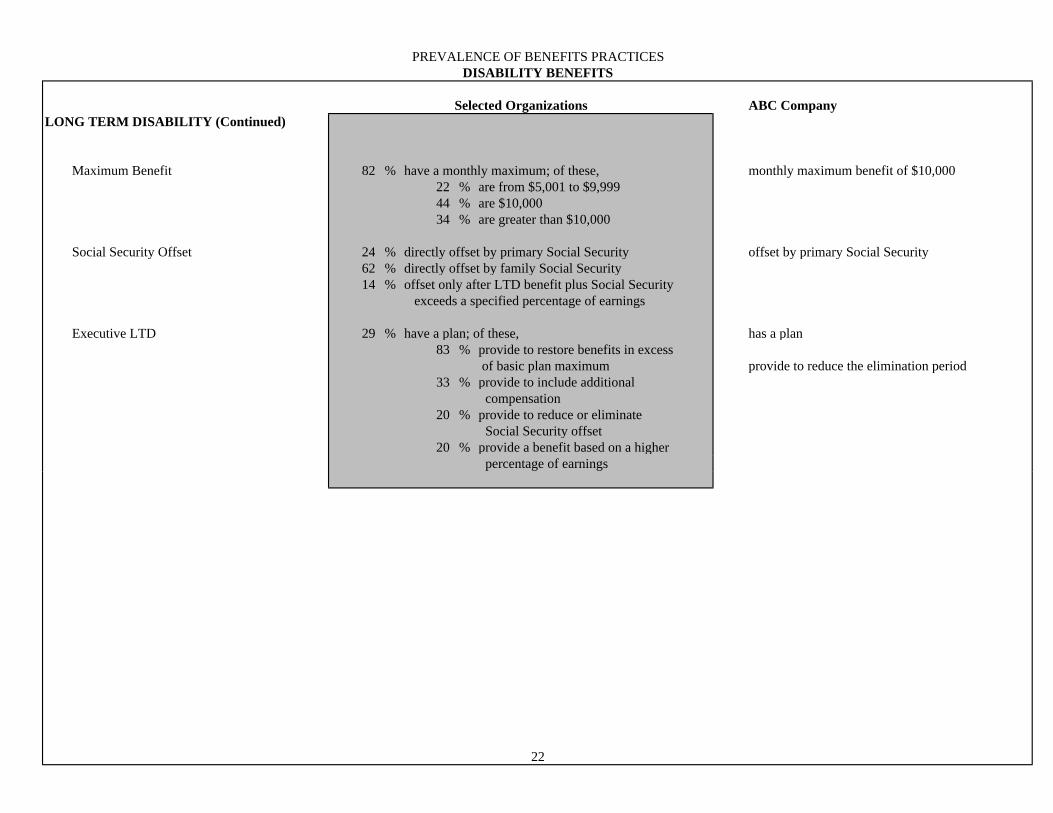
Selected Organizations ABC CompanyLONG TERM DISABILITY (Continued)
Maximum Benefit 82 % have a monthly maximum; of these, monthly maximum benefit of $10,000 22 % are from $5,001 to $9,999 44 % are $10,000 34 % are greater than $10,000 Social Security Offset 24 % directly offset by primary Social Security offset by primary Social Security
62 % directly offset by family Social Security 14 % offset only after LTD benefit plus Social Security
exceeds a specified percentage of earnings
Executive LTD 29 % have a plan; of these, has a plan83 % provide to restore benefits in excess
of basic plan maximum provide to reduce the elimination period33 % provide to include additional
compensation20 % provide to reduce or eliminate
Social Security offset20 % provide a benefit based on a higher
percentage of earnings
22
P90
Q3
MedianAverageQ1
P10
ABC
0
5
10
15
20
25
30
35
40
45
50
10 20 30 40 50 60 70 80 90 100 110Annual Salary ($000)
Ann
ual B
enef
it Va
lue
($00
)
2005 U.S.A. Hay Benefits Report
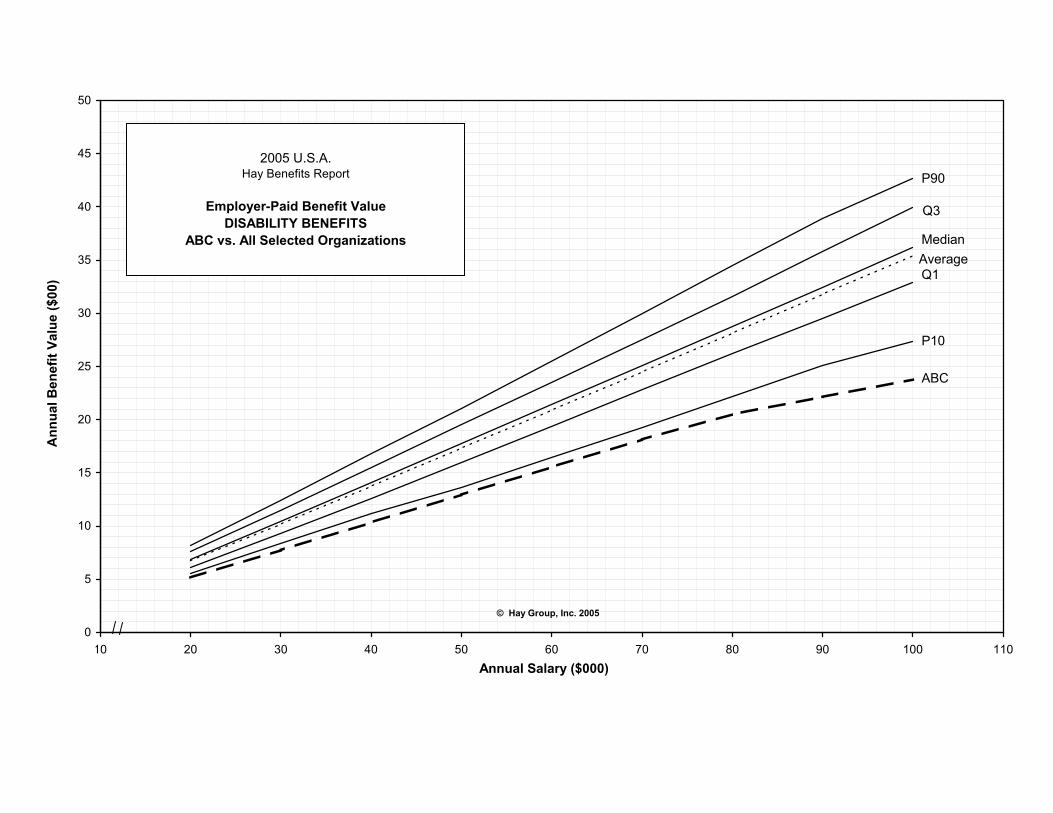
Employer-Paid Benefit ValueDISABILITY BENEFITS
ABC vs. All Selected Organizations
© Hay Group, Inc. 2005
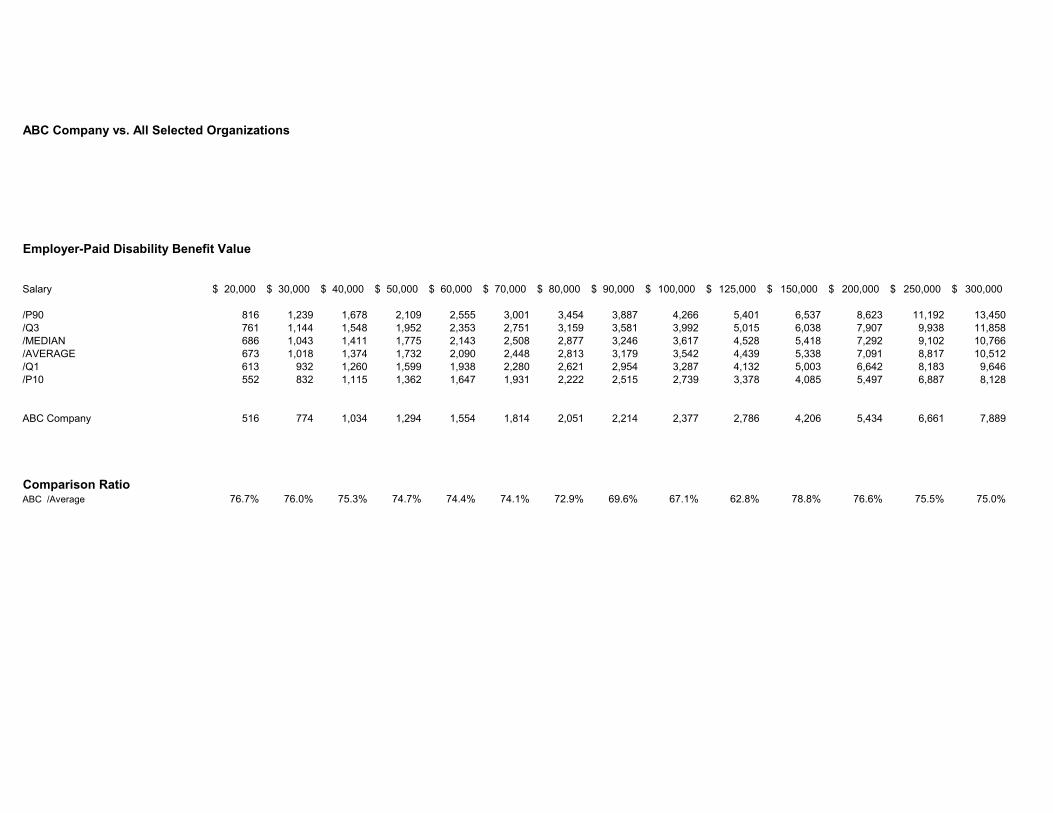
ABC Company vs. All Selected Organizations
Employer-Paid Disability Benefit Value
Salary 20,000$ 30,000$ 40,000$ 50,000$ 60,000$ 70,000$ 80,000$ 90,000$ 100,000$ 125,000$ 150,000$ 200,000$ 250,000$ 300,000$
/P90 816 1,239 1,678 2,109 2,555 3,001 3,454 3,887 4,266 5,401 6,537 8,623 11,192 13,450/Q3 761 1,144 1,548 1,952 2,353 2,751 3,159 3,581 3,992 5,015 6,038 7,907 9,938 11,858/MEDIAN 686 1,043 1,411 1,775 2,143 2,508 2,877 3,246 3,617 4,528 5,418 7,292 9,102 10,766/AVERAGE 673 1,018 1,374 1,732 2,090 2,448 2,813 3,179 3,542 4,439 5,338 7,091 8,817 10,512/Q1 613 932 1,260 1,599 1,938 2,280 2,621 2,954 3,287 4,132 5,003 6,642 8,183 9,646/P10 552 832 1,115 1,362 1,647 1,931 2,222 2,515 2,739 3,378 4,085 5,497 6,887 8,128
ABC Company 516 774 1,034 1,294 1,554 1,814 2,051 2,214 2,377 2,786 4,206 5,434 6,661 7,889
Comparison RatioABC /Average 76.7% 76.0% 75.3% 74.7% 74.4% 74.1% 72.9% 69.6% 67.1% 62.8% 78.8% 76.6% 75.5% 75.0%
PREVALENCE OF BENEFITS PRACTICESHEALTH CARE BENEFITS
Selected Organizations ABC Company
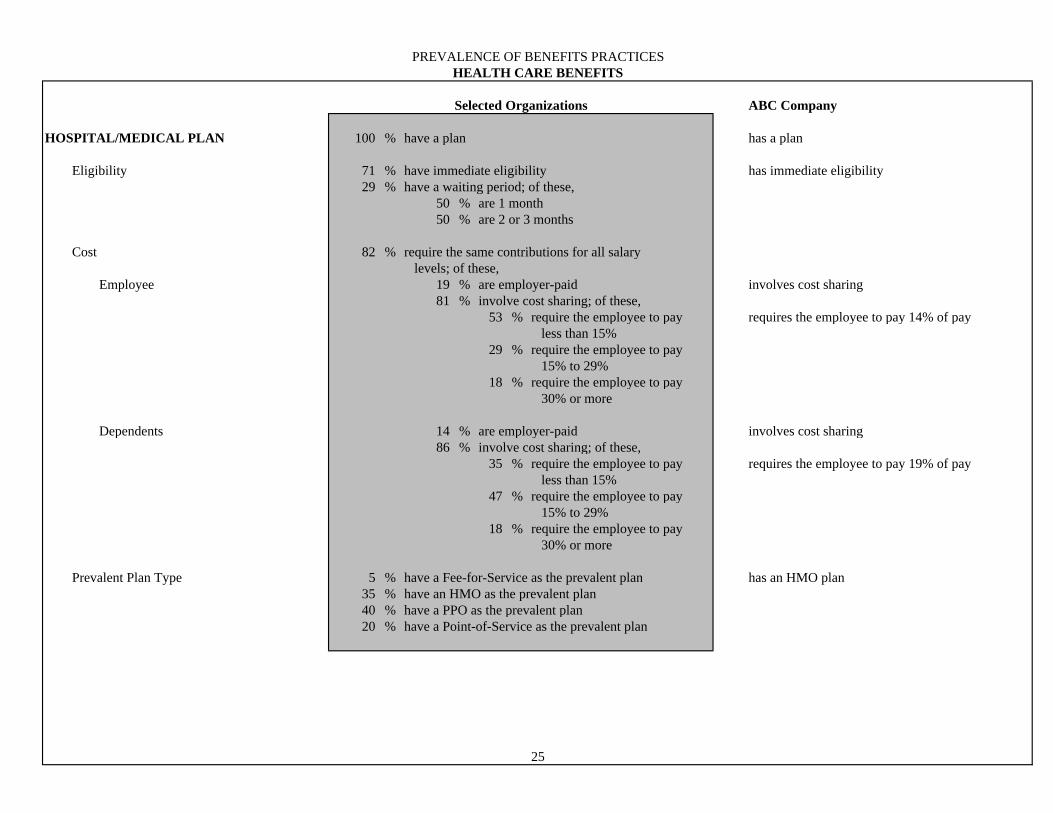
HOSPITAL/MEDICAL PLAN 100 % have a plan has a plan Eligibility 71 % have immediate eligibility has immediate eligibility
29 % have a waiting period; of these, 50 % are 1 month50 % are 2 or 3 months
Cost 82 % require the same contributions for all salary levels; of these,
Employee 19 % are employer-paid involves cost sharing81 % involve cost sharing; of these,
53 % require the employee to pay requires the employee to pay 14% of pay less than 15%
29 % require the employee to pay 15% to 29%
18 % require the employee to pay 30% or more
Dependents 14 % are employer-paid involves cost sharing86 % involve cost sharing; of these,
35 % require the employee to pay requires the employee to pay 19% of pay less than 15%
47 % require the employee to pay 15% to 29%
18 % require the employee to pay 30% or more
Prevalent Plan Type 5 % have a Fee-for-Service as the prevalent plan has an HMO plan35 % have an HMO as the prevalent plan 40 % have a PPO as the prevalent plan 20 % have a Point-of-Service as the prevalent plan
25
PREVALENCE OF BENEFITS PRACTICESHEALTH CARE BENEFITS
Selected Organizations ABC Company
HOSPITAL/MEDICAL PLAN (Continued)
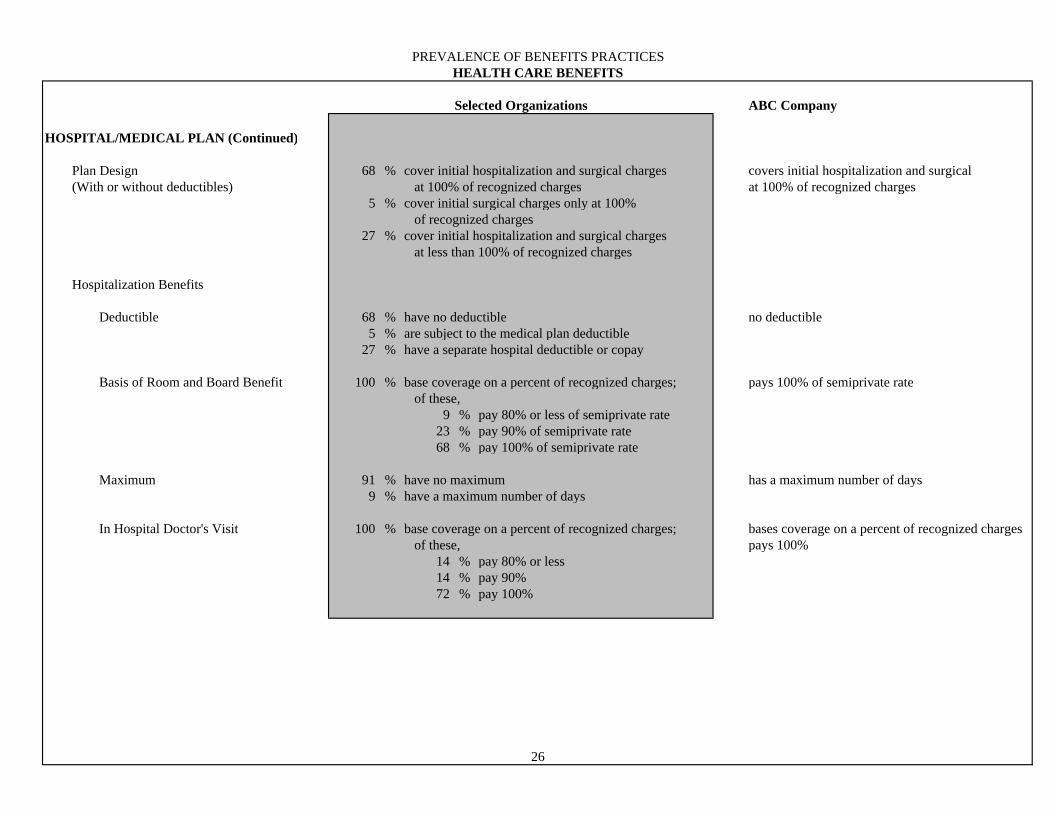
Plan Design 68 % cover initial hospitalization and surgical charges covers initial hospitalization and surgical (With or without deductibles) at 100% of recognized charges at 100% of recognized charges
5 % cover initial surgical charges only at 100% of recognized charges
27 % cover initial hospitalization and surgical charges at less than 100% of recognized charges
Hospitalization Benefits
Deductible 68 % have no deductible no deductible5 % are subject to the medical plan deductible
27 % have a separate hospital deductible or copay
Basis of Room and Board Benefit 100 % base coverage on a percent of recognized charges; pays 100% of semiprivate rate of these,
9 % pay 80% or less of semiprivate rate23 % pay 90% of semiprivate rate68 % pay 100% of semiprivate rate
Maximum 91 % have no maximum has a maximum number of days9 % have a maximum number of days
In Hospital Doctor's Visit 100 % base coverage on a percent of recognized charges; bases coverage on a percent of recognized charges of these, pays 100%
14 % pay 80% or less14 % pay 90%72 % pay 100%
26
PREVALENCE OF BENEFITS PRACTICESHEALTH CARE BENEFITS
Selected Organizations ABC Company
HOSPITAL/MEDICAL PLAN (Continued)
Hospitalization Benefits (Continued)
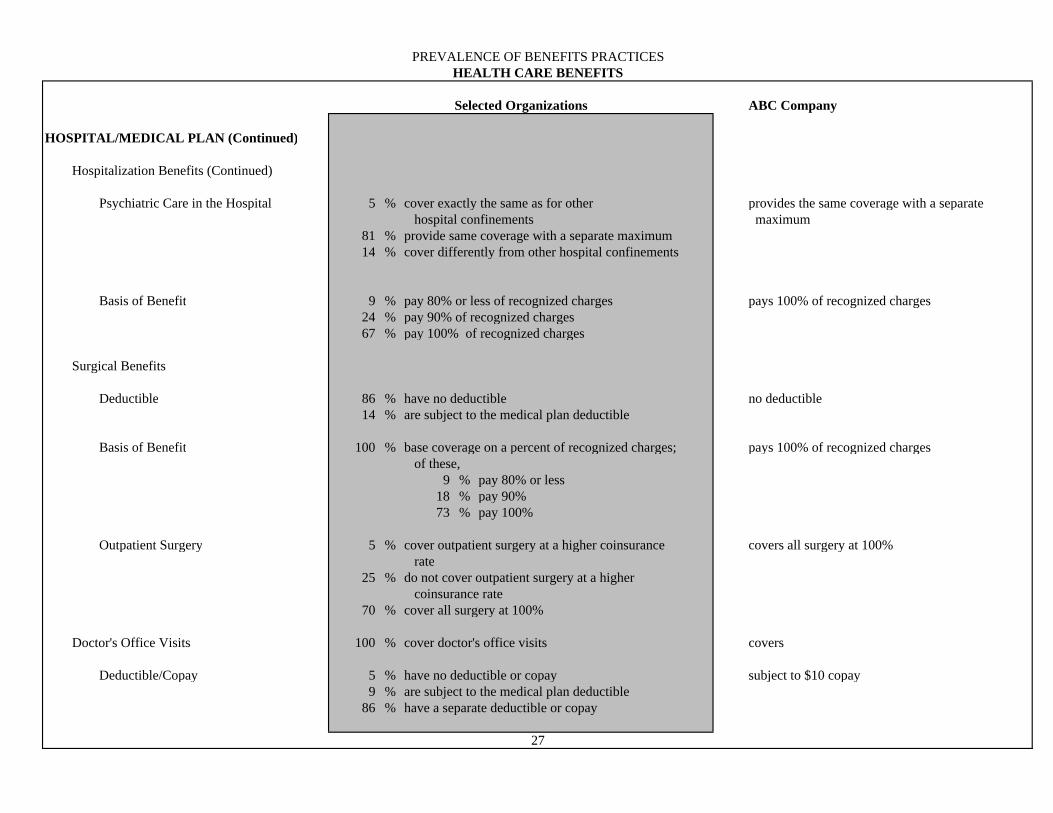
Psychiatric Care in the Hospital 5 % cover exactly the same as for other provides the same coverage with a separate hospital confinements maximum
81 % provide same coverage with a separate maximum14 % cover differently from other hospital confinements
Basis of Benefit 9 % pay 80% or less of recognized charges pays 100% of recognized charges24 % pay 90% of recognized charges67 % pay 100% of recognized charges
Surgical Benefits
Deductible 86 % have no deductible no deductible14 % are subject to the medical plan deductible
Basis of Benefit 100 % base coverage on a percent of recognized charges; pays 100% of recognized charges
of these, 9 % pay 80% or less
18 % pay 90%73 % pay 100%
Outpatient Surgery 5 % cover outpatient surgery at a higher coinsurance covers all surgery at 100% rate
25 % do not cover outpatient surgery at a higher coinsurance rate
70 % cover all surgery at 100%
Doctor's Office Visits 100 % cover doctor's office visits covers
Deductible/Copay 5 % have no deductible or copay subject to $10 copay9 % are subject to the medical plan deductible
86 % have a separate deductible or copay
27
PREVALENCE OF BENEFITS PRACTICESHEALTH CARE BENEFITS
Selected Organizations ABC Company
HOSPITAL/MEDICAL PLAN (Continued)
Doctor's Office Visits (Continued)
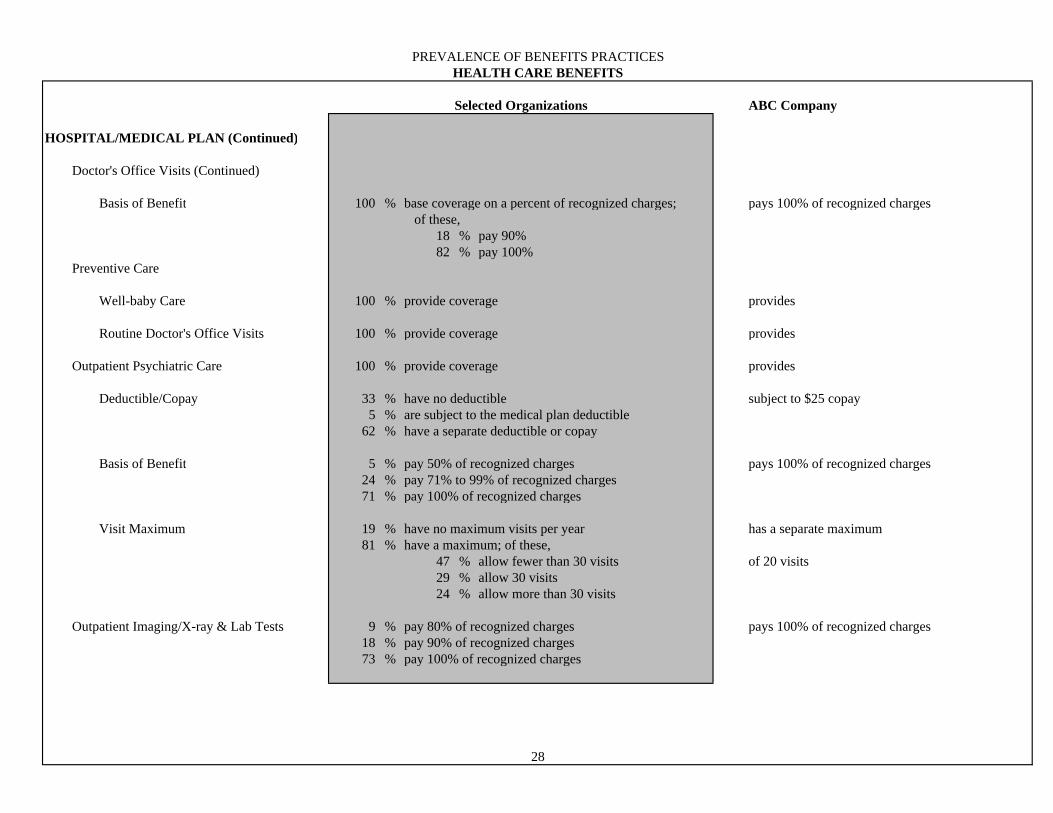
Basis of Benefit 100 % base coverage on a percent of recognized charges; pays 100% of recognized charges of these,
18 % pay 90% 82 % pay 100%
Preventive Care
Well-baby Care 100 % provide coverage provides
Routine Doctor's Office Visits 100 % provide coverage provides
Outpatient Psychiatric Care 100 % provide coverage provides
Deductible/Copay 33 % have no deductible subject to $25 copay5 % are subject to the medical plan deductible
62 % have a separate deductible or copay Basis of Benefit 5 % pay 50% of recognized charges pays 100% of recognized charges
24 % pay 71% to 99% of recognized charges71 % pay 100% of recognized charges
Visit Maximum 19 % have no maximum visits per year has a separate maximum81 % have a maximum; of these,
47 % allow fewer than 30 visits of 20 visits29 % allow 30 visits24 % allow more than 30 visits
Outpatient Imaging/X-ray & Lab Tests 9 % pay 80% of recognized charges pays 100% of recognized charges18 % pay 90% of recognized charges73 % pay 100% of recognized charges
28
PREVALENCE OF BENEFITS PRACTICESHEALTH CARE BENEFITS
Selected Organizations ABC Company
HOSPITAL/MEDICAL PLAN (Continued)
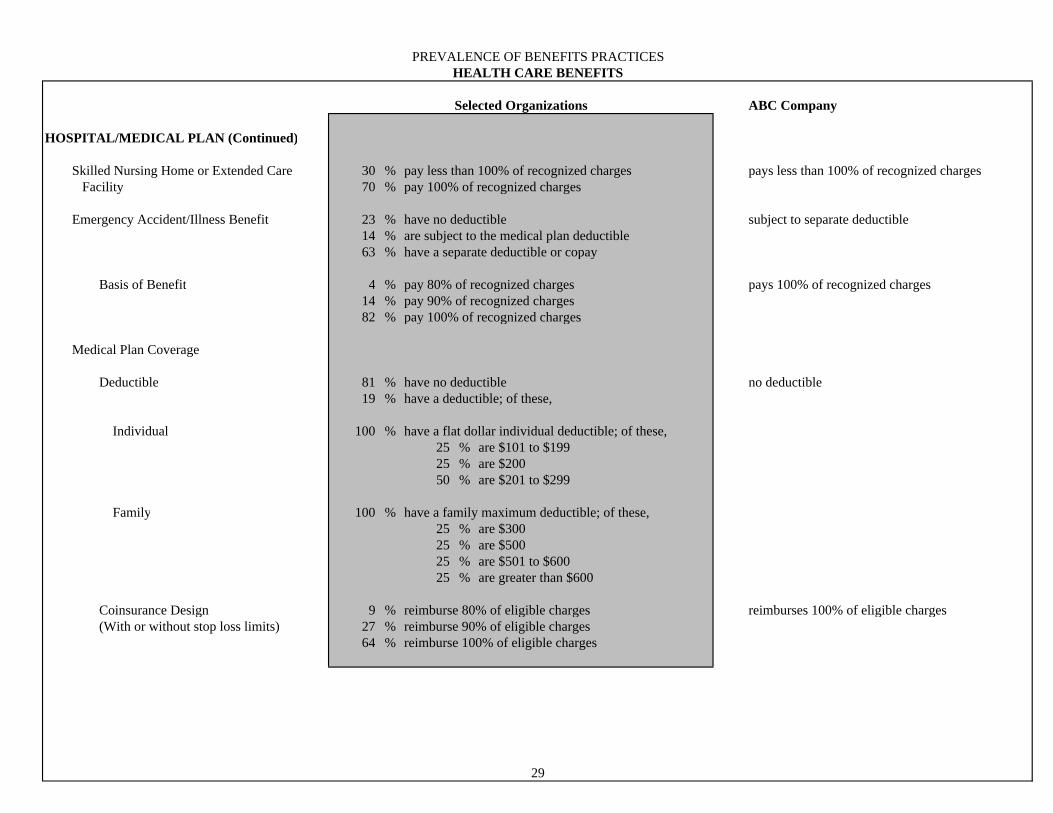
Skilled Nursing Home or Extended Care 30 % pay less than 100% of recognized charges pays less than 100% of recognized charges Facility 70 % pay 100% of recognized charges
Emergency Accident/Illness Benefit 23 % have no deductible subject to separate deductible14 % are subject to the medical plan deductible63 % have a separate deductible or copay
Basis of Benefit 4 % pay 80% of recognized charges pays 100% of recognized charges
14 % pay 90% of recognized charges82 % pay 100% of recognized charges
Medical Plan Coverage
Deductible 81 % have no deductible no deductible19 % have a deductible; of these,
Individual 100 % have a flat dollar individual deductible; of these,25 % are $101 to $19925 % are $20050 % are $201 to $299
Family 100 % have a family maximum deductible; of these,25 % are $30025 % are $50025 % are $501 to $60025 % are greater than $600
Coinsurance Design 9 % reimburse 80% of eligible charges reimburses 100% of eligible charges (With or without stop loss limits) 27 % reimburse 90% of eligible charges
64 % reimburse 100% of eligible charges
29
PREVALENCE OF BENEFITS PRACTICESHEALTH CARE BENEFITS
Selected Organizations ABC Company
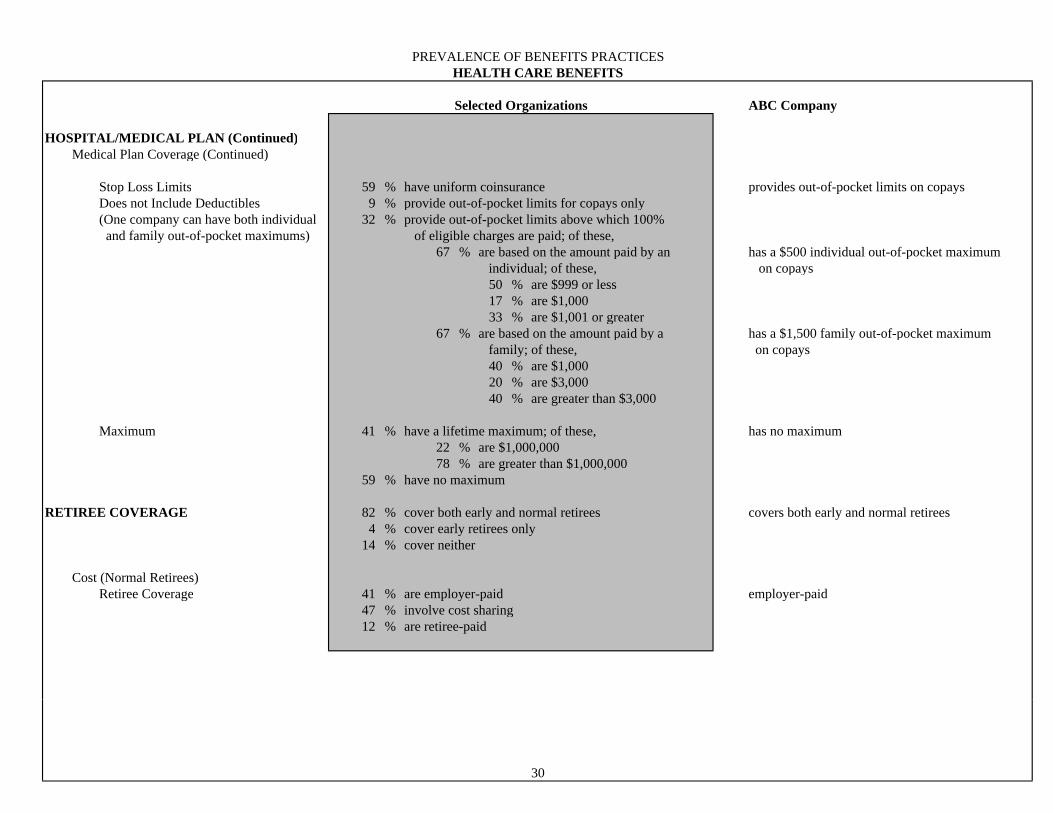
HOSPITAL/MEDICAL PLAN (Continued) Medical Plan Coverage (Continued)
Stop Loss Limits 59 % have uniform coinsurance provides out-of-pocket limits on copays Does not Include Deductibles 9 % provide out-of-pocket limits for copays only (One company can have both individual 32 % provide out-of-pocket limits above which 100% and family out-of-pocket maximums) of eligible charges are paid; of these,
67 % are based on the amount paid by an has a $500 individual out-of-pocket maximum individual; of these, on copays
50 % are $999 or less17 % are $1,00033 % are $1,001 or greater
67 % are based on the amount paid by a has a $1,500 family out-of-pocket maximum family; of these, on copays
40 % are $1,00020 % are $3,00040 % are greater than $3,000
Maximum 41 % have a lifetime maximum; of these, has no maximum22 % are $1,000,00078 % are greater than $1,000,000
59 % have no maximum
RETIREE COVERAGE 82 % cover both early and normal retirees covers both early and normal retirees4 % cover early retirees only
14 % cover neither
Cost (Normal Retirees) Retiree Coverage 41 % are employer-paid employer-paid
47 % involve cost sharing 12 % are retiree-paid
30
PREVALENCE OF BENEFITS PRACTICESHEALTH CARE BENEFITS
Selected Organizations ABC Company
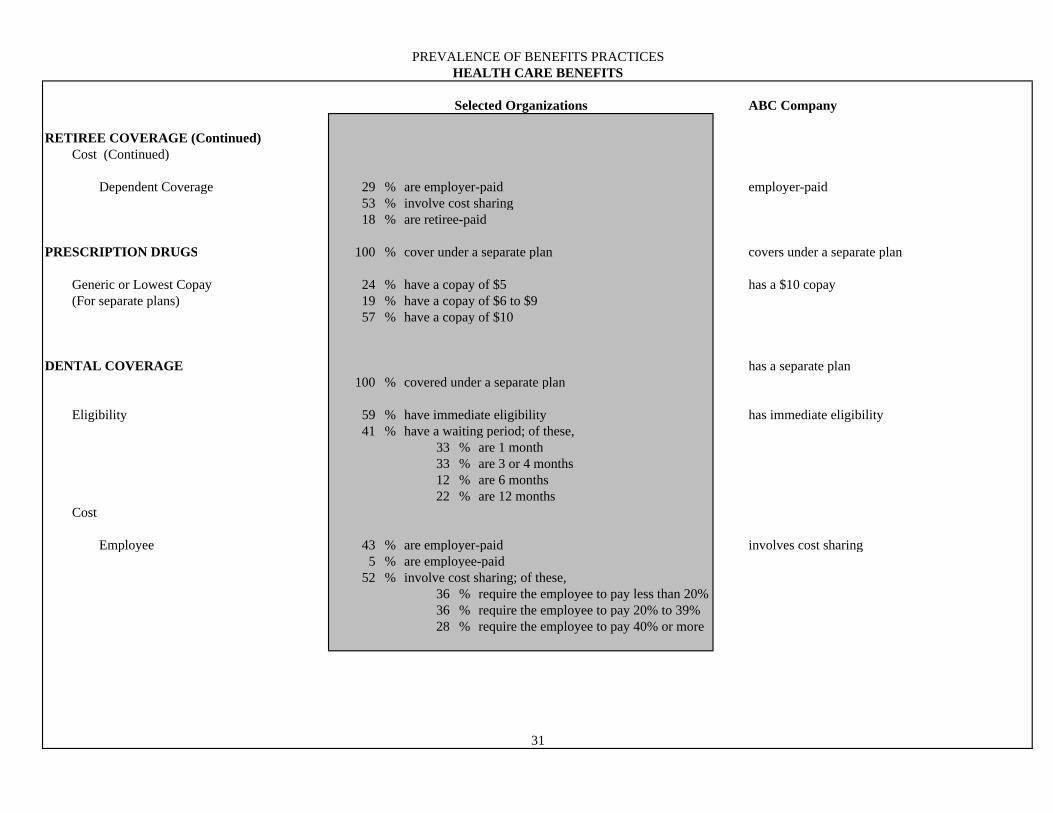
RETIREE COVERAGE (Continued) Cost (Continued)
Dependent Coverage 29 % are employer-paid employer-paid53 % involve cost sharing
18 % are retiree-paid
PRESCRIPTION DRUGS 100 % cover under a separate plan covers under a separate plan
Generic or Lowest Copay 24 % have a copay of $5 has a $10 copay (For separate plans) 19 % have a copay of $6 to $9
57 % have a copay of $10
DENTAL COVERAGE has a separate plan100 % covered under a separate plan
Eligibility 59 % have immediate eligibility has immediate eligibility41 % have a waiting period; of these,
33 % are 1 month33 % are 3 or 4 months12 % are 6 months22 % are 12 months
Cost
Employee 43 % are employer-paid involves cost sharing5 % are employee-paid
52 % involve cost sharing; of these, 36 % require the employee to pay less than 20%36 % require the employee to pay 20% to 39%28 % require the employee to pay 40% or more
31
PREVALENCE OF BENEFITS PRACTICESHEALTH CARE BENEFITS
Selected Organizations ABC Company
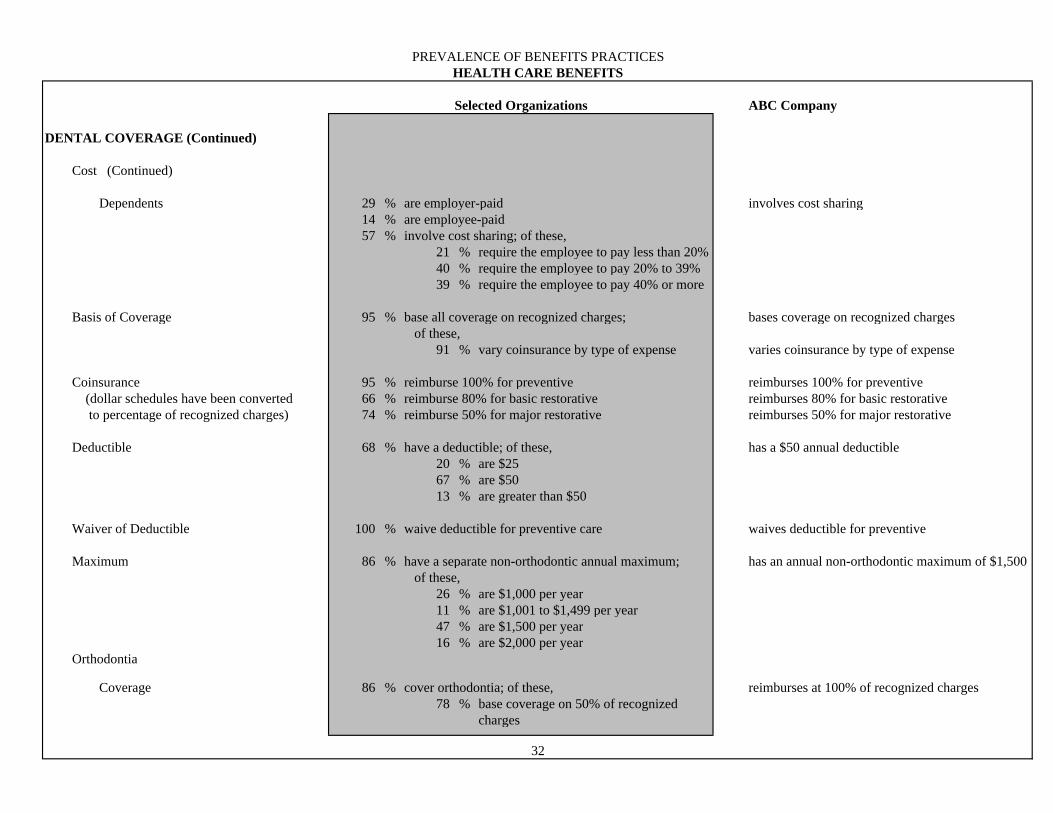
DENTAL COVERAGE (Continued)
Cost (Continued)
Dependents 29 % are employer-paid involves cost sharing14 % are employee-paid57 % involve cost sharing; of these,
21 % require the employee to pay less than 20%40 % require the employee to pay 20% to 39%39 % require the employee to pay 40% or more
Basis of Coverage 95 % base all coverage on recognized charges; bases coverage on recognized charges of these, 91 % vary coinsurance by type of expense varies coinsurance by type of expense
Coinsurance 95 % reimburse 100% for preventive reimburses 100% for preventive (dollar schedules have been converted 66 % reimburse 80% for basic restorative reimburses 80% for basic restorative to percentage of recognized charges) 74 % reimburse 50% for major restorative reimburses 50% for major restorative
Deductible 68 % have a deductible; of these, has a $50 annual deductible20 % are $2567 % are $5013 % are greater than $50
Waiver of Deductible 100 % waive deductible for preventive care waives deductible for preventive
Maximum 86 % have a separate non-orthodontic annual maximum; has an annual non-orthodontic maximum of $1,500 of these,
26 % are $1,000 per year11 % are $1,001 to $1,499 per year47 % are $1,500 per year16 % are $2,000 per year
Orthodontia Coverage 86 % cover orthodontia; of these, reimburses at 100% of recognized charges
78 % base coverage on 50% of recognized charges
32
PREVALENCE OF BENEFITS PRACTICESHEALTH CARE BENEFITS
Selected Organizations ABC Company
DENTAL COVERAGE (Continued)
Orthodontia (Continued)
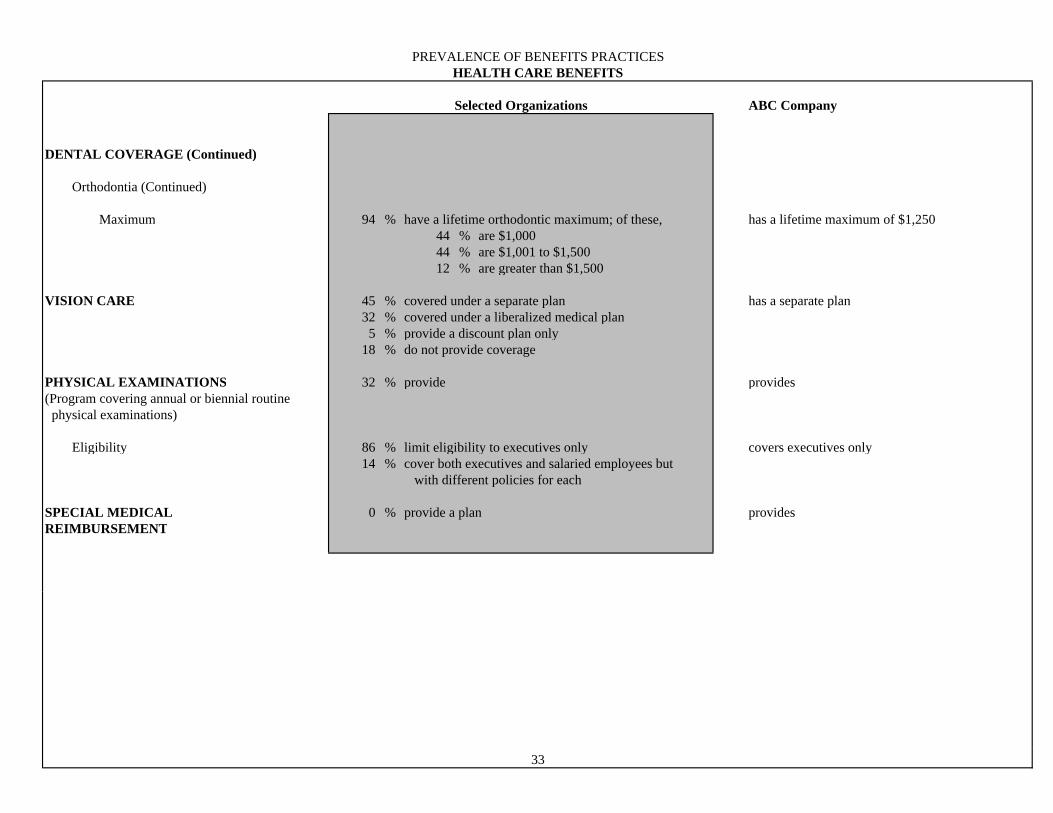
Maximum 94 % have a lifetime orthodontic maximum; of these, has a lifetime maximum of $1,25044 % are $1,00044 % are $1,001 to $1,50012 % are greater than $1,500
VISION CARE 45 % covered under a separate plan has a separate plan32 % covered under a liberalized medical plan
5 % provide a discount plan only18 % do not provide coverage
PHYSICAL EXAMINATIONS 32 % provide provides(Program covering annual or biennial routine physical examinations) Eligibility 86 % limit eligibility to executives only covers executives only
14 % cover both executives and salaried employees but with different policies for each
SPECIAL MEDICAL 0 % provide a plan providesREIMBURSEMENT
33
P90
Q3
Median
Average
Q1
P10
ABC
20
30
40
50
60
70
80
10 20 30 40 50 60 70 80 90 100 110Annual Salary ($000)
Ann
ual B
enef
it Va
lue
($00
)
2005 U.S.A. Hay Benefits Report
Employer-Paid Benefit ValueHEALTH CARE BENEFITS
ABC vs. All Selected Organizations
© Hay Group, Inc. 2005
ABC Company vs. All Selected Organizations
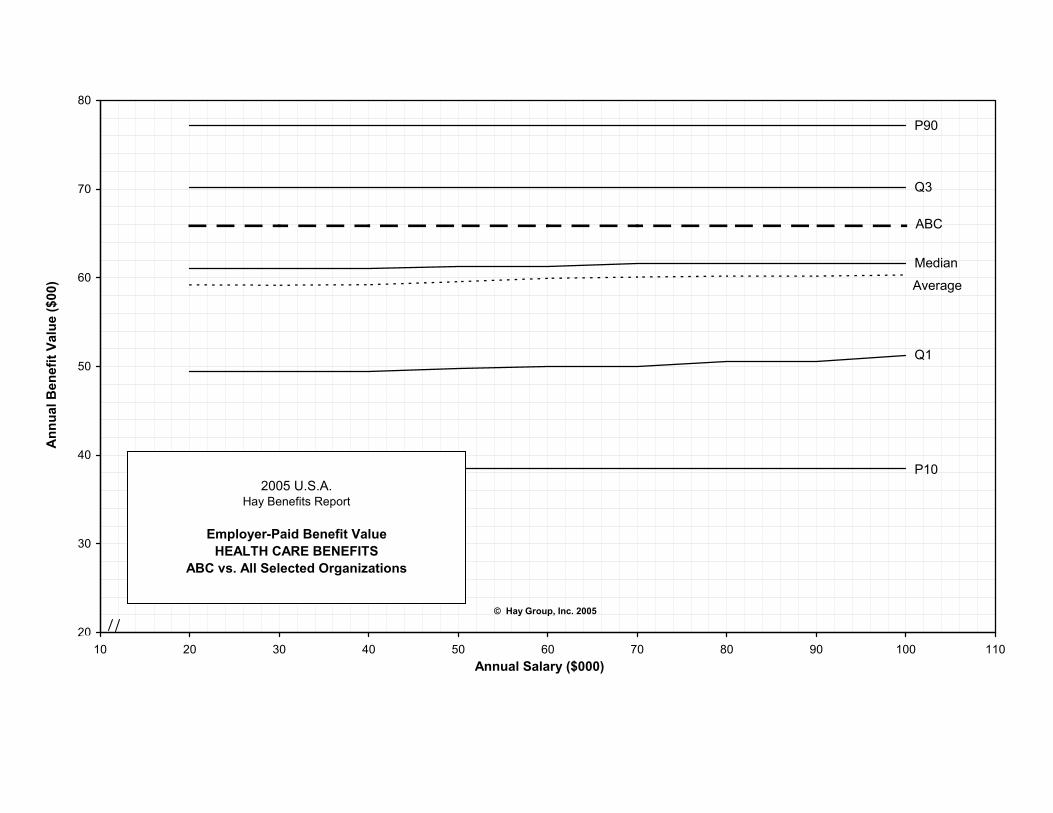
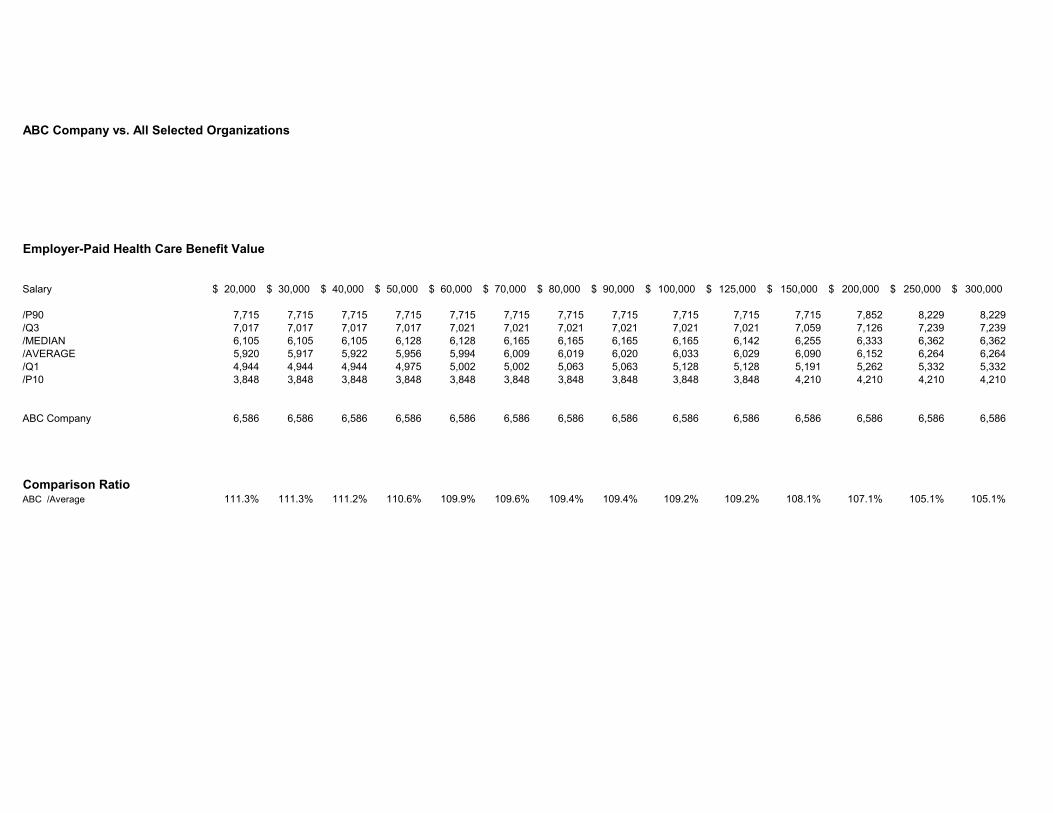
Employer-Paid Health Care Benefit Value
Salary 20,000$ 30,000$ 40,000$ 50,000$ 60,000$ 70,000$ 80,000$ 90,000$ 100,000$ 125,000$ 150,000$ 200,000$ 250,000$ 300,000$
/P90 7,715 7,715 7,715 7,715 7,715 7,715 7,715 7,715 7,715 7,715 7,715 7,852 8,229 8,229/Q3 7,017 7,017 7,017 7,017 7,021 7,021 7,021 7,021 7,021 7,021 7,059 7,126 7,239 7,239/MEDIAN 6,105 6,105 6,105 6,128 6,128 6,165 6,165 6,165 6,165 6,142 6,255 6,333 6,362 6,362/AVERAGE 5,920 5,917 5,922 5,956 5,994 6,009 6,019 6,020 6,033 6,029 6,090 6,152 6,264 6,264/Q1 4,944 4,944 4,944 4,975 5,002 5,002 5,063 5,063 5,128 5,128 5,191 5,262 5,332 5,332/P10 3,848 3,848 3,848 3,848 3,848 3,848 3,848 3,848 3,848 3,848 4,210 4,210 4,210 4,210
ABC Company 6,586 6,586 6,586 6,586 6,586 6,586 6,586 6,586 6,586 6,586 6,586 6,586 6,586 6,586
Comparison RatioABC /Average 111.3% 111.3% 111.2% 110.6% 109.9% 109.6% 109.4% 109.4% 109.2% 109.2% 108.1% 107.1% 105.1% 105.1%
PREVALENCE OF BENEFITS PRACTICESRETIREMENT BENEFITS
Selected Organizations ABC Company
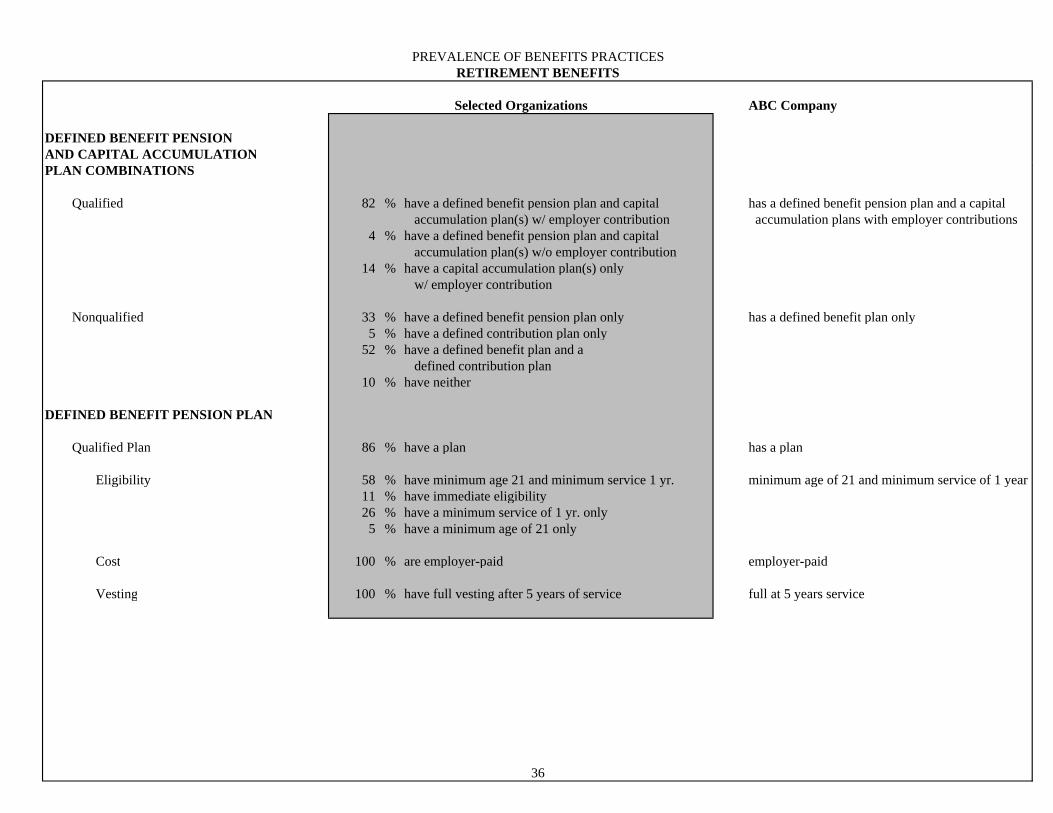
DEFINED BENEFIT PENSIONAND CAPITAL ACCUMULATIONPLAN COMBINATIONS Qualified 82 % have a defined benefit pension plan and capital has a defined benefit pension plan and a capital
accumulation plan(s) w/ employer contribution accumulation plans with employer contributions4 % have a defined benefit pension plan and capital
accumulation plan(s) w/o employer contribution14 % have a capital accumulation plan(s) only
w/ employer contribution
Nonqualified 33 % have a defined benefit pension plan only has a defined benefit plan only5 % have a defined contribution plan only
52 % have a defined benefit plan and a defined contribution plan
10 % have neither
DEFINED BENEFIT PENSION PLAN
Qualified Plan 86 % have a plan has a plan
Eligibility 58 % have minimum age 21 and minimum service 1 yr. minimum age of 21 and minimum service of 1 year11 % have immediate eligibility 26 % have a minimum service of 1 yr. only
5 % have a minimum age of 21 only
Cost 100 % are employer-paid employer-paid
Vesting 100 % have full vesting after 5 years of service full at 5 years service
36
PREVALENCE OF BENEFITS PRACTICESRETIREMENT BENEFITS
Selected Organizations ABC Company
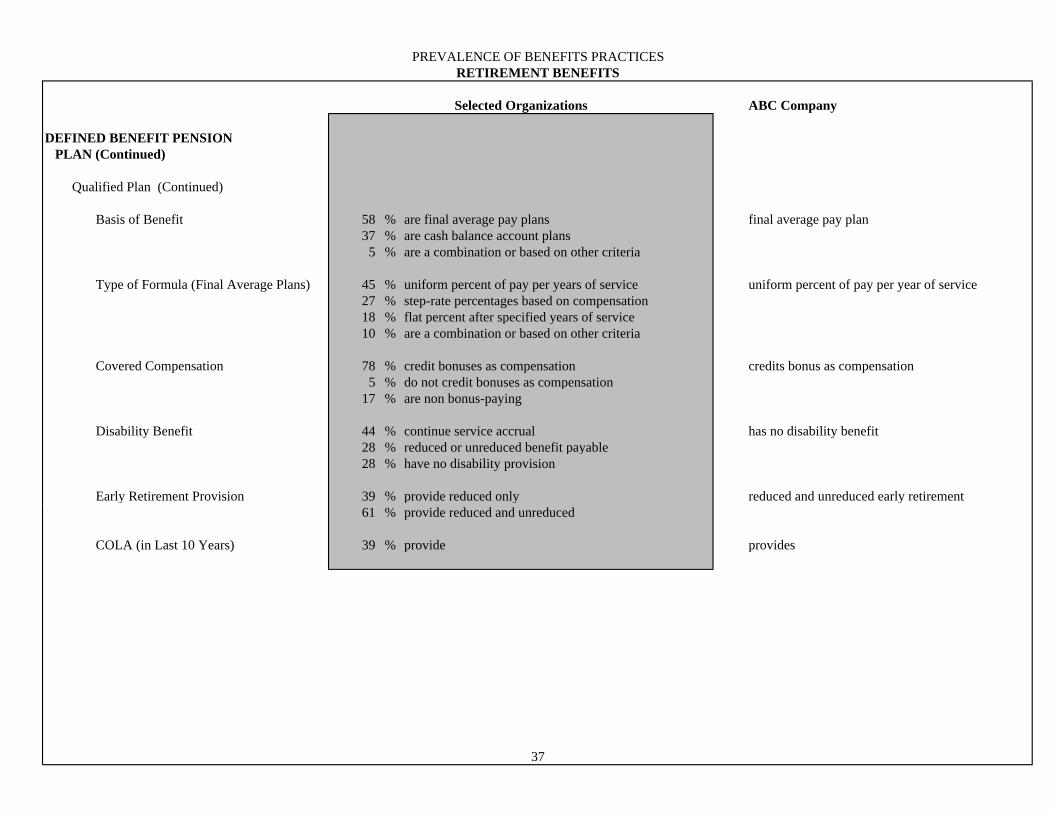
DEFINED BENEFIT PENSION PLAN (Continued)
Qualified Plan (Continued)
Basis of Benefit 58 % are final average pay plans final average pay plan37 % are cash balance account plans
5 % are a combination or based on other criteria
Type of Formula (Final Average Plans) 45 % uniform percent of pay per years of service uniform percent of pay per year of service27 % step-rate percentages based on compensation 18 % flat percent after specified years of service10 % are a combination or based on other criteria
Covered Compensation 78 % credit bonuses as compensation credits bonus as compensation5 % do not credit bonuses as compensation
17 % are non bonus-paying
Disability Benefit 44 % continue service accrual has no disability benefit28 % reduced or unreduced benefit payable 28 % have no disability provision
Early Retirement Provision 39 % provide reduced only reduced and unreduced early retirement61 % provide reduced and unreduced
COLA (in Last 10 Years) 39 % provide provides
37
PREVALENCE OF BENEFITS PRACTICESRETIREMENT BENEFITS
Selected Organizations ABC Company
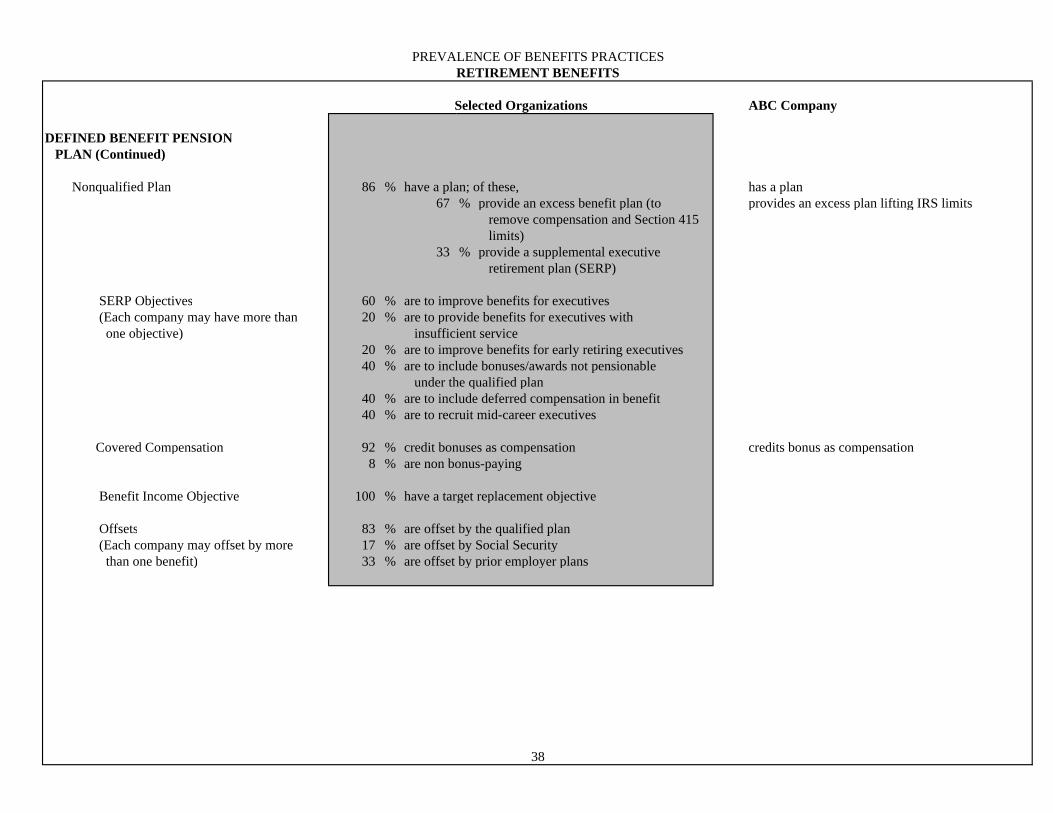
DEFINED BENEFIT PENSION PLAN (Continued) Nonqualified Plan 86 % have a plan; of these, has a plan
67 % provide an excess benefit plan (to provides an excess plan lifting IRS limits remove compensation and Section 415 limits)
33 % provide a supplemental executive retirement plan (SERP)
SERP Objectives 60 % are to improve benefits for executives (Each company may have more than 20 % are to provide benefits for executives with one objective) insufficient service
20 % are to improve benefits for early retiring executives40 % are to include bonuses/awards not pensionable
under the qualified plan40 % are to include deferred compensation in benefit40 % are to recruit mid-career executives
Covered Compensation 92 % credit bonuses as compensation credits bonus as compensation8 % are non bonus-paying
Benefit Income Objective 100 % have a target replacement objective
Offsets 83 % are offset by the qualified plan (Each company may offset by more 17 % are offset by Social Security than one benefit) 33 % are offset by prior employer plans
38
P90
Q3
MedianAverage
Q1
P10
0
10
20
30
40
50
60
70
80
90
100
10 20 30 40 50 60 70 80 90 100 110Annual Salary ($000)
Ann
ual B
enef
it Va
lue
($00
)
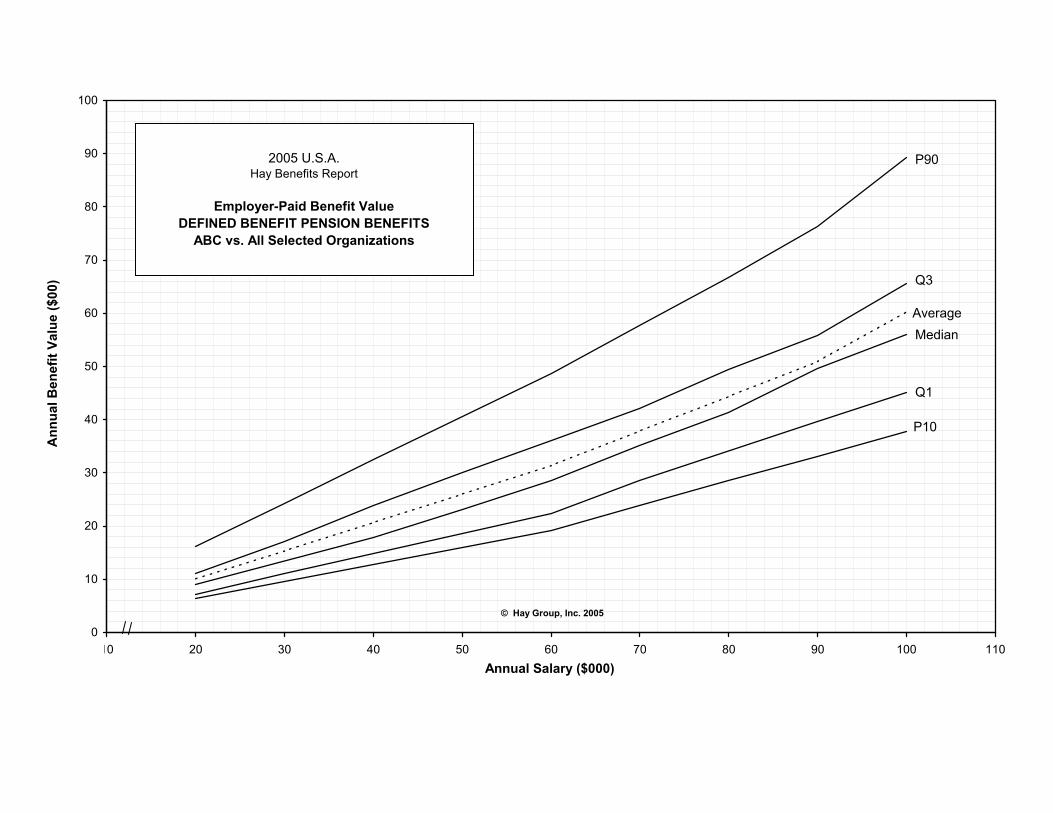
2005 U.S.A. Hay Benefits Report
Employer-Paid Benefit ValueDEFINED BENEFIT PENSION BENEFITS
ABC vs. All Selected Organizations
© Hay Group, Inc. 2005
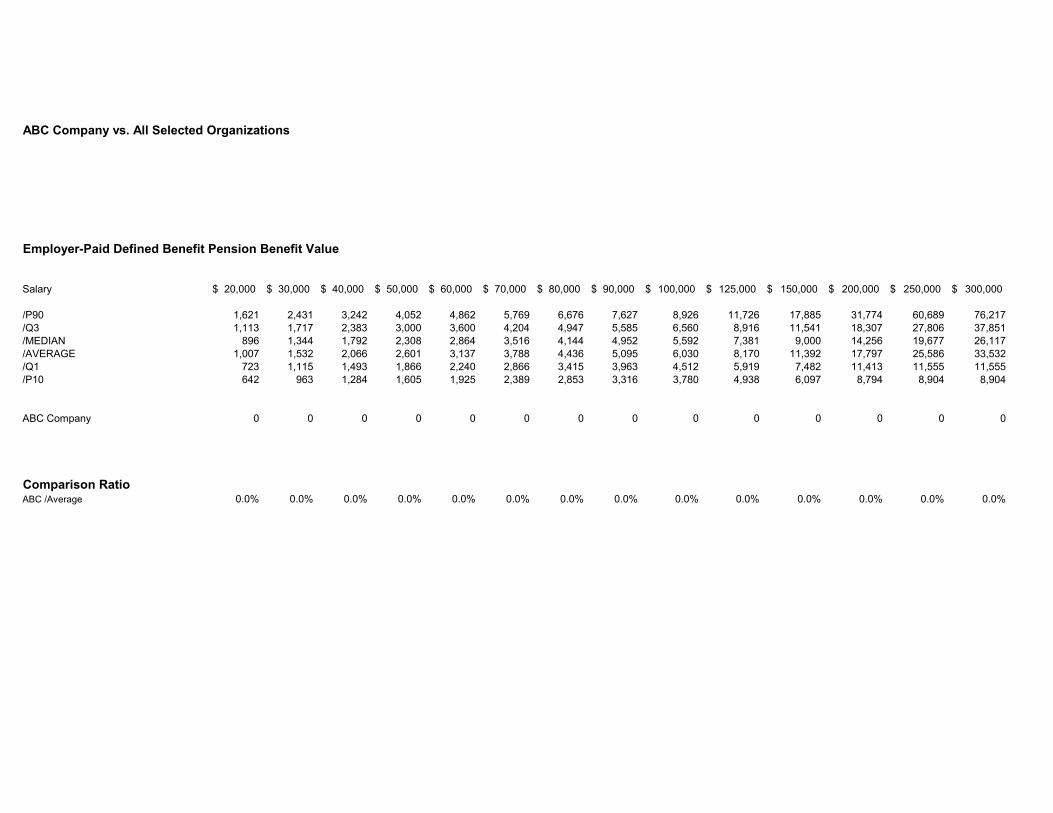
ABC Company vs. All Selected Organizations
Employer-Paid Defined Benefit Pension Benefit Value
Salary 20,000$ 30,000$ 40,000$ 50,000$ 60,000$ 70,000$ 80,000$ 90,000$ 100,000$ 125,000$ 150,000$ 200,000$ 250,000$ 300,000$
/P90 1,621 2,431 3,242 4,052 4,862 5,769 6,676 7,627 8,926 11,726 17,885 31,774 60,689 76,217/Q3 1,113 1,717 2,383 3,000 3,600 4,204 4,947 5,585 6,560 8,916 11,541 18,307 27,806 37,851/MEDIAN 896 1,344 1,792 2,308 2,864 3,516 4,144 4,952 5,592 7,381 9,000 14,256 19,677 26,117/AVERAGE 1,007 1,532 2,066 2,601 3,137 3,788 4,436 5,095 6,030 8,170 11,392 17,797 25,586 33,532/Q1 723 1,115 1,493 1,866 2,240 2,866 3,415 3,963 4,512 5,919 7,482 11,413 11,555 11,555/P10 642 963 1,284 1,605 1,925 2,389 2,853 3,316 3,780 4,938 6,097 8,794 8,904 8,904
ABC Company 0 0 0 0 0 0 0 0 0 0 0 0 0 0
Comparison RatioABC /Average 0.0% 0.0% 0.0% 0.0% 0.0% 0.0% 0.0% 0.0% 0.0% 0.0% 0.0% 0.0% 0.0% 0.0%
PREVALENCE OF BENEFITS PRACTICESRETIREMENT BENEFITS
Selected Organizations ABC Company
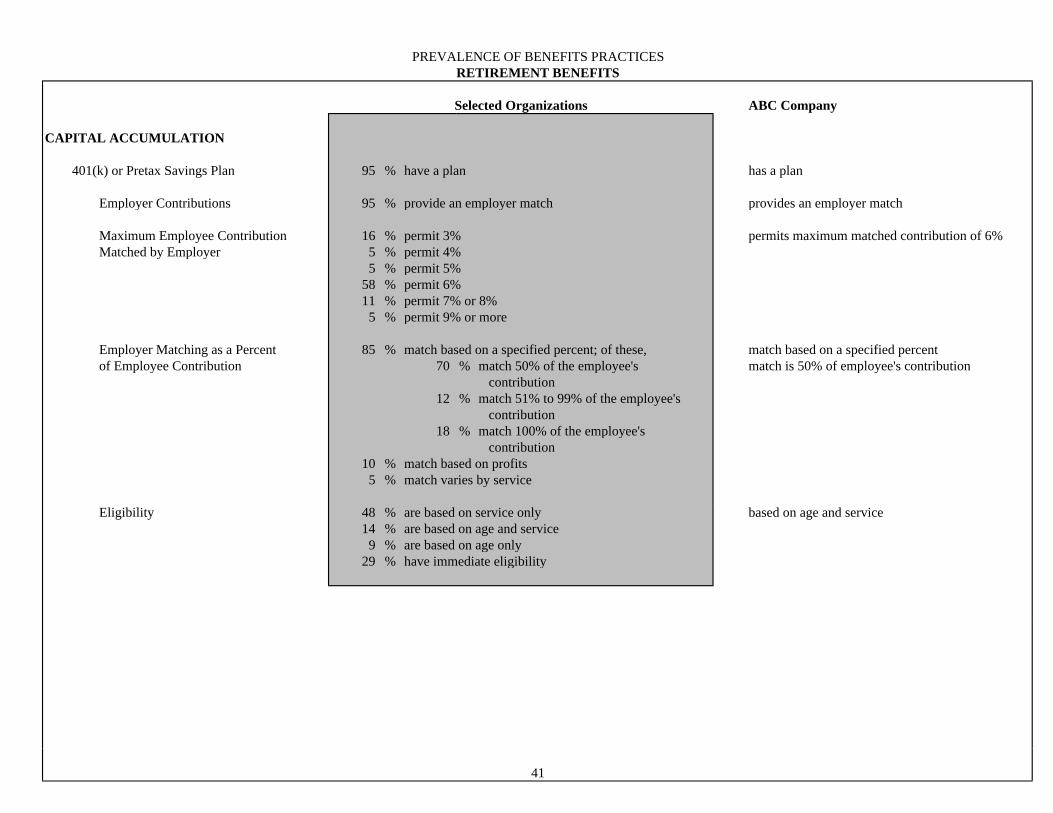
CAPITAL ACCUMULATION 401(k) or Pretax Savings Plan 95 % have a plan has a plan
Employer Contributions 95 % provide an employer match provides an employer match Maximum Employee Contribution 16 % permit 3% permits maximum matched contribution of 6% Matched by Employer 5 % permit 4%
5 % permit 5%58 % permit 6%11 % permit 7% or 8%
5 % permit 9% or more Employer Matching as a Percent 85 % match based on a specified percent; of these, match based on a specified percent of Employee Contribution 70 % match 50% of the employee's match is 50% of employee's contribution
contribution12 % match 51% to 99% of the employee's
contribution 18 % match 100% of the employee's
contribution 10 % match based on profits
5 % match varies by service
Eligibility 48 % are based on service only based on age and service14 % are based on age and service
9 % are based on age only29 % have immediate eligibility
41
PREVALENCE OF BENEFITS PRACTICESRETIREMENT BENEFITS
Selected Organizations ABC Company
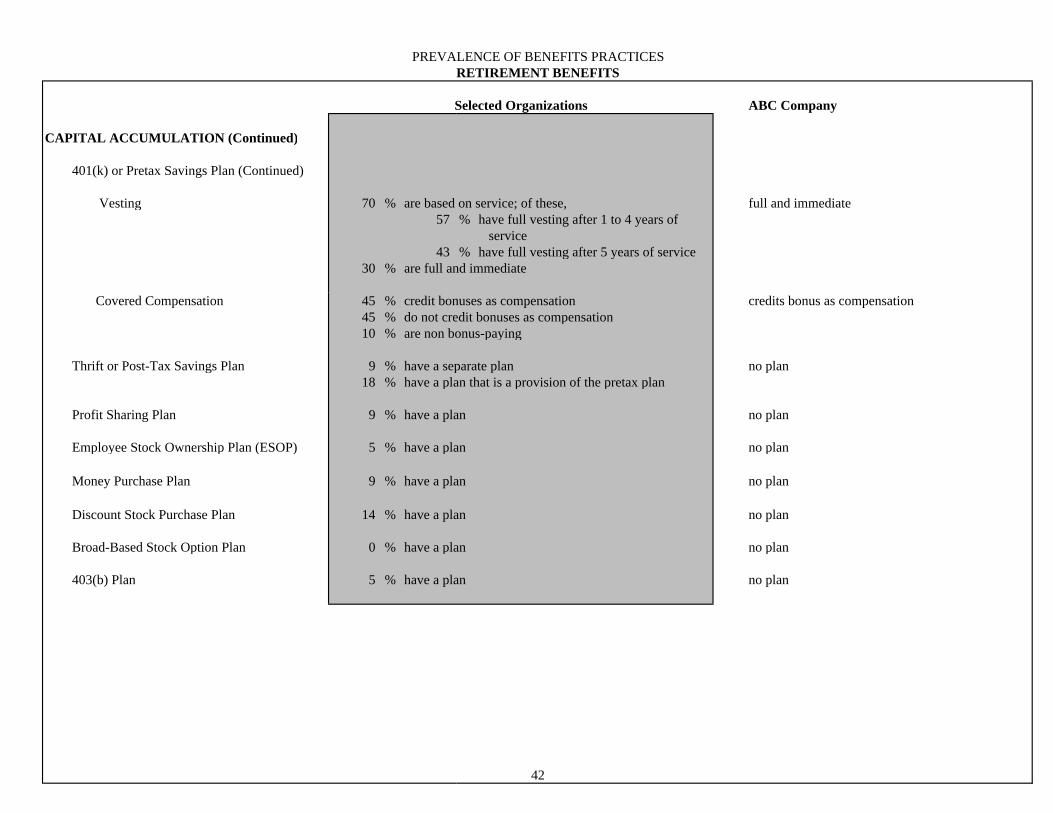
CAPITAL ACCUMULATION (Continued)
401(k) or Pretax Savings Plan (Continued)
Vesting 70 % are based on service; of these, full and immediate57 % have full vesting after 1 to 4 years of
service43 % have full vesting after 5 years of service
30 % are full and immediate
Covered Compensation 45 % credit bonuses as compensation credits bonus as compensation45 % do not credit bonuses as compensation10 % are non bonus-paying
Thrift or Post-Tax Savings Plan 9 % have a separate plan no plan
18 % have a plan that is a provision of the pretax plan
Profit Sharing Plan 9 % have a plan no plan
Employee Stock Ownership Plan (ESOP) 5 % have a plan no plan
Money Purchase Plan 9 % have a plan no plan
Discount Stock Purchase Plan 14 % have a plan no plan
Broad-Based Stock Option Plan 0 % have a plan no plan
403(b) Plan 5 % have a plan no plan
42
PREVALENCE OF BENEFITS PRACTICESRETIREMENT BENEFITS
Selected Organizations ABC Company
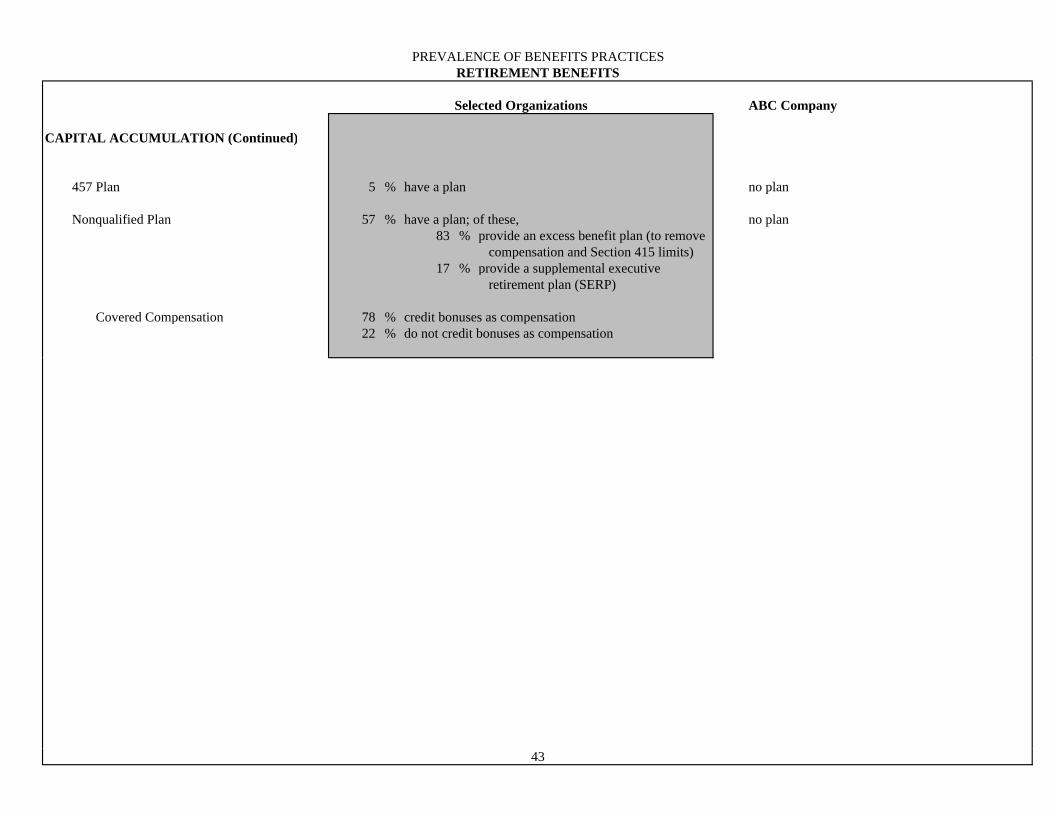
CAPITAL ACCUMULATION (Continued)
457 Plan 5 % have a plan no plan
Nonqualified Plan 57 % have a plan; of these, no plan83 % provide an excess benefit plan (to remove
compensation and Section 415 limits)17 % provide a supplemental executive
retirement plan (SERP)
Covered Compensation 78 % credit bonuses as compensation22 % do not credit bonuses as compensation
43
P90
Q3
Median
Average
Q1
P10
ABC
0
10
20
30
40
50
60
70
80
90
100
10 20 30 40 50 60 70 80 90 100 110Annual Salary ($000)
Ann
ual B
enef
it Va
lue
($00
)
2005 U.S.A. Hay Benefits Report
Employer-Paid Benefit ValueCAPITAL ACCUMULATION BENEFITS
ABC vs. All Selected Organizations
© Hay Group, Inc. 2005
ABC Company vs. All Selected Organizations
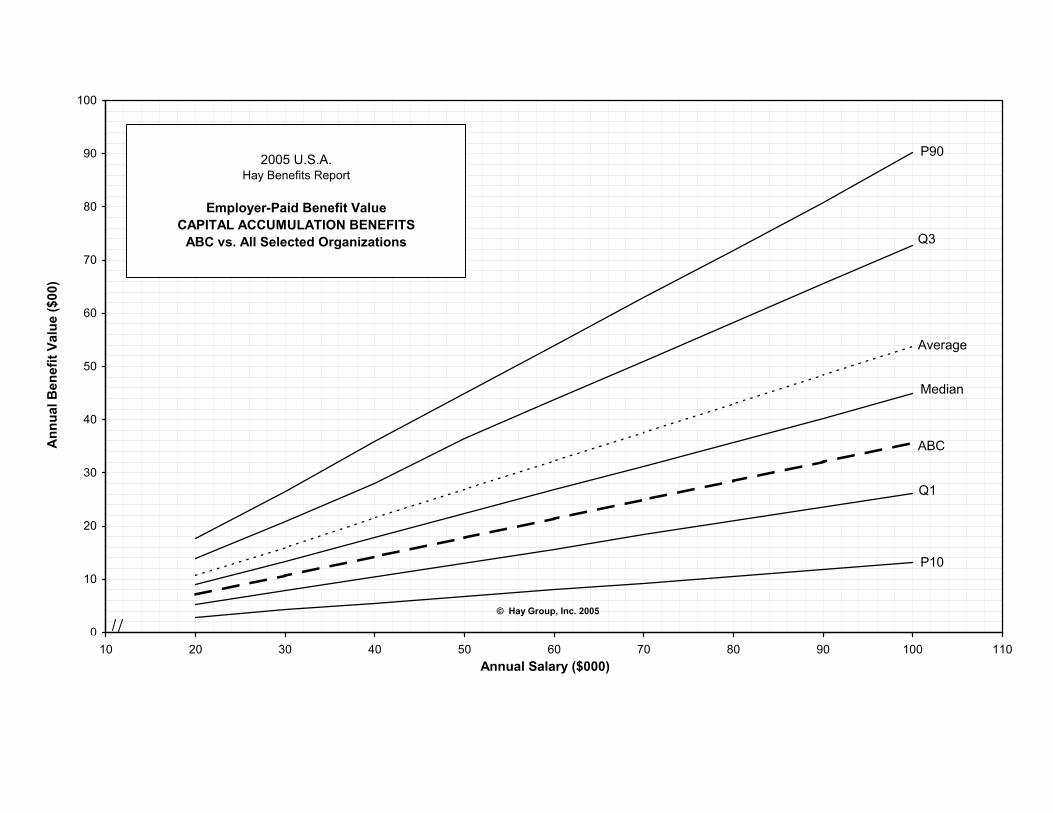
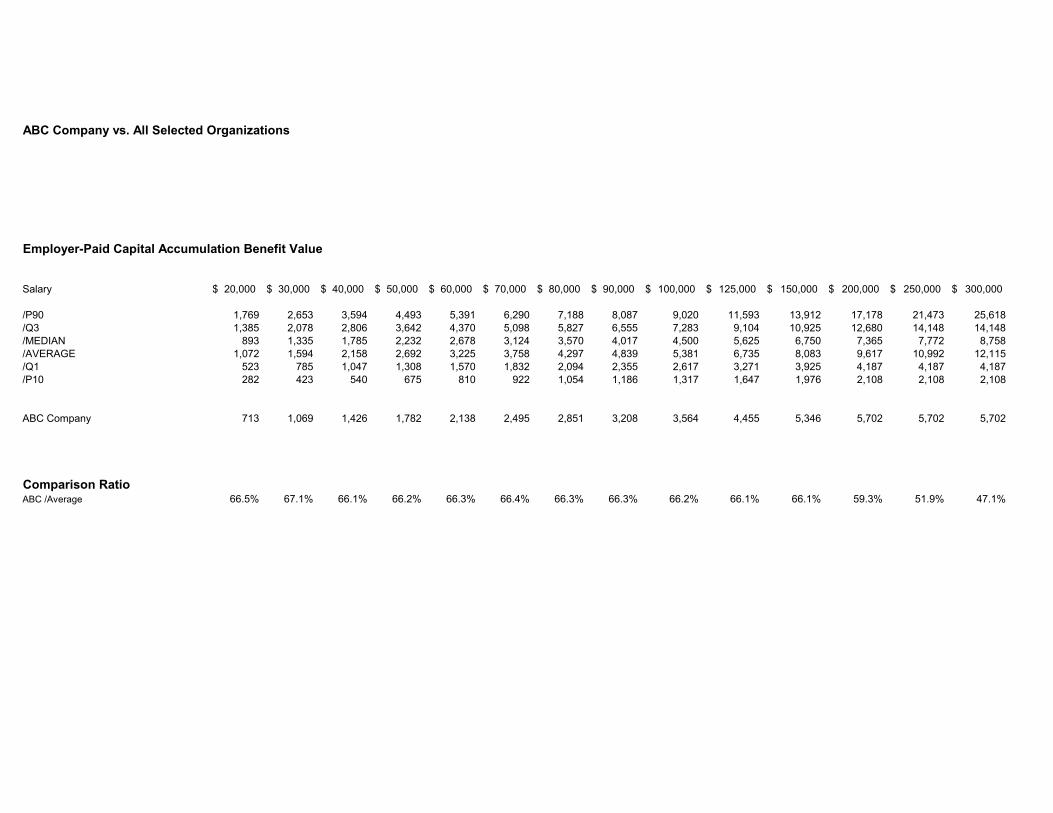
Employer-Paid Capital Accumulation Benefit Value
Salary 20,000$ 30,000$ 40,000$ 50,000$ 60,000$ 70,000$ 80,000$ 90,000$ 100,000$ 125,000$ 150,000$ 200,000$ 250,000$ 300,000$
/P90 1,769 2,653 3,594 4,493 5,391 6,290 7,188 8,087 9,020 11,593 13,912 17,178 21,473 25,618/Q3 1,385 2,078 2,806 3,642 4,370 5,098 5,827 6,555 7,283 9,104 10,925 12,680 14,148 14,148/MEDIAN 893 1,335 1,785 2,232 2,678 3,124 3,570 4,017 4,500 5,625 6,750 7,365 7,772 8,758/AVERAGE 1,072 1,594 2,158 2,692 3,225 3,758 4,297 4,839 5,381 6,735 8,083 9,617 10,992 12,115/Q1 523 785 1,047 1,308 1,570 1,832 2,094 2,355 2,617 3,271 3,925 4,187 4,187 4,187/P10 282 423 540 675 810 922 1,054 1,186 1,317 1,647 1,976 2,108 2,108 2,108
ABC Company 713 1,069 1,426 1,782 2,138 2,495 2,851 3,208 3,564 4,455 5,346 5,702 5,702 5,702
Comparison RatioABC /Average 66.5% 67.1% 66.1% 66.2% 66.3% 66.4% 66.3% 66.3% 66.2% 66.1% 66.1% 59.3% 51.9% 47.1%
P90
Q3
Median
Average
Q1
P10
ABC
0
10
20
30
40
50
60
70
80
90
100
110
120
130
140
150
10 20 30 40 50 60 70 80 90 100 110Annual Salary ($000)
Ann
ual B
enef
it Va
lue
($00
)
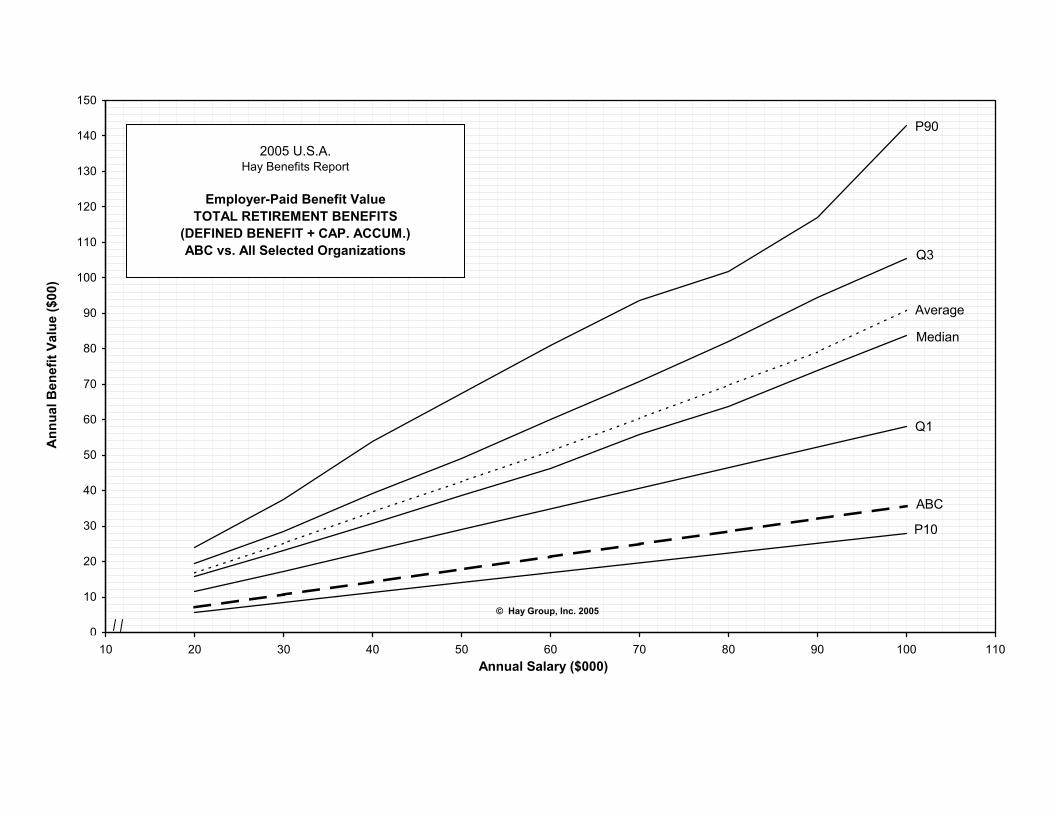
2005 U.S.A. Hay Benefits Report
Employer-Paid Benefit ValueTOTAL RETIREMENT BENEFITS
(DEFINED BENEFIT + CAP. ACCUM.)ABC vs. All Selected Organizations
© Hay Group, Inc. 2005
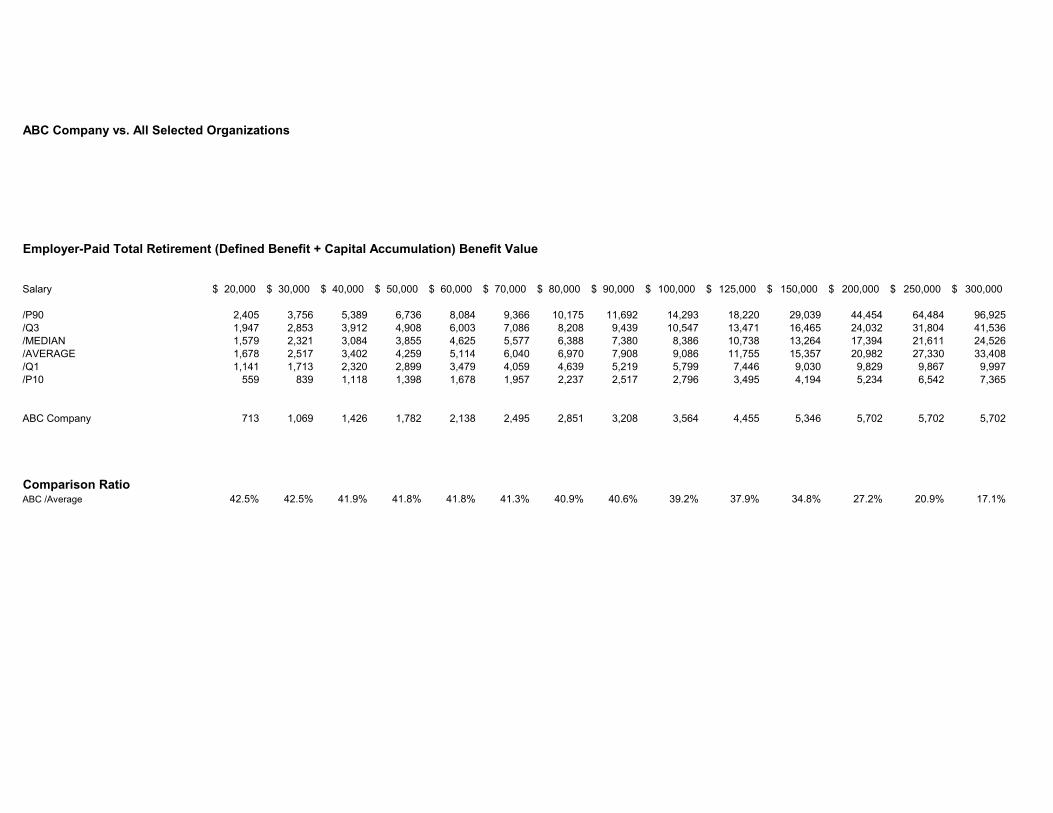
ABC Company vs. All Selected Organizations
Employer-Paid Total Retirement (Defined Benefit + Capital Accumulation) Benefit Value
Salary 20,000$ 30,000$ 40,000$ 50,000$ 60,000$ 70,000$ 80,000$ 90,000$ 100,000$ 125,000$ 150,000$ 200,000$ 250,000$ 300,000$
/P90 2,405 3,756 5,389 6,736 8,084 9,366 10,175 11,692 14,293 18,220 29,039 44,454 64,484 96,925/Q3 1,947 2,853 3,912 4,908 6,003 7,086 8,208 9,439 10,547 13,471 16,465 24,032 31,804 41,536/MEDIAN 1,579 2,321 3,084 3,855 4,625 5,577 6,388 7,380 8,386 10,738 13,264 17,394 21,611 24,526/AVERAGE 1,678 2,517 3,402 4,259 5,114 6,040 6,970 7,908 9,086 11,755 15,357 20,982 27,330 33,408/Q1 1,141 1,713 2,320 2,899 3,479 4,059 4,639 5,219 5,799 7,446 9,030 9,829 9,867 9,997/P10 559 839 1,118 1,398 1,678 1,957 2,237 2,517 2,796 3,495 4,194 5,234 6,542 7,365
ABC Company 713 1,069 1,426 1,782 2,138 2,495 2,851 3,208 3,564 4,455 5,346 5,702 5,702 5,702
Comparison RatioABC /Average 42.5% 42.5% 41.9% 41.8% 41.8% 41.3% 40.9% 40.6% 39.2% 37.9% 34.8% 27.2% 20.9% 17.1%
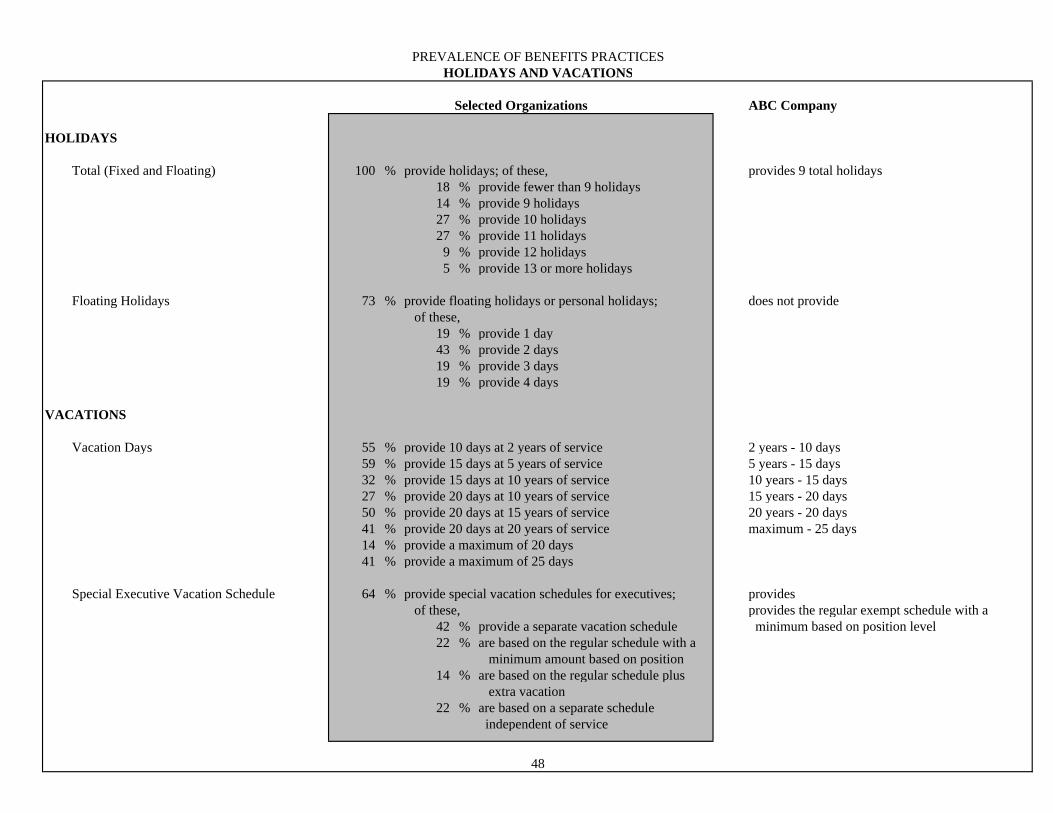
PREVALENCE OF BENEFITS PRACTICESHOLIDAYS AND VACATIONS
Selected Organizations ABC Company
HOLIDAYS Total (Fixed and Floating) 100 % provide holidays; of these, provides 9 total holidays
18 % provide fewer than 9 holidays 14 % provide 9 holidays
27 % provide 10 holidays27 % provide 11 holidays
9 % provide 12 holidays5 % provide 13 or more holidays
Floating Holidays 73 % provide floating holidays or personal holidays; does not provide of these, 19 % provide 1 day 43 % provide 2 days 19 % provide 3 days
19 % provide 4 days
VACATIONS Vacation Days 55 % provide 10 days at 2 years of service 2 years - 10 days 59 % provide 15 days at 5 years of service 5 years - 15 days 32 % provide 15 days at 10 years of service 10 years - 15 days
27 % provide 20 days at 10 years of service 15 years - 20 days 50 % provide 20 days at 15 years of service 20 years - 20 days 41 % provide 20 days at 20 years of service maximum - 25 days 14 % provide a maximum of 20 days
41 % provide a maximum of 25 days Special Executive Vacation Schedule 64 % provide special vacation schedules for executives; provides
of these, provides the regular exempt schedule with a 42 % provide a separate vacation schedule minimum based on position level22 % are based on the regular schedule with a
minimum amount based on position14 % are based on the regular schedule plus
extra vacation22 % are based on a separate schedule
independent of service
48
P90
Q3
MedianAverage
Q1
P10
ABC
10
20
30
40
50
60
70
80
90
100
110
120
130
140
10 20 30 40 50 60 70 80 90 100 110Annual Salary ($000)
Ann
ual B
enef
it Va
lue
($00
)
2005 U.S.A. Hay Benefits Report
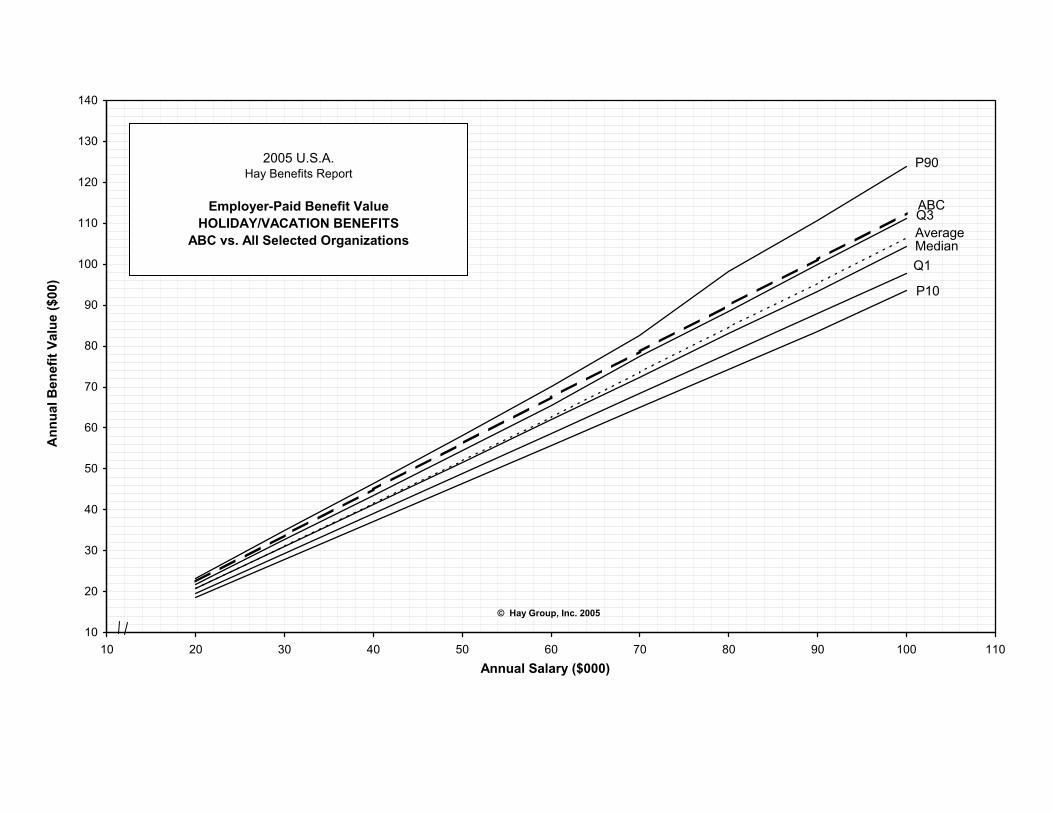
Employer-Paid Benefit ValueHOLIDAY/VACATION BENEFITS
ABC vs. All Selected Organizations
© Hay Group, Inc. 2005
ABC Company vs. All Selected Organizations
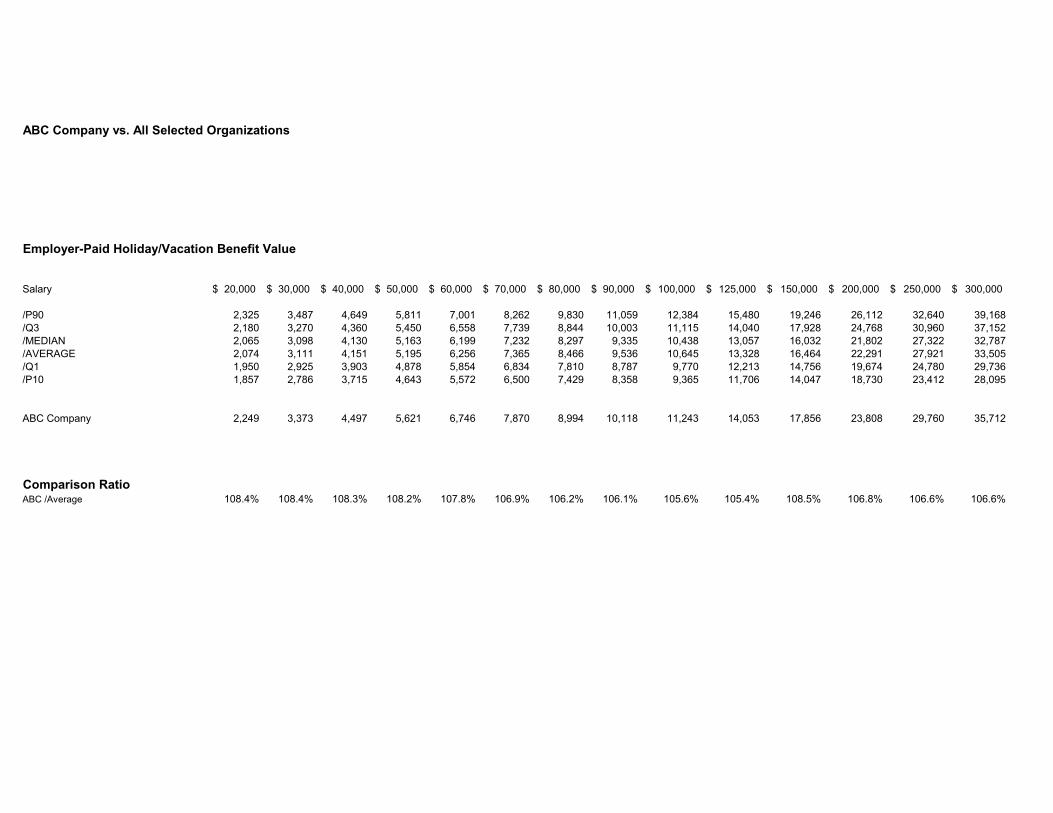
Employer-Paid Holiday/Vacation Benefit Value
Salary 20,000$ 30,000$ 40,000$ 50,000$ 60,000$ 70,000$ 80,000$ 90,000$ 100,000$ 125,000$ 150,000$ 200,000$ 250,000$ 300,000$
/P90 2,325 3,487 4,649 5,811 7,001 8,262 9,830 11,059 12,384 15,480 19,246 26,112 32,640 39,168/Q3 2,180 3,270 4,360 5,450 6,558 7,739 8,844 10,003 11,115 14,040 17,928 24,768 30,960 37,152/MEDIAN 2,065 3,098 4,130 5,163 6,199 7,232 8,297 9,335 10,438 13,057 16,032 21,802 27,322 32,787/AVERAGE 2,074 3,111 4,151 5,195 6,256 7,365 8,466 9,536 10,645 13,328 16,464 22,291 27,921 33,505/Q1 1,950 2,925 3,903 4,878 5,854 6,834 7,810 8,787 9,770 12,213 14,756 19,674 24,780 29,736/P10 1,857 2,786 3,715 4,643 5,572 6,500 7,429 8,358 9,365 11,706 14,047 18,730 23,412 28,095
ABC Company 2,249 3,373 4,497 5,621 6,746 7,870 8,994 10,118 11,243 14,053 17,856 23,808 29,760 35,712
Comparison RatioABC /Average 108.4% 108.4% 108.3% 108.2% 107.8% 106.9% 106.2% 106.1% 105.6% 105.4% 108.5% 106.8% 106.6% 106.6%
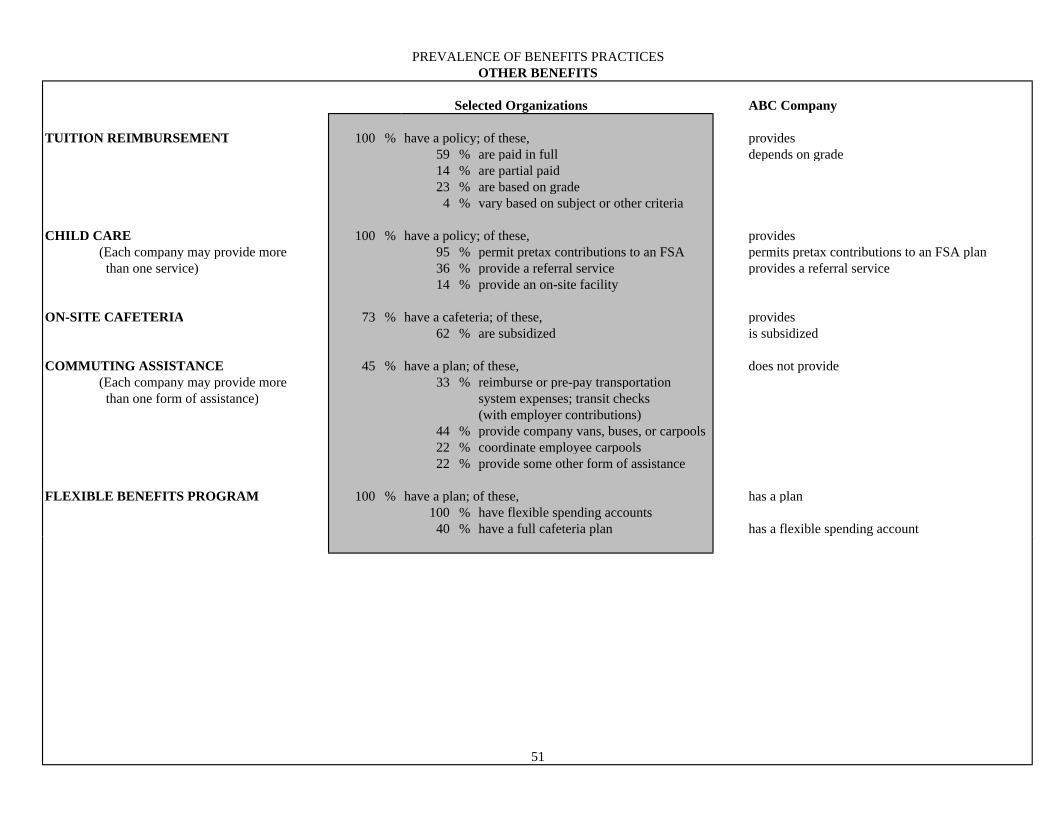
PREVALENCE OF BENEFITS PRACTICESOTHER BENEFITS
Selected Organizations ABC Company
TUITION REIMBURSEMENT 100 % have a policy; of these, provides
59 % are paid in full depends on grade14 % are partial paid 23 % are based on grade
4 % vary based on subject or other criteria
CHILD CARE 100 % have a policy; of these, provides (Each company may provide more 95 % permit pretax contributions to an FSA permits pretax contributions to an FSA plan than one service) 36 % provide a referral service provides a referral service
14 % provide an on-site facility
ON-SITE CAFETERIA 73 % have a cafeteria; of these, provides62 % are subsidized is subsidized
COMMUTING ASSISTANCE 45 % have a plan; of these, does not provide (Each company may provide more 33 % reimburse or pre-pay transportation than one form of assistance) system expenses; transit checks
(with employer contributions)44 % provide company vans, buses, or carpools22 % coordinate employee carpools22 % provide some other form of assistance
FLEXIBLE BENEFITS PROGRAM 100 % have a plan; of these, has a plan100 % have flexible spending accounts
40 % have a full cafeteria plan has a flexible spending account
51
P90
Q3
Median
Average
P10
Q1
ABC
0
1
2
3
4
5
6
7
8
9
10
11
12
10 20 30 40 50 60 70 80 90 100 110Annual Salary ($000)
Ann
ual B
enef
it Va
lue
($00
)
2005 U.S.A. Hay Benefits Report
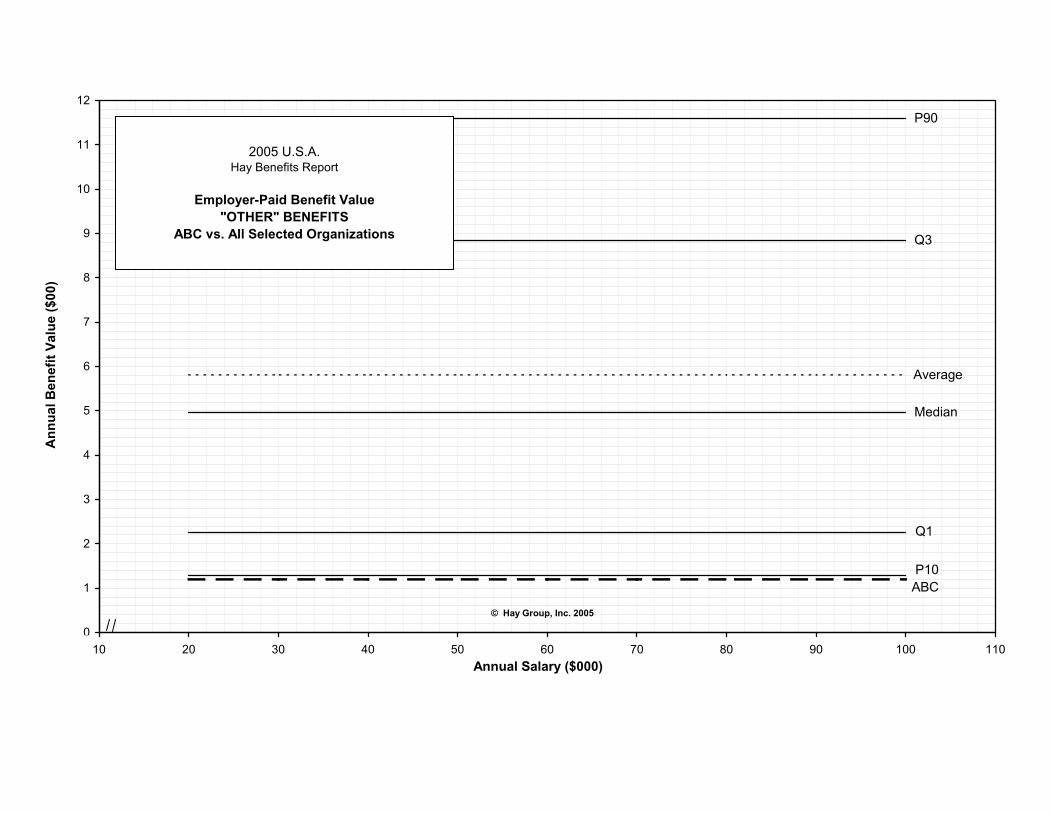
Employer-Paid Benefit Value"OTHER" BENEFITS
ABC vs. All Selected Organizations
© Hay Group, Inc. 2005
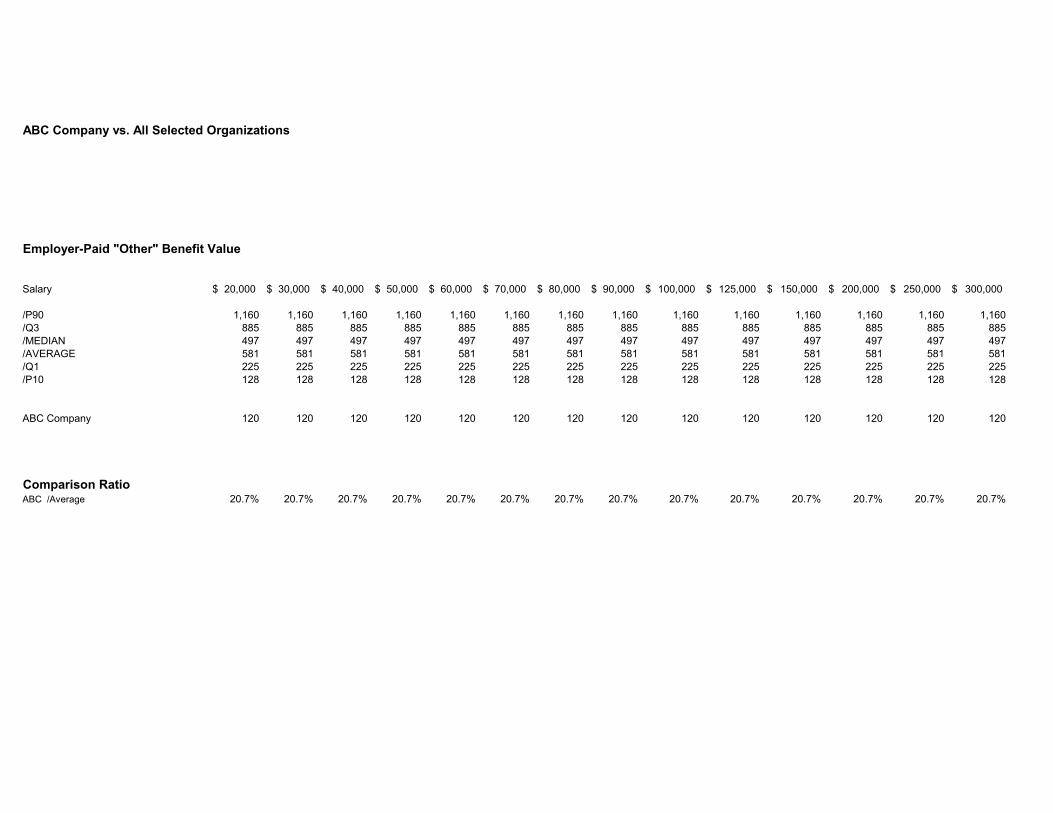
ABC Company vs. All Selected Organizations
Employer-Paid "Other" Benefit Value
Salary 20,000$ 30,000$ 40,000$ 50,000$ 60,000$ 70,000$ 80,000$ 90,000$ 100,000$ 125,000$ 150,000$ 200,000$ 250,000$ 300,000$
/P90 1,160 1,160 1,160 1,160 1,160 1,160 1,160 1,160 1,160 1,160 1,160 1,160 1,160 1,160/Q3 885 885 885 885 885 885 885 885 885 885 885 885 885 885/MEDIAN 497 497 497 497 497 497 497 497 497 497 497 497 497 497/AVERAGE 581 581 581 581 581 581 581 581 581 581 581 581 581 581/Q1 225 225 225 225 225 225 225 225 225 225 225 225 225 225/P10 128 128 128 128 128 128 128 128 128 128 128 128 128 128
ABC Company 120 120 120 120 120 120 120 120 120 120 120 120 120 120
Comparison RatioABC /Average 20.7% 20.7% 20.7% 20.7% 20.7% 20.7% 20.7% 20.7% 20.7% 20.7% 20.7% 20.7% 20.7% 20.7%
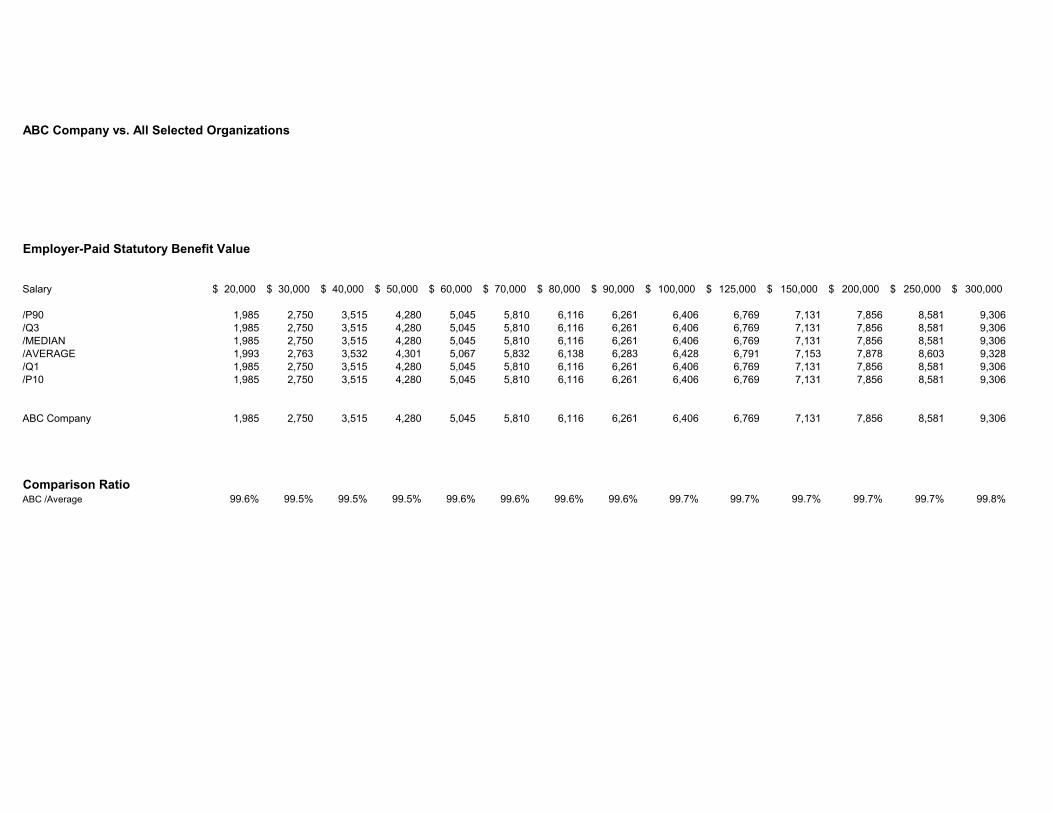
ABC Company vs. All Selected Organizations
Employer-Paid Statutory Benefit Value
Salary 20,000$ 30,000$ 40,000$ 50,000$ 60,000$ 70,000$ 80,000$ 90,000$ 100,000$ 125,000$ 150,000$ 200,000$ 250,000$ 300,000$
/P90 1,985 2,750 3,515 4,280 5,045 5,810 6,116 6,261 6,406 6,769 7,131 7,856 8,581 9,306/Q3 1,985 2,750 3,515 4,280 5,045 5,810 6,116 6,261 6,406 6,769 7,131 7,856 8,581 9,306/MEDIAN 1,985 2,750 3,515 4,280 5,045 5,810 6,116 6,261 6,406 6,769 7,131 7,856 8,581 9,306/AVERAGE 1,993 2,763 3,532 4,301 5,067 5,832 6,138 6,283 6,428 6,791 7,153 7,878 8,603 9,328/Q1 1,985 2,750 3,515 4,280 5,045 5,810 6,116 6,261 6,406 6,769 7,131 7,856 8,581 9,306/P10 1,985 2,750 3,515 4,280 5,045 5,810 6,116 6,261 6,406 6,769 7,131 7,856 8,581 9,306
ABC Company 1,985 2,750 3,515 4,280 5,045 5,810 6,116 6,261 6,406 6,769 7,131 7,856 8,581 9,306
Comparison RatioABC /Average 99.6% 99.5% 99.5% 99.5% 99.6% 99.6% 99.6% 99.6% 99.7% 99.7% 99.7% 99.7% 99.7% 99.8%
Locations Hay North America has offices in the following cities: Worldwide Headquarters Philadelphia The Wanamaker Building 100 Penn Square East Philadelphia, PA 19107-3388 (215) 861-2000
Canadian Headquarters Toronto Standard Life Centre 121 King Street West Suite 700 Toronto, Ontario M5H 3X7 (416) 868-1371
Atlanta (404) 575-8700 Boston (617) 425-4500 Calgary (403) 215-6730 Chicago (312) 228-1800
Dallas (469) 232-3800 Edmondton (708) 415-8021 Kansas City (MO) (816 ) 329-4900 Los Angeles (213) 892-7000
Mexico City (525) 523-2121 Montreal (514) 866-7831 New York Metro (201) 557-8400 Norwalk (203) 750-6200
Ottawa (613) 238-4785 Regina (306) 359-0181 Vancouver (604) 682-4269 Washington, DC, Metro (703) 841-3100
Hay has offices in the following cities outside the U.S.: Athens, Auckland, Bangkok, Barcelona, Berlin, Birmingham, Bogota, Bratislava, Brisbane, Bristol, Brussels, Budapest, Buenos Aires, Caracas, Dubai, Dublin, Frankfurt, Glasgow, Helsinki, Hong Kong, Istanbul, Jakarta, Kuala Lumpur, Lille, Lisbon, London, Lyon, Madrid, Manchester, Melbourne, Mexico City, Milan, Moscow, Munchen, Oslo, Paris, Prague, Rome, Santiago, Sao Paulo, Shanghai, Singapore, Stockholm, Strasbourg, Sydney, Tokyo, Warsaw, Wellington, Windsor, Zeist.