Bench-Scale Development of a Non-Aqueous Solvent … Library/Research/Coal/carbon capture... · 2...
14
RTI International is a trade name of Research Triangle Institute. www.rti.org RTI International Energy Technology Division Bench-Scale Development of a Non-Aqueous Solvent (NAS) CO 2 Capture Process for Coal-Fired Power Plants (DE-FE0013865) Jak Tanthana, Mustapaha Soukri, Paul Mobley, Aravind Rabindran, Thomas Gohndrone, Tom Nelson, Markus Lesemann, James Zhou, and Marty Lail Devin Bostick, Stevan Jovanovic, and Krish Krishnamurthy Linde Andreas Grimstvedt, Solrun Johanne Vevelstad SINTEF Steve Mascaro April 27, 2017 1
Transcript of Bench-Scale Development of a Non-Aqueous Solvent … Library/Research/Coal/carbon capture... · 2...

RTI International is a trade name of Research Triangle Institute. www.rti.org
RTI International Energy Technology Division
Bench-Scale Development of a Non-Aqueous Solvent
(NAS) CO2 Capture Process for Coal-Fired Power
Plants (DE-FE0013865)
Jak Tanthana, Mustapaha Soukri, Paul Mobley, Aravind Rabindran, Thomas
Gohndrone, Tom Nelson, Markus Lesemann, James Zhou, and Marty Lail
Devin Bostick, Stevan Jovanovic, and Krish Krishnamurthy
Linde
Andreas Grimstvedt, Solrun Johanne Vevelstad
SINTEF
Steve Mascaro
April 27, 2017
1

RTI International Energy Technology Division
Non-Aqueous Solvent (NAS) Development Pathway
Previous
WorkDOE ARPA-E Project DOE NETL Project (Current) Future Development
Yr 2009-10 2010-13 2014-15 2016-20 2020+
TRL 1 2 3 4 5 6 7 8 & 9
Proof of
Concept/Feasibility
Pre-Commercial
Demonstration
Lab-scale Development (Previous)
• Solvent screening to identify promising solvent formulations
• Lab-scale evaluation of NAS Process
• Preliminary technical and economic assessments
Large Bench-scale System / Relevant Environment Testing (Current)
•Finalize NAS formulation
•Address evaporative losses and solvent costs
•Develop critical process components
•NAS wash / recovery section
•NAS regenerator
•Bench-scale testing with in a process unit with major process components
•Demonstrate ≤ 2,000 kJt/kg CO2 using bench-scale system
•Detailed solvent degradation and preliminary emissions studies
•Detailed Techno-Economic & EH&S Assessments
•Demonstrate T&EA competiveness and environmental permitability

RTI International Energy Technology Division
R&D Strategic Approach
1 Rochelle, G. T. Amine Scrubbing for CO2
Capture. Science 2009, 325, 1652-1654.
Breakdown of the Thermal Regeneration Energy Load
Sensible Heat Heat of
Vaporization
Heat of
Absorption
Reboiler
Heat
Duty
SolventCp
[J/g K]
Dhabs
[kJ/mol]
Dhvap
[kJ/mol]
Xsolv
[mol solv./
mol sol’n]
Da
[mol CO2/
mol
solv.]
Reboiler Duty
[GJ/tonne
CO2]
MEA (30%) 3.8 85 40 0.11 0.34 3.22
Lower Energy
Solvent System
NAS 1.3 65 1 0.3 0.3 1.71
Path to Reducing ICOE and Cost
of CO2 Avoided Primarily focus on reducing energy
consumption – reboiler duty
Reduce capital expenditure
Simplify process arrangement
Materials of construction
Limit operating cost increase
For NAS, heat of vaporization of water becomes a
negligible term to the heat duty
Process capable of achieving these criteria will have a
lower energy penalty than SOTA processes

RTI International Energy Technology Division
Project Objectives and Technical Challenges
4
• Address specific challenges facing
technical and economic potential
• Bench-scale demonstration of the potential
to reduce the energy penalty to <2,000
kJt/kg of CO2 captured
Specific Challenges• Minimize solvent losses and make-up
• Solvent degradation and emission studies
• Develop and evaluate process
modifications
• Bench-scale evaluation of the NAS CO2
capture process
Timeframe: 10/1/13 to 03/30/15 (BP1, 18
months) 04/1/15 to 06/30/16 (BP2, 15
months)
Cost: $1.51 M BP1, $1.55 M BP2
Objective: Continue the advancement of the NAS CO2 Capture Process
RTI NAS Solvent

RTI International Energy Technology Division
5
Brief Recap of BP1 Achievements
BP1 Achievements Select Points
Incorporated non-volatile hydrophobic diluent with
suitable properties
• Vapor pressure <0.13 kPa, 25°C
• Low cost
• Low viscosity (~2 cP)
Formulated diluent with hydrophobic amines • Low heats of absorption
• No precipitates
• Low viscosities (25-30 cP rich)
• Reasonable CO2 capacity
• Cost is <$50/kg
Demonstrated emissions of NAS below 10 ppm • Designed wash section at lab scale
• ~20 ppm emitted without wash section
Performed long-term evaluation of NAS at lab scale
with simulated flue gas containing 13.3% CO2, 7.5%
H2O, 2% O2, 50 ppm SO2, and balance N2
• Capture efficiency (~90%)
• Long-term, stable operation demonstrated (~100
hrs)
Completed long-term thermal and oxidative
degradation studies at SINTEF
• Five week evaluations
• Single components of diluent are thermally stable
• Carbamate polymerization products not formed
• Corrosion results promising (Fe, Ni, Cr)
• Eliminated one NAS amine due to severe
oxidative degradation
RTI International Energy Technology Division
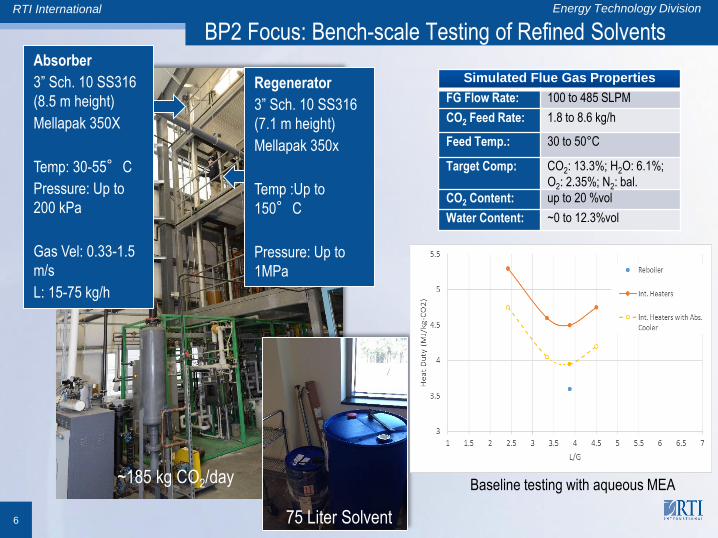
BP2 Focus: Bench-scale Testing of Refined Solvents
6
Simulated Flue Gas Properties
FG Flow Rate: 100 to 485 SLPM
CO2 Feed Rate: 1.8 to 8.6 kg/h
Feed Temp.: 30 to 50°C
Target Comp: CO2: 13.3%; H2O: 6.1%;
O2: 2.35%; N2: bal.
CO2 Content: up to 20 %vol
Water Content: ~0 to 12.3%vol
~185 kg CO2/day
Absorber
3” Sch. 10 SS316
(8.5 m height)
Mellapak 350X
Temp: 30-55° C
Pressure: Up to
200 kPa
Gas Vel: 0.33-1.5
m/s
L: 15-75 kg/h
Regenerator
3” Sch. 10 SS316
(7.1 m height)
Mellapak 350x
Temp :Up to
150° C
Pressure: Up to
1MPa
75 Liter Solvent
Baseline testing with aqueous MEA

RTI International Energy Technology Division
7
Bench Scale Test Unit Results with Dry Flue Gas
Experimental Conditions
Feed Composition:
15.4% CO2
Balance N2.
100 SLPM
Liquid flows: 0.8-1.9 kg/min
Gas Flows: 0.1-0.21 kg/min
Regenerator Pressure 2.5 bar
90% CO2 capture efficiency
NAS-1
Absorber: 40° C
Regenerator: 115° C
Interstage Heater Regeneration
NAS-2
Absorber: 37-40° C
Regenerator: 120-122° C
Interstage Heater Regeneration
• Working capacities were lower than anticipated, ~0.15-0.21 moles CO2/ mole amine for NAS-1
• Improved slightly for NAS-2 due to slightly lower absorber temperature and higher regenerator temperature
• Still higher than expected based on theoretical values and not a major improvement over other technologies
• Early in our experience at operating the NAS system

RTI International Energy Technology Division
Impact of Water
8
• Measured heat of absorption of dry NAS-2 vs. “wet”
NAS-2 at 120° C
• Observed increase in heat of absorption when NAS
was saturated with water at 120° C
• Expect reboiler duty would go up due to higher Dhabs
• Impact on the process is that [water] may need to be
kept low. Water becomes separate phase > ~9 wt%
• Increasing the hydrophobicity of the solvent chemistry
was thought to be one way to handle
20
30
40
50
60
70
80
90
100
110
0 0.1 0.2 0.3 0.4 0.5Heat
of
absorp
tion (
kJ/m
ol C
O2)
CO2 loading (molCO2/molamine)
0 wt% water-NAS 5wt% water-NAS
10wt% water-NAS
• Observed impact on enthalpy of reaction in
earlier NAS formulation
• Measurements at 40° C
• Concentration of water at 10% raised heat of
absorption substantially
• Concerns about this impact on reboiler heat
duty
Earlier work

RTI International Energy Technology Division
Bench Scale Test Unit Results with Wet Flue Gas
9
• 100 hr test with wet flue gas
• Feed composition
o 15.4% CO2
o 7% H2O
o balance of air
• No water separators
• Water in solvent controlled by absorber
temperature profile
Concentration of Water in Solvent
NAS-1
Absorber: 40-36° C
Regenerator: 115 - 95° C
Regenerator Pressure: 2.5-3.75 bar
Interstage Heater Regeneration
NAS-2
Absorber: 37-40° C
Regenerator: 100-105° C
Regenerator Pressure: 2.5 bar
Interstage Heater Regeneration

RTI International Energy Technology Division
[Amine] (mol/m3)
0 1000 2000 3000 4000 5000
kov(1
/s)
102
103
104
105
106
Exp_22 C
Exp_26 C
Exp_30 C
Exp_35 C
Exp_55 C
Exp_80 C
Predicted_22 C with 7.6wt% H2O
Predicted_26 C with 7.6wt% H2O
Predicted_30 C with 7.6wt% H2O
Predicted_35C with 7.6wt% H2O
Predicted_55 C with 7.6wt% H2O
Predicted_80 C with 7.6wt% H2O
30wt% MEA_22 C (Abudheir et al., 2003)
30wt% MEA_26 C (Abudheir et al., 2003)
30wt% MEA_30 C (Abudheir et al., 2003)
30wt% MEA_35 C (Abudheir et al., 2003)
30wt% MEA_55 C (Abudheir et al., 2003)
30wt% MEA_80 C (Abudheir et al., 2003)
Reaction Kinetics
10
• In the absence of water kinetics are substantially slower than MEA
• With water, kinetics are approximately 2 times slower than MEA
• Ramifications
o NAS requires higher absorber column to capture 90% CO2 than 30wt% MEA
o Process modelling of NAS showed a need for intercoolers to attain equilibrium
o Use promoter to improve kinetics
3 amine + 2 CO2 + H2O⬌AmineCO- + 2AmineH+ +HCO3-
• CPA-102 Calorimeter
• Stirred cell reactor
• Falling pressure drop
method
• 260 mL reactor volume
• 22.6 cm2 interfacial area
• T=298-353K
• PCO2= 4.48-6.29 kPa
• 100 mL solvent volume
• Kierzkowska-Pawlak et al.,
2014, Int. J. Greenhouse
Gas Control., 24, 106-114
RTI International Energy Technology Division
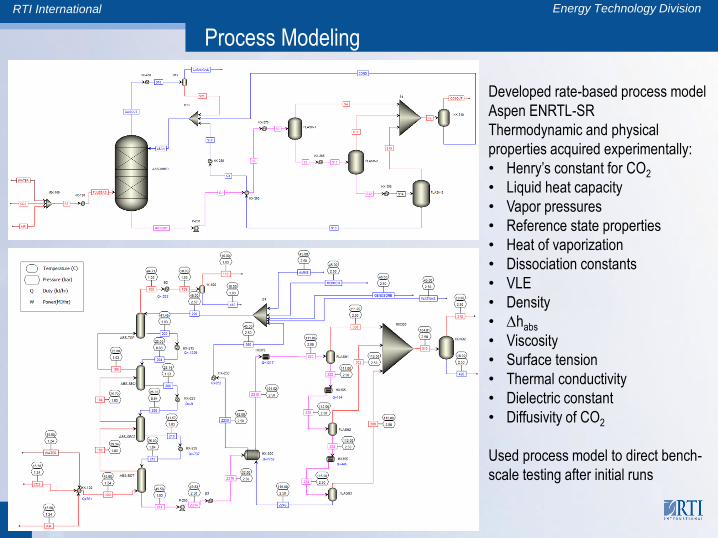
Process Modeling
11
Developed rate-based process model
Aspen ENRTL-SR
Thermodynamic and physical
properties acquired experimentally:
• Henry’s constant for CO2
• Liquid heat capacity
• Vapor pressures
• Reference state properties
• Heat of vaporization
• Dissociation constants
• VLE
• Density
• Dhabs
• Viscosity
• Surface tension
• Thermal conductivity
• Dielectric constant
• Diffusivity of CO2
Used process model to direct bench-
scale testing after initial runs

RTI International Energy Technology Division
Impact of Intercooler Temperatures on Reboiler Duty
12
L/G (mass/mass)
4 6 8 10 12 14 16
Reb
oil
er D
uty
(M
J/k
gC
O2
)
1.0
1.5
2.0
2.5
3.0
NAS-2_Exp with ICs (Abs.Temp 40o C)
NAS-2_wet_Exp with ICs (Abs.Temp 36o C)
NAS-2_Exp with ICs (Abs.Temp 32o C)
Model_NAS-2 with ICs (ABS-40oC)
Model_NAS-2 with ICs (ABS-36oC)
Model_NAS-2 with ICs (ABS-32oC)
• Impact of temperature on
absorber bottom
• Modeled 40-32° C
• Lower temperature
• Lower L/G
• Lower reboiler duty
• Guided BsTU experiments at
lower absorber temperatures
• Observed lower reboiler duties
experimentally
• Will continue to investigate
moving forward
Conditions for Experimental Data
NAS-2
• Absorber: 37-40° C
• Regenerator: 87-98° C
• Pressure: 2.5 bar
• Interstage Heater
Regeneration

RTI International Energy Technology Division
Techno-Economic Analysis
1
3
Case 11_2011 Case 12_2011 NAS2-2.5 bar NAS2-3.6 bar NAS3-3.6 bar
No Capture w/ MEA
Net Plant HHV Efficiency (% ) 39.3% 28.4% 31.10% 32.00% 32.90%
Total Plant Cost ($/kW) 2,451 4,391 3,956 3,826 3,674
Annual ($/y) 104,594,992 144,512,589 131,245,575 129,556,370 125,614,892
Total ($/MWh) 80.94 147.33 137.41 134.05 130.76
ICOE (% ) 0% 82% 70% 66% 62%
CO2 Captured (tonne/MWh) 1.00 0.94 0.89 0.85
CO2 Avoided (tonne/MWh) 0.69 0.71 0.70 0.70
CO2 Capture Cost ($/tonne) 66.7 59.8 59.9 58.7
CO2 Capture Cost excl. TS&M
($/tonne) 56.55 49.23 48.64 46.97
CO 2 Avoided Cost ($/tonne) 96.0 80.0 74.1 73.0
CO2 Capture Summary
Capital Investment (Total Installed Costs) 1000 $
Power Performance
Operating and Maintenance Costs
COE Determination

RTI International Energy Technology Division
Summary of BP2 Testing and Next Steps
14
• With Linde, performed testing of NAS solvents in bench-scale test unit at 75-150 liter
solvent scale using simulated flue gas
• Under dry conditions, measured reboiler heat duties as low as 2.4 GJ/tonCO2 but did not
realize duties as low as anticipated
• Under wet conditions, measured reboiler heat duties 1.6-1.9 GJ/tonCO2 under
conditions with regenerator operating at temperature less than 100° C
• Measured kinetics of CO2 absorption and observed the rate constants of the wet solvent to
be approximately 2 times slower than 30% aqueous MEA, with the kinetics of the dry
solvent being substantially slower
• Developed rate-based ASPEN process model that matches well with experiment and used
it to direct experiments
• Performed techno-economic analysis which shows potential of NAS process for lowering
cos of CO2 capture to ~$47/ tonCO2 (excluding TS&M costs)
• Completed long-term (five week) degradation testing at SINTEF on simulated flue gas
showing that NAS is stable relative to aqueous MEA and is less corrosive