Ben farber's design portfolio 2017
14
PORTFOLIO: BEN FARBER Begin Exploring
-
Upload
att-adworks -
Category
Design
-
view
59 -
download
1
Transcript of Ben farber's design portfolio 2017

P O R T F O L I O : B E N F A R B E R
Begin Exploring

Benjamin Farber | Design Portfolio © 2016 1
Introduction
I firmly believe in inventive curiosity and strive to add creative thinking that produces insightful work. At heart I am a visual storyteller.
– Strong strategic thinker with iterative design capabilities
– Adept at expressing conceptual ideas while remaining on brand
– Extensive brand building and corporate identity experience
– Ability to juggle multiple priorities and work streams
– Highly proficient with Adobe CC/CS6, and Microsoft Office on the Mac and PC
– Avid interest in what’s new and happening in technology, fashion, design, and beyond
Design is an iterative process of appropriating ideas and distilling concepts — And through this process of creative elimination an idea becomes further synthesized and visually refined until the concept is made into clear tangible communications. Ultimately I try to create a visual solution that satisfies the objectives of both the client and the end user.
My values can be summed up in my motto Live. Work. Grow
– Live with integrity — I try to abide by the truism "say what you mean, and mean what you say."
– Work with purpose — however make time for creative exploration. Stretch your imagination.
– Grow learn new ways — Life is a journey... Read, listen, think about the world.
Introduction p. 1
S&P Global Ratings 2-3
Oppenheimer Funds 4-5
J.P. Morgan 6-8
Neuberger Berman 9
BNY Mellon 10-12
Additional Work 13-15

Benjamin Farber | Design Portfolio © 2016 2
S&P Global Ratings
Insights MagazineBackground: Insights Magazine, was a large thought leadership publication featured at Paris Climate Change Conference 2015 for S&P Global Ratings. Role: I designed the second volume, I was responsible for pre-press and print production, which included developing an existing vendor relationship. This project required editing and complex infographic development. I collaborated with the Associate Creative Director and other key stakeholders. Outcome: Publication led to an increase in website traffic of 15,000 visitors in the following months. Learn More >
Introduction p. 1
S&P Global Ratings 2-3
Oppenheimer Funds 4-5
J.P. Morgan 6-8
Neuberger Berman 9
BNY Mellon 10-12
Additional Work 13-15
>

Benjamin Farber | Design Portfolio © 2016 3
Emblem Health Insurance Plan (NY Operations Only)1 –35.3
Oscar Insurance Corporation–27.6
Capital District Physicians’ Health Plan, Inc.–4.1
Excellus Health Plan, Inc.–4.1
Freelancers Insurance Company Inc. –0.4
HealthNow New York Inc.1.7
Independent Health Benets Corporation4.1
Empire HealthChoice HMO, Inc. (NY Operations Only — Part of Anthem Inc.)3
5.5
Health Republic Insurance of New York Corp.–35.2
UnitedHealthcare (NY Operations Only)2
–35.3
North Shore LIJ CareConnect Insurance Company Inc.–23.0
MVP Health Plan, Inc.–10.1
Note: Data is for individual business only (does not include gains/loss or enrollment for Medicaid). Information is unavailable for: A�nity, Fidelis, HealthFirst, MetroPlus Health Plan1. Group Health Incorporated, HEALTH INSURANCE PLAN OF GREATER NEW
YORK, HIP INSURANCE COMPANY OF NEW YORK2. OXFORD HEALTH INSURANCE, INC., Oxford Health Plans (NY), Inc.,
UnitedHealthcare Insurance Company of New York, UnitedHealthcare of New York, Inc.
3. Empire HealthChoice Assurance, Inc., EmpireHealthChoice HMO, Inc.
Source: Standard & Poor’s Ratings Services Copyright ©2016 by Standard & Poor’s Financial Services LLC. All rights reserved. STANDARD & POOR’S and S&P are registered trademarks of Standard & Poor’s Financial Services LLC. The analyses, including ratings, of Standard & Poor’s and its a�liates are opinions and not statements of fact or recommendations to purchase, hold, or sell securities. They do not address the suitability of any security, and should not be relied on in making any investment decision. Standard & Poor’s does not act as a duciary or an investment advisor except where registered as such.
$–1,271
$–644
$–407
$–1,628
$–2,395
$–1,014
$–432
$76
Inde
pend
ent H
ealth
Ben
ets
Corp
orat
ion
Hea
lthN
ow N
ew Y
ork
Inc.
Free
lanc
ers
Insu
ranc
e Co
mpa
ny In
c.
Exce
llus
Hea
lth P
lan,
Inc.
Capi
tal D
istr
ict P
hysi
cian
s’ H
ealth
Pl
an, I
nc.
MV
P H
ealth
Pla
n, In
c.
Nor
th S
hore
LIJ
Care
Conn
ect
Insu
ranc
e Co
mpa
ny In
c.
Osc
ar In
sura
nce
Corp
orat
ion
Hea
lth R
epub
lic In
sura
nce
of
New
Yor
k Co
rp.
Uni
tedH
ealt
hcar
e (N
Y O
pera
tions
Onl
y)2
Embl
em H
ealth
Insu
ranc
e Pl
an
(NY
Ope
ratio
ns O
nly)
1
Empi
re H
ealth
Choi
ce H
MO
, Inc
.(N
Y O
pera
tions
Onl
y —
Par
t of A
nthe
m In
c.)3
2014 INDIVIDUAL SEGMENT OPERATING PERFORMANCE AND ENROLLMENT
27,804
54,890
86,414
16,933
37,863
9,578
54,984
885
71,868
4,035
4,588 3,375
Gains/Loss per Member
2014 Enrollment — Individual Segment
$1,222
$360
$–266
Note: Data based on publically available statutory nancial statements. Statements were available for only 12 of the 16 insurers in the marketplace
$–74
-35-30
-20
-10
-5
0
510
-25
-15
NEW YORK INSURER UNDERWRITING GAIN/LOSS ON INDIVIDUAL BUSINESSNew York ranks among the top states in the country in terms of population, insured rates, and number of insurers in the marketplace. The state saw a decline in the uninsured rate as a result of ACA implementation. However, most of New York’s health insurers operating on the state exchange generated underwriting losses on their individual business.
2014 UNDERWRITING GAIN/LOSS INDIVIDUAL SEGMENT ($ IN MIL.) Based on statutory data
Petroleo Brasileiro S.A.Environmental, Social & Governance Assessment
– Environmental Risks: Significant, due to the possibility for oil spills and exposure to non-compliance fines and lawsuits
– Social Risks: Moderate, given investments in communities where they operate
– Management & Governance: Weak, in light of corruption investigations on company’s ties to Brazilian government
C O NF ID EN T I A L D R A F TF O R D IS C U S S I O N P UR P O S ES O NLY
S&P Global RatingsBackground: In early 2015 a global rebranding effort was undertaken, the companies of S&P Global were merged. Role: As a design consultant for S&P Global Ratings, I was involved in designing numerous marketing collateral projects in the new brand system. I developed and executed a wide range of collateral projects which involved art direction, data visualization and targeted thematic photo research. (2015–2016).
S&P Global Ratings
Introduction p. 1
S&P Global Ratings 2-3
Oppenheimer Funds 4-5
J.P. Morgan 6-8
Neuberger Berman 9
BNY Mellon 10-12
Additional Work 13-15
>

Benjamin Farber | Design Portfolio © 2016 4
OppenheimerFunds
OppenheimerFundsRole: I worked within the marketing group as a freelance graphic designer. Delivered solutions that supported the visual and creative development of the brand for the Creative Services group, including infographics, thematic front-end photographic UI assets, brochures and other print collateral.
Portfolio ConsultingServices
For Institutional Use OnlyNot for Use with Retail InvestorsNot FDIC InsuredMay Lose ValueNot Bank Guaranteed
II
OppenheimerFunds Portfolio Consulting Group
A team of seasoned investment professionals with extensive backgrounds in investment manager research, portfolio construction, asset allocation and portfolio risk management. Our Portfolio Consulting Group has years of experience in providing a multi-faceted unbiased review of investment models, focusing on manager selection, portfolio construction, and how those aspects impact the overall model.
OppenheimerFunds®
The TeamPete Novak Director, Platform Analytics and Portfolio Consulting Group 19yrs. Industry Experience/ OppenheimerFunds since 2010
Tom Landhauser Portfolio Analyst XXyrs. Industry Experience/ OppenheimerFunds since XXXX
Bill McNamara Portfolio Analyst XXyrs. Industry Experience/ OppenheimerFunds since XXXX
Michael Radon Portfolio Analyst 9yrs. Industry Experience/ OppenheimerFunds since 2015
1
The Right Way to Invest
We add value to your business by providing unbiased, sophisticated insight into your investment model’s strengths, weaknesses and exposures through the application of industry leading technology and analytical analysis by our investment professionals.
Key Areas of Focus
• Portfolio Positioning and Asset Allocation Review
• Scenario Analysis and Stress Testing • Diversification Study — overlap, correlation
analysis, manager interaction• Holdings and Returns-Based
Characteristics Review• Risk Analysis — risk-adjusted performance
assessment, risk factor and ratio analysis
• Historical Performance Reviews• Investment Manager Contribution Analysis• Peer Universe Study — relative
performance, manager characteristics, consistency of returns
• Exposure Analysis — active and absolute exposures
Multi-Faceted Review
Advisor Portfolio
UnbiasedInsight
PortfolioAnalysis
Individual ManagerAnalysis
ManagerAttributionAnalysis
Introduction p. 1
S&P Global Ratings 2-3
Oppenheimer Funds 4-5
J.P. Morgan 6-8
Neuberger Berman 9
BNY Mellon 10-12
Additional Work 13-15
>

Benjamin Farber | Design Portfolio © 2016 5
The Search for Tomorrow’s Leaders—International Small-Cap EquitiesSmall-cap companies drive a surprisingly large share of global equity returns. Yet many equity investors tend to use a single international equity large-cap portfolio for their broad international exposure. This rapidly growing and attractively priced universe offers the potential for dramatic growth with compelling risk-adjusted returns.
1. Source: Morningstar Direct as of 6/30/15. Foreign Large Cap Funds consists of all funds in the Morningstar Foreign Large Growth, Value and Blend categories and Foreign Small-Mid-Cap funds consists of all funds in the Morningstar Small/Mid Growth, Value and Blend funds.
2. Morningstar and FactSet as of 6/30/15. Fund allocation is based on the % of assets in micro and small stocks. Index allocation is based on companies with market capitalizations under $5B.3. Source: Bloomberg. Data as of 6/30/15.4. Source: Morningstar. Calendar-year standard deviation as of 6/30/15. Small caps, mid caps and large caps are those of the MSCI ACWI ex-USA Small, MSCI ACWI ex-USA Mid and MSCI ACWI ex-USA Large Cap Indices, respectively. It is not possible to invest
directly in an index. Small-cap stocks can be a more volatile investment opportunity relative to large-cap stocks. The MSCI ACWI ex-USA Small Cap Index, MSCI ACWI ex-USA Mid Cap Index and MSCI ACWI ex-USA Large Cap Index are designed to measure the equity market performance of small capitalization, mid capitalization and large capitalization, developed and emerging markets, excluding the United States, respectively. The indices are unmanaged and cannot be purchased directly by investors. Index performance is shown for illustrative purposes only and does not predict or depict the performance of the Fund. Past performance does not guarantee future results.
5. Source: Morningstar. Sharpe Ratio for the MSCI ACWI ex-USA Small, MSCI ACWI ex-USA Mid and MSCI ACWI ex-USA Large Cap Indices, respectively, as of 6/30/15. Sharpe Ratio: A risk-adjusted measure that measures reward per unit of risk. The higher the Sharpe Ratio, the better. The numerator is the difference between the portfolio’s annualized return and the annualized return of a risk-free instrument. The denominator is the portfolio’s annualized standard deviation (population).
Quick Facts
Market Cap $3.8T $8.2T2000 2015
22,910 35,210Companies
Investors are predominantly using only a large-cap fund...
Average Annual Standard Deviation 2000–2015
….and may be missing out
0.0
0.1
0.2
0.3
0.4
Small CapsMid CapsLarge Caps
Sha
rpe
Rat
io
Small CapsMid
Caps
Large Caps
Universe of International Small Caps (companies under $5B USD) Continues to Grow
Investors May Be Underexposed to Smaller Companies Outside the U.S.1
The Perception that International Smaller Companies Are Much More Volatile Isn’t the Reality4
International Small Caps Have Contributed 41% to Non-U.S. Equity Returns2
Smaller Companies Outside the U.S. Have Posted Compelling Risk-Adjusted Performance 2000–20155
Small Cap Doesn’t Mean Small Universe3
So What Is Driving this Growth?93% 95%
0
20
40
60
80
100%
Current Assets 1-Year Flows
� Foreign Small- Mid Cap Funds
� Foreign Large- Cap Funds
1-Year Flows and Current Assets1
Perc
ent T
otal
(%)
Tota
l Ret
urn
(%)
41% 0
20
40
60
80
100%
Contribution to Return
Contribution to Cumulative Return: 2000-2015
� Companies Over $5B
� Companies Under $5B
Companies Under $5B
Technological Leadership and Change
Revolutionary Business Models and Ideas
Institutional and Regulatory Progress
Small Caps
19.0
Mid Caps
18.3
Large Caps
17.8
OppenheimerFunds
OppenheimerFundsRole: As a design consultant, I provided solutions that supported the visual and creative development of the brand for the Creative Services group. Work included infographics and thematic front-end photographic UI assets as well as brochures and other print collateral.
– Conceptualized and designed print and web assets
– Worked on a variety of projects that integrate digital and graphic design
– Collaborated with stakeholders and production design colleagues
Introduction p. 1
S&P Global Ratings 2-3
Oppenheimer Funds 4-5
J.P. Morgan 6-8
Neuberger Berman 9
BNY Mellon 10-12
Additional Work 13-15
>

Benjamin Farber | Design Portfolio © 2016 6
J.P. Morgan
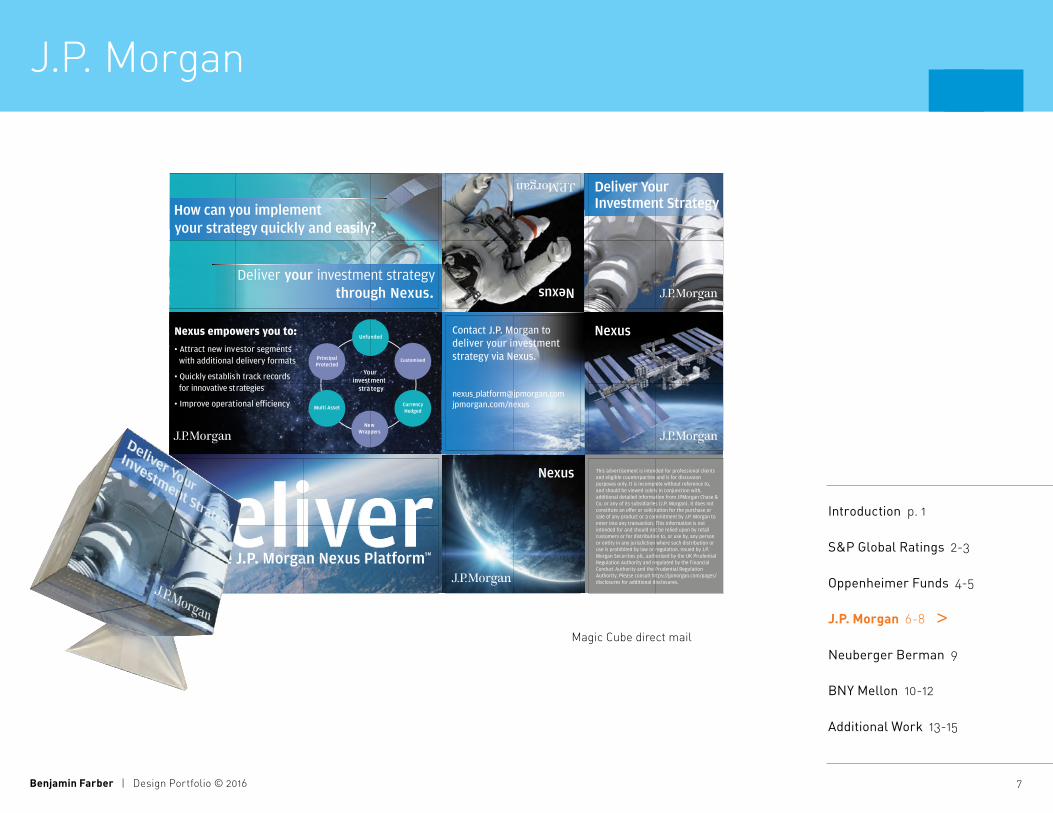
J.P. Morgan Corporate Investment Banking GroupBackground: Develop marketing collateral which would highlight to products offered to FA and Analysts Role: While at J.P. Morgan I consulted for the Corporate and Investment Banking group. As a creative consultant, I was responsible for developing multi-channel marketing campaigns and print collateral. I focused primarily on the Markets, FX and Equities businesses. I worked closely with the Creative Director and CMO of the group as well as internal and overseas colleagues, designing targeted on brand marketing campaigns.
Overview brochure
Introduction p. 1
S&P Global Ratings 2-3
Oppenheimer Funds 4-5
J.P. Morgan 6-8
Neuberger Berman 9
BNY Mellon 10-12
Additional Work 13-15
>
Benjamin Farber | Design Portfolio © 2016 7
Nexus Delivered: marketing suite 04/16/15
Pull-up banner
image area 96 x 96px type area 96 x 294px
Native Word format, preferred Outlook .OTF format
Deliver with the J.P. Morgan Nexus PlatformSM
jpmorgan.com/nexus
rendering actual
Magic Cube: direct mail
email signature
Magic Cube direct mail
J.P. Morgan
Introduction p. 1
S&P Global Ratings 2-3
Oppenheimer Funds 4-5
J.P. Morgan 6-8
Neuberger Berman 9
BNY Mellon 10-12
Additional Work 13-15
>

Benjamin Farber | Design Portfolio © 2016 8
Pull-up floor banner
J.P. Morgan
Introduction p. 1
S&P Global Ratings 2-3
Oppenheimer Funds 4-5
J.P. Morgan 6-8
Neuberger Berman 9
BNY Mellon 10-12
Additional Work 13-15
>

Benjamin Farber | Design Portfolio © 2016 9
Neuberger Berman
Role: I worked within the Marketing Operations group, took creative responsibility for projects involving branding, corporate identity, marketing and sales materials (presentations, brochures, sell sheets, web content) from concept through production. Actively contributed to new work, and opportunities to extend the brand, working cohesively with other members of the creative teams.
2Q2014
CLASS A: NSTAX INSTITUTIONAL CLASS: NSTLX
Strategic Income Fund
Please contact us at 877.628.2583 or visit www.nb.com.
The New Core: A Flexible Fund Designed for All MarketsSerious investors need to take action to meet the challenges facing today’s “core” bond funds: heightened investor sensitivity to income, evolving central bank policies, and unexpected vulnerabilities plaguing established firms. The Neuberger Berman Strategic Income Fund is a multi-sector fixed income bond fund designed to deliver high income and solid long-term risk-adjusted returns.
Highly DiversifiedThe inclusion of all sectors across the fixed
income spectrum may allow for greater
opportunities to deliver compelling results.
Investing in income-producing assets from
a variety of fixed income market segments
may potentially reduce portfolio volatility.
Source: Morningstar. Past performance is no guarantee of future results. The portfolio composition, strategy and fees and expenses of the Fund may differ from other funds in the Category so the performance of the Fund may differ from the overall Category’s performance. This chart is not indicative of the Fund’s performance during all periods—for this information, please see standard performance on the next page.
-10%
-5%
0%
5%
10%
Rising Interest Rates(3/04–7/06)
Falling Interest Rates(6/07–12/08)
Great Recession(12/07–6/09)
High Market Volatility(9/07–12/11)
Fed Tapering(5/13–6/14)
Return
7.26%
4.46%2.29%
-8.90%
6.08%
-3.13%
8.86%
5.27%
3.08% 3.38%
NSTLX
Morningstar Multi-Sector Bond Category Average
The Fund has delivered consistently strong
results, despite having had to weather
some of the market’s most volatile periods.
In addition, the Fund has delivered a
consistent stream of income despite the
persistent low interest rate environment
over the past five years.
Consistently Strong PerformanceWhile the Fund uses an expanded
investment universe to deliver
competitive performance, the
Fixed Income team’s robust risk
management process seeks to
align the risk profile with that of
traditional taxable bond funds.
Risk Controlled
NSTLX HAS OUTPERFORMED THROUGH VARIOUS MARKET ENVIRONMENTS
An investor should consider the Fund’s investment objectives, risks and fees and expenses carefully before investing. This and other important information can be found in the Fund’s prospectus and summary prospectus, which you can obtain by calling 877.628.2583. Please read the prospectus and summary prospectus carefully before making an investment. Investments could result in loss of principal.
Because the Fund had a different goal and strategy, which included managing assets by an asset allocation committee, prior to February 28, 2008, its performance during that time might have been different if current policies had been in effect.
Unless noted, results are shown on a “total return” basis and include reinvestment of all dividends and capital gains distributions. Index returns do not reflect any fees, expenses or sales charges.
Shares in the Fund may fluctuate based on interest rates, market condition, credit quality and other factors. In a rising interest rate environment, the value of an income fund is likely to fall. Lower-rated debt securities (also known as “junk bonds”) involve greater risks and may fluctuate more widely in price and yield, and carry a greater risk of default, than investment-grade debt securities. They may fall in price during times when the economy is weak or is expected to become weak. Foreign securities involve risks in addition to those associated with comparable U.S. securities,
including exposure to less developed or less efficient trading markets; social, political or economic instability; fluctuations in foreign currencies; nationalization or expropriation of assets; settlement, custodial or other operational risks; and less stringent auditing and legal standards. These risks may be more pronounced for emerging market securities, which involve additional risks and may be more volatile and less liquid than foreign securities tied to more developed economies. The Fund’s performance could be affected if borrowers pay back principal on certain debt securities, such as mortgage- or asset-backed securities, before or after the market anticipates such payments, shortening or lengthening their duration.
The Fund may also invest in senior loans and other debt securities, which also may be rated below investment grade. No active trading market may exist for many loans, loans may be difficult to value and many are subject to restrictions on resale, which may also prevent the Fund from obtaining the full value of a loan when sold. Loans and other debt securities are also subject to interest rate risk and floating-rate loans may be more susceptible to adverse economic and business conditions and other developments affecting the issuers of such loans, which could reduce demand for such loans. The Fund normally executes an above-average amount of fixed-income trading and has a high portfolio turnover rate, which may increase the Fund’s transaction costs and may adversely affect the Fund’s performance.
The Fund may invest in Underlying Funds, including funds in the Neuberger Berman fund family, and a portion of the Fund’s investment performance will be directly related to the investment performance, risks and expenses of such Underlying Funds, which could result in the duplication of certain fees, including management and administration fees.
Morningstar Multi-Sector Bond Category funds seek income by diversifying their assets across several fixed income sectors, including U.S. government obligations, foreign bonds and high-yield domestic debt securities.
The Barclays U.S. Aggregate Bond Index represents securities that are U.S. domestic, taxable and dollar-denominated. The Index covers the U.S. investment-grade, fixed-rate bond market, with index components for government and corporate securities, mortgage pass-through securities and asset-backed securities.
The “Neuberger Berman” name and logo are registered service marks of Neuberger Berman Group LLC. “Neuberger Berman Management LLC” and the individual Fund names in this piece are either service marks or registered service marks of Neuberger Berman Management LLC.
EXPERIENCED MANAGEMENT
Led by Andrew Johnson, CIO Global Investment Grade Fixed Income, the Fund’s portfolio managers average 26 years of investment experience and leverage the entire 100+ member fixed income investment team.
Brad Tank 32 Years of Industry Experience
Thanos Bardas 16 Years of Industry Experience
David M. Brown 23 Years of Industry Experience
Thomas J. Marthaler 32 Years of Industry Experience
Andrew Johnson25 Years of Industry Experience
INVESTMENT PERFORMANCE (ANNUALIZED AS OF 6/30/14)
Qtr YTD 1 Year 3 Years 5 Years 10 YearsSince
Inception130-Day
SEC Yield2Gross Expense
Ratio3 Capped Expense
Ratio3
Institutional Class 2.70 5.08 8.12 6.62 8.92 8.16 8.02 3.36% 0.82 0.76
Class A at NAV 2.69 4.87 7.69 6.20 8.48 7.88 7.77 2.83% 1.22 1.16
Class A with Sales Charge -1.67 0.45 3.11 4.66 7.54 7.88 7.35
Barclays U.S. Aggregate Bond Index 2.04 3.93 4.37 3.66 4.85 4.93 4.55
Past performance is no guarantee of future results. Performance less than 1 year is not annualized. The investment return and principal value of an investment will fluctuate so that an investor’s shares, when redeemed, may be worth more or less than their original cost. Current performance may be lower or higher than the performance data quoted. For performance data current to the most recent month-end, please visit www.nb.com/performance. Average Annual Total Returns with sales charge reflect deduction of current maximum initial sales charge of 4.25% for Class A shares.1 The inception date for the Strategic Income Fund Institutional Class is 7/11/03. The inception date for Class A is 12/20/07. Performance prior to the inception date of Class A is that of the Institutional Class, which had lower expenses and therefore typically better performance than Class A shares. The date used to calculate benchmark performance and 30-day yield is that of the Institutional Class.
2 A fund’s 30-day SEC yield is similar to a yield to maturity for the entire portfolio. The formula is designated by the Securities and Exchange Commission (SEC). Absent any expense cap arrangement noted, the SEC yields may have been lower and total returns would have been less. The unsubsidized 30-day SEC yields for Class A and Institutional Class are 2.81% and 3.32%, respectively.
3 Neuberger Berman Management LLC contractually caps certain class expenses of the Fund through 10/31/21 for Class A and the Institutional Class. Absent this arrangement, which may not be changed without Board approval, the returns would have been lower. Information as of most recent prospectus dated 2/28/2014.
HYPOTHETICAL GROWTH OF $10,000 SINCE INCEPTION (7/11/03)
Past performance is no guarantee of future results. Chart shows the value of a hypothetical $10,000 investment in the Institutional Class of the Fund since inception.
6/04 7/03 5/05 4/06 3/07 2/08 1/09 12/09 11/10 10/11 9/12 8/13 6/14
$10,000
$15,000
$20,000
$25,000
NSTLX Barclays U.S. Aggregate Bond Index
L0271 08/14 ©2014 Neuberger Berman Management LLC, distributor. Member FINRA. All rights reserved.
2Q2014
CLASS A: NLSAX INSTITUTIONAL CLASS: NLSIX
Long Short Fund
Please contact us at 877.628.2583 or visit www.nb.com.
11.5%
100%
40%
Seeking to Participate and ProtectAlternative investments may help diversify a traditional investment portfolio and reduce volatility. Over the past 20 years, long short equity strategies have outperformed traditional long-only equity strategies and with lower risk. The Neuberger Berman Long Short Fund seeks to provide exposure to the equity market’s upside potential while maintaining an intense focus on managing risk through periods of market uncertainty.
-6%
-5%
-4%
-3%
-2%
-1%
0%
1%
6/1310/1208/1301/1405/12
NLSIX S&P 500 Index
-0.7%
-6.0%
-2.0%
-3.5%
-2.9%
-1.85%
-1.34%
-0.8%
-0.54%
-0.92%
Worst 5 Months For The S&P 500 Index Since Inception2
Return
Annualized return since inception2
40% less volatile than the S&P 500 Index since inception2
% of months since its inception NLSIX has outperformed the S&P 500 Index when the Index was negative2
1 Since inception through 6/30/14 the Standard Deviation of NLSIX was 3.88 and the S&P 500 Index was 9.37.
2NLSIX inception 12/29/11.
Source: Morningstar. Past performance is no guarantee of future results. Hedging seeks to reduce the effects of a negative market but may limit performance in an up market. This chart is not indicative of the Fund’s performance during all periods—for this information, please see standard performance on the next page.
NLSIX HAS OUTPERFORMED THE S&P 500 INDEX IN EVERY DOWN MONTH SINCE INCEPTION2
A Flexible, Bottom-Up ApproachThe Fund seeks to identify the most attractive opportunities to grow capital, with the ability to invest long and short, as well as in fixed income. The manager’s hands-on, active portfolio leadership has served private and institutional clients for over 20 years.
Focused on Managing RiskThe investment team has a disciplined focus on managing risk and preserving capital. Since inception, the Fund has operated with 60% less volatility1 than the broad equity market and has outperformed on 90% of the days where the market was down. (see chart below).
Seeking Attractive, Risk-Adjusted ReturnsDespite the strong growth witnessed in equity markets over recent years, many investors are wary of a potential correction. The Fund seeks to help investors realize equity-like appreciation with a secondary objective of mitigating downside risk.
HYPOTHETICAL GROWTH OF $10,000 SINCE INCEPTION (12/29/2011)
An investor should consider the Fund’s investment objectives, risks and fees and expenses carefully before investing. This and other important information can be found in the Fund’s prospectus or summary prospectus, which you can obtain by calling 877.628.2583. Please read the prospectus and summary prospectus carefully before making an investment. Investments could result in loss of principal.
Unless noted, results are shown on a “total return” basis and include reinvestment of all dividends and capital gains distributions. Index returns do not reflect any fees, expenses or sales charges.
Shares in the Fund may fluctuate based on interest rates, market condition, credit quality and other factors. Small- and mid-capitalization stocks may have limited operating histories and resources and may trade less frequently and in lower volume than larger company stocks, which may make them more volatile and vulnerable to financial and other risks. Compared with smaller companies, large-cap companies may be less responsive to changes and opportunities and may lag other types of stock in performance.
Generally, bond values will decline as interest rates rise. You may have a gain or a loss if you sell your bonds prior to maturity. Bonds are subject to the credit risk of the issuer.
Short sales, selling a security a fund does not own in anticipation that the security’s price will decline, theoretically present unlimited risk on an individual stock basis, since a fund may be required to buy the security sold short at a time when the security has appreciated in value. The Fund may not always be able to close out a short position at a favorable time and price, and such a circumstance could reduce or eliminate any
gain, or cause a loss. There is no guarantee that the use of long and short positions will succeed in limiting the Fund’s exposure to market movements, sector-swings or other risk factors.
The Fund may use strategies intended to protect against losses (i.e., hedged strategies), but there is no guarantee that such hedged strategies will be used or, if used, that they will protect against losses.
Foreign securities involve risks in addition to those associated with comparable U.S. securities, including exposure to less developed or less efficient trading markets; social, political or economic instability; fluctuations in foreign currencies; nationalization or expropriation of assets; settlement, custodial or other operational risks; and less stringent auditing and legal standards. Exchange rate exposure and currency fluctuations could erase or augment investment results.
Derivatives involve risks different from, or greater than, the risks associated with investing in more traditional investments, as derivatives can be highly complex and volatile, difficult to value, highly illiquid, and a Fund may not be able to close out or sell a derivative position at a particular time or at an anticipated price. Non-U.S. currency forward contracts, options, swaps, or other derivatives contracts on non-U.S. currencies or securities involve a risk of loss, even if used for hedging purposes, if currency exchange rates move against the Fund. Investments in the over-the-counter market introduce counterparty risk due to the possibility that the dealer providing the derivative may fail to timely satisfy its obligations. Investments in the futures markets also introduce the risk that its futures commission merchant (FCM) may default on its obligations, which include returning margin posted to a Fund. Derivative instruments can create leverage, which can amplify changes in the Fund’s net
asset value and can result in losses that exceed the amount originally invested.
The Fund’s investments in ETFs subject it to such ETFs’ risks as well as expenses. ETFs are subject to tracking error and may be unable to sell poorly performing stocks that are included in their index. ETFs may trade in the secondary market at prices below the value of their underlying portfolios and may not be liquid.
The Fund may engage in active and frequent trading and may have a high portfolio turnover rate, which may increase its transaction costs and may adversely affect performance.
The S&P 500 Index consists of 500 stocks chosen for market size, liquidity and industry group representation. It is a market value-weighted index (stock price times number of shares outstanding), with each stock’s weight in the Index proportionate to its market value. The “500” is one of the most widely used benchmarks of U.S. equity performance. The HFRX Equity Hedge Index is designed to be representative of the overall composition of the long short hedge fund universe. Strategies maintain positions both long and short in primarily equity and equity derivative securities. Equity Hedge managers would typically maintain at least 50%, and may in some cases be substantially entirely invested in equities, both long and short.
The “Neuberger Berman” name and logo are registered service marks of Neuberger Berman Group LLC. “Neuberger Berman Management LLC” and the individual Fund names in this piece are either service marks or registered service marks of Neuberger Berman Management LLC.
P0204 08/14 ©2014 Neuberger Berman Management LLC, distributor. Member FINRA. All rights reserved.
EXPERIENCED STOCK PICKING WITH SECTOR-SPECIFIC FOCUS
The Fund is managed by Charles Kantor, who currently manages over $4.8 billion for high-net-worth investors. A regular commentator on CNBC and contributor to Barron’s, he oversees a seasoned team of analysts and leverages the depth of information and knowledge that is available at Neuberger Berman.
Charles C. Kantor20 Years of Industry Experience
Past performance is no guarantee of future results. Chart shows the value of a hypothetical $10,000 investment in the Institutional Class of the Fund since inception.
$10,000
$12,000
$14,000
$16,000
$18,000
6/1412/136/1312/126/1212/11
HFRX Equity Hedge Index
S&P 500 IndexNLSIX
INVESTMENT PERFORMANCE (ANNUALIZED AS OF 6/30/14)
Quarter YTD 1 YearSince Inception (12/29/2011)
Gross Expense Ratio*
Capped Expense Ratio*
Institutional Class 2.21 1.89 10.26 11.48 1.77 1.70
Class A at NAV 2.14 1.66 9.82 11.08 2.11 2.06
Class A with Sales Charge -3.74 -4.17 3.48 8.49
S&P 500 Index 5.23 7.14 24.61 22.29
HFRX Equity Hedge Index 0.02 1.27 7.61 6.92
Past performance is no guarantee of future results. Performance less than 1 year is not annualized. The investment return and principal value of an investment will fluctuate so that an investor’s shares, when redeemed, may be worth more or less than their original cost. Current performance may be lower or higher than the performance data quoted. For performance data current to the most recent month-end, please visit www.nb.com/performance. Average Annual Total Returns with sales charge reflect deduction of current maximum initial sales charge of 5.75% for Class A shares.* Neuberger Berman Management LLC contractually caps certain expenses of the Fund through 10/31/2017 for Class A and the Institutional Class. Absent such arrangements, which cannot be changed without Board approval, returns would have been lower. Information as of most recent prospectus dated 2/28/2014.
Introduction 1
S&P Global Ratings 2-3
Oppenheimer Funds 4-5
J.P. Morgan 6-8
Neuberger Berman 9
BNY Mellon 10-12
Additional Work 13-15
>

Benjamin Farber | Design Portfolio © 2016 10
BNY Mellon Collateral System (Phase 1)Background: When Bank of New York merged with Mellon PNC it brought together two brands with long histories and strong track records and posed many opportunities as well as challenges. The new logo represented the combined core values and the color palette utilized gold, silver and bronze signified this rich tradition. Role: Designed and developed branded multi-channel marketing collateral projects for numerous lines of business. As an integral member of the Corporate Marketing group, I helped implement the roll-out of marketing materials within new branding guidelines.
Structured Notes: Targeted Opportunities for Innovative Investors
Derivatives Execution
BNY Mellon in Australia
The power to move, manage and secure Australian assets in markets around the world
Global Operations
We are a corporate services unit with BNY Mellon’s Global Operations and Technology. Our services are provided around the globe through sever autonomous business units. While our service niches are independent, our overall objective is the same - to help our clients achieve their unique business goals and to reduce the company’s general risk exposure.
Alive in Hope Foundation
Division Highlights
• Process $400 trillion USD payments per year with 99.9% accuracy rate
• 24-hour customer service support with 95%+ response rate on same-day inquiries
• 99.9% system availability
• Dedicated participation in industry and government groups: SWIFT, IFSA, CHIPS and Fedwire
• Public & private payment networks (CHIPS, Fedwire)
• Large network of global correspondent banks
• OFAC scanning on all wire transactions
• Anti-money laundering monitoring / internal reviews
• Customer Quality Assurance team to provide formatting assistance and inquiry analysis
Division Highlights
• Implementation and training
• New client account set-ups and client account maintenance
• Tier I and II Service Desk (24-hour coverage)
• Professional technical services
• Project management and business analyst support
• INFORM platform management
• File Transfer Protocol (FTP) platform management
• Centralized global records management
• Maintenance and retrieval of custody records
• Procurement and distribution of SecurID cards
Division Highlights
• B2B Reimbursements
• Letter of Credit (commercial and standby) trade collections
• Trade in-sourcing / private labeling
• Trade document management
• Audit confirmations
• Late-night investment
• Commercial loans
• Global operations reconcilement
• Global operations talent and development: comprehensive core curriculum of technical training programs and management courses
• CIF/eCIF/AIMS administration
• Global Operations Know your Customer (KYC)
• Tenant Rent Security
Division Highlights
• Provide front- to back- office operational support to all global markets activity
• Electronic trading systems supporting over 90 currencies
• Sophisticated e-commerce products
• Key provider of FX services for asset servicing and global custody clients
• Process $50 billion in daily FX trades
• Processing hubs include New York, Pittsburgh, Manchester and Singapore
• Nine global trading rooms: New York, Pittsburgh, Boston, London, Brussels, Hong Kong, Tokyo, Seoul and Taipei
Provide USD and multicurrency electronic payment services for domestic and international banks and corporations, and internal areas of the company.
Provide middle- and back-office servicing for a diverse array of products for investments, asset creation and trade finance.
Provide operations support for global markets business, including Over-the-Counter (OTC) Derivatives and FX Trading.
Provide global client support for the company’s internet-based platforms for more than 15,000 clients and 137,000 users worldwide.
Funds Transfer Operations (Global Payments)
Client Technology Delivery Services
Trade & Loan Operations Global Market Operations
What We Do
BNY Mellon
Introduction 1
S&P Global Ratings 2-3
Oppenheimer Funds 4-5
J.P. Morgan 6-8
Neuberger Berman 9
BNY Mellon 10-12
Additional Work 13-15
>

Benjamin Farber | Design Portfolio © 2016 11
BNY Mellon Collateral System (Phase 1.5)Background: The primary color palette of gold, silver and bronze was gradually superseded by a brighter secondary color palette which was under utilized. The “ordered complexity” of the initial rebrand was further explored and refined in favor of images with more abstract movement. I was responsible for creating a suite of marketing collateral, working closely with stakeholders on all aspects of the development. (2010-2012) Role: Developed and designed from concept to completion, a wide variety of print collateral. Liaised with the Creative Director to coordinate and manage departmental work flow. Collaborated with a diverse team of marketing managers and writers, to enhance group’s effectiveness. I managed project holistically, which involved direct client rapport.
BNY Mellon
Risk mitigation and transparency for you and your investors
Who’s helping you?
BNY Mellon offers a
fund services platform that
seamlessly manages your
administration and custody
requirements.
The BNY Mellon Solution
• Extensive global network with a
dedicated on-the-ground presence
in markets worldwide.
• Alternative Prime Custody
specialist with $153.7 billion in
assets under custody.1
• Voted #1 custody provider by
Hedge Funds Review Service Provider
Rankings, 2011
• Ranked first vs. peers Overall by
R&M Global Custody Survey, 2011
in addition to ranking first vs. peers
in the following categories: Big
Boys (providers with AUC over $10
trillion), The Experts (respondents
who surveyed five or more
custodians), USA, Asset Managers,
Asset Managers Direct, Asset
Managers Indirect/Both, US Asset
Managers, UK Asset Managers.
1. As of September 30, 2011
Content Overview
We are committed to alternative
prime custody. As a financial
institution that built its reputation
on asset servicing, custody has
long been a core business at BNY
Mellon. Consistently ranked as one
of the industry’s top custodians,
we can service a wide variety of
fund structures in capital markets
worldwide.
BNY Mellon provides an integrated
services platform that handles the
custody requirements of hedge
funds. Our comprehensive suite of
alternative prime custody services
helps safekeep hedge fund assets
while enabling hedge fund managers
to focus on their core competencies
and investment strategy.
For more information about our full suite of alternative fund services, please contact:
Global
Marina Lewin Managing Director +44 20 7163 6323 [email protected]
Americas
Thomas Levings Managing Director +1 212 815 2620 [email protected]
EMEA
Luke Spencer-Wilson Vice President +44 20 7163 3752 [email protected]
APAC
Aidan Houlihan Managing Director +852 2840 9756 [email protected]
Alternative Prime Custody
Alternative Prime Custody Services by BNY Mellon
provides a powerful administrative platform from
which hedge funds can move, manage and safekeep
assets in capital markets around the world.
Introduction 1
S&P Global Ratings 2-3
Oppenheimer Funds 4-5
J.P. Morgan 6-8
Neuberger Berman 9
BNY Mellon 10-12
Additional Work 13-15
>
Benjamin Farber | Design Portfolio © 2016 12
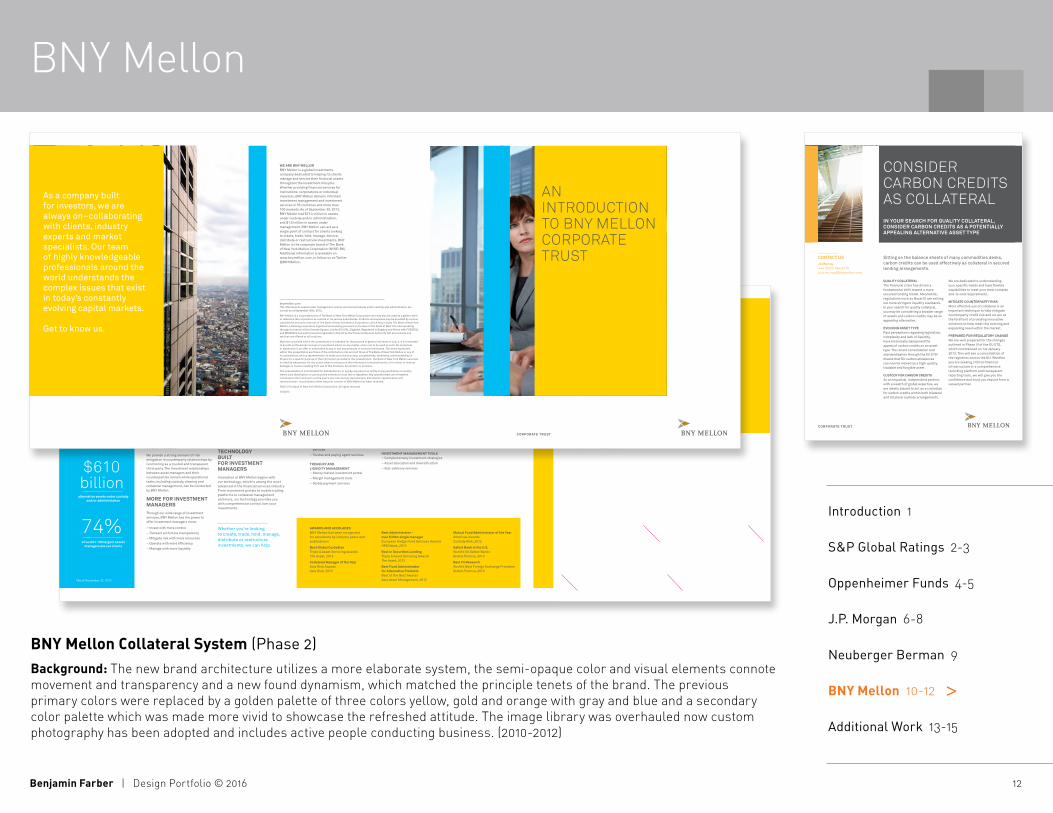
BNY Mellon Collateral System (Phase 2)Background: The new brand architecture utilizes a more elaborate system, the semi-opaque color and visual elements connote movement and transparency and a new found dynamism, which matched the principle tenets of the brand. The previous primary colors were replaced by a golden palette of three colors yellow, gold and orange with gray and blue and a secondary color palette which was made more vivid to showcase the refreshed attitude. The image library was overhauled now custom photography has been adopted and includes active people conducting business. (2010-2012)
the investments company For investment managers
our services: by the numbers*
BNY Mellon connects investment managers with their investments. Our vast capabilities help you to move, manage and secure assets in capital markets all around the world.
maximize operational eFFiciency With BNY Mellon, you will have the operational control and precision to keep pace with your investment strategy. We offer a full range of innovative services and operational solutions that help investment managers conduct business accurately, efficiently and quickly.
minimize counter-party risk
We provide a strong element of risk mitigation in counterparty relationships by functioning as a trusted and transparent third-party. The investment relationships between asset managers and their counterparties remain while operational tasks, including custody, clearing and collateral management, can be conducted by BNY Mellon.
more For investment managers Through our wide range of investment services, BNY Mellon has the power to offer investment managers more:
– Invest with more control
– Transact with more transparency
– Mitigate risk with more resources
– Operate with more efficiency
– Manage with more liquidity
powering the investment liFecycle As an investments company, we specialize in providing services to help meet your needs at every phase of the investment lifecycle. Whether you’re looking to create, trade, hold, manage, distribute or restructure investments, we can help. The vast extent of our capabilities enables us to act as a single source in meeting your needs throughout the investment lifecycle.
technology built For investment managersInnovation at BNY Mellon begins with our technology, which is among the most advanced in the financial services industry. From investment portals to mobile trading platforms to collateral management and more, our technology provides you with comprehensive control over your investments.
contact our experts
inside left page inside middle page inside right page with foldtrifold a
invested in your success
*As of December 31, 2012
Through our collaborative efforts with investment managers, we understand the complexity of your challenges along with your potential for success. We have the investment services, innovative technology and global reach and that can help unlock that potential and power your performance.
our capabilitiesinvestment servicing– Fund accounting and administration
– Global custody services
– Outsourcing technology for middle- and back-office investment operations
– Securities clearance and collateral management
– Securities lending
– Transfer agency and sub-accounting services
– Trustee and paying agent services
treasury and liquidity management– Money market investment portal
– Margin management tools
– Global payment services
inFormation and risk management tools– Performance measurement
– Derivatives services
– Foreign exchange services
broker-dealer services– Prime brokerage services
– Order management
investment management tools– Complementary investment strategies
– Asset allocation and diversification
– Sub-advisory services
$2.9 trillionin 40 act Fund assets under
custody and/or administration
$2 trillion
average tri-party repo balances
$610 billion
alternative assets under custody and/or administration
74%of world’s 100 largest assets
managers are our clients
awards and accolades BNY Mellon has been recognized for excellence by industry peers and publications
best global custodian Triple A Asset Servicing Awards The Asset, 2013
collateral manager of the year Asia Risk Awards Asia Risk, 2013
best administrator - over $30bn single manager European Hedge Fund Services Awards HFM Week, 2013
best in securities lending Triple A Asset Servicing Awards The Asset, 2013
best Fund administrator for alternative products Best of the Best Awards Asia Asset Management, 2012
mutual Fund administrator of the year Americas Awards Custody Risk, 2012
safest bank in the u.s. World’s 50 Safest Banks Global Finance, 2013
best Fx research World’s Best Foreign Exchange Providers Global Finance, 2013
Whether you’re looking to create, trade, hold, manage, distribute or restructure investments, we can help.
Our vast capabilities enable us to act as a single source in meeting your needs throughout the investment lifecycle.
Innovation at BNY Mellon begins with our technology, which is among the most advanced in the financial services industry.
AN INTRODUCTION TO BNY MELLON CORPORATE TRUST
CORPORATE TRUST
As a company built for investors, we are always on–collaborating with clients, industry experts and market specialists. Our team of highly knowledgeable professionals around the world understands the complex issues that exist in today’s constantly evolving capital markets.
Get to know us.
bnymellon.com*All references to assets under management, assets serviced and assets under custody and administration are correct as at September 30th, 2012.
BNY Mellon is a corporate brand of The Bank of New York Mellon Corporation and may also be used as a generic term to reference the corporation as a whole or its various subsidiaries. Products and services may be provided by various subsidiaries and joint ventures of The Bank of New York Mellon Corporation, which may include The Bank of New York Mellon, a banking corporation organised and existing pursuant to the laws of the State of New York and operating through its branch at One Canada Square, London E14 5AL, England. Registered in England and Wales with FC005522 and BR000818 and authorised and regulated in the UK by the Financial Services Authority. Not all products and services are offered at all locations.
Material contained within this presentation is intended for the purpose of general information only. It is not intended to provide professional counsel or investment advice on any matter, and is not to be used as such. No statement or expression is an offer or solicitation to buy or sell any products or services mentioned. The views expressed within this presentation are those of the contributors only and not those of The Bank of New York Mellon or any of its subsidiaries, and no representation is made as to the accuracy, completeness, timeliness, merchantability or fitness for a specific purpose of the information provided in this presentation. The Bank of New York Mellon assumes no liability whatsoever for any action taken in reliance on the information contained herein, or for direct or indirect damages or losses resulting from use of this brochure, its content, or services.
This presentation is not intended for distribution to, or use by, any person or entity in any jurisdiction or country where such distribution or use would be contrary to local law or regulation. Any unauthorised use of material contained in this brochure is at the user’s own risk and any reproduction, distribution, republication and retransmission is prohibited unless the prior consent of BNY Mellon has been obtained.
©2013 The Bank of New York Mellon Corporation. All rights reserved.
10/2013
WE ARE BNY MELLONBNY Mellon is a global investments company dedicated to helping its clients manage and service their financial assets throughout the investment lifecycle. Whether providing financial services for institutions, corporations or individual investors, BNY Mellon delivers informed investment management and investment services in 35 countries and more than 100 markets. As of September 30, 2013, BNY Mellon had $27.4 trillion in assets under custody and/or administration, and $1.5 trillion in assets under management. BNY Mellon can act as a single point of contact for clients looking to create, trade, hold, manage, service, distribute or restructure investments. BNY Mellon is the corporate brand of The Bank of New York Mellon Corporation (NYSE: BK). Additional information is available on www.bnymellon.com, or follow us on Twitter @BNYMellon.
BNY Mellon
Sitting on the balance sheets of many commodities desks, carbon credits can be used effectively as collateral in secured lending arrangements.
Consider Carbon Credits as Collateral
Corporate trust
In your searCh for qualIty Collateral, ConsIder Carbon CredIts as a potentIally appealIng alternatIve asset type
qualIty CollateralThe financial crisis has driven a fundamental shift toward a more secured funding model. Meanwhile, regulations such as Basel III are setting out more stringent liquidity standards. In your search for quality collateral, you may be considering a broader range of assets and carbon credits may be an appealing alternative.
evolvIng asset typePast perceptions regarding legislation, complexity and lack of liquidity, have historically dampened the appeal of carbon credits as an asset type. The recent consolidation and standardisation through the EU ETS2 means that EU carbon allowances can now be viewed as a high-quality, tradable and fungible asset.
Custody for Carbon CredItsAs an impartial, independent partner, with a wealth of global expertise, we are ideally placed to act as a custodian for carbon credits within both bilateral and trilateral custody arrangements.
We are dedicated to understanding your specific needs and have flexible capabilities to meet your most complex end-to-end requirements.
MItIgate Counterparty rIskMore effective use of collateral is an important technique to help mitigate counterparty credit risk and we are at the forefront of providing innovative solutions to help meet this evolving and expanding need within the market.
prepared for regulatory ChangeWe are well prepared for the changes outlined in Phase III of the EU ETS, which commenced on 1st January 2013. This will see a consolidation of the registries across the EU. Whether you are seeking critical financial infrastructure or a comprehensive recording platform and transparent reporting tools, we will give you the confidence and trust you require from a valued partner.
ContaCt usJo Murray +44 (0)207 964 [email protected]
Introduction 1
S&P Global Ratings 2-3
Oppenheimer Funds 4-5
J.P. Morgan 6-8
Neuberger Berman 9
BNY Mellon 10-12
Additional Work 13-15
>

Benjamin Farber | Design Portfolio © 2016 13
Additional Work
Hunter Douglas Contract CollateralBackground: Hunter Douglas Contract was created out of several groups of a much larger multinational manufacturer. Many of the products I developed were for an initial push into the US market. Role: ConFab [Contract Fabric] was a new logo developed after a merger and a meeting with the client. I kept part of the existing type family while modernizing and refreshing the brand. Contract Window Covering 100-page sales and marketing binder was redeveloped, resulting in 25% growth and increased sales. (2003–2005) Outcome: Contract Window Covering 100-page sales and marketing binder was redeveloped, resulting in 25% growth and increased sales. Learn More >
www.hunterdouglascontract.com
Window Coverings Contract
DIVISION
12
Contract Window Coverings
1234/ABCBuyLine 1234
Introduction p. 1
S&P Global Ratings 2-3
Oppenheimer Funds 4-5
J.P. Morgan 6-8
Neuberger Berman 9
BNY Mellon 10-12
Additional Work 13-15 >