Bellet 06 16 10 - ACT-Ract-r.psy.cmu.edu/wordpress/wp-content/uploads/2012/12/... · 2013-07-15 ·...
6
Deductive Spatial Reasoning: From Neurological Evidence to a Cognitive Model Marco Ragni, Thomas Fangmeier, Sven Br¨ ussow {ragni, fangmeier, sven}@cognition.uni-freiburg.de Center for Cognitive Science, University of Freiburg Friedrichstr. 50, D-79098 Freiburg, Germany Abstract Cognitive modeling aims more and more to explain, predict and integrate behavioral data with brain activations found in fMRI studies. In this article we analyze transitive inferences (e.g. A is left of B and B is left of C then A is left of C) during the spatial reasoning processes. Behavioral findings suggest that reasoners tend to construct a mental model from the premises, which they in turn use to inspect to draw infer- ences. A reanalysis of our own previous fMRI-study investi- gating such examples provided us with brain activations pat- tern. A cognitive model using the (restricted) Bold-function in ACT-R 6.0 can partially predict and explain the results. The findings, limits and potentials of the current representation of the Bold-function in ACT-R are briefly discussed. Keywords: Deductive reasoning; fMRI; ACT-R Introduction Assume you receive the following information: The door is to the left of the garage. The car is to the right of the garage. Given this set of premises it is easy to draw an inference like ”the car must be to the right of the door”. But how do we reason about such so-called three-term problems? Which role plays working memory in such tasks? There are compet- ing and different theories in cognitive science to explain the actual human reasoning process. The Theory of Mental Logic introduced by (Rips, 1994) argues syntactically. This theory claims that humans apply transitivity rules to a given set of premises without construct- ing spatial representations, e.g. ”If A is left of B and B is left of C then A is left of C”. Standing in the tradition of AI-Approaches, there are, however, a number of problems involved, e.g. with regard to memory burden or the number of rules necessary to solve tasks (Ragni, 2008). In contrast, the Theory of Mental Models (MMT) argues that humans construct mental models which are an inter- nal representation of objects and relations in spatial working memory, matching the state of affairs given in the premises. The semantic theory of mental models is based on the mathe- matical definition of deduction, i.e. a propositional statement C is a consequence of a set of premises P, if in each model A of the premises P, the conclusion C is true. The mental model theory (MMT) assumes that the human reasoning pro- cess consists of three distinct phases: (1) the model genera- tion phase, in which a first model is constructed out of the premises, (2) the inspection phase, in which the model is in- spected to check if a putative conclusion is consistent with the current model. And (3) the validation phase, in which alter- native models are generated from the premises that refute this putative conclusion (Johnson-Laird, 2001). A mental model is constructed incrementally from its premises (Ragni, Fang- meier, Webber, & Knauff, 2007) following the principle of economicity (Manktelow, 1999). Such a model construction process saves working memory capacities because new in- formation is immediately processed and integrated into the model (Johnson-Laird & Byrne, 1991; Rauh, Knauff, Kuß, Schlieder, & Strube, 2005). Both theories can explain a number of results but MMT is more widely accepted as the explaining theory in relational reasoning (e.g., Rauh et al., 2005; Jahn, Knauff, & Johnson- Laird, 2007; Goodwin & Johnson-Laird, 2005). A cognitive modeling of this theory has several advantages: (i) this theory is more formally presented, (ii) it is fully spec- ified in terms of necessary operations to process such prob- lems as described above, and with the new Bold-functions in ACT-R 6.0 (iii) it allows for a prediction and model of the underlying brain activations. Especially, the last aspect has become more and more important in recent years. Founda- tional work has been done by Anderson, Qin, Stenger, and Carter who conducted and analyzed simple algebra tasks and developed a first model integrating fMRI-findings in ACT- R (Anderson, Qin, et al., 2004). More precise, based on ACT-R 6.0 they developed an information-processing model to predict the blood oxygenation level-dependent (BOLD) response of functional MRI in symbol manipulation tasks. Base-level activation learning in the ACT-R theory can pre- dict the change of the BOLD response in practice in a left prefrontal region reflecting retrieval of information. In con- trast, practice has relatively little effect on the form of BOLD response in the parietal region reflecting imagined transfor- mations to the equation or the motor region reflecting manual programming. In this article, we present a cognitive model for three-term series problems of spatial arrangements integrating a previous fMRI study. It is structured as follows: In the next section, we briefly introduce the experimental design, settings, and the fMRI-findings. Then, we proceed outlining our ACT-R model. Finally we compare the model results with the empir- ical results. fMRI During Visual Relational Reasoning We briefly report a study from our group (Fangmeier, Knauff, Ruff, & Sloutsky, 2006) in which different neural networks for three phases of the MMT during spatial relational reason- ing were supported. 193
Transcript of Bellet 06 16 10 - ACT-Ract-r.psy.cmu.edu/wordpress/wp-content/uploads/2012/12/... · 2013-07-15 ·...

Deductive Spatial Reasoning:From Neurological Evidence to a Cognitive Model
Marco Ragni, Thomas Fangmeier, Sven Brussow{ragni, fangmeier, sven}@cognition.uni-freiburg.deCenter for Cognitive Science, University of Freiburg
Friedrichstr. 50, D-79098 Freiburg, Germany
AbstractCognitive modeling aims more and more to explain, predictand integrate behavioral data with brain activations found infMRI studies. In this article we analyze transitive inferences(e.g. A is left of B and B is left of C then A is left of C)during the spatial reasoning processes. Behavioral findingssuggest that reasoners tend to construct a mental model fromthe premises, which they in turn use to inspect to draw infer-ences. A reanalysis of our own previous fMRI-study investi-gating such examples provided us with brain activations pat-tern. A cognitive model using the (restricted) Bold-function inACT-R 6.0 can partially predict and explain the results. Thefindings, limits and potentials of the current representation ofthe Bold-function in ACT-R are briefly discussed.Keywords: Deductive reasoning; fMRI; ACT-R
IntroductionAssume you receive the following information:
The door is to the left of the garage.The car is to the right of the garage.
Given this set of premises it is easy to draw an inferencelike ”the car must be to the right of the door”. But how dowe reason about such so-called three-term problems? Whichrole plays working memory in such tasks? There are compet-ing and different theories in cognitive science to explain theactual human reasoning process.
The Theory of Mental Logic introduced by (Rips, 1994)argues syntactically. This theory claims that humans applytransitivity rules to a given set of premises without construct-ing spatial representations, e.g. ”If A is left of B and B isleft of C then A is left of C”. Standing in the tradition ofAI-Approaches, there are, however, a number of problemsinvolved, e.g. with regard to memory burden or the numberof rules necessary to solve tasks (Ragni, 2008).
In contrast, the Theory of Mental Models (MMT) arguesthat humans construct mental models which are an inter-nal representation of objects and relations in spatial workingmemory, matching the state of affairs given in the premises.The semantic theory of mental models is based on the mathe-matical definition of deduction, i.e. a propositional statementC is a consequence of a set of premises P, if in each modelA of the premises P, the conclusion C is true. The mentalmodel theory (MMT) assumes that the human reasoning pro-cess consists of three distinct phases: (1) the model genera-tion phase, in which a first model is constructed out of thepremises, (2) the inspection phase, in which the model is in-spected to check if a putative conclusion is consistent with thecurrent model. And (3) the validation phase, in which alter-native models are generated from the premises that refute this
putative conclusion (Johnson-Laird, 2001). A mental modelis constructed incrementally from its premises (Ragni, Fang-meier, Webber, & Knauff, 2007) following the principle ofeconomicity (Manktelow, 1999). Such a model constructionprocess saves working memory capacities because new in-formation is immediately processed and integrated into themodel (Johnson-Laird & Byrne, 1991; Rauh, Knauff, Kuß,Schlieder, & Strube, 2005).
Both theories can explain a number of results but MMT ismore widely accepted as the explaining theory in relationalreasoning (e.g., Rauh et al., 2005; Jahn, Knauff, & Johnson-Laird, 2007; Goodwin & Johnson-Laird, 2005).
A cognitive modeling of this theory has several advantages:(i) this theory is more formally presented, (ii) it is fully spec-ified in terms of necessary operations to process such prob-lems as described above, and with the new Bold-functions inACT-R 6.0 (iii) it allows for a prediction and model of theunderlying brain activations. Especially, the last aspect hasbecome more and more important in recent years. Founda-tional work has been done by Anderson, Qin, Stenger, andCarter who conducted and analyzed simple algebra tasks anddeveloped a first model integrating fMRI-findings in ACT-R (Anderson, Qin, et al., 2004). More precise, based onACT-R 6.0 they developed an information-processing modelto predict the blood oxygenation level-dependent (BOLD)response of functional MRI in symbol manipulation tasks.Base-level activation learning in the ACT-R theory can pre-dict the change of the BOLD response in practice in a leftprefrontal region reflecting retrieval of information. In con-trast, practice has relatively little effect on the form of BOLDresponse in the parietal region reflecting imagined transfor-mations to the equation or the motor region reflecting manualprogramming.
In this article, we present a cognitive model for three-termseries problems of spatial arrangements integrating a previousfMRI study. It is structured as follows: In the next section,we briefly introduce the experimental design, settings, andthe fMRI-findings. Then, we proceed outlining our ACT-Rmodel. Finally we compare the model results with the empir-ical results.
fMRI During Visual Relational ReasoningWe briefly report a study from our group (Fangmeier, Knauff,Ruff, & Sloutsky, 2006) in which different neural networksfor three phases of the MMT during spatial relational reason-ing were supported.
193

Participants. Twelve right-handed male students took partin the study. All were instructed and trained outside the scan-ner in order to minimize the learning process while scanningand to increase their accuracy.
Materials. The presented material in the original studyconsists of two conditions, 32 reasoning and 32 maintenanceverification tasks for each subject. Since we just want tomodel the reasoning process in ACT-R we report only thereasoning task in detail. One reasoning task consists of twopremises with three letters (V, X, Z in random order) in a spa-tial horizontal configuration as well as an offered conclusion.Each premise and the conclusion consists of two letters witha spatial relation. The spatial relation between the two let-ters of each premise or conclusion was coded by placing itright or left from the center of the screen. A sentential ver-sion of the given example in Fig. 1 would be: ”X is to theleft of V (premise 1) and ”Z is to the right of V” (premise 2).For these premises, it follows ”X is to the left of Z” (men-tal model which was constructed). Participants were asked todecide if an offered conclusion was correct. One of two alter-native conclusions were offered: a valid one (as in Fig. 1) ”Xis to the left of Z” or an invalid one ”Z is to the left of X”.
Figure 1: Sequential presentation and timing of the premisesand the conclusion (cp. section Materials).
Procedure and Data Acquisition. The participants weretrained outside the scanner with 12 similar problems and hadto reach at least 75% accuracy for participation. The trialswere presented in an event-related design with four separateruns. Each run consist of eight reasoning and eight mainte-nance tasks in a random order. As noted before we reportin this article only the procedure and results of the reasoningtasks.
The timeline of the complete task was as follows: Eachtask was introduced with the letter ”S” in the center of thescreen (”Schliessen” in German) for reasoning followed by apause for 1 sec. Each premise and conclusion began withthe presentation of the first letter for 1.5 sec, followed by
the second letter for 1.5 sec and a pause for 1 sec. There-fore each of the premises, and the conclusion lasted for about4 sec. Overall the whole trial lasted for about 14 sec. Inhalf of each premise or conclusion the first letter appeared onthe left position, followed by the letter on the right position.In the other half of the tasks the first letter appeared on theright position. The term order variation prevented the par-ticipants from anticipating the next letter and from drawingthe conclusion during the second premise. Further the vari-ation of the term order is well established in the reasoningliterature (Knauff, Rauh, Schlieder, & Strube, 1998). Dur-ing presenting of the conclusion the accuracy was recordedvia a two-button box. Scanning was performed on a 1.5 TSiemens Vision scanner. Functional images were collectedwith a gradient-recalled echo-planar imaging (EPI) sequence,allowing the sampling of 30 parallel slices covering the wholebrain [TR repetition time): 4000 msec; TA (acquisition time):3126 msec]. The exact scanning information can be seen inFangmeier and colleagues (2006).
Design. Functional and anatomical images were reorientedso that the anterior commissure corresponded to the originof the three-dimensional standard coordinate system used inthe software SPM99 (1999). The four runs for each subjectwere separately realigned and corrected for motion, and un-derwent slice timing correction. Each subject’s anatomicalimage was coregistered with a 40-slice EPI and the functionalimages of each run. The parameters for spatial normalizationwere determined from the anatomical images of each sub-ject, and were applied to the corresponding functional im-ages. Images were finally smoothed with an 8-mm full-widthhalf-maximum Gaussian kernel.
fMRI Statistical Analyses. The hemodynamic response tothe premises and conclusions was modeled with event-relateddelta functions, which were convolved with the canonicalhemodynamic response function and its temporal derivativeemployed in SPM99. Low-frequency confounds were ex-cluded from the model with a high-pass filter (192 sec cut-off), and an autoregression AR(1) model excluded the vari-ance explained by the previous scan. The six realignmentparameters for each run were included as covariates to avoidmotion artifacts. First-level contrast images for every sub-ject and contrast were then used for a random effects analy-sis to draw inferences on brain activation during the exper-imental problems. Only correctly answered problems wereincluded in the analysis. All reported clusters within the con-ditions and the conjunction analysis are significant at the clus-ter level p .05, corrected for multiple comparisons (threshold t= 3.0).The contrasts were calculated as follows: premise pro-cessing phase (Premise 2 minus Premise 1), integration phase(Premise 2 minus Conclusion), validation phase (Conclusionminus Premise 2).
Further the beta values from the essential significant clus-ters were extracted. For each of the three different phases
194
(premise 1, premise 2, conclusion) a cluster with ±12 mmaround the peak voxel was extracted from the beta images ofthe SPM statistic. The beta value for each phase representsthe difference between brain activation during this phase andthe overall mean derived from the whole brain, which is theactual value of the corresponding phase. The value is not apercent signal change but a difference to overall mean withan arbitrary unit. If the beta value is positive (or negative)the activation is higher (or lower, resp.) than the average ac-tivation as illustrated in the bar charts of the human data inFig. 6.
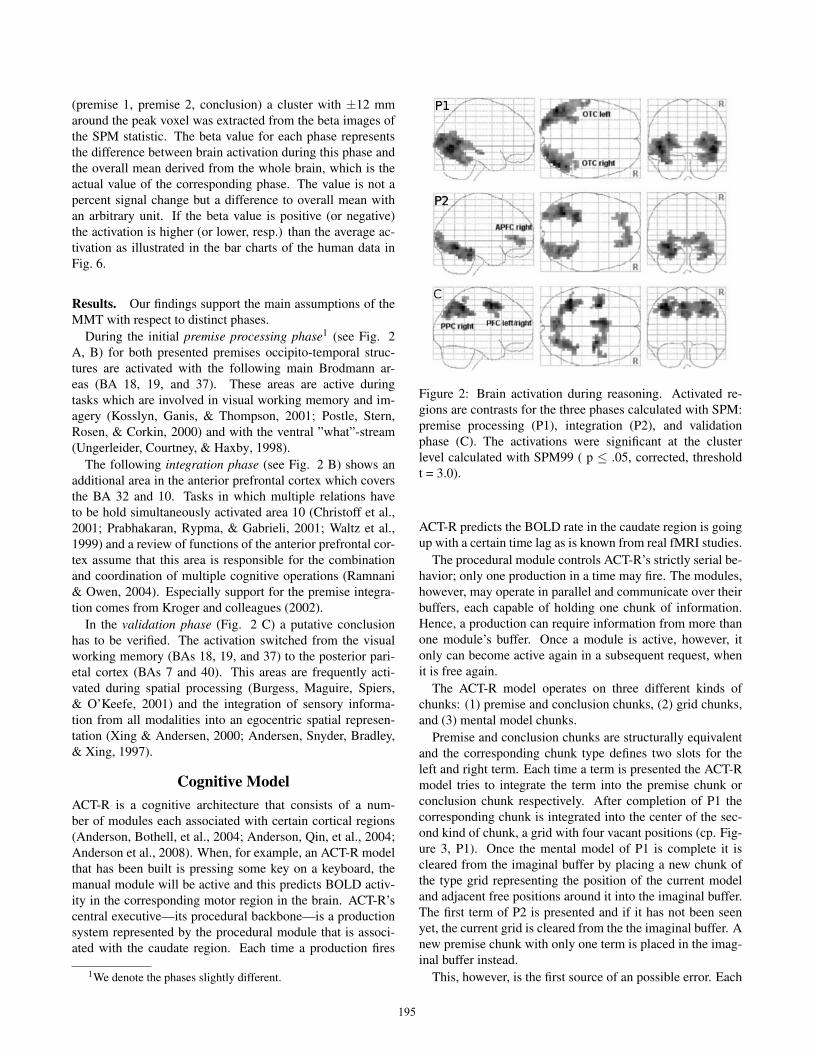
Results. Our findings support the main assumptions of theMMT with respect to distinct phases.
During the initial premise processing phase1 (see Fig. 2A, B) for both presented premises occipito-temporal struc-tures are activated with the following main Brodmann ar-eas (BA 18, 19, and 37). These areas are active duringtasks which are involved in visual working memory and im-agery (Kosslyn, Ganis, & Thompson, 2001; Postle, Stern,Rosen, & Corkin, 2000) and with the ventral ”what”-stream(Ungerleider, Courtney, & Haxby, 1998).
The following integration phase (see Fig. 2 B) shows anadditional area in the anterior prefrontal cortex which coversthe BA 32 and 10. Tasks in which multiple relations haveto be hold simultaneously activated area 10 (Christoff et al.,2001; Prabhakaran, Rypma, & Gabrieli, 2001; Waltz et al.,1999) and a review of functions of the anterior prefrontal cor-tex assume that this area is responsible for the combinationand coordination of multiple cognitive operations (Ramnani& Owen, 2004). Especially support for the premise integra-tion comes from Kroger and colleagues (2002).
In the validation phase (Fig. 2 C) a putative conclusionhas to be verified. The activation switched from the visualworking memory (BAs 18, 19, and 37) to the posterior pari-etal cortex (BAs 7 and 40). This areas are frequently acti-vated during spatial processing (Burgess, Maguire, Spiers,& O’Keefe, 2001) and the integration of sensory informa-tion from all modalities into an egocentric spatial represen-tation (Xing & Andersen, 2000; Andersen, Snyder, Bradley,& Xing, 1997).
Cognitive ModelACT-R is a cognitive architecture that consists of a num-ber of modules each associated with certain cortical regions(Anderson, Bothell, et al., 2004; Anderson, Qin, et al., 2004;Anderson et al., 2008). When, for example, an ACT-R modelthat has been built is pressing some key on a keyboard, themanual module will be active and this predicts BOLD activ-ity in the corresponding motor region in the brain. ACT-R’scentral executive—its procedural backbone—is a productionsystem represented by the procedural module that is associ-ated with the caudate region. Each time a production fires
1We denote the phases slightly different.
Figure 2: Brain activation during reasoning. Activated re-gions are contrasts for the three phases calculated with SPM:premise processing (P1), integration (P2), and validationphase (C). The activations were significant at the clusterlevel calculated with SPM99 ( p ≤ .05, corrected, thresholdt = 3.0).
ACT-R predicts the BOLD rate in the caudate region is goingup with a certain time lag as is known from real fMRI studies.
The procedural module controls ACT-R’s strictly serial be-havior; only one production in a time may fire. The modules,however, may operate in parallel and communicate over theirbuffers, each capable of holding one chunk of information.Hence, a production can require information from more thanone module’s buffer. Once a module is active, however, itonly can become active again in a subsequent request, whenit is free again.
The ACT-R model operates on three different kinds ofchunks: (1) premise and conclusion chunks, (2) grid chunks,and (3) mental model chunks.
Premise and conclusion chunks are structurally equivalentand the corresponding chunk type defines two slots for theleft and right term. Each time a term is presented the ACT-Rmodel tries to integrate the term into the premise chunk orconclusion chunk respectively. After completion of P1 thecorresponding chunk is integrated into the center of the sec-ond kind of chunk, a grid with four vacant positions (cp. Fig-ure 3, P1). Once the mental model of P1 is complete it iscleared from the imaginal buffer by placing a new chunk ofthe type grid representing the position of the current modeland adjacent free positions around it into the imaginal buffer.The first term of P2 is presented and if it has not been seenyet, the current grid is cleared from the the imaginal buffer. Anew premise chunk with only one term is placed in the imag-inal buffer instead.
This, however, is the first source of an possible error. Each
195
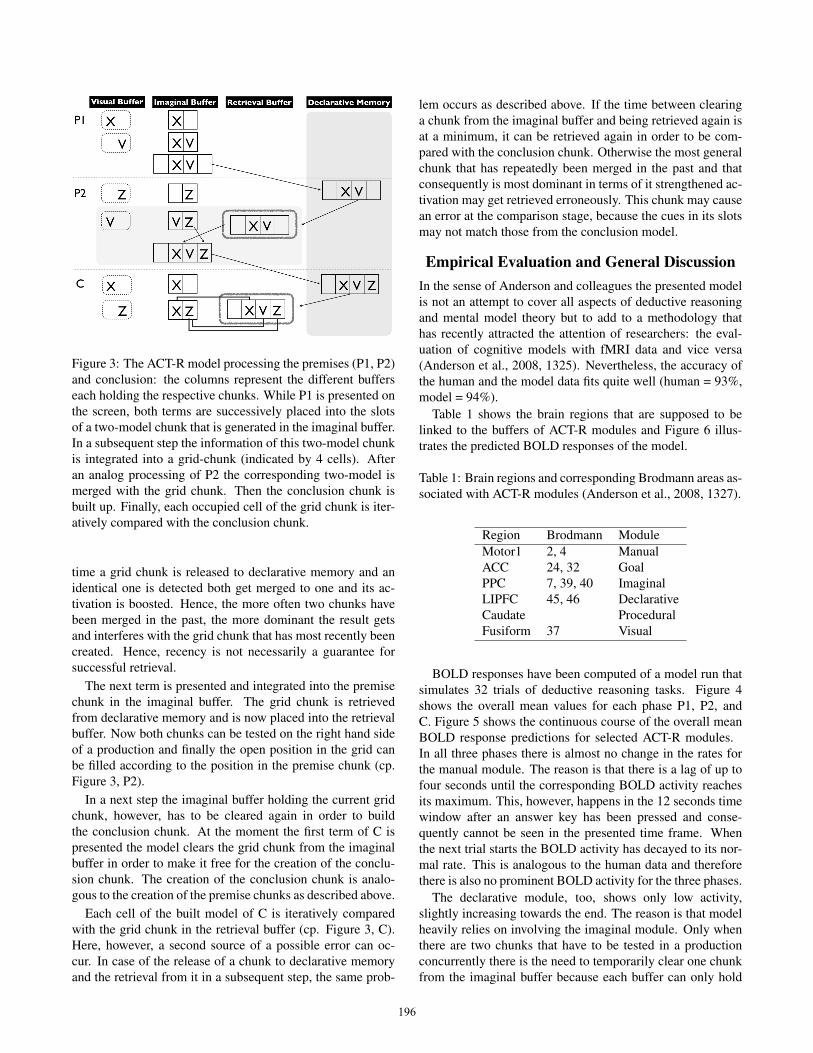
Figure 3: The ACT-R model processing the premises (P1, P2)and conclusion: the columns represent the different bufferseach holding the respective chunks. While P1 is presented onthe screen, both terms are successively placed into the slotsof a two-model chunk that is generated in the imaginal buffer.In a subsequent step the information of this two-model chunkis integrated into a grid-chunk (indicated by 4 cells). Afteran analog processing of P2 the corresponding two-model ismerged with the grid chunk. Then the conclusion chunk isbuilt up. Finally, each occupied cell of the grid chunk is iter-atively compared with the conclusion chunk.
time a grid chunk is released to declarative memory and anidentical one is detected both get merged to one and its ac-tivation is boosted. Hence, the more often two chunks havebeen merged in the past, the more dominant the result getsand interferes with the grid chunk that has most recently beencreated. Hence, recency is not necessarily a guarantee forsuccessful retrieval.
The next term is presented and integrated into the premisechunk in the imaginal buffer. The grid chunk is retrievedfrom declarative memory and is now placed into the retrievalbuffer. Now both chunks can be tested on the right hand sideof a production and finally the open position in the grid canbe filled according to the position in the premise chunk (cp.Figure 3, P2).
In a next step the imaginal buffer holding the current gridchunk, however, has to be cleared again in order to buildthe conclusion chunk. At the moment the first term of C ispresented the model clears the grid chunk from the imaginalbuffer in order to make it free for the creation of the conclu-sion chunk. The creation of the conclusion chunk is analo-gous to the creation of the premise chunks as described above.
Each cell of the built model of C is iteratively comparedwith the grid chunk in the retrieval buffer (cp. Figure 3, C).Here, however, a second source of a possible error can oc-cur. In case of the release of a chunk to declarative memoryand the retrieval from it in a subsequent step, the same prob-
lem occurs as described above. If the time between clearinga chunk from the imaginal buffer and being retrieved again isat a minimum, it can be retrieved again in order to be com-pared with the conclusion chunk. Otherwise the most generalchunk that has repeatedly been merged in the past and thatconsequently is most dominant in terms of it strengthened ac-tivation may get retrieved erroneously. This chunk may causean error at the comparison stage, because the cues in its slotsmay not match those from the conclusion model.
Empirical Evaluation and General DiscussionIn the sense of Anderson and colleagues the presented modelis not an attempt to cover all aspects of deductive reasoningand mental model theory but to add to a methodology thathas recently attracted the attention of researchers: the eval-uation of cognitive models with fMRI data and vice versa(Anderson et al., 2008, 1325). Nevertheless, the accuracy ofthe human and the model data fits quite well (human = 93%,model = 94%).
Table 1 shows the brain regions that are supposed to belinked to the buffers of ACT-R modules and Figure 6 illus-trates the predicted BOLD responses of the model.
Table 1: Brain regions and corresponding Brodmann areas as-sociated with ACT-R modules (Anderson et al., 2008, 1327).
Region Brodmann ModuleMotor1 2, 4 ManualACC 24, 32 GoalPPC 7, 39, 40 ImaginalLIPFC 45, 46 DeclarativeCaudate ProceduralFusiform 37 Visual
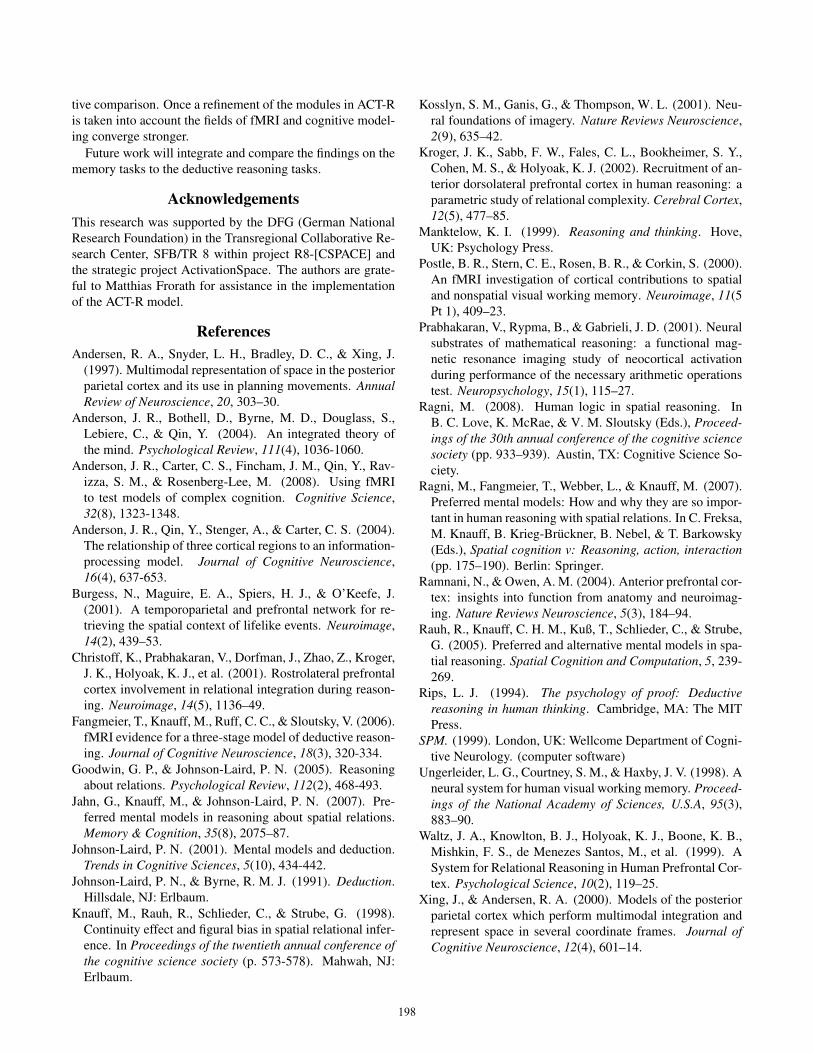
BOLD responses have been computed of a model run thatsimulates 32 trials of deductive reasoning tasks. Figure 4shows the overall mean values for each phase P1, P2, andC. Figure 5 shows the continuous course of the overall meanBOLD response predictions for selected ACT-R modules.In all three phases there is almost no change in the rates forthe manual module. The reason is that there is a lag of up tofour seconds until the corresponding BOLD activity reachesits maximum. This, however, happens in the 12 seconds timewindow after an answer key has been pressed and conse-quently cannot be seen in the presented time frame. Whenthe next trial starts the BOLD activity has decayed to its nor-mal rate. This is analogous to the human data and thereforethere is also no prominent BOLD activity for the three phases.
The declarative module, too, shows only low activity,slightly increasing towards the end. The reason is that modelheavily relies on involving the imaginal module. Only whenthere are two chunks that have to be tested in a productionconcurrently there is the need to temporarily clear one chunkfrom the imaginal buffer because each buffer can only hold
196

BO
LD r
espo
nse
0.00
0.05
0.10
0.15
P1 P2 C
visualproduction
goalretrieval
imaginalmanual
Figure 4: The overall mean BOLD response predictions forsix ACT-R modules for the first premise (P1), the secondpremise (P2), and the conclusion (C).
Time (seconds)
BO
LD r
espo
nse
0.00
0.02
0.04
0.06
0.08
0.10
0.12
0 2 4 6 8 10 12
● ● ● ● ● ● ● ●
●
●
●
●
●
●
●
●●
●
●● ● ● ● ● ●
imaginalretrieval
manualvisual
●
Figure 5: The course of the overall mean BOLD responsepredictions for selected ACT-R modules.
one chunk at a time. The model chunk gets retrieved immedi-ately from declarative memory again via the retrieval buffer.There is, however, in most cases only one retrieval towardsthe end of P2 so that the predicted BOLD response is notcomparable to that of the imaginal buffer. Only when the firstterm of the second premise presented on the screen has notbeen seen before a second retrieval is required. In addition,the maximum rate will, similar to that of the motor module,be in the lag of 12 seconds between two trials.
In the following, we concentrate the empirical evaluationof the correspondence between model and fMRI data on thosethree brain regions that have both been investigated in thestudy of Fangmeier et al. (2006) and that are also linked tothe buffers of ACT-R modules. Figure 6 directly compareshuman data with model data. The scales for the human data,however, should be compared with caution, because typicallyin fMRI research the ∆-adjusted BOLD function with respectto mean activation is reported. For the present work thisimplied a transformation of the ∆-adjusted BOLD to abso-lute values in order to get comparable charts with the ACT-RBOLD response predictions. All predicted values of ACT-Rwere within an interval of [0.0-1.0], whereas in fMRI the beta
means are not restricted to a fixed interval (i.e. values can alsobe negative or beyond 1.0). However, comparing the resultsat a qualitative level shows a similar pattern as is illustratedin Figure 6. An interesting difference between the predicted
1 Calculated from the ∆-adjusted BOLD (Fangmeier et al., 2006).
Figure 6: The overall mean BOLD responses for three brainregions (top) and the corresponding predictions of three ACT-R modules (bottom) for the first premise (P1), the secondpremise (P2), and the conclusion (C): the occipito-temporalcortex (OTC) overlaps with Brodmann area (BA) 37 and islinked to the visual module; the anterior prefrontal cortex(APFC) overlaps with the anterior cingulate cortex, BA 32),that is linked with the goal module; the posterior parietal cor-tex (PPC) overlaps with BA 7, 40 and is linked to the imaginalmodule. Each phase (P1, P2, C) lasts 4 seconds resulting in atotal presentation duration of 12 seconds (cf. Fig. 1 and 5).
BOLD function and the experimental results is within P2: thedifference between the BOLD linked to the visual moduleand the corresponding brain region of occipito-temporal cor-tex (OTC). This remains still an open question.
Taken together, ACT-R 6.0 offers a powerful possibility topredict behavior and associated brain activations. This allowsto model the different levels from neurological evidence tosymbolic modeling. Integrating neurological findings have amain advantage for cognitive modeling: The goodness-to-fitcan be extended far beyond the behavioral data, especiallyfor the domain of complex cognition (Anderson et al., 2008,1324). Differences in the setting can be traced back to differ-ent modules (which have different activation patterns). Cer-tainly, a main problem is to compare results of the fMRI stud-ies with predictions of the BOLD-function since additionalwork is necessary to identify the different scaling and in-tensity of the activations. So in some sense, the predictedBOLD function gives a good intuition, especially for qualita-
197
tive comparison. Once a refinement of the modules in ACT-Ris taken into account the fields of fMRI and cognitive model-ing converge stronger.
Future work will integrate and compare the findings on thememory tasks to the deductive reasoning tasks.
AcknowledgementsThis research was supported by the DFG (German NationalResearch Foundation) in the Transregional Collaborative Re-search Center, SFB/TR 8 within project R8-[CSPACE] andthe strategic project ActivationSpace. The authors are grate-ful to Matthias Frorath for assistance in the implementationof the ACT-R model.
ReferencesAndersen, R. A., Snyder, L. H., Bradley, D. C., & Xing, J.
(1997). Multimodal representation of space in the posteriorparietal cortex and its use in planning movements. AnnualReview of Neuroscience, 20, 303–30.
Anderson, J. R., Bothell, D., Byrne, M. D., Douglass, S.,Lebiere, C., & Qin, Y. (2004). An integrated theory ofthe mind. Psychological Review, 111(4), 1036-1060.
Anderson, J. R., Carter, C. S., Fincham, J. M., Qin, Y., Rav-izza, S. M., & Rosenberg-Lee, M. (2008). Using fMRIto test models of complex cognition. Cognitive Science,32(8), 1323-1348.
Anderson, J. R., Qin, Y., Stenger, A., & Carter, C. S. (2004).The relationship of three cortical regions to an information-processing model. Journal of Cognitive Neuroscience,16(4), 637-653.
Burgess, N., Maguire, E. A., Spiers, H. J., & O’Keefe, J.(2001). A temporoparietal and prefrontal network for re-trieving the spatial context of lifelike events. Neuroimage,14(2), 439–53.
Christoff, K., Prabhakaran, V., Dorfman, J., Zhao, Z., Kroger,J. K., Holyoak, K. J., et al. (2001). Rostrolateral prefrontalcortex involvement in relational integration during reason-ing. Neuroimage, 14(5), 1136–49.
Fangmeier, T., Knauff, M., Ruff, C. C., & Sloutsky, V. (2006).fMRI evidence for a three-stage model of deductive reason-ing. Journal of Cognitive Neuroscience, 18(3), 320-334.
Goodwin, G. P., & Johnson-Laird, P. N. (2005). Reasoningabout relations. Psychological Review, 112(2), 468-493.
Jahn, G., Knauff, M., & Johnson-Laird, P. N. (2007). Pre-ferred mental models in reasoning about spatial relations.Memory & Cognition, 35(8), 2075–87.
Johnson-Laird, P. N. (2001). Mental models and deduction.Trends in Cognitive Sciences, 5(10), 434-442.
Johnson-Laird, P. N., & Byrne, R. M. J. (1991). Deduction.Hillsdale, NJ: Erlbaum.
Knauff, M., Rauh, R., Schlieder, C., & Strube, G. (1998).Continuity effect and figural bias in spatial relational infer-ence. In Proceedings of the twentieth annual conference ofthe cognitive science society (p. 573-578). Mahwah, NJ:Erlbaum.
Kosslyn, S. M., Ganis, G., & Thompson, W. L. (2001). Neu-ral foundations of imagery. Nature Reviews Neuroscience,2(9), 635–42.
Kroger, J. K., Sabb, F. W., Fales, C. L., Bookheimer, S. Y.,Cohen, M. S., & Holyoak, K. J. (2002). Recruitment of an-terior dorsolateral prefrontal cortex in human reasoning: aparametric study of relational complexity. Cerebral Cortex,12(5), 477–85.
Manktelow, K. I. (1999). Reasoning and thinking. Hove,UK: Psychology Press.
Postle, B. R., Stern, C. E., Rosen, B. R., & Corkin, S. (2000).An fMRI investigation of cortical contributions to spatialand nonspatial visual working memory. Neuroimage, 11(5Pt 1), 409–23.
Prabhakaran, V., Rypma, B., & Gabrieli, J. D. (2001). Neuralsubstrates of mathematical reasoning: a functional mag-netic resonance imaging study of neocortical activationduring performance of the necessary arithmetic operationstest. Neuropsychology, 15(1), 115–27.
Ragni, M. (2008). Human logic in spatial reasoning. InB. C. Love, K. McRae, & V. M. Sloutsky (Eds.), Proceed-ings of the 30th annual conference of the cognitive sciencesociety (pp. 933–939). Austin, TX: Cognitive Science So-ciety.
Ragni, M., Fangmeier, T., Webber, L., & Knauff, M. (2007).Preferred mental models: How and why they are so impor-tant in human reasoning with spatial relations. In C. Freksa,M. Knauff, B. Krieg-Bruckner, B. Nebel, & T. Barkowsky(Eds.), Spatial cognition v: Reasoning, action, interaction(pp. 175–190). Berlin: Springer.
Ramnani, N., & Owen, A. M. (2004). Anterior prefrontal cor-tex: insights into function from anatomy and neuroimag-ing. Nature Reviews Neuroscience, 5(3), 184–94.
Rauh, R., Knauff, C. H. M., Kuß, T., Schlieder, C., & Strube,G. (2005). Preferred and alternative mental models in spa-tial reasoning. Spatial Cognition and Computation, 5, 239-269.
Rips, L. J. (1994). The psychology of proof: Deductivereasoning in human thinking. Cambridge, MA: The MITPress.
SPM. (1999). London, UK: Wellcome Department of Cogni-tive Neurology. (computer software)
Ungerleider, L. G., Courtney, S. M., & Haxby, J. V. (1998). Aneural system for human visual working memory. Proceed-ings of the National Academy of Sciences, U.S.A, 95(3),883–90.
Waltz, J. A., Knowlton, B. J., Holyoak, K. J., Boone, K. B.,Mishkin, F. S., de Menezes Santos, M., et al. (1999). ASystem for Relational Reasoning in Human Prefrontal Cor-tex. Psychological Science, 10(2), 119–25.
Xing, J., & Andersen, R. A. (2000). Models of the posteriorparietal cortex which perform multimodal integration andrepresent space in several coordinate frames. Journal ofCognitive Neuroscience, 12(4), 601–14.
198