Behind the Numbers. - · PDF fileHNI Corporation 2004 Annual Report HNI Behind the Numbers....
62
HNI Corporation 2004 Annual Report Behind the Numbers. HNI Corporation 2004 Annual Report
-
Upload
nguyendieu -
Category
Documents
-
view
224 -
download
4
Transcript of Behind the Numbers. - · PDF fileHNI Corporation 2004 Annual Report HNI Behind the Numbers....

414 East Third StreetMuscatine, Iowa 52761www.hnicorp.com
HNI Corporation
2004 Annual Report
Behind the Numbers. HN
I Corporation 2004 Annual Report

What’s behind our performance
I N V E S T O R I N F O R M AT I O N
Schedule of Quarterly ResultsThe Company operates on a fiscal year ending on the Saturday nearest December 31. Quarterly results are typically announced within 25 days after the end of each quarter, and audited results are typically announced within 40 days after year-end.
Fiscal 2005 Quarter-End Dates1st Quarter: Saturday, April 22nd Quarter: Saturday, July 23rd Quarter: Saturday, October 14th Quarter: Saturday, December 31
Annual MeetingThe Company’s annual shareholders’ meeting will be held at 10:30 a.m. on Tuesday, May 3, 2005, at the Holiday Inn, Highways 61 & 38 North, Muscatine, Iowa. Shareholders and other interested investors are encouraged to attend the meeting.
Investor RelationsSend inquiries to:Investor RelationsHNI Corporation414 East Third StreetMuscatine, IA 52761Telephone: 563.264.7400Fax: 563.264.7655E-mail: [email protected]
Corporate HeadquartersHNI Corporation414 East Third StreetP.O. Box 1109Muscatine, IA 52761-0071Telephone: 563.264.7400Fax: 563.264.7217Website: www.hnicorp.com
Independent Public AccountantsPricewaterhouseCoopers LLPOne North Wacker DriveChicago, IL 60606
Common StockHNI Corporation common stock trades on the New York Stock Exchange under the symbol: HNI. Stock price quotations can be found in major daily newspapers and The Wall Street Journal.Journal.Journal
Transfer AgentShareholders may report a change of address or make inquiries by writing or calling:Computershare Investor Services, LLC2 North LaSalle StreetChicago, IL 60602Telephone: 312.588.4991
Forward-Looking StatementsStatements in this report that are not strictly historical, including statements as to plans, objectives, and future financial performance, are “forward-looking” statements that are made pursuant to the safe harbor provisions of the Private Securities Litigation Reform Act of 1995. Forward-looking statements involve known and unknown risks, which may cause the Company’s actual results in the future to differ materially from expected results.
Because of the following risks, as well as other variables affecting the Company’s operating results, past fi nancial performance may not be a reliable indicator of future performance, and historical trends should not be used to anticipate results or trends in future periods:
• competition within the office furniture and fireplace industries, including competition from imported products and competitive pricing;
• increases in the cost of raw materials, including steel, which is the Company’s largest raw material category;
• the ability of the Company to realize financial benefits through price realization from its price increases;
• increases in the cost of health care benefits provided by the Company;
• reduced demand for the Company’s storage products caused by changes in office technology, including the change from paper record storage to electronic record storage;
• the effects of economic conditions on demand for office furniture, customer insolvencies, and related bad debts and claims against the Company that it received preferential payments;
• changes in demand and order patterns from the Company’s customers, particularly its top 10 customers, which represented approximately 36% of net sales in 2004;
• issues associated with acquisitions and integration of acquisitions;
• the ability of the Company to realize cost savings and productivity improvements from its cost containment and business simplification initiatives;
• the ability of the Company to realize financial benefits from investments in new products;
• the ability of the Company’s distributors and dealers to successfully market and sell the Company’s products;
• the availability and cost of capital to finance planned growth; and
• other risks, uncertainties, and factors described from time to time in the Company’s filings with the Securities and Exchange Commission.
We caution the reader that the above list of factors may not be exhaustive. The Company does not assume any obligation to update any forward-looking statement, whether as a result of new information, future events or otherwise.
Des
ign:
BCN
Com
mun
icat
ions
/ w
ww
.bcn
com
m.c
om
Exe
cuti
ve P
hoto
grap
hy: J
ames
Sch
nepf
P
rintin
g: C
enve
o A
nder
son
Lith
ogra
ph

is what will take us forward.
H N I C o r p o r a t io n 2 0 0 4 A n n u a l R e p o r t 1

It’s solid. Sustainable. Differentiating. Difficult for competitors to duplicate.
2 H N I C o r p o r a t io n 2 0 0 4 A n n u a l R e p o r t

It’s solid. Sustainable. Differentiating. Difficult for competitors to duplicate.
H N I C o r p o r a t io n 2 0 0 4 A n n u a l R e p o r t 3

It’s our culture.
4 H N I C o r p o r a t io n 2 0 0 4 A n n u a l R e p o r t

We’re different. The way we look at things, the way we work,
the way we’re structured—all express a strongly aligned set of beliefs
and priorities that exist at our core and drive our results. This is no gimmick.
It’s no slogan. Our culture is real. As real as every single person
who works here. That’s what is behind our numbers.
H N I C o r p o r a t io n 2 0 0 4 A n n u a l R e p o r t 5

6 H N I C o r p o r a t io n 2 0 0 4 A n n u a l R e p o r t
Culture matters.
H N I C o r p o r a t io n 2 0 0 4 A n n u a l R e p o r t 7
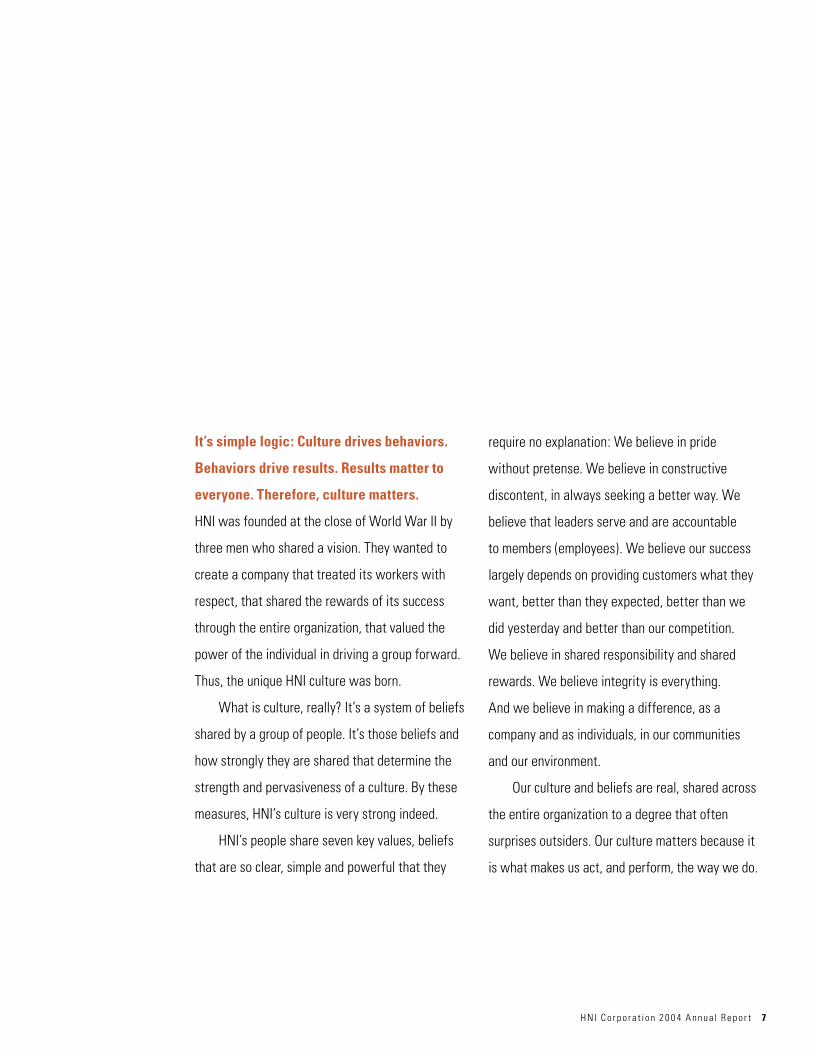
It’s simple logic: Culture drives behaviors.
Behaviors drive results. Results matter to
everyone. Therefore, culture matters.
HNI was founded at the close of World War II by
three men who shared a vision. They wanted to
create a company that treated its workers with
respect, that shared the rewards of its success
through the entire organization, that valued the
power of the individual in driving a group forward.
Thus, the unique HNI culture was born.
What is culture, really? It’s a system of beliefs
shared by a group of people. It’s those beliefs and
how strongly they are shared that determine the
strength and pervasiveness of a culture. By these
measures, HNI’s culture is very strong indeed.
HNI’s people share seven key values, beliefs
that are so clear, simple and powerful that they
require no explanation: We believe in pride
without pretense. We believe in constructive
discontent, in always seeking a better way. We
believe that leaders serve and are accountable
to members (employees). We believe our success
largely depends on providing customers what they
want, better than they expected, better than we
did yesterday and better than our competition.
We believe in shared responsibility and shared
rewards. We believe integrity is everything.
And we believe in making a difference, as a
company and as individuals, in our communities
and our environment.
Our culture and beliefs are real, shared across
the entire organization to a degree that often
surprises outsiders. Our culture matters because it
is what makes us act, and perform, the way we do.

8 H N I C o r p o r a t io n 2 0 0 4 A n n u a l R e p o r t
It’s different here.

H N I C o r p o r a t i o n 2 0 0 4 A n n u a l R e p o r t 9
We don’t call people who work here
employees. We call them members.
Everyone’s an owner, and acts like it.
If you have worked here for more than a year,
you have the opportunity to own stock in the
company. So the vast majority of HNI members
are HNI shareholders. They share in the profits
and success of the company, which creates a
strong ownership culture.
HNI members have an owner’s agenda.
They ask different questions and worry about
different things than a typical worker. They hold
themselves and others around them accountable
for results. As shareholders, our people know that
when HNI does well, they do well. As members,
they also know the reverse is true: When they
do well, so does HNI. It’s a perfect alignment of
individual and company interests.
This ownership culture drives another thing
that’s profoundly different at HNI: how top
managers and other members interact. Whenever
the CEO visits a plant floor, it’s as though he’s
meeting with key shareholders. In fact, that’s
exactly what he’s doing. He’s accountable to them
as much as they are to him, and everyone knows it.
It’s a friendly culture, but no one’s shy. “How’s it
going?” gets an honest answer. Problems are
pointed out and discussed, not hidden. This unique
dynamic creates something powerful: The people
who work here feel valued. They feel responsible.
And they feel empowered.
But it’s not easy here. If you don’t perform,
you hear about it. Not just from management, but
also from your co-workers. People work in teams.
They support each other. But it’s a relentlessly
challenging and goals-driven place to work. It’s not
for everyone—some people come here and thrive
while others struggle. We know our approach isn’t
the only way to do things. But it’s the HNI way.
And it works.

1 0 H N I C o r p o r a t io n 2 0 0 4 A n n u a l R e p o r t
Structured to perform.

H N I C o r p o r a t io n 2 0 0 4 A n n u a l R e p o r t 11
Our business model is a blend of independence
and interdependence. It joins the benefit of
laser-sharp market focus with the advantage
of collective scale. We call it the HNI split-and-
focus model. It’s a decentralized structure with a
great deal of communication, collaboration and
leveraging between operating companies.
Each operating company serves a distinct
market. To serve that market best, each has its own
strategic plan, its own distinctive, tailored selling
and fulfillment models, and its own financial model.
We believe strongly that smaller, focused groups of
skilled, dedicated people, empowered and energized
in the right business models, are very effective
competitors to larger, more-centralized organizations.
It makes us more agile. More targeted. More able
to identify and fulfill the unique needs of the market.
We believe this split-and-focus approach,
where leaders in each operating company have
responsibility for a distinct P&L, a specialist’s
knowledge of the target market and the ability
to operate with minimal corporate interference,
is a much more effective way to deliver value
to customers and, ultimately, to shareholders.
This isn’t to say that our operating companies
don’t leverage HNI’s collective resources. They do.
They leverage the procurement function, gaining
economies of scale in the purchase of raw materials
and services. They share and leverage core functions
such as logistics and IT, as well as best practices—
from lean manufacturing to product development to
marketing techniques—across the entire enterprise,
even between our office furniture and hearth
businesses. Operating company leaders regularly
communicate with one another, treating HNI as a
sort of best-practice supermarket. Shopping the
shelves, seeing something that makes sense, taking
it and applying it. How does this work? Very well,
because of shared beliefs and a shared goal:
the overall success of HNI.

12 H N I C o r p o r a t io n 2 0 0 4 A n n u a l R e p o r t
It’s our people.
H N I C o r p o r a t io n 2 0 0 4 A n n u a l R e p o r t 13
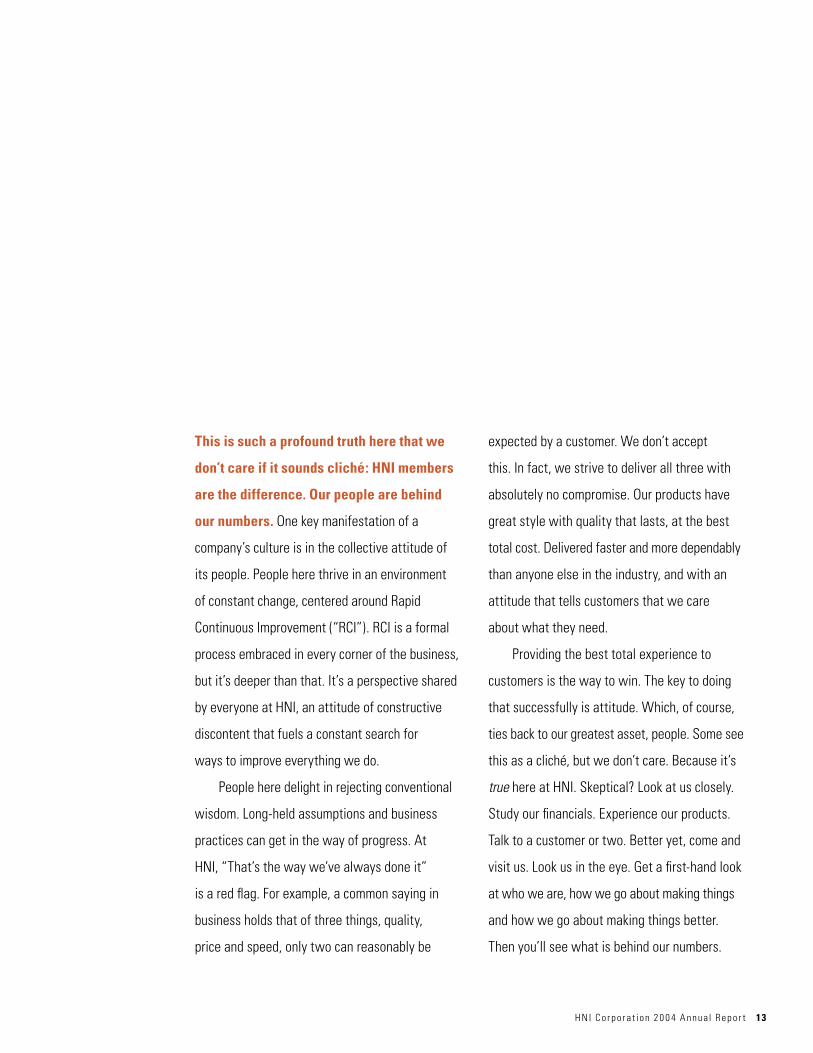
This is such a profound truth here that we
don’t care if it sounds cliché: HNI members
are the difference. Our people are behind
our numbers. One key manifestation of a
company’s culture is in the collective attitude of
its people. People here thrive in an environment
of constant change, centered around Rapid
Continuous Improvement (“RCI”). RCI is a formal
process embraced in every corner of the business,
but it’s deeper than that. It’s a perspective shared
by everyone at HNI, an attitude of constructive
discontent that fuels a constant search for
ways to improve everything we do.
People here delight in rejecting conventional
wisdom. Long-held assumptions and business
practices can get in the way of progress. At
HNI, “That’s the way we’ve always done it”
is a red flag. For example, a common saying in
business holds that of three things, quality,
price and speed, only two can reasonably be
expected by a customer. We don’t accept
this. In fact, we strive to deliver all three with
absolutely no compromise. Our products have
great style with quality that lasts, at the best
total cost. Delivered faster and more dependably
than anyone else in the industry, and with an
attitude that tells customers that we care
about what they need.
Providing the best total experience to
customers is the way to win. The key to doing
that successfully is attitude. Which, of course,
ties back to our greatest asset, people. Some see
this as a cliché, but we don’t care. Because it’s
true here at HNI. Skeptical? Look at us closely.
Study our financials. Experience our products.
Talk to a customer or two. Better yet, come and
visit us. Look us in the eye. Get a first-hand look
at who we are, how we go about making things
and how we go about making things better.
Then you’ll see what is behind our numbers.

F I N A N C I A L H I G H L I G H T S
14 H N I C o r p o r a t io n 2 0 0 4 A n n u a l R e p o r t
Amounts in thousands, except for per share data 2004 2003 Change
Income Statement DataNet sales $2,093,447 $1,755,728 19.2 %Gross profit 751,304 639,215 17.5 %Gross profit as a % of: Net sales 35.9% 36.4% –
Selling and administrative expenses 572,006 480,744 19.0 %Restructuring related charges 886 8,510 (89.6) %Operating income 178,412 149,961 19.0 %Net income 113,582 98,105 15.8 %Net income as a % of: Net sales 5.4% 5.6% –
Average shareholders’ equity 16.5% 14.5% –
Per common share: Net income – basic $÷÷÷÷«1.99 $÷÷÷÷«1.69 17.8 % Net income – diluted 1.97 1.68 17.3 % Book value – basic 12.10 12.19 (0.7) % Cash dividends 0.56 0.52 7.7 %
Balance Sheet DataCurrent assets $÷«374,579 $÷«462,122 (18.9) %Total assets 1,021,657 1,021,826 (0.0) %Current liabilities 266,250 245,816 8.3 %Current ratio 1.41 1.88 –
Long-term debt and capital lease obligations $÷÷÷«3,645 $÷÷÷«4,126 (11.7) %Debt/capitalization ratio 0.6% 4.2% –
Shareholders’ equity $÷«669,163 $÷«709,889 (5.7) %Average shareholders’ equity 689,526 678,391 1.6 %Working capital 108,329 216,306 (49.9) %
Other DataCapital expenditures $÷÷«32,417 $÷÷«34,842 (7.0) %Cash flow from operations 194,256 141,274 37.5 %Weighted-average shares outstanding during year – basic 57,127,110 58,178,739 (1.8) %Price/earnings ratio at year-end 22 26 –
Number of shareholders at year-end 6,465 6,416 0.8 %Members (employees) at year-end 10,589* 8,926 18.6 %
* Includes acquisitions completed during year
2000
2001
2002
2003
2004
2,04
6
1,79
2
1,69
2
1,75
6
2,09
3
Net Sales(in millions)
2000
2001
2002
2003
2004
106
74
91
98
114
Net Income(in millions)
2000
2001
2002
2003
2004
19.8
12.8
14.7
14.5
16.5
Return on AverageShareholders’ Equity(percent)
2000
2001
2002
2003
2004
1.77
1.26
1.55 1.
68
1.97
Diluted Earningsper Share(dollars)
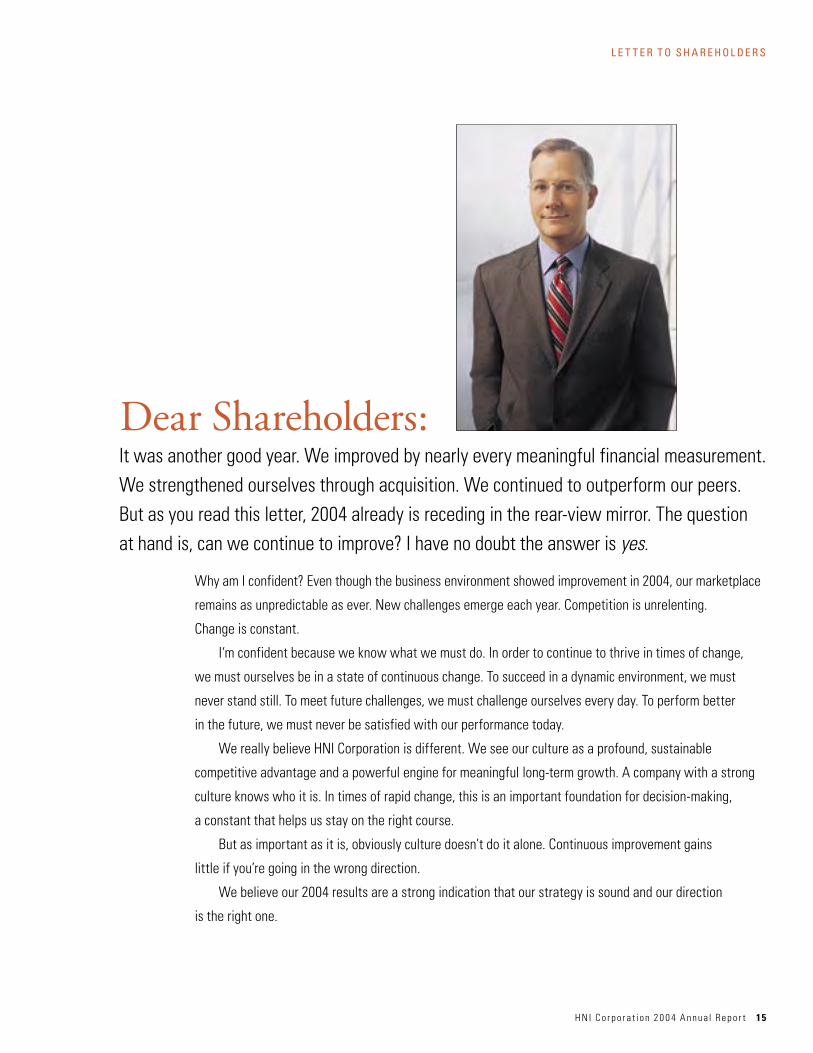
Why am I confident? Even though the business environment showed improvement in 2004, our marketplace
remains as unpredictable as ever. New challenges emerge each year. Competition is unrelenting.
Change is constant.
I‘m confident because we know what we must do. In order to continue to thrive in times of change,
we must ourselves be in a state of continuous change. To succeed in a dynamic environment, we must
never stand still. To meet future challenges, we must challenge ourselves every day. To perform better
in the future, we must never be satisfied with our performance today.
We really believe HNI Corporation is different. We see our culture as a profound, sustainable
competitive advantage and a powerful engine for meaningful long-term growth. A company with a strong
culture knows who it is. In times of rapid change, this is an important foundation for decision-making,
a constant that helps us stay on the right course.
But as important as it is, obviously culture doesn’t do it alone. Continuous improvement gains
little if you’re going in the wrong direction.
We believe our 2004 results are a strong indication that our strategy is sound and our direction
is the right one.
It was another good year. We improved by nearly every meaningful financial measurement. We strengthened ourselves through acquisition. We continued to outperform our peers. But as you read this letter, 2004 already is receding in the rear-view mirror. The question at hand is, can we continue to improve? I have no doubt the answer is yes.
Dear Shareholders:
L E T T E R T O S H A R E H O L D E R S
H N I C o r p o r a t io n 2 0 0 4 A n n u a l R e p o r t 15

L E T T E R T O S H A R E H O L D E R S
Our objective: aggressive, profitable growth
We seek to achieve long-term value for all our stakeholders by growing aggressively and profitably.
How, specifically, does HNI plan to accomplish this?
We will achieve the broader objective by focusing on several specific ones: Continue to build a
market-driven, operationally excellent organization. Achieve leading positions in each of the markets we
serve. Significantly increase our profit. Deliver and sustain above-average returns. Consistently achieve
most-admired status among our corporate peers. Live the HNI vision statement outlined on the last
page of this annual report.
Our strategic framework
Our strategies for converting these objectives into aggressive profitable growth fall under three critical
areas of performance—accelerating our initiatives to further leverage our lean enterprise and achieve
best total cost; building market power; and continuing to enhance our culture and capabilities.
We sometimes look at our business as a bicycle, with the back wheel representing our operations
and production, and the front wheel representing our sales and marketing.
We have always been strongest in the “back wheel” of our business. We have had lean practices
and Rapid Continuous Improvement (“RCI“) processes in place since the early nineties. Our drive now is to
accelerate our improvement across the entire business and focus it to benefit the end-user. The concept
of “best total cost” connects RCI to those who ultimately buy our products—extending our lean practices
across the entire value stream, from manufacturing through sales, to deliver what we call efficient
effectiveness.
The front wheel is getting an equally intense focus across our business. We are building market
power by working to understand—and then developing innovative ways to deliver—what end-users need
and want. We have put considerable effort into clearly defining our brands; we now are implementing
comprehensive strategies to increase the power of each in its respective market. We’re fine-tuning our
selling processes to support our brand strategies and align with end-user needs. We’re developing industry-
leading distribution models, and we’re continuing the strong emphasis on new product development that
has so energized our showrooms over the past several years.
1 6 H N I C o r p o r a t io n 2 0 0 4 A n n u a l R e p o r t
L E T T E R T O S H A R E H O L D E R S
H N I C o r p o r a t io n 2 0 0 4 A n n u a l R e p o r t 17
If operations is the back wheel and marketing is the front wheel of the bicycle, then culture represents
the human force that drives the pedals. We are committed to building our culture and collective intelligence
through continuous development of our members and recruitment of new talent—supporting the ongoing
search for new ideas, the constant pursuit of a better way, in everything we do. Equally important, we
are working to ensure that member rewards and incentives continue to align with our strategic direction.
And as we grow through acquisition, we’ll strike a balance between helping our new members assimilate
our culture and values, and benefiting as a company from the new perspectives and practices they
bring to us.
Thank you
We are pleased with the addition of John A. Halbrook, Larry B. Porcellato and Miguel M. Calado to our
Board of Directors in 2004. We already have benefited from their considerable business experience and
leadership. HNI’s Board of Directors is strong—I want to take this opportunity to thank them for their
support and counsel.
I am privileged to lead this company as it begins its next chapter of development. On behalf of my
fellow members, I would like to extend our heartfelt gratitude to Jack Michaels, who retired as Chairman
of the Board in November of 2004. The example Jack set as leader of this company for 14 years is both
humbling and inspiring to me. To Jack, it is never about him. It’s about the company, first, foremost and
always. He did an excellent job in achieving the HNI leader’s mandate: build upon the legacy of the
founders, and help members take this company to a level never dreamed of when it all began in 1944.
As Chairman, President and Chief Executive Officer, this is now my mandate and I am proud to accept
it. With the solid foundation Jack left us, the support of our Board and the dedication of our members,
I have no doubt that we can achieve great things together in 2005 and beyond.
Stan A. Askren
Chairman, President and Chief Executive Officer
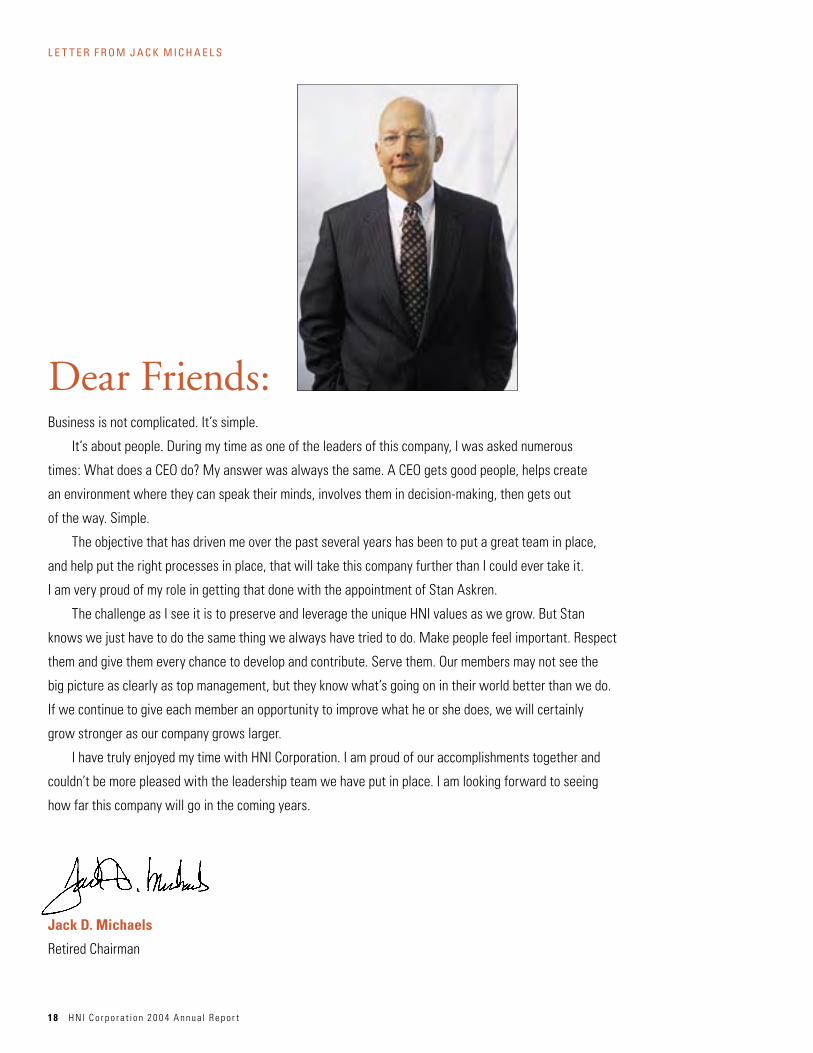
L E T T E R F R O M J A C K M I C H A E L S
Dear Friends:Business is not complicated. It’s simple.
It’s about people. During my time as one of the leaders of this company, I was asked numerous
times: What does a CEO do? My answer was always the same. A CEO gets good people, helps create
an environment where they can speak their minds, involves them in decision-making, then gets out
of the way. Simple.
The objective that has driven me over the past several years has been to put a great team in place,
and help put the right processes in place, that will take this company further than I could ever take it.
I am very proud of my role in getting that done with the appointment of Stan Askren.
The challenge as I see it is to preserve and leverage the unique HNI values as we grow. But Stan
knows we just have to do the same thing we always have tried to do. Make people feel important. Respect
them and give them every chance to develop and contribute. Serve them. Our members may not see the
big picture as clearly as top management, but they know what’s going on in their world better than we do.
If we continue to give each member an opportunity to improve what he or she does, we will certainly
grow stronger as our company grows larger.
I have truly enjoyed my time with HNI Corporation. I am proud of our accomplishments together and
couldn’t be more pleased with the leadership team we have put in place. I am looking forward to seeing
how far this company will go in the coming years.
Jack D. Michaels
Retired Chairman
18 H N I C o r p o r a t io n 2 0 0 4 A n n u a l R e p o r t

This is HNI.Product excitement and performance in the office;
warmth and beauty in the home.
H N I C o r p o r a t io n 2 0 0 4 A n n u a l R e p o r t 19

Allsteel Inc. delivers the highest level of style, design, functionality, durability and service to the large corporate and designer/specifier markets. By focusing on these five elements of quality, we provide something more to customers: productive and inspired employees, a more functional environment and a space that makes a positive statement about who works there. We pride ourselves on being easy to work with, responsive and responsible. This is Allsteel: Designed to work. Built to last.
2 0 H N I C o r p o r a t io n 2 0 0 4 A n n u a l R e p o r t
®

H N I C o r p o r a t io n 2 0 0 4 A n n u a l R e p o r t 2 1
The HON Company is North America’s brand of choice for small and medium-sized businesses. From file cabinets to executive chairs, desks to suites, The HON Company offers a full line of affordable and stylish products that look great for years to come. As businesses expand, HON designs allow new products to easily integrate with existing solutions. The HON Company’s nationwide distribution network provides industry-leading access to top-selling products. The HON Company: Practical and professional.
®

2 2 H N I C o r p o r a t io n 2 0 0 4 A n n u a l R e p o r t
The Gunlocke Company L.L.C. is one of America’s most established and respected producers of quality wood office furniture. The Gunlocke Company brings the elegance and beauty of wood to a wide range of products, including executive casegoods, seating, lounge furniture and confer-ence tables. Founded in 1902, The Gunlocke Company has been known for more than a century for crafting distinctive, tailored, image-driven solutions for business and government clients. The Gunlocke Company focuses primarily on the contract market and furniture specifying communities. The Gunlocke Company: Timely and tailored.
®

H N I C o r p o r a t io n 2 0 0 4 A n n u a l R e p o r t 2 3
Paoli Inc. is one of the leading providers of high-aesthetic wood desks and seating at moderate prices for small to medium-sized companies and furniture specifiers who serve them. Paoli Inc. is known for its broad line of products and quick-ship program, close relationships and positivereputation with dealers, flexibility and responsiveness to customer needs, and experienced, dedicated management team. Paoli Inc. goes to market through the Paoli and Whitehall brands. This is the Paoli brand promise: Stylish furniture, affordable prices.
™

2 4 H N I C o r p o r a t io n 2 0 0 4 A n n u a l R e p o r t
Maxon Furniture Inc. is a leading provider of planned offices for small to mid-sized businesses. Maxon Furniture excels at providing information about office environments, flawless execution and the strong positive experiences that new, well-planned offices can bring. The Maxon edge is in reaching its customers directly and then delivering them to Maxon dealer-partners. The Maxon QuickShip program includes virtually its entire product line and is among the fastest and most extensive in the industry. To put it simply, Maxon gets you working fast.
Holga Inc. provides high-quality, high-density storage products through an extensive network of local dealers. Creating solutions that dramatically increase storage capacity and reduce floor space needed to house it, Holga constructs products to exacting standards and tailors its high-density systems to fit the unique needs of each individual customer. Delivering value every step of the way, from planning to budgeting through follow-up, Holga Inc. is committed to creating enduring relation- ships with end-users in businesses of all sizes.
®
®®

H N I C o r p o r a t io n 2 0 0 4 A n n u a l R e p o r t 2 5
HNI International Inc. delivers office furniture solutions outside of the United States and Canada. HNI International supports global corporate accounts as well as domestic and international dealers with sales, installation and service for industries all over the globe. With dealers, members and servicing partners in many countries, HNI International can provide complete project management virtually anywhere in the world.
Omni Remanufacturing Inc. comprises two divisions serving corporate America: A&M Business Interior Services and IntraSpec Solutions. A&M executes professional office furniture services for Fortune 1000 customers and contract furniture dealerships, simplifying the work order, management and reporting process. IntraSpec Solutions provides high-quality remanufactured brand-name office furniture systems for customers large and small.IntraSpec Solutions asset management and trade-in programs help customers with standardized systems get the most value for their existing furniture assets.
™

Heatilator® is the most recognized and preferred fireplace brand among homebuilders. Leading builders choose Heatilator because they know that the brand assures their customers continuous comfort and reliability.
®
2 6 H N I C o r p o r a t io n 2 0 0 4 A n n u a l R e p o r t
™
Fireside Hearth & Home™ is the nation’s leading provider of hearth and home products and services. Fireside Hearth & Home design centers help consumers achieve the feeling they want in their homes by supporting the entire buying process—from purchase to installation and after-sale service. Fireside Hearth & Home works through a network of independent and company-owned stand-alone or gallery design centers, as well as installation centers, catering both to consumers and builders.

H N I C o r p o r a t io n 2 0 0 4 A n n u a l R e p o r t 2 7
Heat & Glo™ is the hearth industry’s steadfast leader in design and innovation. Heat & Glo is known as the premium brand in the marketplace because it has consistently developed hearth products that push technological and design boundaries—creating a balance of style and sophistication in the home.
Quadra-Fire® is the leader in highly efficient, durable and powerful hearth products. The Quadra-Fire brand offers specialty channel partners the widest selection of high- performance fireplaces, stoves and fireplace inserts in the wood, gas, pellet and electric fuel categories. Quadra-Fire products are designed with a mind toward efficiency and an eye toward beauty balanced with ruggedness. The products use heavy-gauge steel and cast iron along with design details for both performance and appearance.
®
™
28 HNI Corporat ion and Subsidiar ies 2004 Annual Report
Management’s Discussion and Analysis
The following discussion of the Company’s historical results of operations and of its liquidity and capital resources should be read in conjunction with the Consolidated Financial Statements of the Company and related notes.
Overview
The Company has two reportable core operating segments: office fur-niture and hearth products. The Company is the second largest office furniture manufacturer in the United States and the nation’s leading manufacturer and marketer of gas- and wood-burning fireplaces.
The Company changed its name, with the approval of its share-holders, from HON INDUSTRIES Inc. to HNI Corporation effective May 5, 2004. The Company believes that changing its name will allow it to accomplish three important goals as it moves forward with its strategy of managing multiple distinct and independent brands: 1) create a corporate identity that clearly represents who it is today – the parent company for many of the leading brand name companies in the office furniture and hearth markets; 2) establish a corporate brand that better reflects the Company’s strategic growth program – product line extensions, market expansion, and strategic acquisitions; and 3) eliminate the confusion in the marketplace, resulting from the use of “HON” in both the corporate name and in the name of its largest operating company, and clarify the ownership of our other operating companies and their relationship with The HON Company.
During 2004, the office furniture industry experienced a slight rebound from its unprecedented three-year decline experienced from 2000 to 2003. In 2004, this positively impacted the Company’s office furniture segment. The housing market remained strong during 2004, which positively impacted the Company’s hearth segment. The Company gained market share by providing strong brands, innovative products and services, and greater value to its end-users. During 2004, the Company experienced large material price increases, steel in particular, which negatively impacted its bottom line growth in both segments.
Net sales were $2.1 billion in 2004 as compared to $1.8 billion in 2003, an increase of over 19 percent. Sales from the Company’s acquisitions during 2004 accounted for approximately $136 million of the sales increase, and approximately $36 million was due to price increases. Gross margins decreased to 35.9% in 2004 from 36.4% in 2003 due to increased steel and other material costs of approximately $73 million. The Company also continued to invest aggressively in brand building and selling initiatives in 2004. In 2003, the Company recorded restructuring charges and accelerated depreciation related to the shutdown and consolidation of office furniture facilities totaling $15.2 million. During 2004, the Company recorded approximately $0.9 million of net current period charges related to those shutdowns. Net income was $113.6 million or $1.97 per diluted share in 2004 as compared to $98.1 million or $1.68 per diluted share in 2003.
The Company completed three office furniture business acquisitions during fiscal year 2004: Paoli, Inc. (January 5); Omni Remanufacturing, Inc. (July 6); and Architectural Installations Atlanta, Inc. (December 9).
The Company completed two hearth products business acquisitions during fiscal year 2004: Hearth and Home Distributors of Delaware, Inc. (January 5); and Edward George Company and its affiliate, Wisconsin Fireplace Systems (July 19). The Company also acquired certain assets of Fullness International Corporation, a strategic sourcing entity, on October 4, 2004. The consideration for each of these transactions was paid in cash.
The Company generated $194.3 million in cash flow from operating activities during 2004, compared to $141.3 million in 2003. The Company paid dividends of $32.0 million and repurchased $145.6 million of its common stock, while investing $134.8 million in strategic acquisitions and $32.8 million in net capital expenditures and repaying $26.8 million of debt in 2004.
Critical Accounting Policies and Estimates
GENERAL
Management’s Discussion and Analysis of Financial Condition and Results of Operations is based upon the Consolidated Financial Statements, which have been prepared in accordance with Generally Accepted Accounting Principles (“GAAP”). The preparation of these financial statements requires management to make estimates and assumptions that affect the reported amounts of assets, liabilities, revenue and expenses, and related disclosure of contingent assets and liabilities. Management bases its estimates on historical experience and on various other assumptions that are believed to be reasonable under the circumstances, the results of which form the basis for making judgments about the carrying values of assets and liabilities that are not readily apparent from other sources. Senior manage-ment has discussed the development, selection, and disclosure of these estimates with the Audit Committee of our Board of Directors. Actual results may differ from these estimates under different assumptions or conditions.
An accounting policy is deemed to be critical if it requires an accounting estimate to be made based on assumptions about matters that are uncertain at the time the estimate is made, and if different estimates that reasonably could have been used, or changes in the accounting estimates that are reasonably likely to occur periodically, could materially impact the financial statements. Management believes the following critical accounting policies reflect its more significant estimates and assumptions used in the preparation of the Consolidated Financial Statements.
Fiscal year-end – The Company follows a 52/53-week fiscal year that ends on the Saturday nearest December 31. Fiscal year 2004 ended on January 1, 2005; 2003 ended on January 3, 2004; and 2002 ended on December 28, 2002. The financial statements for fiscal year 2003 are based on a 53-week period; fiscal years 2004 and 2002 are on a 52-week basis. A 53-week year occurs approxi-mately every sixth year.
Revenue recognition – Revenue is normally recognized upon ship-ment of goods to customers. In certain circumstances revenue is not recognized until the goods are received by the customer or upon installation and customer acceptance based on the terms of the sale

HNI Corporat ion and Subsidiar ies 2004 Annual Report 29
Management’s Discussion and Analysis
agreement. Revenue includes freight charged to customers; related costs are included in selling and administrative expense. Rebates, discounts, and other marketing program expenses directly related to the sale are recorded as a reduction to net sales. Marketing program accruals require the use of management estimates and the consider-ation of contractual arrangements subject to interpretation. Customer sales that reach certain award levels can affect the amount of such estimates, and actual results could differ from these estimates. Future market conditions may require increased incentive offerings, possibly resulting in an incremental reduction in net sales at the time the incentive is offered.
Allowance for doubtful accounts receivable – The allowance for doubtful accounts receivable is based on several factors including overall customer credit quality, historical write-off experience, and specific account analysis that project the ultimate collectibility of the account. As such, these factors may change over time causing the reserve level to adjust accordingly.
When it is determined that a customer is unlikely to pay, a charge is recorded to bad debt expense in the income statement and the allowance for doubtful accounts is increased. When it becomes certain the customer cannot pay, the receivable is written off by removing the accounts receivable amount and reducing the allowance for doubtful accounts accordingly.
As of January 1, 2005, there was approximately $246 million in outstanding accounts receivable and $11 million recorded in the allowance for doubtful accounts to cover potential future customer non-payments. However, if economic conditions deteriorate significantly or one of our large customers were to declare bankruptcy, a larger allowance for doubtful accounts might be necessary. The allowance for doubtful accounts was approximately $11 million and $10 million at year-end 2003 and 2002, respectively.
Inventory valuation – The Company values 80% of its inventory by the last-in, first-out (LIFO) method. Additionally, the Company evaluates inventory reserves in terms of excess and obsolete exposure. This evaluation includes such factors as anticipated usage, inventory turnover, inventory levels, and ultimate product sales value. As such, these factors may change over time causing the reserve level to adjust accordingly. The reserves for excess and obsolete inventory were $7.7 million, $5.7 million, and $5.9 million at year-end 2004, 2003, and 2002, respectively.
Long-lived assets – Long-lived assets are reviewed for impairment as events or changes in circumstances occur indicating that the amount of the asset reflected in the Company’s balance sheet may not be recoverable. An estimate of undiscounted cash flows produced by the asset, or the appropriate group of assets, is compared to the carrying value to determine whether impairment exists. The estimates of future cash flows involve considerable management judgment and are based upon assumptions about future operating performance. The actual cash flows could differ from management’s estimates due to changes in business conditions, operating performance, and economic conditions. Asset impairment charges associated with the Company’s restructuring activities are discussed in the Restructuring Related Charges note to the Consolidated Financial Statements of the Company.
The Company’s continuous focus on improving the manufacturing process tends to increase the likelihood of assets being replaced; therefore, the Company is constantly evaluating the expected useful lives of its equipment, which can result in accelerated depreciation. Additionally, the Company recorded losses on the disposal of assets in the amount of $1 million and $5 million in 2003 and 2002, respec-tively, as a result of its rapid continuous improvement initiatives.
Goodwill and other intangibles – In accordance with the Statement of Financial Accounting Standards (“SFAS”) No. 142, the Company evaluates its goodwill for impairment on an annual basis based on values at the end of the third quarter or whenever indicators of impairment exist. The Company has evaluated its goodwill for impair-ment and has determined that the fair value of the reporting units exceeded their carrying value, so no impairment of goodwill was recognized. Goodwill of approximately $225 million is shown on the consolidated balance sheet as of the end of fiscal 2004.
Management’s assumptions about future cash flows for the reporting units require significant judgment, and actual cash flows in the future may differ significantly from those forecasted today. We believe our assumptions used in discounting future cash flows would have no impact on the reported carrying amount of goodwill. The estimated future cash flow for any reporting unit could be reduced by 40% without decreasing the fair value to less than the carrying value.
The Company also determines the fair value of indefinite lived trademarks on an annual basis or whenever indication of impairment exist. The Company has evaluated its trademarks for impairment and has determined that the fair market value of the trademarks exceeds carrying value, so no impairment was recognized. The carrying value of the trademarks was approximately $29 million at the end of fiscal 2004.
Self-insured reserves – The Company is partially self-insured for general, auto, and product liability, workers’ compensation, and certain employee health benefits. The general, auto, product, and workers’ compensation liabilities are managed using a wholly owned insur-ance captive; the related liabilities are included in the accompanying financial statements. The Company’s policy is to accrue amounts in accordance with the actuarially determined liabilities. The actuarial valuations are based on historical information along with certain assumptions about future events. Changes in assumptions for such matters as number of claims, medical cost inflation, and the magnitude of change in actual experience development could cause these estimates to change in the near term.
Stock-based compensation – The Company accounts for its stock option plan using Accounting Principles Board Opinion (“APB”) No. 25, “Accounting for Stock Issued to Employees,” which results in no charge to earnings when options are issued at fair market value. SFAS No. 123, “Accounting for Stock-Based Compensation,” issued subsequent to APB No. 25 and amended by SFAS No. 148, “Accounting for Stock Based Compensation – Transition and Disclosure,” defines a fair value based method of accounting for employee stock options but allows companies to continue to measure compensation cost for employee stock options using the intrinsic value based method described in APB No. 25.

30 HNI Corporat ion and Subsidiar ies 2004 Annual Report
Management’s Discussion and Analysis
In December 2004, the Financial Accounting Standards Board issued SFAS No. FAS123(R), “Share-Based Payment,” effective as of the beginning of the first interim or annual reporting period that begins after June 15, 2005. The Company plans to adopt FAS123(R) beginning with its third fiscal quarter in 2005. FAS123(R) eliminates the alternative to use the intrinsic value method of accounting that was provided in FAS123 as originally issued. In accordance with SFAS No. 148, the Company has been disclosing in the notes to the Consolidated Financial Statements the impact on net income and earnings per share had the fair value based method been adopted. If the fair value method had been adopted, net income for 2004, 2003, and 2002 would have been $5 million, $3 million, and $2 million lower than reported and earnings per share would have been reduced approximately $0.08, $0.06, and $0.04 per diluted share, respectively.
Recent Accounting Pronouncements
See the notes to the Consolidated Financial Statements for a full description of recent accounting pronouncements including the respective expected dates of adoption and effects on results of operations and financial conditions.
Results of Operations
The following table sets forth the percentage of consolidated net sales represented by certain items reflected in the Company’s statements of income for the periods indicated.
Fiscal 2004 2003 2002
Net sales 100.0% 100.0% 100.0%
Cost of products sold 64.1 63.6 64.6
Gross profit 35.9 36.4 35.4
Selling and administrative expenses 27.3 27.4 26.8
Restructuring related charges 0.1 0.5 0.2
Operating income 8.5 8.5 8.4
Interest income (expense) – net 0.0 0.1 (0.1)
Income before income taxes 8.5 8.6 8.3
Income taxes 3.1 3.0 2.9
Net income 5.4% 5.6% 5.4%
NET SALES
Net sales increased 19.2% in 2004 and 3.7% in 2003. The increase in 2004 was due to $136 million of sales from the Company’s 2004 acquisitions, $36 million from price increases, and increased volume in both the office furniture and hearth products segments. The increase in 2003 was due to the extra week in 2003 as a result of the Company’s 52/53-week fiscal year and strong performance in the hearth products segment.
GROSS PROFIT
Gross profit as a percent of net sales decreased 0.5 percentage points in 2004 as compared to fiscal 2003 due to approximately $57 million of increased steel costs and $16 million of additional other material costs. The increased steel and other material costs, net of
price increases, reduced gross margins approximately 1.8 percentage points. Included in 2003 gross profit was $6.7 million of accelerated depreciation, which reduced gross profits 0.4 percentage points. The Company’s gross margins improved 1.0 percentage points in 2003 compared to fiscal 2002 due to the continued net benefits of rapid continuous improvement, restructuring initiatives, business simplifi-cation, new products, and improved price realization. The Company will be implementing additional price increases through April 1, 2005, along with its ongoing cost reduction initiatives, including alternative materials and suppliers and its rapid continuous improvement program, to mitigate the impact of higher material costs.
SELLING AND ADMINISTRATIVE EXPENSES
Selling and administrative expenses, excluding restructuring charges, increased 19.0% and 5.8% in 2004 and 2003, respectively. The increase in 2004 was due to additional investment of approximately $15 million in brand building and selling initiatives, increased freight and distribution costs of $26 million due to volume, rate increases, fuel surcharges, and $39 million of additional selling and administra-tive costs associated with the new acquisitions. The increase in 2003 was due to additional investment of approximately $14 million in brand building and selling initiatives, and increased freight costs of $7 million due to rate increases, fuel surcharges, and volume.
Selling and administrative expenses include freight expense for shipments to customers, product development costs, and amortization expense of intangible assets. The Selling and Administrative Expenses note included in the Consolidated Financial Statements provides further information regarding the comparative expense levels for these major expense items.
RESTRUCTURING CHARGES
During 2003, the Company closed two office furniture facilities and consolidated production into other U.S. manufacturing locations to increase efficiencies, streamline processes, and reduce overhead costs. The two facilities were located in Hazleton, Pennsylvania, and Milan, Tennessee. In connection with these closures, the Company recorded $15.7 million of pre-tax charges or $0.17 per diluted share. These charges included $6.7 million of accelerated depreciation of machinery and equipment that was recorded in cost of sales, $3.4 million of severance, and $5.6 million of facility exit, production relocation, and other costs that were recorded as restructuring costs. A total of 316 members were terminated and received severance due to these shutdowns. In connection with the shutdowns, the Company incurred $1.2 million of current period charges during 2004. The Company also reduced the restructuring charge recorded in 2003 by approximately $0.3 million related to its Milan, Tennessee, facility during 2004. The reduction was due to the fact that the Company was able to exit a lease with the lessor on more favorable terms than previously estimated. The closures are complete.
During 2002, the Company recorded a pre-tax charge of approximately $5.4 million due to the shutdown of an office furniture facility in Jackson, Tennessee. A total of 125 members were terminated and received severance due to this shutdown. During the second quarter of 2003, a restructuring credit of approximately $0.6 million or $0.01 per diluted share was taken back into income relating to this charge. This was due to the fact that the Company was able to exit a lease with the lessor at more favorable terms than previously estimated.
HNI Corporat ion and Subsidiar ies 2004 Annual Report 31
Management’s Discussion and Analysis
During the second quarter of 2001, the Company recorded a pre-tax charge of $24 million or $0.26 per diluted share for a restructuring plan that involved consolidating physical facilities, discontinuing low-volume product lines, and reductions of workforce. Included in the charge was the closedown of three of the Company’s office furniture facilities located in Williamsport, Pennsylvania; Tupelo, Mississippi; and Santa Ana, California. Approximately 500 members were termi-nated and received severance due to the closedown of these facilities. During the second quarter of 2002, a restructuring credit of approxi-mately $2.4 million was taken back into income relating to this charge. This was mainly due to the fact that the Company was able to exit a lease with a lessor at more favorable terms than originally estimated and the Company’s ability to minimize the number of members terminated as compared to the original plan.
OPERATING INCOME
Operating income increased 19.0% in 2004 and 5.1% in 2003, respectively. The increase in 2004 was due to increased sales volume in both segments, price increases, contributions from new acquisitions, and a $15 million restructuring charge in 2003, offset by increased steel and other material costs, increased investment in brand building and selling initiatives, and increased freight costs. The increase in 2003 is due to the additional week, strong sales volume in the hearth segment, and improved gross margins in both segments, offset by increased restructuring charges due to addi-tional plant closures and consolidations, increased investment in brand building and selling initiatives, and increased freight costs.
NET INCOME
Net income increased 15.8% in 2004 and 7.4% in 2003, respectively. Net income in 2004 was unfavorably impacted by an increase in the effective tax rate to 36.5% in 2004 from 35% in 2003 due to increased state taxes and a reduced benefit from federal and state tax credits. Net income in 2003 was favorably impacted by increased interest income due to increased investments and decreased interest expense due to reduction in debt. The Company anticipates that its tax rate will decrease approximately one percentage point in 2005 due to benefits resulting from the implementation of the American Jobs Creation Act of 2004 but is still in the process of evaluating the impact. Net income per diluted share increased by 17.3% to $1.97 and by 8.4% to $1.68 in 2004 and 2003, respectively. Net income per share was positively impacted $0.03 per share in 2004 by the Company’s share repurchase program.
OFFICE FURNITURE
Office furniture comprised 75%, 74%, and 76% of consolidated net sales for 2004, 2003, and 2002, respectively. Net sales for office furniture increased 20% in 2004 and 2% in 2003. The increase in 2004 was due to approximately $117 million of sales from the Company’s 2004 acquisitions, $22 million of price increases, and increased market share gain. The increase in 2003 is due to the increased week from the Company’s 52/53-week fiscal year. The Business and Institutional Furniture Manufacturer’s Association (“BIFMA”) reported 2004 shipments up more than 5% and 2003 shipments down more than 4%. The Company believes it was able to outperform the market by providing strong brands, innovative products and services, and greater value to end-users.
Operating profit as a percent of sales was 9.9% in 2004, 10.0% in 2003, and 10.2% in 2002. Included in 2003 were $15.2 million of net pre-tax charges related to the closure of two office furniture facilities, which impacted operating margins by 1.1 percentage points. Included in 2002 were $3.0 million of restructuring charges, which impacted operating margins by 0.2 percentage points. The decrease in operating margins in 2004 is due to approximately $56 million of higher steel and other material costs, additional investments in brand building and selling initiatives, and increased freight expense partially offset by the benefits of restructuring initiatives, rapid continuous improvement program, and increased price realization.
HEARTH PRODUCTS
Hearth products sales increased 16% in 2004 and 9% in 2003. The growth in 2004 and 2003 was attributable to strong housing starts, strengthening alliances with key distributors and dealers, as well as focused new product introductions. Contributions from new acquisitions of $18 million and price increases of $13 million also contributed to the increase in 2004.
Operating profit as a percent of sales in 2004 was 11.9% compared to 12.1% and 10.8% in 2003 and 2002, respectively. The decrease in operating margins in 2004 is mainly due to increased steel and freight costs. The improved profitability in 2003 was the result of leveraging fixed costs over a higher sales volume and increased sales through company-owned distribution offset by increased freight costs and higher labor costs from increased use of overtime and temporary labor to meet record level of demand.
Liquidity and Capital Resources
During 2004, cash flow from operations was $194.3 million, which, along with available cash and short-term investments and funds from stock option exercises under employee stock plans, provided the funds necessary to meet working capital needs, pay for strategic acquisitions, invest in capital improvements, repay long-term debt, repurchase common stock, and pay increased dividends.
Cash, cash equivalents, and short-term investments totaled $36.5 million at the end of 2004 compared to $204.2 million at the end of 2003 and $155.5 million at the end of 2002. These funds, coupled with cash from future operations and additional long-term debt, if needed, are expected to be adequate to finance operations, planned improvements, and internal growth. The Company is not aware of any known trends or demands, commitments, events, or uncertainties that are reasonably likely to result in its liquidity increasing or decreasing in any material way.
The Company places special emphasis on the management and control of its working capital with a particular focus on trade receivables and inventory levels. The success achieved in managing receivables is in large part a result of doing business with quality customers and maintaining close communication with them. Trade receivables at year-end 2004 increased from the prior year due to the Company’s new acquisitions and increased sales volume. Trade receivable days outstanding have averaged approximately 36 to 38 days over the past three years. The Company’s inventory turns were 21, 23, and 23 for 2004, 2003, and 2002, respectively. The Company’s new acquisitions had a negative impact on inventory

32 HNI Corporat ion and Subsidiar ies 2004 Annual Report
Management’s Discussion and Analysis
turns that is expected to improve as the Company’s just-in-time philosophy is integrated into these acquisitions. The Company also is beginning to increase its imports of raw materials and finished goods, which, while reducing inventory turns, does have a favorable impact on the total cost.
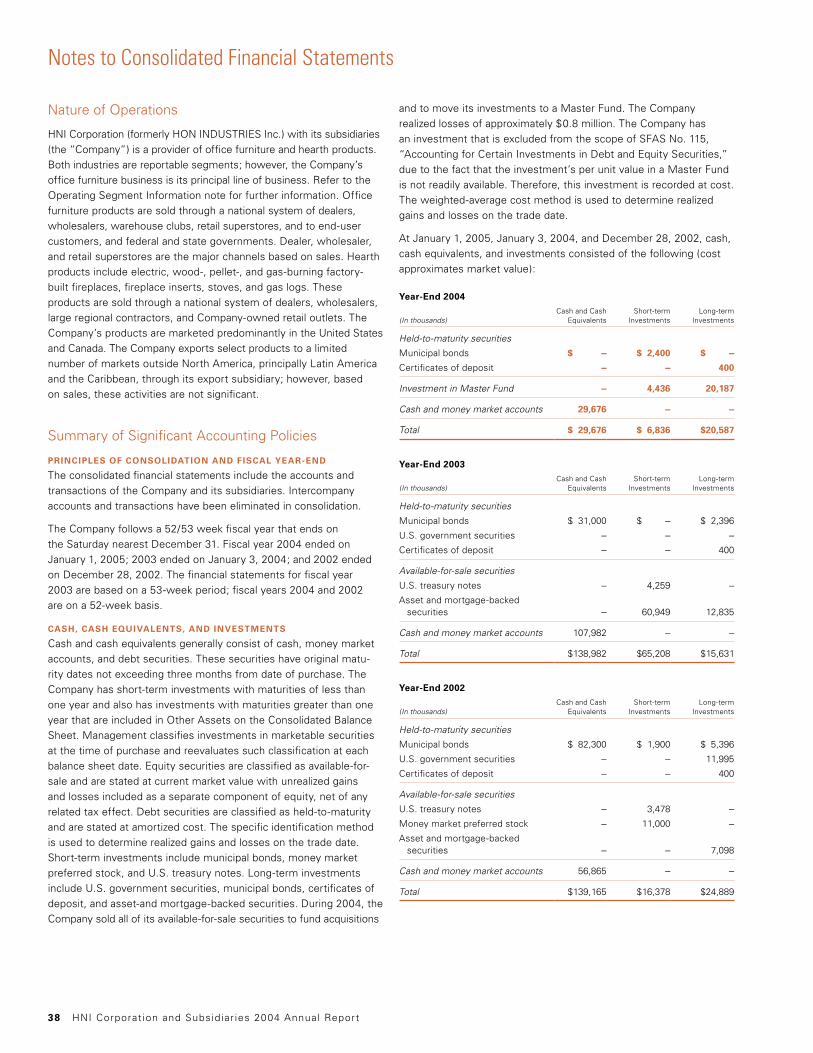
INVESTMENTS
The Company has investments in investment grade equity and debt securities. Management classifies investments in marketable securities at the time of purchase and reevaluates such classification at each balance sheet date. Equity securities are classified as available-for-sale and are stated at current market value with unrealized gains and losses included as a separate component of equity, net of any related tax effect. Debt securities are classified as held-to-maturity and are stated at amortized cost. The Company also made an invest-ment in 2004 that is excluded from the scope of SFAS No. 115, “Accounting for Certain Investments in Debt and Equity Securities,” due to the fact that the investment’s per unit value in a Master Fund is not readily available. Therefore, this investment is recorded at cost. The weighted-average cost method is used to determine realized gains and losses on the trade date. A table of holdings as of year-end 2004, 2003, and 2002 is included in the Cash, Cash Equivalents, and Investments note included in the Consolidated Financial Statements.
CAPITAL EXPENDITURE INVESTMENTS
Capital expenditures were $32.4 million in 2004, $34.8 million in 2003, and $25.9 million in 2002. Expenditures during 2004, 2003, and 2002 have been consistently focused on machinery and equipment needed to support new products, process improvements, and cost savings initiatives. Expenditures in 2003 also included the purchase from a related party of a previously leased hearth products plant for $3.6 million. The Company anticipates capital expenditures for 2005 to be approximately 25% higher than prior years.
ACQUISITIONS
During 2004, the Company completed three office furniture business acquisitions, two hearth products business acquisitions as well as the acquisition of a strategic sourcing entity for a combined purchase price of approximately $135 million. Each of the transactions was paid in cash, and the results of the acquired entities have been included in the Consolidated Financial Statements since the date of acquisition.
On January 5, 2004, the Company acquired certain assets of Paoli, Inc., a subsidiary of Klaussner Furniture Industries, Inc. Paoli is a leading provider of wood case goods and seating with well-known brands, broad product offering, and strong independent represen-tative sales and dealer networks. On July 6, 2004, the Company acquired a controlling interest in Omni Remanufacturing, Inc. Omni is comprised of two divisions – IntraSpec Solutions, a panel systems remanufacturer, and A&M Business Interior Services, an office furniture services company. On December 9, 2004, the Company acquired certain assets of Architectural Installations Atlanta, Inc., an office furniture services company that operates as part of the Company’s subsidiary, Omni Remanufacturing, Inc.
On January 5, 2004, the Company also completed the acquisition of Hearth and Home Distributors of Delaware, Inc. a small hearth distributor. On July 19, 2004, the Company completed the acquisition of Edward George Company, a distributor of fireplaces,
stone products, barbecues, and other building materials throughout Illinois, Indiana, and Kentucky, and its affiliate, Wisconsin Fireplace Systems, with locations in Wisconsin.
On October 4, 2004, the Company also acquired certain assets of Fullness International Corporation, a strategic sourcing entity.
LONG-TERM DEBT
Long-term debt, including capital lease obligations, was 1% of total capitalization as of January 1, 2005, 1% at January 3, 2004, and 2% at December 28, 2002. The reduction in long-term debt during 2004 was due to the payment of convertible debentures related to a previous hearth acquisition. The reductions in long-term debt during 2003 and 2002 were due to the retirement of Industrial Revenue Bonds. The Company does not expect future capital resources to be a constraint on planned growth. Additional borrowing capacity of $150 million, less amounts used for designated letters of credit, is available through a revolving bank credit agreement in the event cash generated from operations should be inadequate to meet future needs. Certain of the Company’s credit agreements include covenants that limit the assumption of additional debt and lease obligations. The Company has been, and currently is, in compliance with the covenants related to the debt agreements.
CONTRACTUAL OBLIGATIONS
The following table discloses the Company’s obligations and commit-ments to make future payments under contracts:
Payments Due by Period
(In thousands) TotalLess than
1 year 1–3 years 4–5 yearsAfter
5 years
Long-term debt $÷÷2,860 $÷÷«233 $÷÷«205 $÷÷÷«86 $÷2,336
Capital lease obligations 1,810 510 499 422 379
Operating leases 61,733 16,257 22,923 13,180 9,373
Transportation service contract 4,856 4,856 – – –
Purchase obligations 40,206 40,206 – – –
Other long-term obligations 13,562 1,054 1,794 412 10,302
Total $125,027 $63,116 $25,421 $14,100 $22,390
Other long-term obligations include $8,762,000 of payments included in long-term liabilities, due to members who are participants in the Company’s salary deferral program and $4,800,000 related to the mandatory purchase of the remaining 20 percent interest in Omni Remanufacturing, Inc. The amount of the remaining 20 percent pay-out is based on the value at the time of the purchase. The ultimate obligation under the agreement will vary, based on the agreed upon formula for such obligation upon mandatory redemption in 2014.
CASH DIVIDENDS
Cash dividends were $0.56 per common share for 2004, $0.52 for 2003, and $0.50 for 2002. Further, the Board of Directors announced a 10.7% increase in the quarterly dividend from $0.14 to $0.155 per common share effective with the March 1, 2005 dividend payment for shareholders of record at the close of business February 25, 2005. The previous quarterly dividend increase was from $0.13 to $0.14, effective with the March 1, 2004 dividend payment for shareholders of record at the close of business on February 20, 2004. A cash

HNI Corporat ion and Subsidiar ies 2004 Annual Report 33
Management’s Discussion and Analysis
dividend has been paid every quarter since April 15, 1955 and quarterly dividends are expected to continue. The average dividend payout percentage for the most recent three-year period has been 35% of prior year earnings.
COMMON SHARE REPURCHASES
During 2004, the Company repurchased 3,641,400 shares of its common stock at a cost of approximately $145.6 million, or an average price of $39.99. The Board of Directors authorized an additional $100 million on May 4, 2004 and an additional $150 million on November 12, 2004 for repurchases of the Company’s common stock. As of January 1, 2005, approximately $145.7 million of this authorized amount remained unspent. During 2003, the Company repurchased 762,300 shares of its common stock at a cost of approximately $21.5 million, or an average price of $28.22 per share. During 2002, the Company repurchased 614,580 shares of its common stock at a cost of approximately $15.7 million, or an average price of $25.60 per share.
LITIGATION AND UNCERTAINTIES
The Company has contingent liabilities that have arisen in the course of its business, including pending litigation, preferential payments claims in customer bankruptcies, environmental remediation, taxes, and other claims. The Company currently has a claim for approximately $7.6 million pending against it arising out of the bankruptcy of a customer filed in 2001. The Company was named a critical vendor by the bankruptcy court and, accordingly, was paid in full for all out-standing receivables. The claim alleges that the Company received preferential payments from the customer during the ninety days before the customer filed for bankruptcy protection. The claim was brought in February 2003. The Company has recorded an accrual with respect to this contingency, in an amount substantially less than the full amount of the claim, which represents the best estimate within the range of likely exposure and intends to vigorously defend against the claim. Given the nature of this claim, it is possible that the ultimate outcome could differ from the recorded amount. It is our opinion, after consultation with legal counsel, that additional liabilities, if any, resulting from these matters are not expected to have a material adverse effect on our financial condition, although such matters could have a material effect on our quarterly or annual operating results and cash flows when resolved in a future period.
Looking Ahead
The Company continues to see strong growth trends in the overall office furniture and hearth products markets. The Company is optimis-tic that its volumes will reflect the positive trends in the market and believes it will continue to gain market share. Global Insight, BIFMA’s forecasting consultant, is estimating U.S. office furniture shipments to increase 8.1% in 2005. The housing market, a key indicator for the hearth industry, is expected to experience a slight decline from its record levels but is expected to remain at healthy levels.
The Company has announced additional price increases necessitated by higher material costs that will become effective through the first half of 2005. The Company expects the rate of material cost increases to moderate as the year progresses but will continue to experience a gap between cost and price realization during the first part of the year.
The Company remains focused on creating long-term shareholder value by growing its business through investment in building brands, product solutions and selling models, enhancing its strong member-owner culture and remaining focused on its rapid continuous improvement program to continue to build best total cost and a lean enterprise.
Statements in this report that are not strictly historical, including statements as to plans, objectives, and future financial performance, are “forward-looking” statements that are made pursuant to the safe harbor provisions of the Private Securities Litigation Reform Act of 1995. Forward-looking statements involve known and unknown risks, which may cause the Company’s actual results in the future to differ materially from expected results.
Because of the following risks, as well as other variables affecting the Company’s operating results, past financial performance may not be a reliable indicator of future performance, and historical trends should not be used to anticipate results or trends in future periods:
• competition within the office furniture and fireplace industries, including competition from imported products and competitive pricing;
• increases in the cost of raw materials, including steel, which is the Company’s largest raw material category;
• the ability of the company to realize financial benefits through price realization from its price increases;
• increases in the cost of health care benefits provided by the Company;
• reduced demand for the Company’s storage products caused by changes in office technology including the change from paper record storage to electronic record storage;
• the effects of economic conditions on demand for office furniture, customer insolvencies and related bad debts, and claims against the Company that it received preferential payments;
• changes in demand and order patterns from the Company’s customers, particularly its top 10 customers, which represented approximately 36% of net sales in 2004;
• issues associated with acquisitions and integration of acquisitions;
• the ability of the Company to realize cost savings and productivity improvements from its cost containment and business simplifica-tion initiatives;
• the ability of the Company to realize financial benefits from invest-ments in new products;
• the ability of the Company’s distributors and dealers to success-fully market and sell the Company’s products;
• the availability and cost of capital to finance planned growth; and
• other risks, uncertainties, and factors described from time to time in the Company’s filings with the Securities and Exchange Commission.
We caution the reader that the above list of factors may not be exhaustive. The Company does not assume any obligation to update any forward-looking statement, whether as a result of new information, future events or otherwise.

34 HNI Corporat ion and Subsidiar ies 2004 Annual Report
(Amounts in thousands, except for per share data) For the Years 2004 2003 2002
Net sales $2,093,447 $1,755,728 $1,692,622
Cost of products sold 1,342,143 1,116,513 1,092,743
Gross profit 751,304 639,215 599,879
Selling and administrative expenses 572,006 480,744 454,189
Restructuring related charges 886 8,510 3,000
Operating income 178,412 149,961 142,690
Interest income 1,343 3,940 2,578
Interest expense 886 2,970 4,714
Income before income taxes 178,869 150,931 140,554
Income taxes 65,287 52,826 49,194
Net income $÷«113,582 $÷÷«98,105 $÷÷«91,360
Net income per common share – basic $÷÷÷÷«1.99 $÷÷÷÷«1.69 $÷÷÷÷«1.55
Weighted average shares outstanding – basic 57,127,110 58,178,739 58,789,851
Net income per common share – diluted $÷÷÷÷«1.97 $÷÷÷÷«1.68 $÷÷÷÷«1.55
Weighted average shares outstanding – diluted 57,577,630 58,545,353 59,021,071
The accompanying notes are an integral part of the consolidated financial statements.
Consolidated Statements of Income

HNI Corporat ion and Subsidiar ies 2004 Annual Report 35
Consolidated Balance Sheets
(Amounts in thousands of dollars and shares except par value) As of Year-End 2004 2003 2002
Assets
Current Assets
Cash and cash equivalents $÷÷«29,676 $÷«138,982 $÷«139,165
Short-term investments 6,836 65,208 16,378
Receivables 234,731 181,459 181,096
Inventories 77,590 49,830 46,823
Deferred income taxes 14,639 14,329 10,101
Prepaid expenses and other current assets 11,107 12,314 11,491
Total current assets 374,579 462,122 405,054
Property, plant, and equipment 311,344 312,368 353,270
Goodwill 224,554 192,086 192,395
Other assets 111,180 55,250 69,833
Total assets $1,021,657 $1,021,826 $1,020,552
Liabilities and Shareholders’ Equity
Current Liabilities
Accounts payable and accrued expenses $÷«253,958 $÷«211,236 $÷«252,145
Income taxes 6,804 5,958 3,740
Note payable and current maturities of long-term debt 646 26,658 41,298
Current maturities of other long-term obligations 4,842 1,964 1,497
Total current liabilities 266,250 245,816 298,680
Long-term debt 2,627 2,690 8,553
Capital lease obligations 1,018 1,436 1,284
Other long-term liabilities 40,045 24,262 28,028
Deferred income taxes 42,554 37,733 37,114
Commitments and contingenciesShareholders’ Equity
Preferred stock – $1 par value Authorized: 2,000 Issued: NoneCommon stock – $1 par value 55,303 58,239 58,374
Authorized: 200,000 Issued and outstanding 2004 – 55,303; 2003 – 58,239; 2002 – 58,374Additional paid-in capital 6,879 10,324 549
Retained earnings 606,632 641,732 587,731
Accumulated other comprehensive income 349 (406) 239
Total shareholders’ equity 669,163 709,889 646,893
Total liabilities and shareholders’ equity $1,021,657 $1,021,826 $1,020,552
The accompanying notes are an integral part of the consolidated financial statements

36 HNI Corporat ion and Subsidiar ies 2004 Annual Report
(Amounts in thousands) Common StockAdditional
Paid-in CapitalRetained Earnings
Accumulated Other
Comprehensive Income
Total Shareholders’
Equity
Balance, December 29, 2001 $58,673 $÷÷÷891 $«532,555 $«561 $«592,680
Comprehensive income: Net income 91,360 91,360
Other comprehensive income (loss) (322) (322)
Comprehensive income 91,038
Cash dividends (29,386) (29,386)
Common shares – treasury: Shares purchased (614) (8,324) (6,798) (15,736)
Shares issued under Members’ Stock Purchase Plan and stock awards 315 7,982 8,297
Balance, December 28, 2002 58,374 549 587,731 239 646,893
Comprehensive income: Net income 98,105 98,105
Other comprehensive income (loss) (645) (645)
Comprehensive income 97,460
Cash dividends (30,299) (30,299)
Common shares – treasury: Shares purchased (762) (6,945) (13,805) (21,512)
Shares issued under Members’ Stock Purchase Plan and stock awards 627 16,720 17,347
Balance, January 3, 2004 58,239 10,324 641,732 (406) 709,889
Comprehensive income: Net income 113,582 113,582
Other comprehensive income (loss) 755 755
Comprehensive income 114,337
Cash dividends (32,023) (32,023)
Common shares – treasury: Shares purchased (3,642) (25,303) (116,659) (145,604)
Shares issued under Members’ Stock Purchase Plan and stock awards 706 21,858 22,564
Balance, January 1, 2005 $55,303 $÷«6,879 $«606,632 $«349 $«669,163
The accompanying notes are an integral part of the consolidated financial statements.
Consolidated Statements of Shareholders’ Equity
HNI Corporat ion and Subsidiar ies 2004 Annual Report 37
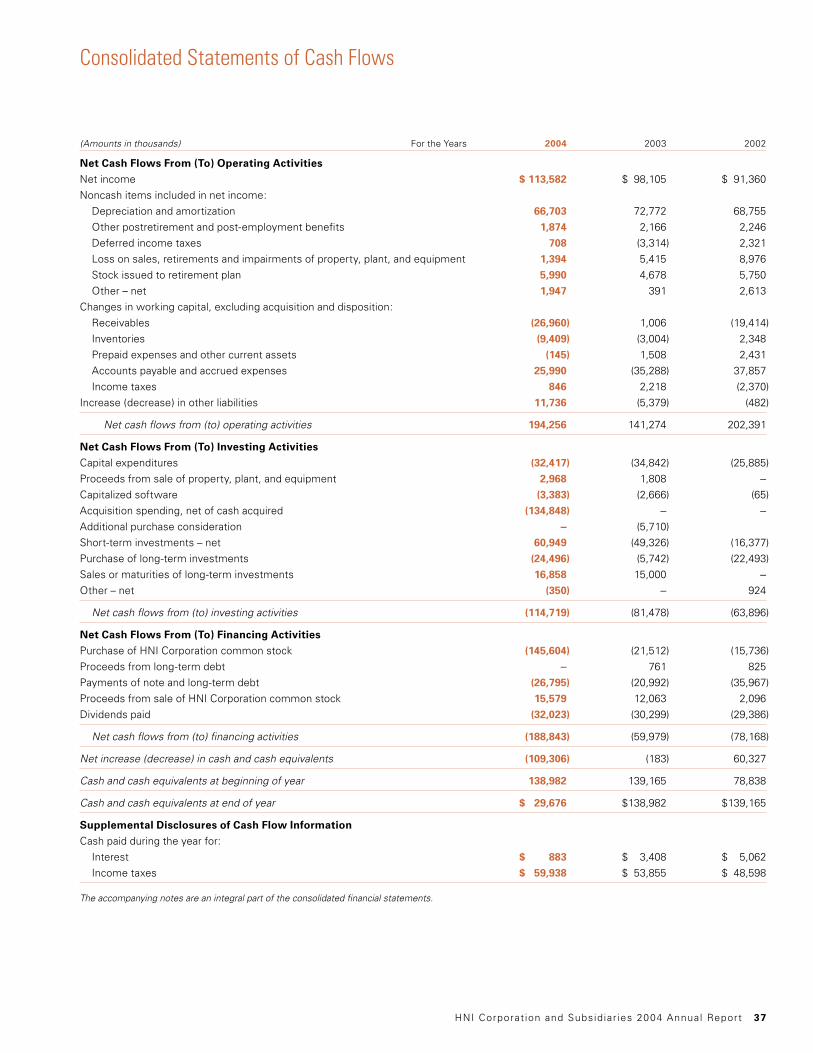
Consolidated Statements of Cash Flows
(Amounts in thousands) For the Years 2004 2003 2002
Net Cash Flows From (To) Operating Activities
Net income $«113,582 $÷98,105 $÷91,360
Noncash items included in net income: Depreciation and amortization 66,703 72,772 68,755
Other postretirement and post-employment benefits 1,874 2,166 2,246
Deferred income taxes 708 (3,314) 2,321
Loss on sales, retirements and impairments of property, plant, and equipment 1,394 5,415 8,976
Stock issued to retirement plan 5,990 4,678 5,750
Other – net 1,947 391 2,613
Changes in working capital, excluding acquisition and disposition: Receivables (26,960) 1,006 (19,414)
Inventories (9,409) (3,004) 2,348
Prepaid expenses and other current assets (145) 1,508 2,431
Accounts payable and accrued expenses 25,990 (35,288) 37,857
Income taxes 846 2,218 (2,370)
Increase (decrease) in other liabilities 11,736 (5,379) (482)
Net cash flows from (to) operating activities 194,256 141,274 202,391
Net Cash Flows From (To) Investing Activities
Capital expenditures (32,417) (34,842) (25,885)
Proceeds from sale of property, plant, and equipment 2,968 1,808 –
Capitalized software (3,383) (2,666) (65)
Acquisition spending, net of cash acquired (134,848) – –
Additional purchase consideration – (5,710)
Short-term investments – net 60,949 (49,326) (16,377)
Purchase of long-term investments (24,496) (5,742) (22,493)
Sales or maturities of long-term investments 16,858 15,000 –
Other – net (350) – 924
Net cash flows from (to) investing activities (114,719) (81,478) (63,896)
Net Cash Flows From (To) Financing Activities
Purchase of HNI Corporation common stock (145,604) (21,512) (15,736)
Proceeds from long-term debt – 761 825
Payments of note and long-term debt (26,795) (20,992) (35,967)
Proceeds from sale of HNI Corporation common stock 15,579 12,063 2,096
Dividends paid (32,023) (30,299) (29,386)
Net cash flows from (to) financing activities (188,843) (59,979) (78,168)
Net increase (decrease) in cash and cash equivalents (109,306) (183) 60,327
Cash and cash equivalents at beginning of year 138,982 139,165 78,838
Cash and cash equivalents at end of year $÷«29,676 $138,982 $139,165
Supplemental Disclosures of Cash Flow Information
Cash paid during the year for: Interest $÷÷÷÷883 $÷÷3,408 $÷÷5,062
Income taxes $÷«59,938 $÷53,855 $÷48,598
The accompanying notes are an integral part of the consolidated financial statements.
38 HNI Corporat ion and Subsidiar ies 2004 Annual Report
Notes to Consolidated Financial Statements
Nature of Operations
HNI Corporation (formerly HON INDUSTRIES Inc.) with its subsidiaries (the “Company”) is a provider of office furniture and hearth products. Both industries are reportable segments; however, the Company’s office furniture business is its principal line of business. Refer to the Operating Segment Information note for further information. Office furniture products are sold through a national system of dealers, wholesalers, warehouse clubs, retail superstores, and to end-user customers, and federal and state governments. Dealer, wholesaler, and retail superstores are the major channels based on sales. Hearth products include electric, wood-, pellet-, and gas-burning factory-built fireplaces, fireplace inserts, stoves, and gas logs. These products are sold through a national system of dealers, wholesalers, large regional contractors, and Company-owned retail outlets. The Company’s products are marketed predominantly in the United States and Canada. The Company exports select products to a limited number of markets outside North America, principally Latin America and the Caribbean, through its export subsidiary; however, based on sales, these activities are not significant.
Summary of Significant Accounting Policies
PRINCIPLES OF CONSOLIDATION AND FISCAL YEAR-END
The consolidated financial statements include the accounts and transactions of the Company and its subsidiaries. Intercompany accounts and transactions have been eliminated in consolidation.
The Company follows a 52/53 week fiscal year that ends on the Saturday nearest December 31. Fiscal year 2004 ended on January 1, 2005; 2003 ended on January 3, 2004; and 2002 ended on December 28, 2002. The financial statements for fiscal year 2003 are based on a 53-week period; fiscal years 2004 and 2002 are on a 52-week basis.
CASH, CASH EQUIVALENTS, AND INVESTMENTS
Cash and cash equivalents generally consist of cash, money market accounts, and debt securities. These securities have original matu-rity dates not exceeding three months from date of purchase. The Company has short-term investments with maturities of less than one year and also has investments with maturities greater than one year that are included in Other Assets on the Consolidated Balance Sheet. Management classifies investments in marketable securities at the time of purchase and reevaluates such classification at each balance sheet date. Equity securities are classified as available-for-sale and are stated at current market value with unrealized gains and losses included as a separate component of equity, net of any related tax effect. Debt securities are classified as held-to-maturity and are stated at amortized cost. The specific identification method is used to determine realized gains and losses on the trade date. Short-term investments include municipal bonds, money market preferred stock, and U.S. treasury notes. Long-term investments include U.S. government securities, municipal bonds, certificates of deposit, and asset-and mortgage-backed securities. During 2004, the Company sold all of its available-for-sale securities to fund acquisitions
and to move its investments to a Master Fund. The Company realized losses of approximately $0.8 million. The Company has an investment that is excluded from the scope of SFAS No. 115, “Accounting for Certain Investments in Debt and Equity Securities,” due to the fact that the investment’s per unit value in a Master Fund is not readily available. Therefore, this investment is recorded at cost. The weighted-average cost method is used to determine realized gains and losses on the trade date.
At January 1, 2005, January 3, 2004, and December 28, 2002, cash, cash equivalents, and investments consisted of the following (cost approximates market value):
Year-End 2004
(In thousands)Cash and Cash
EquivalentsShort-term
InvestmentsLong-term
Investments
Held-to-maturity securities
Municipal bonds $÷÷÷÷÷«– $÷2,400 $÷÷«÷÷–
Certificates of deposit – – 400
Investment in Master Fund – 4,436 20,187
Cash and money market accounts 29,676 – –
Total $÷29,676 $÷6,836 $20,587
Year-End 2003
(In thousands)Cash and Cash
EquivalentsShort-term
InvestmentsLong-term
Investments
Held-to-maturity securities
Municipal bonds $÷31,000 $÷÷«÷÷– $÷2,396
U.S. government securities – – –
Certificates of deposit – – 400
Available-for-sale securities
U.S. treasury notes – 4,259 –
Asset and mortgage-backed securities – 60,949 12,835
Cash and money market accounts 107,982 – –
Total $138,982 $65,208 $15,631
Year-End 2002
(In thousands)Cash and Cash
EquivalentsShort-term
InvestmentsLong-term
Investments
Held-to-maturity securities
Municipal bonds $÷82,300 $÷1,900 $÷5,396
U.S. government securities – – 11,995
Certificates of deposit – – 400
Available-for-sale securities
U.S. treasury notes – 3,478 –
Money market preferred stock – 11,000 –
Asset and mortgage-backed securities – – 7,098
Cash and money market accounts 56,865 – –
Total $139,165 $16,378 $24,889

HNI Corporat ion and Subsidiar ies 2004 Annual Report 39
Notes to Consolidated Financial Statements
RECEIVABLES
Accounts receivable are presented net of an allowance for doubtful accounts of $11,388,000, $10,859,000, and $9,570,000, for 2004, 2003, and 2002, respectively. The allowance is developed based on several factors including overall customer credit quality, historical write-off experience, and specific account analyses that project the ultimate collectibility of the account. As such, these factors may change over time causing the reserve level to adjust accordingly.
INVENTORIES
The Company values 80% of its inventory by the last-in, first-out (LIFO) method. Additionally, the Company evaluates its inventory reserves in terms of excess and obsolete exposures. This evalua-tion includes such factors as anticipated usage, inventory turnover, inventory levels, and ultimate product sales value. As such, these factors may change over time causing the reserve level to adjust accordingly. The reserves for excess and obsolete inventory were $7.7 million, $5.7 million, and $5.9 million at year-end 2004, 2003, and 2002, respectively.
PROPERTY, PLANT, AND EQUIPMENT
Property, plant, and equipment are carried at cost. Depreciation has been computed using the straight-line method over estimated useful lives: land improvements, 10–20 years; buildings, 10–40 years; and machinery and equipment, 3–12 years.
LONG-LIVED ASSETS
Long-lived assets are reviewed for impairment as events or changes in circumstances occur indicating that the amount of the asset reflected in the Company’s balance sheet may not be recoverable. An estimate of undiscounted cash flows produced by the asset, or the appropriate group of assets, is compared to the carrying value to determine whether impairment exists. The estimates of future cash flows involve considerable management judgment and are based upon assumptions about expected future operating performance. The actual cash flows could differ from management’s estimates due to changes in business conditions, operating performance, and economic conditions. Asset impairment charges recorded in connection with the Company’s restructuring activities are discussed in the Restructuring Related Charges note. These assets included real estate, manufacturing equipment, and certain other fixed assets. The Company’s continuous focus on improving the manufacturing process tends to increase the likelihood of assets being replaced; therefore, the Company is constantly evaluating the expected lives of its equipment and accelerating depreciation where appropriate. The Company recorded losses on the disposal of assets in the amount of approximately $1 million and $5 million during 2003 and 2002, respectively, as a result of its RCI initiatives.
GOODWILL AND OTHER INTANGIBLE ASSETS
In accordance with SFAS No. 142, the Company evaluates its goodwill for impairment on an annual basis based on values at the end of the third quarter or whenever indicators of impairment exist. The Company has evaluated its goodwill for impairment and has determined that the fair value of reporting units exceeds
their carrying value, so no impairment of goodwill was recognized. Management’s assumptions about future cash flows for the report-ing units requires significant judgment, and actual cash flows in the future may differ significantly from those forecasted today.
The Company also determines the fair value of indefinite lived trade-marks on an annual basis or whenever indications of impairment exist. The Company has evaluated its trademarks for impairment and has determined that the fair market value of the trademarks exceeds the carrying values, so no impairment was recognized.
PRODUCT WARRANTIES
The Company issues certain warranty policies on its furniture and hearth products that provide for repair or replacement of any covered product or component that fails during normal use because of a defect in design, materials, or workmanship. A warranty reserve is determined by recording a specific reserve for known warranty issues and an additional reserve for unknown claims that are expected to be incurred based on historical claims experience. Actual claims incurred could differ from the original estimates, requiring adjust-ments to the reserve. Activity associated with warranty obligations was as follows:
(In thousands) 2004 2003 2002
Balance at the beginning of the period $«÷8,926 $«8,405 $«5,632
Accrual assumed from acquisition 688 – –
Accruals for warranties issued during the period 10,486 7,907 6,542
Accrual related to pre-existing warranties 1,054 629 2,686
Settlements made during the period (10,360) (8,015) (6,455)
Balance at the end of the period $«10,794 $«8,926 $«8,405
REVENUE RECOGNITION
Revenue is normally recognized upon shipment of goods to customers. In certain circumstances revenue is not recognized until the goods are received by the customer or upon installation and customer acceptance based on the terms of the sales agreement. Revenue includes freight charged to customers; related costs are in selling and administrative expense. Rebates, discounts, and other marketing program expenses that are directly related to the sale are recorded as a reduction to net sales. Marketing program accruals require the use of management estimates and the consideration of contractual arrangements that are subject to interpretation. Customer sales that reach certain award levels can affect the amount of such estimates, and actual results could differ from these estimates.
PRODUCT DEVELOPMENT COSTS
Product development costs relating to the development of new products and processes, including significant improvements and refinements to existing products, are expensed as incurred. These costs include salaries, contractor fees, building costs, utilities, and administrative fees. The amounts charged against income were $29,809,000 in 2004, $25,791,000 in 2003, and $25,849,000 in 2002.
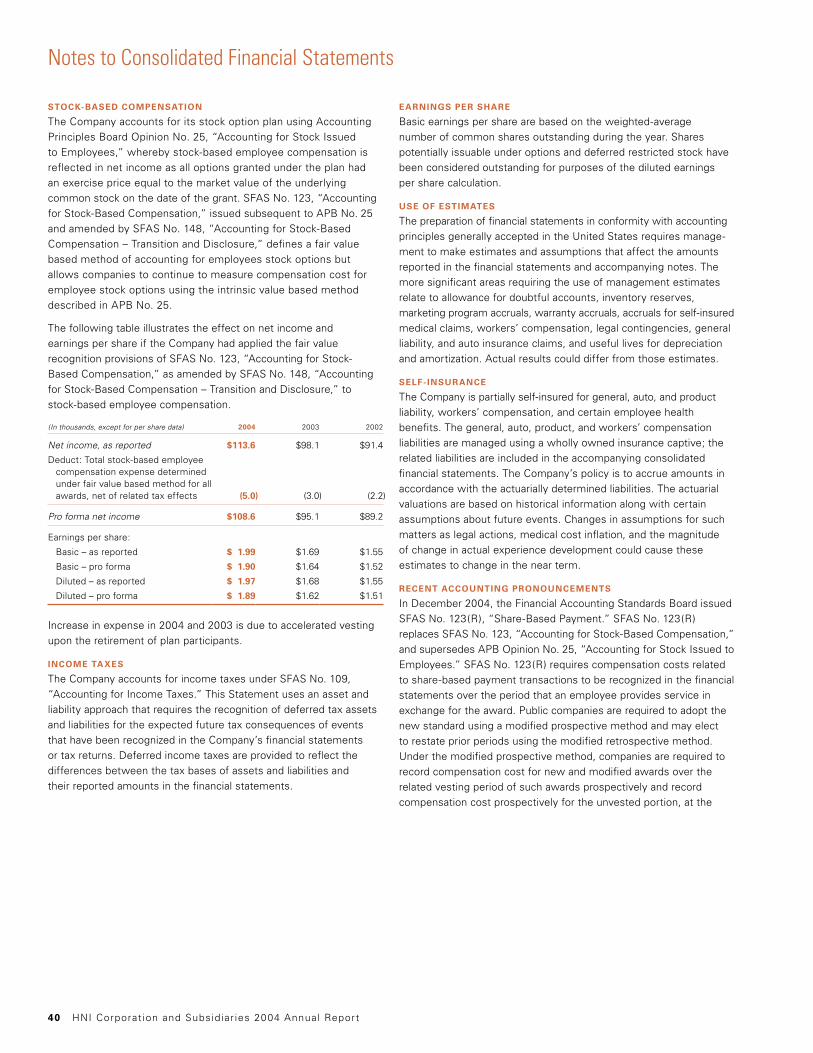
40 HNI Corporat ion and Subsidiar ies 2004 Annual Report
Notes to Consolidated Financial Statements
STOCK-BASED COMPENSATION
The Company accounts for its stock option plan using Accounting Principles Board Opinion No. 25, “Accounting for Stock Issued to Employees,” whereby stock-based employee compensation is reflected in net income as all options granted under the plan had an exercise price equal to the market value of the underlying common stock on the date of the grant. SFAS No. 123, “Accounting for Stock-Based Compensation,” issued subsequent to APB No. 25 and amended by SFAS No. 148, “Accounting for Stock-Based Compensation – Transition and Disclosure,” defines a fair value based method of accounting for employees stock options but allows companies to continue to measure compensation cost for employee stock options using the intrinsic value based method described in APB No. 25.
The following table illustrates the effect on net income and earnings per share if the Company had applied the fair value recognition provisions of SFAS No. 123, “Accounting for Stock- Based Compensation,” as amended by SFAS No. 148, “Accounting for Stock-Based Compensation – Transition and Disclosure,” to stock-based employee compensation.
(In thousands, except for per share data) 2004 2003 2002
Net income, as reported $113.6 $98.1 $91.4
Deduct: Total stock-based employee compensation expense determined under fair value based method for all awards, net of related tax effects (5.0) (3.0) (2.2)
Pro forma net income $108.6 $95.1 $89.2
Earnings per share:
Basic – as reported $÷1.99 $1.69 $1.55
Basic – pro forma $÷1.90 $1.64 $1.52
Diluted – as reported $÷1.97 $1.68 $1.55
Diluted – pro forma $÷1.89 $1.62 $1.51
Increase in expense in 2004 and 2003 is due to accelerated vesting upon the retirement of plan participants.
INCOME TAXES
The Company accounts for income taxes under SFAS No. 109, “Accounting for Income Taxes.” This Statement uses an asset and liability approach that requires the recognition of deferred tax assets and liabilities for the expected future tax consequences of events that have been recognized in the Company’s financial statements or tax returns. Deferred income taxes are provided to reflect the differences between the tax bases of assets and liabilities and their reported amounts in the financial statements.
EARNINGS PER SHARE
Basic earnings per share are based on the weighted-average number of common shares outstanding during the year. Shares potentially issuable under options and deferred restricted stock have been considered outstanding for purposes of the diluted earnings per share calculation.
USE OF ESTIMATES
The preparation of financial statements in conformity with accounting principles generally accepted in the United States requires manage-ment to make estimates and assumptions that affect the amounts reported in the financial statements and accompanying notes. The more significant areas requiring the use of management estimates relate to allowance for doubtful accounts, inventory reserves, marketing program accruals, warranty accruals, accruals for self-insured medical claims, workers’ compensation, legal contingencies, general liability, and auto insurance claims, and useful lives for depreciation and amortization. Actual results could differ from those estimates.
SELF- INSURANCE
The Company is partially self-insured for general, auto, and product liability, workers’ compensation, and certain employee health benefits. The general, auto, product, and workers’ compensation liabilities are managed using a wholly owned insurance captive; the related liabilities are included in the accompanying consolidated financial statements. The Company’s policy is to accrue amounts in accordance with the actuarially determined liabilities. The actuarial valuations are based on historical information along with certain assumptions about future events. Changes in assumptions for such matters as legal actions, medical cost inflation, and the magnitude of change in actual experience development could cause these estimates to change in the near term.
RECENT ACCOUNTING PRONOUNCEMENTS
In December 2004, the Financial Accounting Standards Board issued SFAS No. 123(R), “Share-Based Payment.” SFAS No. 123(R) replaces SFAS No. 123, “Accounting for Stock-Based Compensation,” and supersedes APB Opinion No. 25, “Accounting for Stock Issued to Employees.” SFAS No. 123(R) requires compensation costs related to share-based payment transactions to be recognized in the financial statements over the period that an employee provides service in exchange for the award. Public companies are required to adopt the new standard using a modified prospective method and may elect to restate prior periods using the modified retrospective method. Under the modified prospective method, companies are required to record compensation cost for new and modified awards over the related vesting period of such awards prospectively and record compensation cost prospectively for the unvested portion, at the

HNI Corporat ion and Subsidiar ies 2004 Annual Report 41
Notes to Consolidated Financial Statements
date of adoption, of previously issued and outstanding awards over the remaining vesting period of such awards. No change to prior periods presented is permitted under the modified prospective method. Under the modified retrospective method, companies record compensation costs for prior periods retroactively through restatement of such periods using the exact pro forma amounts disclosed in the companies’ footnotes. Also, in the period of adoption and after, companies record compensation based on the modified prospective method. SFAS No. 123(R) is effective for periods begin-ning after June 15, 2005. The Company plans to adopt SFAS No. 123(R) on July 3, 2005, the beginning of its third fiscal quarter, and to use the modified prospective method. Based on adopting SFAS No. 123(R) on July 3, 2005 and using the modified prospective method, the Company estimates that total stock-based compensation expense, net of related tax effects, will be approximately $0.9 million for the year ending December 31, 2005.
In November 2004, the Financial Accounting Standards Board issued SFAS No. 150, “Inventory Costs.” SFAS No. 150 amends the guidance in ARB No. 43, Chapter 4, “Inventory Pricing,” to clarify the accounting for abnormal amounts of idle facility expense, freight, handling costs, and wasted material. This Statement requires that those items be recognized as current-period charges regardless of whether they meet the criterion of “so abnormal.” In addition, this Statement requires that allocation of fixed production overheads to the costs of conversion be based on the normal capacity of the production facilities. SFAS No. 150 is effective for fiscal years begin-ning after June 15, 2005. The Company intends to adopt SFAS No. 150 on January 1, 2006, the beginning of its 2006 fiscal year. The adoption of SFAS No. 150 is not expected to have a material impact on the Company’s financial statements.
In May 2004, the Financial Accounting Standards Board issued FASB Staff Position No. 106-2, “Accounting and Disclosure Requirements Related to the Medicare Prescription Drug, Improvement and Modernization Act of 2003” (“FSP 106-2”). FSP 106-2 was effective for the first interim or annual period beginning after June 15, 2004. The Company adopted FSP 106-2 on July 4, 2004. The Company has determined that the benefits provided by the Company’s plan are not actuarially equivalent to the Medicare Part D benefit under the Act based on percentage of the cost of the plan that the Company provides. Therefore, the adoption of FSP 106-2 did not have an impact on the Company’s financial statements during 2004. The Company will continue to monitor the effect as regulations evolve regarding actuarial equivalency.
In December 2003, the Financial Accounting Standards Board issued Interpretation 46R (“FIN 46R”), a revision to Interpretation 46 (“FIN 46”), “Consolidation of Variable Interest Entities.” FIN 46R clarifies some of the provisions of FIN 46 and exempts
certain entities from its requirements. FIN 46R was effective at the end of the first interim period ending after March 15, 2004. The Company adopted FIN 46R on April 3, 2004, and it did not have an impact on the Company’s financial statements.
Restructuring Related Charges
During 2003, as a result of the Company’s business simplification and cost reduction strategies, the Company closed two office furniture facilities located in Milan, Tennessee, and Hazleton, Pennsylvania, and consolidated production into other U.S. manufacturing locations. Charges for the closures during 2003 totaled $15.7 million, which consisted of $6.7 million of accelerated depreciation of machinery and equipment that was recorded in cost of sales and $3.4 million of severance and $5.6 million of facility exit, production relocation, and other costs that were recorded as restructuring costs. A total of 316 members were terminated and received severance due to these shutdowns. In connection with those shutdowns, the Company incurred $1.2 million of current period charges during 2004. The Company also reduced the restructuring charge recorded in 2003 by approximately $0.3 million related to its Milan, Tennessee, facility during 2004. The reduction was due to the fact that the Company was able to exit a lease with the lessor at more favorable terms than previously estimated. The closures and consolidation are complete.
During 2002, the Company recorded a pre-tax charge of approxi-mately $5.4 million due to the shutdown of an office furniture facility in Jackson, Tennessee. A total of 125 members were terminated and received severance due to this shutdown. During the second quarter of 2003, a restructuring credit of approximately $0.6 million was taken back into income relating to this charge. This was due to the fact that the Company was able to exit a lease with the lessor at more favorable terms than previously estimated.
During the second quarter of 2001, the Company recorded a pre-tax charge of $24.0 million or $0.26 per diluted share for a restructuring plan that involved consolidating physical facilities, discontinuing low-volume product lines, and reductions of workforce. Included in the charge was the closedown of three of its office furniture facilities located in Williamsport, Pennsylvania; Tupelo, Mississippi; and Santa Ana, California. Approximately 500 members were terminated and received severance due to the closedown of these facilities. During the second quarter of 2002, a restructuring credit of approxi-mately $2.4 million was taken back into income relating to this charge. This was mainly due to the fact that the Company was able to exit a lease with a lessor at more favorable terms than originally estimated and the Company’s ability to minimize the number of members terminated as compared to the original plan.

42 HNI Corporat ion and Subsidiar ies 2004 Annual Report
Notes to Consolidated Financial Statements
The following table details the change in restructuring reserve for the last three years:
(In thousands)Severance
Costs
Facility Termination
and Other Costs
Asset Impairment
Write-downs Total
Restructuring reserve at December 29, 2001 $÷÷768 $«1,949 $÷÷÷÷– $«2,717
Restructuring charge 737 3,328 1,300 5,365
Restructuring credit (852) (1,513) – (2,365)
Cash payments (653) (1,577) – (2,230)
Charge against assets – – (1,300) (1,300)
Restructuring reserve at December 28, 2002 $÷÷÷÷– $«2,187 $÷÷÷÷– $«2,187
Restructuring charges 3,438 5,622 – 9,060
Restructuring credit – (550) – (550)
Cash payments (3,104) (6,159) – (9,263)
Restructuring reserve at January 3, 2004 $÷÷334 $«1,100 $÷÷÷÷– $«1,434
Restructuring charges 42 1,147 – 1,189
Restructuring credit (31) (272) – (303)
Cash payments (345) (1,975) – (2,320)
Restructuring reserve at January 1, 2005 $÷÷÷÷– $÷÷÷÷– $÷÷÷÷– $÷÷÷÷–
Business Combinations
On January 5, 2004, the Company acquired certain assets of Paoli, Inc., a subsidiary of Klaussner Furniture Industries, Inc. Paoli Inc. is a leading provider of wood case goods and seating with well-known brands, broad product offering, and strong independent representa-tives sales and dealer networks located in Orleans, Indiana.
On July 6, 2004, the Company acquired a controlling interest in Omni Remanufacturing, Inc. Omni Remanufacturing, Inc. is comprised of two divisions – IntraSpec Solutions, a panel systems re-manufacturer, and A&M Business Interior Services, an office furniture services company. The Company acquired 80% of the common stock of Omni Remanufacturing, Inc. and the ability to call the remaining 20% of the shares on or after the fiscal year-end 2009. The Company must exercise its Call on or before the end of fiscal year-end 2014. SFAS No. 150, “Accounting for Certain Financial Instruments with Characteristics of both Liabilities and Equity,” requires a mandatorily redeemable financial instrument to be classified as a liability unless the redemption is required to occur only upon the liquidation or termination of the reporting entity. It also requires that mandatorily redeemable financial instruments be measured at fair value. Therefore, the Company has recorded a liability for the remaining 20% of the shares at fair value.
On July 19, 2004, the Company completed the acquisition of Edward George Company, a distributor of fireplaces, stone products, barbecues, and other building materials throughout Illinois, Indiana, and Kentucky, and its affiliate, Wisconsin Fireplace Systems, with locations in Wisconsin.
The consideration for each of these transactions was paid in cash. The results of the acquired entities have been included in the Consolidated Financial Statements since the date of acquisition.
The purchase price and allocation for each of these acquisitions is shown below.
(In thousands) Paoli Omni Edward George
Purchase price $81,130 $18,654 $27,705
Preliminary Allocation of Purchase Price
Current assets $27,304 $÷5,414 $12,422
Property, plant, and equipment 26,455 1,649 831
Other assets – 8 –
Intangible assets 26,330 12,680 9,270
Goodwill 9,188 11,831 9,218
Total assets acquired 89,277 31,582 31,741
Current liabilities 8,147 4,492 4,036
Deferred tax liability – 3,636 –
Other liabilities – 4,800 –
Net assets acquired $81,130 $18,654 $27,705
Of the $26.3 million of acquired intangible assets from the Paoli acquisition, $18.3 million was assigned to registered trademarks that are not subject to amortization. The remaining $8.0 million of acquired intangible assets have a weighted-average useful life of approximately 15 years with amortization recorded based on the projected cash flow associated with the respective intangible assets existing relationships. The intangible assets that make up that amount include customer relationships of $5.4 million (19-year weighted-average useful life), patents and proprietary technology of $2.4 million (8-year weighted-average useful life), and other assets of $0.2 million (3-year weighted-average useful life). The $9.2 million of goodwill was assigned to the office furniture segment and is deductible for income tax purposes.
Assuming the acquisition of Paoli Inc. had occurred on December 29, 2002, the beginning of the Company’s 2003 fiscal year, instead of the actual date reported above, the Company’s unaudited pro forma consolidated net sales would have been approximately $1.9 billion. Unaudited pro forma consolidated net income would have been $103.8 million or $1.77 per diluted share. Pro forma results are not shown for the remaining acquisitions as they were deemed immaterial by management.

HNI Corporat ion and Subsidiar ies 2004 Annual Report 43
Notes to Consolidated Financial Statements
Of the $12.7 million of acquired intangible assets from the Omni acquisition, $2.8 million was assigned to registered trademarks that are not subject to amortization. The remaining $9.9 million of acquired intangible assets have a weighted-average useful life of approximately 9 years with amortization recorded based on the projected cash flow associated with the respective intangible assets existing relationships. The intangible assets that make up that amount include customer relationships of $6.9 million (10-year weighted-average useful life), computer software of $1.6 million (7-year weighted-average useful life), and other assets of $1.4 million (6-year weighted-average useful life). The $11.8 million of goodwill was assigned to the office furniture segment and is not deductible for income tax purposes.
The acquired intangible assets from the Edward George acquisition of $9.3 million have a weighted-average useful life of approximately 13 years with amortization recorded based on the projected cash flow associated with the respective intangible assets existing relationships. The intangible assets that make up that amount include customer relationships of $8.8 million (14-year weighted-average useful life) and other assets of $0.5 million (2-year weighted-average useful life). The $9.2 million of goodwill was assigned to the hearth products segment and is deductible for income tax purposes.
The Company also completed the acquisition of a small office furniture services company, a small hearth distributor, and a strategic sourcing entity during 2004. The combined purchase price for these acquisitions totaled approximately $8.5 million. There is approximately $5.4 million of intangibles associated with these acquisitions with estimated useful lives ranging from one to ten years. There is approximately $2.2 million of goodwill associated with these acquisitions, of which $0.9 million was assigned to the office furniture segment and $1.3 million was assigned to the hearth products segment. All goodwill is deductible for income tax purposes.
Inventories
(In thousands) 2004 2003 2002
Finished products $««52,796 $÷31,407 $««30,747
Materials and work in process 40,712 28,287 26,266
LIFO reserve (15,918) (9,864) (10,190)
$««77,590 $÷49,830 $««46,823
Property, Plant, and Equipment
(In thousands) 2004 2003 2002
Land and land improvements $÷26,042 $÷23,065 $÷21,566
Buildings 234,421 211,005 208,124
Machinery and equipment 512,544 495,901 494,354
Construction and equipment installation in progress 13,686 9,865 10,227
786,693 739,836 734,271
Less: allowances for depreciation 475,349 427,468 381,001
$311,344 $312,368 $353,270
Goodwill and Other Intangible Assets
The Company adopted Statement of Financial Accounting Standards (SFAS) No. 142, “Goodwill and Other Intangible Assets,” on December 30, 2001, the beginning of its 2002 fiscal year. Pursuant to this standard, the Company evaluates its goodwill for impairment on an annual basis based on values at the end of the third quarter or whenever indicators of impairment exist. The Company has evaluated its goodwill for impairment and has determined that the fair value of its reporting units exceeds the carrying values, and therefore, no impairment of goodwill was recorded. Also pursuant to the standard, the Company has ceased recording of goodwill and indefinite-lived intangibles amortization in 2002.
The Company also owns trademarks having a net value of $29.2 mil-lion as of January 1, 2005, and $8.1 million as of January 3, 2004 and December 28, 2002. The fair value of the trademarks exceeds the carrying value of the trademarks, and thus, no impairment was recorded. The trademarks are deemed to have an indefinite useful life because they are expected to generate cash flow indefinitely. The Company ceased amortizing the trademarks in 2002.
The table below summarizes amortizable definite-lived intangible assets, which are reflected in Other Assets in the Company’s consolidated balance sheets:
(In thousands) 2004 2003 2002
Patents $18,820 $16,450 $16,450
Customer lists and other 54,702 26,076 26,076
Less: accumulated amortization 21,785 16,671 13,980
Net intangible assets $51,737 $25,855 $28,546
Amortization expense for definite-lived intangibles for 2004, 2003, and 2002 was $5,114,500, $2,690,100, and $2,690,100, respectively. Amortization expense is estimated to range between $3.8 and $6.2 million per year over the next five years.
The changes in the carrying amount of goodwill since December 29, 2001 are as follows by reporting segment:
(In thousands)Office
FurnitureHearth
Products Total
Balance as of December 29, 2001 (after SFAS No. 142 reclassification) $43,611 $143,083 $186,694
Goodwill increase during period – 5,710 5,710
Net goodwill disposed of during period – (9) (9)
Balance as of December 28, 2002 $43,611 $148,784 $192,395
Adjustment for a prior acquisition – (309) (309)
Balance as of January 3, 2004 $43,611 $148,475 $192,086
Goodwill increase during period 21,920 10,548 32,468
Balance as of January 1, 2005 $65,531 $159,023 $224,554

44 HNI Corporat ion and Subsidiar ies 2004 Annual Report
Notes to Consolidated Financial Statements
The goodwill increase in 2002 relates to additional purchase consid-eration associated with debentures issued in connection with a prior acquisition. The decrease in goodwill in 2003 is due to an adjustment relating to a prior acquisition. The goodwill increase in 2004 relates to acquisitions during the year. See Business Combinations note.
Accounts Payable and Accrued Expenses
(In thousands) 2004 2003 2002
Trade accounts payable $÷75,884 $÷44,295 $÷66,204
Compensation 25,722 22,803 20,686
Profit sharing and retirement expense 30,516 30,365 26,788
Vacation pay 13,095 13,745 14,095
Marketing expenses 50,939 44,795 59,224
Casualty self-insurance expense 6,802 9,385 10,973
Other accrued expenses 51,000 45,848 54,175
$253,958 $211,236 $252,145
Long-Term Debt
(In thousands) 2004 2003 2002
Industrial development revenue bonds, various issues, payable through 2018 with interest at 1.49–5.40% per annum $2,300 $÷2,300 $÷7,938
Convertible debentures payable to individuals, with interest at 5.5% per annum – 26,130 40,443
Other notes and amounts 560 503 736
Total debt 2,860 28,933 49,117
Less: current portion 233 26,243 40,564
Long-term debt $2,627 $÷2,690 $÷8,553
Aggregate maturities of long-term debt are as follows:
(In thousands)
2005 $÷«233
2006 164
2007 41
2008 42
2009 44
Thereafter $2,336
The convertible debentures were payable to the former owners of businesses that were acquired by the Company. Following the acquisition some of these individuals continued as members of the Company. The convertible debentures were convertible into cash. The debentures contained certain conversion features that are recorded as earned. During 2003, the Company recorded approxi-mately $3 million of appreciation on these debentures.
Certain of the above borrowing arrangements include covenants that limit the assumption of additional debt and lease obligations. The Company has been and currently is in compliance with the covenants related to these debt agreements. The fair value of the Company’s outstanding long-term debt obligations at year-end 2004 approximates the recorded aggregate amount.
Selling and Administrative Expenses
(In thousands) 2004 2003 2002
Freight expense for shipments to customers $132,866 $105,933 $÷98,876
Amortization of intangible and other assets 8,521 4,625 4,317
Product development costs 29,809 25,791 25,849
Other selling and administrative expenses 400,810 344,395 325,147
$572,006 $480,744 $454,189
Income Taxes
Significant components of the provision for income taxes are as follows:
(In thousands) 2004 2003 2002
Current:
Federal $60,425 $49,721 $38,966
State 5,976 4,159 3,473
66,401 53,880 42,439
Deferred (1,114) (1,054) 6,755
$65,287 $52,826 $49,194
A reconciliation of the statutory federal income tax rate to the Company’s effective income tax rate is as follows:
2004 2003 2002
Federal statutory tax rate 35.0«% 35.0«% 35.0«%
State taxes, net of federal tax effect 2.2« 1.8« 1.6«
Credit for increasing research activities (0.6)« (2.0)« (1.6)«
Extra-territorial income exclusion (0.3)« (0.5)« (1.0)«
Other – net 0.2« 0.7« 1.0«
Effective tax rate 36.5«% 35.0«% 35.0«%

HNI Corporat ion and Subsidiar ies 2004 Annual Report 45
Notes to Consolidated Financial Statements
Deferred income taxes reflect the net tax effects of temporary differences between the carrying amounts of assets and liabilities for financial reporting purposes and the amounts used for income tax purposes. Significant components of the Company’s deferred tax liabilities and assets are as follows:
(In thousands) 2004 2003 2002
Net long-term deferred tax liabilities:
Tax over book depreciation $(25,549) $(28,103) $(34,398)
OPEB obligations 1,770 182 3,581
Compensation 5,697 4,912 3,821
Goodwill (24,362) (18,044) (14,173)
Other — net (110) 3,320 4,055
Total net long-term deferred tax liabilities (42,554) (37,733) (37,114)
Net current deferred tax assets:
Workers’ compensation, general, and product liability accruals 1,731 298 1,517
Vacation accrual 4,588 4,754 4,617
Inventory differences 4,304 4,343 5,101
Plant closing accruals – 528 821
Deferred income (6,238) (5,462) (3,820)
Warranty accruals 3,504 2,886 2,369
Other – net 6,750 6,982 (504)
Total net current deferred tax assets 14,639 14,329 10,101
Net deferred tax (liabilities) assets $(27,915) $(23,404) $(27,013)
On October 2, 2004, the President of the United States signed the American Jobs Creation Act of 2004 (the “Act”). The Act provides a deduction for income from qualified domestic production activities, which will be phased in from 2005 through 2010. In return, the Act also provides for a two-year phase out of the existing extra-territorial income exclusion (ETI) for foreign sales that was viewed to be inconsistent with international trade protocols by the European Union. The Company expects the net effect of the phase out of the ETI and the phase in of this new deduction to result in a decrease in the effective rate for fiscal years 2005 and 2006 of approximately one percentage point.
Under the guidance in FASB Staff Position No. FAS 109-1, “Application of FASB Statement No. 109, ‘Accounting for Income Taxes,’ to the Tax Deduction on Qualified Production Activities Provided by the American Jobs Creation Act of 2004,” the deduction will be treated as a “special deduction” as described in FASB Statement No. 109. As such, the special deduction has no effect on deferred tax assets and liabilities existing at the enactment date. Rather, the impact of this deduction will be reported in the period in which the deduction is claimed on the tax return.
Shareholders’ Equity and Earnings per Share
2004 2003 2002
Common Stock, $1 Par Value
Authorized 200,000,000 200,000,000 200,000,000
Issued and outstanding 55,303,323 58,238,519 58,373,607
Preferred Stock, $1 Par Value
Authorized 2,000,000 2,000,000 2,000,000
Issued and outstanding – – –
The Company purchased 3,641,400; 762,300; and 614,580 shares of its common stock during 2004, 2003, and 2002, respectively. The par value method of accounting is used for common stock repurchases. The excess of the cost of shares acquired over their par value is allocated to Additional Paid-In Capital with the excess charged to Retained Earnings.
The following table reconciles the numerators and denominators used in the calculation of basic and diluted earnings per share (EPS):
2004 2003 2002
Numerators:
Numerators for both basic and diluted EPS net income $113,582,000 $98,105,000 $91,360,000
Denominators:
Denominator for basic EPS weighted-average com-mon shares outstanding 57,127,110 58,178,739 58,789,851
Potentially dilutive shares from stock option plans 450,520 366,614 231,220
Denominator for diluted EPS 57,577,630 58,545,353 59,021,071
Earnings per share – basic $÷÷÷÷÷÷«1.99 $÷÷÷÷÷«1.69 $÷÷÷÷÷«1.55
Earnings per share – diluted $÷÷÷÷÷÷«1.97 $÷÷÷÷÷«1.68 $÷÷÷÷÷«1.55
Certain exercisable and non-exercisable stock options were not included in the computation of diluted EPS for fiscal year 2004, 2003, and 2002 because the option prices were greater than the average market prices for the applicable periods. The number of stock options outstanding that met this criterion for 2004 was 25,000 with a range of per share exercise prices of $42.15–$42.98; for 2003 was 20,000 with a range of per share exercise prices of $42.49–$42.98; and for 2002 was 30,000 with a range of per share exercise prices of $28.25–$32.22.

46 HNI Corporat ion and Subsidiar ies 2004 Annual Report
Notes to Consolidated Financial Statements
Components of other comprehensive income (loss) consist of the following:
(In thousands) 2004 2003 2002
Foreign currency translation adjust-ments – net of tax $348 $÷«45 $÷÷«–
Change in unrealized gains (losses) on marketable securities – net of tax 407 (690) (322)
Other comprehensive income (loss) $755 $(645) $(322)
In May 1997, the Company registered 400,000 shares of its common stock under its 1997 Equity Plan for Non-Employee Directors. This plan permits the Company to issue to its non-employee directors options to purchase shares of Company common stock, restricted stock of the Company, and awards of Company stock. The plan also permits non-employee directors to elect to receive all or a portion of their annual retainers and other compensation in the form of shares of Company common stock. During 2004, 2003, and 2002, 10,738; 10,922; and 11,958 shares of Company common stock were issued under the plan, respectively.
Cash dividends declared and paid per share for each year are:
(In dollars) 2004 2003 2002
Common shares $.56 $.52 $.50
During 2002, shareholders approved the 2002 Members’ Stock Purchase Plan. Under the plan, 800,000 shares of common stock were registered for issuance to participating members. Beginning on June 30, 2002, rights to purchase stock are granted on a quarterly basis to all members who have one year of employment eligibility and work a minimum of 20 hours a week. The price of the stock purchased under the plan is 85% of the closing price on the appli-cable purchase date. No member may purchase stock under the plan in an amount that exceeds the lesser of 20% of his/her gross earnings or a maximum fair value of $25,000 in any calendar year. During 2004, 73,921 shares of common stock were issued under the plan at an average price of $34.96. During 2003, 79,237 shares of common stock were issued under the plan at an average price of $29.25. During 2002, 47,419 shares of common stock were issued under the plan at an average price of $22.58. An additional 599,423 shares were available for issuance under the plan at January 1, 2005. This plan replaced the 1994 Members’ Stock Purchase Plan. Under this plan, during 2002, 43,388 shares at an average price of $23.63 were issued.
The Company has a shareholders’ rights plan that will expire August 20, 2008. The plan becomes operative if certain events occur involving the acquisition of 20% or more of the Company’s common stock by any person or group in a transaction not approved
by the Company’s Board of Directors. Upon the occurrence of such an event, each right entitles its holder to purchase an amount of common stock of the Company with a market value of $400 for $200, unless the Board authorizes the rights be redeemed. The rights may be redeemed for $0.01 per right at any time before the rights become exercisable. In certain instances, the right to purchase applies to the capital stock of the acquirer instead of the common stock of the Company. The Company has reserved preferred shares necessary for issuance should the rights be exercised.
The Company has entered into change in control employment agreements with corporate officers and certain other key employees. According to the agreements, a change in control occurs when a third person or entity becomes the beneficial owner of 20% or more of the Company’s common stock or when more than one-third of the Company’s Board of Directors is composed of persons not recommended by at least three-fourths of the incumbent Board of Directors. Upon a change in control, a key employee is deemed to have a two-year employment with the Company, and all his or her benefits are vested under Company plans. If, at any time within two years of the change in control, his or her position, salary, bonus, place of work, or Company-provided benefits are modified, or employment is terminated by the Company for any reason other than cause or by the key employee for good reason, as such terms are defined in the agreement, then the key employee is entitled to receive a severance payment equal to two times annual salary and the average of the prior two years’ bonuses.
Stock-Based Compensation
Under the Company’s 1995 Stock-Based Compensation Plan, as amended and restated effective November 10, 2000, the Company may award options to purchase shares of the Company’s common stock and grant other stock awards to executives, managers, and key personnel. The Plan is administered by the Human Resources and Compensation Committee of the Board of Directors. Restricted stock awarded under the plan is expensed ratably over the vesting period of the awards. Stock options awarded to employees under the Plan must be at exercise prices equal to or exceeding the fair market value of the Company’s common stock on the date of grant. Stock options are generally subject to four-year cliff vesting and must be exercised within 10 years from the date of grant.
The weighted-average fair value of options granted during 2004, 2003, and 2002 estimated on the date of grant using the Black-Scholes option-pricing model was $17.70, $10.74, and $11.74, respectively. The fair value of 2004, 2003, and 2002 options granted is estimated on the date of grant using the following assumptions: dividend yield of 1.2% to 2.0%, expected volatility of 34.8% to 38.4%, risk-free interest rate of 4.2% to 5.3%, and an expected life of 10 years.

HNI Corporat ion and Subsidiar ies 2004 Annual Report 47
Notes to Consolidated Financial Statements
The status of the Company’s stock option plans is summarized below:
Number of SharesWeighted-Average
Exercise Price
Outstanding at December 29, 2001 1,130,250 $22.32
Granted 290,000 25.77
Exercised – –
Forfeited (17,000) 21.69
Outstanding at December 28, 2002 1,403,250 $23.03
Granted 446,500 26.78
Exercised (362,000) 23.10
Forfeited (18,500) 23.57
Outstanding at January 3, 2004 1,469,250 $24.15
Granted 340,900 39.59
Exercised (448,500) 22.33
Forfeited (53,200) 27.61
Outstanding at January 1, 2005 1,308,450 $28.65
Options exercisable at:
January 1, 2005 604,750 $27.56
January 3, 2004 202,250 25.47
December 28, 2002 156,250 25.02
The following table summarizes information about fixed stock options outstanding at January 1, 2005:
Options OutstandingOptions
Exercisable
Range ofExercise Prices
NumberOutstanding
Weighted-Average
RemainingContractual Life
Weighted- Average
Exercise Price
Number Exercisable at
January 1,2005
$24.50 7,000 2.4 years $24.50 7,000
$32.22 20,000 3.1 years $32.22 20,000
$23.47 58,750 4.1 years $23.47 58,750
$18.31–$26.69 159,000 5.5 years $19.63 134,000
$23.32 113,500 6.1 years $23.32 –
$25.75–$25.77 232,000 7.1 years $25.77 85,000
$25.50–$42.98 385,500 8.2 years $26.93 150,000
$37.57–$42.15 332,700 9.2 years $39.58 150,000
Retirement Benefits
The Company has defined contribution profit-sharing plans covering substantially all employees who are not participants in certain defined benefit plans. The Company’s annual contribution to the defined contribution plans is based on employee eligible earnings and results of operations and amounted to $27,256,000, $26,489,000, and $23,524,000 in 2004, 2003, and 2002, respectively.
The Company sponsors defined benefit plans that include a limited number of salaried and hourly employees at certain subsidiaries. The Company’s funding policy is generally to contribute annually the minimum actuarially computed amount. Net pension costs relating to these plans were $0, $176,000, and $0 for 2004, 2003, and 2002, respectively. The actuarial present value of obligations, less related plan assets at fair value, is not significant.
The Company also participates in a multi-employer plan, which provides defined benefits to certain of the Company’s union employees. Pension expense for this plan amounted to $322,000, $309,000, and $309,000, in 2004, 2003, 2002, respectively.
Postretirement Health Care
In accordance with the guidelines of revised SFAS No.132, “Disclosures about Pensions and other Postretirement Benefits,” the following table sets forth the funded status of the plan, reconciled to the accrued postretirement benefits cost recognized in the Company’s balance sheet at:
(In thousands) 2004 2003 2002
Change in benefit obligation
Benefit obligation at beginning of year $«18,331 $17,617 $«17,351
Service cost 284 249 398
Interest cost 1,066 1,105 1,091
Benefits paid (1,780) (1,206) (1,356)
Actuarial (gain) or loss 1,057 566 133
Benefit obligation at end of year $«18,958 $18,331 $«17,617
Change in plan assets
Fair value at beginning of year $«10,250 $÷÷÷÷«– $«÷÷÷÷«–
Actual return on assets 112 – –
Employer contributions 195 11,456 1,356
Benefits paid (1,780) (1,206) (1,356)
Fair value at end of year $÷«8,777 $10,250 $«÷÷÷÷«–
Reconciliation of funded status
Funded status $(10,181) $«(8,081) $(17,617)
Unrecognized actuarial (gain) or loss 2,340 1,105 539
Unrecognized transition obligation or (asset) 4,780 5,361 5,942
Unrecognized prior service cost 892 1,122 1,352
Net amount recognized at year-end $÷(2,169) $÷÷(493) $÷(9,784)
Amounts recognized in the statement of financial position consist of:
Accrued benefit liability $÷(2,169) $÷÷(493) $÷(9,784)
Net amount recognized at year-end, included in other liabilities $÷(2,169) $÷÷(493) $÷(9,784)
Estimated future benefit payments (in thousands)
Fiscal 2005 $÷«1,166
Fiscal 2006 1,174
Fiscal 2007 1,201
Fiscal 2008 1,251
Fiscal 2009 1,271
Fiscal 2010–2014 6,918
Expected contributions during fiscal 2005
Total $÷÷÷÷÷0

48 HNI Corporat ion and Subsidiar ies 2004 Annual Report
Notes to Consolidated Financial Statements
Plan Assets – Percentage of Fair Value by Category
2004 2003
Equity 0% 0%
Debt 0% 0%
Other 100% 100%
Total 100% 100%
The Company invests these funds in high-grade money market instruments. Prior to 2003, the plan was not funded.
The discount rates at fiscal year-end 2004, 2003, and 2002 were 5.75%, 6.0%, and 6.5%, respectively. The Company payment for these benefits has reached the maximum amounts per the plan; therefore, healthcare trend rates have no impact on Company cost.
In December 2003, the United States enacted into law the Medicare Prescription Drug, Improvement and Modernization Act of 2003 (the “Act”). The Act established a prescription drug benefit under Medicare, known as “Medicare Part D,” and a federal subsidy to sponsors of retiree health care benefit plans that provide a benefit that is at least actuarially equivalent to Medicare Part D.
In May 2004, the FASB issued FASB Staff Position No. 106-2, “Accounting and Disclosure Requirements Related to the Medicare Prescription Drug, Improvement and Modernization Act of 2003” (“FSP 106-2”). The Company adopted FSP 106-2 on July 4, 2004. The Company has determined that the benefits provided by the plan are not actuarially equivalent to the Medicare Part D benefit under the Act based on the percentage of the cost of the plan that the Company provides. Therefore, the adoption of FSP 106-2 did not have an impact on the Company’s financial statements during 2004. The Company will continue to monitor the effect as regulations evolve regarding actuarial equivalency.
Leases
The Company leases certain warehouse, plant facilities, and equipment. Commitments for minimum rentals under non-cancelable leases at the end of 2004 are as follows:
(In thousands) Capitalized
LeasesOperating
Leases
2005 $÷«510 $16,257
2006 284 13,104
2007 215 9,819
2008 211 7,281
2009 211 5,899
Thereafter 379 9,373
Total minimum lease payments $1,810 $61,733
Less: amount representing interest 379
Present value of net minimum lease payments, including current maturities of $413 $1,431
Property, plant, and equipment at year-end include the following amounts for capitalized leases:
(In thousands) 2004 2003 2002
Buildings $3,299 $3,299 $3,299
Machinery and equipment 196 196 196
Office equipment 761 761 –
4,256 4,256 3,495
Less: allowances for depreciation 3,307 2,879 2,514
$÷«949 $1,377 $÷«981
Rent expense for the years 2004, 2003, and 2002 amounted to approximately $16,097,000, $13,592,000, and $13,683,000, respec-tively. The Company has an operating lease for a production facility with annual rentals totaling approximately $353,000 with a corporation in which the minority owner of one of the Company’s consolidated subsidiaries is an investor. Contingent rent expense under both capitalized and operating leases (generally based on mileage of transportation equipment) amounted to $241,000, $313,000, and $787,000 for the years 2004, 2003, and 2002, respectively.
Guarantees, Commitments, and Contingencies
During the second quarter ended June 28, 2003, the Company entered into a one-year financial agreement for the benefit of one of its distribution chain partners, which has been extended. The maximum financial exposure assumed by the Company as a result of this arrangement is currently $2.3 million, which is 100% secured by collateral. In accordance with the provisions of FIN 45, the Company has recorded the fair value of this guarantee, which is estimated to be less than $0.1 million.
The Company utilizes letters of credit in the amount of $20 million to back certain financing instruments, insurance policies, and payment obligations. The letters of credit reflect fair value as a condition of their underlying purpose and are subject to fees competitively determined.
The Company is contingently liable for future minimum payments totaling $4.9 million under a transportation service contract. The transportation agreement is for a three-year period and is automati-cally renewable for periods of one year unless either party gives sixty days written notice of its intent to terminate at the end of the original three-year term or any subsequent term. The minimum payment is $4.9 million in 2005.
The Company has contingent liabilities, which have arisen in the course of its business, including pending litigation, preferential pay-ment claims in customer bankruptcies, environmental remediation, taxes, and other claims. The Company currently has a claim for approximately $7.6 million pending against it arising out of the

HNI Corporat ion and Subsidiar ies 2004 Annual Report 49
Notes to Consolidated Financial Statements
bankruptcy of a customer filed in 2001. The Company was named a critical vendor by the bankruptcy court and, accordingly, was paid in full for all outstanding receivables. The claim alleges that the Company received preferential payments from the customer during the ninety days before the customer filed for bankruptcy protection. The claim was brought in February 2003. The Company has recorded an accrual with respect to this contingency, in an amount substantially less than the full amount of the claim, which represents the best estimate within the range of likely exposure and intends to vigorously defend against the claim. Given the nature of this claim, it is possible that the ultimate outcome could differ from the recorded amount.
Significant Customer
One office furniture customer accounted for approximately 13%, 13%, and 14% of consolidated net sales in 2004, 2003, and 2002, respectively.
Operating Segment Information
In accordance with SFAS No. 131, “Disclosures about Segments of an Enterprise and Related Information,” management views the Company as being in two operating segments: office furniture and hearth products, with the former being the principal segment. The office furniture segment manufactures and markets a broad line of metal and wood commercial and home office furniture which includes storage products, desks, credenzas, chairs, tables, book-cases, freestanding office partitions and panel systems, and other related products. The hearth products segment manufactures and markets a broad line of manufactured electric, gas-, pellet-, and wood-burning fireplaces and stoves, fireplace inserts, gas logs, and chimney systems principally for the home.
The Company’s hearth products segment is somewhat seasonal with the third (July-September) and fourth (October-December) fiscal quarters historically having higher sales than the prior quarters. In fiscal 2004, 54% of consolidated net sales of hearth products were generated in the third and fourth quarters.
For purposes of segment reporting, intercompany sales transfers between segments are not material, and operating profit is income before income taxes exclusive of certain unallocated corporate expenses. These unallocated corporate expenses include the net costs of the Company’s corporate operations, interest income, and interest expense. Management views interest income and expense as corporate financing costs and not as an operating segment cost.
In addition, management applies an effective income tax rate to its consolidated income before income taxes, so income taxes are not reported or viewed internally on a segment basis. Identifiable assets by segment are those assets applicable to the respective industry segments. Corporate assets consist principally of cash and cash equivalents, short-term investments, and corporate office real estate and related equipment.
No geographic information for revenues from external customers or for long-lived assets is disclosed since the Company’s primary market and capital investments are concentrated in the United States.
Reportable segment data reconciled to the consolidated financial statements for the years ended 2004, 2003, and 2002 is as follows:
(In thousands) 2004 2003 2002
Net sales:
Office furniture $1,570,777 $1,304,054 $1,279,059
Hearth products 522,670 451,674 413,563
$2,093,447 $1,755,728 $1,692,622
Operating profit:
Office furniture(a) $÷«154,896 $÷«130,080 $÷«130,014
Hearth products 62,158 54,433 44,852
Total operating profit 217,054 184,513 174,866
Unallocated corporate expenses (38,185) (33,582) (34,312)
Income before income taxes $÷«178,869 $÷«150,931 $÷«140,554
Depreciation and amortization expense:
Office furniture $÷÷«45,737 $÷÷«54,121 $÷÷«48,546
Hearth products 15,061 13,599 13,993
General corporate 5,905 5,052 6,216
$÷÷«66,703 $÷÷«72,772 $÷÷«68,755
Capital expenditures:
Office furniture $÷÷«18,635 $÷÷«17,619 $÷÷«17,183
Hearth products 13,878 12,577 6,132
General corporate 3,287 7,312 2,570
$÷÷«35,800 $÷÷«37,508 $÷÷«25,885
Identifiable assets:
Office furniture $÷«570,294 $÷«452,350 $÷«494,559
Hearth products 338,602 303,811 305,326
General corporate 112,761 265,665 220,667
$1,021,657 $1,021,826 $1,020,552
(a) Included in operating profit for the office furniture segment are pre-tax charges of $0.9 million, $8.5 million, and $3.0 million for closing of facilities and impairment charges in 2004, 2003, and 2002, respectively.

50 HNI Corporat ion and Subsidiar ies 2004 Annual Report
Notes to Consolidated Financial Statements
Summary of Quarterly Results of Operations (Unaudited)
The following table presents certain unaudited quarterly financial information for each of the past 12 quarters. In the opinion of the Company’s management, this information has been prepared on the same basis as the consolidated financial statements appearing elsewhere in this report and includes all adjustments (consisting only of normal recurring accruals) necessary to present fairly the financial results set forth herein. Results of operations for any previous quarter are not necessarily indicative of results for any future period.
(In thousands, except per share data)First
QuarterSecondQuarter
ThirdQuarter
FourthQuarter
Year-End 2004
Net sales $464,037 $508,605 $573,457 $547,348
Cost of products sold 294,275 324,984 367,835 355,049
Gross profit 169,762 183,621 205,622 192,299
Selling and administrative expenses 134,580 142,579 147,594 147,253
Restructuring related charges 520 215 135 16
Operating income 34,662 40,827 57,893 45,030
Interest income (expense) – net 355 120 (29) 11
Income before income taxes 35,017 40,947 57,864 45,041
Income taxes 12,606 15,121 21,120 16,440
Net income $÷22,411 $÷25,826 $÷36,744 $÷28,601
Net income per common share – basic $÷÷÷÷.38 $÷÷÷÷.45 $÷÷÷÷.65 $÷÷÷÷.52
Weighted-average common shares outstanding – basic 58,240 57,943 56,192 55,511
Net income per common share – diluted $÷÷÷÷.38 $÷÷÷÷.44 $÷÷÷÷.65 $÷÷÷÷.51
Weighted-average common shares outstanding – diluted 58,690 58,378 56,635 55,897
As a Percentage of Net Sales
Net sales 100.0% 100.0% 100.0% 100.0%
Gross profit 36.6 36.1 35.9 35.1
Selling and administrative expenses 29.0 28.0 25.7 26.9
Restructuring related charges 0.1 – – –
Operating income 7.5 8.0 10.1 8.2
Income taxes 2.7 3.0 3.7 3.0
Net income 4.8 5.1 6.4 5.2
Year-End 2003
Net sales $391,971 $406,793 $500,091 $456,873
Cost of products sold 252,841 260,367 316,412 286,893
Gross profit 139,130 146,426 183,679 169,980
Selling and administrative expenses 114,426 112,979 127,472 125,867
Restructuring related charges – 2,265 3,881 2,364
Operating income 24,704 31,182 52,326 41,749
Interest income (expense) – net (265) (149) 617 767
Income before income taxes 24,439 31,033 52,943 42,516
Income taxes 8,554 10,861 18,530 14,881
Net income $÷15,885 $÷20,172 $÷34,413 $÷27,635
Net income per common share – basic $÷÷÷÷.27 $÷÷÷÷.35 $÷÷÷÷.59 $÷÷÷÷.47
Weighted-average common shares outstanding – basic 58,317 58,143 58,043 58,222
Net income per common share – diluted $÷÷÷÷.27 $÷÷÷÷.35 $÷÷÷÷.59 $÷÷÷÷.47
Weighted-average common shares outstanding – diluted 58,582 58,468 58,448 58,731
As a Percentage of Net Sales
Net sales 100.0% 100.0% 100.0% 100.0%
Gross profit 35.5 36.0 36.7 37.2
Selling and administrative expenses 29.2 27.8 25.5 27.5
Restructuring related charges – 0.6 0.8 0.5
Operating income 6.3 7.7 10.5 9.1
Income taxes 2.2 2.7 3.7 3.3
Net income 4.1 5.0 6.9 6.0

HNI Corporat ion and Subsidiar ies 2004 Annual Report 51
Notes to Consolidated Financial Statements
(In thousands, except per share data)First
QuarterSecondQuarter
ThirdQuarter
FourthQuarter
Year-End 2002
Net sales $399,139 $399,299 $446,274 $447,910
Cost of products sold 259,398 256,696 285,996 290,653
Gross profit 139,741 142,603 160,278 157,257
Selling and administrative expenses 110,425 111,320 117,274 115,170
Restructuring related charges (income) 3,900 (900) – –
Operating income 25,416 32,183 43,004 42,087
Interest income (expense) – net (580) (710) (577) (269)
Income before income taxes 24,836 31,473 42,427 41,818
Income taxes 8,941 11,330 15,274 13,649
Net income $÷15,895 $÷20,143 $÷27,153 $÷28,169
Net income per common share – basic and diluted $÷÷÷÷.27 $÷÷÷÷.34 $÷÷÷÷.46 $÷÷÷÷.48
Weighted-average common shares outstanding – basic 58,777 58,918 59,140 58,546
As a Percentage of Net Sales
Net sales 100.0% 100.0% 100.0% 100.0%
Gross profit 35.0 35.7 35.9 35.1
Selling and administrative expenses 27.7 27.9 26.3 25.7
Restructuring related charges 1.0 (0.2) – –
Operating income 6.4 8.1 9.6 9.4
Income taxes 2.2 2.8 3.4 3.0
Net income 4.0 5.0 6.1 6.3
Investor Information
COMMON STOCK MARKET PRICES AND DIVIDENDS (UNAUDITED)
QUARTERLY 2004 –2003
2004 by Quarter High LowDividends per Share
1st $45.71 $35.25 $.14
2nd 42.42 36.56 .14
3rd 42.13 36.97 .14
4th 43.65 38.52 .14
Total dividends paid $.56
2003 by Quarter High LowDividends per Share
1st $29.38 $24.65 $.13
2nd 31.67 27.27 .13
3rd 38.60 30.15 .13
4th 44.12 36.65 .13
Total dividends paid $.52
Common Stock Market Price and Price/Earnings Ratio (Unaudited)
FISCAL YEARS 2004 –1994
Market Price *Diluted
Earnings per Share *
Price/Earnings Ratio
Year High Low High Low
2004 $45.71 $35.25 $1.97 23 18
2003 44.12 24.65 1.68 26 15
2002 30.85 22.88 1.55 20 15
2001 28.85 19.96 1.26 23 16
2000 27.88 15.56 1.77 16 9
1999 29.88 18.75 1.44 21 13
1998 37.19 20.00 1.72 22 12
1997 32.13 15.88 1.45 22 11
1996 21.38 9.25 1.13 19 8
1995 15.63 11.50 .67 23 17
1994 17.00 12.00 .87 20 14
Eleven-year average 21 13
* Adjusted for the effect of stock splits

52 HNI Corporat ion and Subsidiar ies 2004 Annual Report
Selected Financial Data – Eleven-Year Summary
2004 2003 2002(a) 2001 2000 1999 1998 1997 1996 1995 1994
Per Common Share Data (Basic and Dilutive)
Income before cumulative effect of accounting changes – basic $÷÷÷÷«1.99 $«««««««««1.69 $«««««««««1.55 $«««««««««1.26 $«««««««««1.77 $«««««««««1.44 $÷÷«÷÷1.72 $«««««««««1.45 $««««««1.13 $««««««««.67 $««««««««.87
Net income – basic 1.99 1.69 1.55 1.26 1.77 1.44 1.72 1.45 1.13 .67 .87
Net income – diluted 1.97 1.68 1.55 1.26 1.77 1.44 1.72 1.45 1.13 .67 .87
Cash dividends .56 .52 .50 .48 .44 .38 .32 .28 .25 .24 .22
Book value – basic 12.10 12.19 11.08 10.10 9.59 8.33 7.54 6.19 4.25 3.56 3.17
Net working capital – basic 1.96 3.71 1.82 1.52 1.09 1.52 1.19 1.53 .89 1.07 1.27
Operating Results (Thousands of Dollars)
Net sales $2,093,447 $1,755,728 $1,692,622 $1,792,438 $2,046,286 $1,800,931 $1,706,628 $1,362,713 $998,135 $893,119 $845,998
Cost of products sold 1,342,143 1,116,513 1,092,743 1,181,140 1,380,404 1,236,612 1,172,997 933,157 679,496 624,700 573,392
Gross profit 751,304 639,215 599,879 611,298 665,882 564,319 533,632 429,556 318,639 268,419 272,606
Interest expense 886 2,970 4,714 8,548 14,015 9,712 10,658 8,179 4,173 3,569 3,248
Income before income taxes 178,869 150,931 140,554 116,261 165,964 137,575 170,109 139,128 105,267 65,517 86,338
Income before income taxes as a % of net sales 8.54% 8.60% 8.30% 6.49% 8.11% 7.64% 9.97% 10.21% 10.55% 7.34% 10.21%
Federal and state income taxes $÷÷«65,287 $«««««52,826 $«««««49,194 $«««««41,854 $«««««59,747 $«««««50,215 $«««««63,796 $«««««52,173 $««37,173 $««24,419 $««31,945
Effective tax rate 36.5% 35.0% 35.0% 36.0% 36.0% 36.5% 37.50% 37.50% 35.31% 37.27% 37.00%
Income before cumulative effect of accounting changes $÷«113,582 $«««««98,105 $«««««91,360 $«««««74,407 $«««106,217 $«««««87,360 $«««106,313 $«««««86,955 $««68,094 $««41,098 $««54,393
Net income 113,582 98,105 91,360 74,407 106,217 87,360 106,313 86,955 68,094 41,098 54,156
Net income as a % of net sales 5.43% 5.59% 5.40% 4.15% 5.19% 4.85% 6.23% 6.38% 6.82% 4.60% 6.43%
Cash dividends and share purchase rights redeemed $÷÷«32,023 $«««««30,299 $«««««29,386 $«««««28,373 $«««««26,455 $«««««23,112 $«««««19,730 $«««««16,736 $««14,970 $««14,536 $««13,601
Addition to (reduction of) retained earnings (35,100) 54,001 55,176 36,759 79,762 64,248 86,583 37,838 33,860 18,863 13,563
Net income applicable to common stock 113,582 98,105 91,360 74,407 106,217 87,360 106,313 86,955 68,094 41,098 54,156
% return on average shareholders’ equity 16.47% 14.46% 14.74% 12.76% 19.77% 18.14% 25.20% 27.43% 29.06% 20.00% 28.95%
Depreciation and amortization $÷÷«66,703 $«««««72,772 $«««««68,755 $«««««81,385 $«««««79,046 $«««««65,453 $«««««52,999 $«««««35,610 $««25,252 $««21,416 $««19,042
Distribution of Net Income
% paid to shareholders 28.19% 30.88% 32.16% 38.13% 24.91% 26.46% 18.56% 19.25% 21.98% 35.37% 25.11%
% reinvested in business 71.81% 69.12% 67.84% 61.87% 75.09% 73.54% 81.44% 80.75% 78.02% 64.63% 74.89%
Financial Position (Thousands of Dollars)
Current assets $÷«374,579 $«««462,122 $«««405,054 $«««319,657 $«««330,141 $«««316,556 $«««290,329 $«««295,150 $205,527 $194,183 $188,810
Current liabilities 266,250 245,816 298,680 230,443 264,868 225,123 217,438 200,759 152,553 128,915 111,093
Working capital 108,329 216,306 106,374 89,214 65,273 91,433 72,891 94,391 52,974 65,268 77,717
Net property, plant, and equipment 311,344 312,368 353,270 404,971 454,312 455,591 444,177 341,030 234,616 210,033 177,844
Total assets 1,021,657 1,021,826 1,020,552 961,891 1,022,470 906,723 864,469 754,673 513,514 409,518 372,568
% return on beginning assets employed 17.46% 14.69% 14.83% 12.04% 19.63% 16.94% 23.74% 28.27% 25.93% 17.91% 24.72%
Long-term debt and capital lease obligations $÷÷÷«3,645 $«««««÷4,126 $«««««««9,837 $«««««80,830 $«««128,285 $«««124,173 $«««135,563 $«««134,511 $««77,605 $««42,581 $««45,877
Shareholders’ equity 669,163 709,889 646,893 592,680 573,342 501,271 462,022 381,662 252,397 216,235 194,640
Retained earnings 606,632 641,732 587,731 532,555 495,796 416,034 351,786 265,203 227,365 193,505 174,642
Current ratio 1.41 1.88 1.36 1.39 1.25 1.41 1.34 1.47 1.35 1.51 1.70
Current Share Data
Number of shares outstanding at year-end 55,303,323 58,238,519 58,373,607 58,672,933 59,796,891 60,171,753 61,289,618 61,659,316 59,426,530 60,788,674 61,349,206
Weighted-average shares outstanding during year – basic 57,127,110 58,178,739 58,789,851 59,087,963 60,140,302 60,854,579 61,649,531 59,779,508 60,228,590 60,991,284 62,435,450
Number of shareholders of record at year-end 6,465 6,416 6,777 6,694 6,563 6,737 5,877 5,399 5,319 5,479 5,556
Other Operational Data
Capital expenditures (thousands of dollars) $÷÷«32,417 $«««««34,842 $«««««25,885 $«««««36,851 $«««««59,840 $«««««71,474 $«««149,717 $«««««85,491 $««44,684 $««53,879 $««35,005
Members (employees) at year-end 10,589(b) 8,926 8,828 9,029(b) 11,543(b) 10,095 9,824(b) 9,390(b) 6,502(b) 5,933 6,131
(a) Per SFAS No. 142, “Goodwill and Other Intangible Assets,” the Company has ceased recording of goodwill and indefinite-lived intangible amortization.(b) Includes acquisitions completed during the fiscal year.

HNI Corporat ion and Subsidiar ies 2004 Annual Report 53
2004 2003 2002(a) 2001 2000 1999 1998 1997 1996 1995 1994
Per Common Share Data (Basic and Dilutive)
Income before cumulative effect of accounting changes – basic $÷÷÷÷«1.99 $«««««««««1.69 $«««««««««1.55 $«««««««««1.26 $«««««««««1.77 $«««««««««1.44 $÷÷«÷÷1.72 $«««««««««1.45 $««««««1.13 $««««««««.67 $««««««««.87
Net income – basic 1.99 1.69 1.55 1.26 1.77 1.44 1.72 1.45 1.13 .67 .87
Net income – diluted 1.97 1.68 1.55 1.26 1.77 1.44 1.72 1.45 1.13 .67 .87
Cash dividends .56 .52 .50 .48 .44 .38 .32 .28 .25 .24 .22
Book value – basic 12.10 12.19 11.08 10.10 9.59 8.33 7.54 6.19 4.25 3.56 3.17
Net working capital – basic 1.96 3.71 1.82 1.52 1.09 1.52 1.19 1.53 .89 1.07 1.27
Operating Results (Thousands of Dollars)
Net sales $2,093,447 $1,755,728 $1,692,622 $1,792,438 $2,046,286 $1,800,931 $1,706,628 $1,362,713 $998,135 $893,119 $845,998
Cost of products sold 1,342,143 1,116,513 1,092,743 1,181,140 1,380,404 1,236,612 1,172,997 933,157 679,496 624,700 573,392
Gross profit 751,304 639,215 599,879 611,298 665,882 564,319 533,632 429,556 318,639 268,419 272,606
Interest expense 886 2,970 4,714 8,548 14,015 9,712 10,658 8,179 4,173 3,569 3,248
Income before income taxes 178,869 150,931 140,554 116,261 165,964 137,575 170,109 139,128 105,267 65,517 86,338
Income before income taxes as a % of net sales 8.54% 8.60% 8.30% 6.49% 8.11% 7.64% 9.97% 10.21% 10.55% 7.34% 10.21%
Federal and state income taxes $÷÷«65,287 $«««««52,826 $«««««49,194 $«««««41,854 $«««««59,747 $«««««50,215 $«««««63,796 $«««««52,173 $««37,173 $««24,419 $««31,945
Effective tax rate 36.5% 35.0% 35.0% 36.0% 36.0% 36.5% 37.50% 37.50% 35.31% 37.27% 37.00%
Income before cumulative effect of accounting changes $÷«113,582 $«««««98,105 $«««««91,360 $«««««74,407 $«««106,217 $«««««87,360 $«««106,313 $«««««86,955 $««68,094 $««41,098 $««54,393
Net income 113,582 98,105 91,360 74,407 106,217 87,360 106,313 86,955 68,094 41,098 54,156
Net income as a % of net sales 5.43% 5.59% 5.40% 4.15% 5.19% 4.85% 6.23% 6.38% 6.82% 4.60% 6.43%
Cash dividends and share purchase rights redeemed $÷÷«32,023 $«««««30,299 $«««««29,386 $«««««28,373 $«««««26,455 $«««««23,112 $«««««19,730 $«««««16,736 $««14,970 $««14,536 $««13,601
Addition to (reduction of) retained earnings (35,100) 54,001 55,176 36,759 79,762 64,248 86,583 37,838 33,860 18,863 13,563
Net income applicable to common stock 113,582 98,105 91,360 74,407 106,217 87,360 106,313 86,955 68,094 41,098 54,156
% return on average shareholders’ equity 16.47% 14.46% 14.74% 12.76% 19.77% 18.14% 25.20% 27.43% 29.06% 20.00% 28.95%
Depreciation and amortization $÷÷«66,703 $«««««72,772 $«««««68,755 $«««««81,385 $«««««79,046 $«««««65,453 $«««««52,999 $«««««35,610 $««25,252 $««21,416 $««19,042
Distribution of Net Income
% paid to shareholders 28.19% 30.88% 32.16% 38.13% 24.91% 26.46% 18.56% 19.25% 21.98% 35.37% 25.11%
% reinvested in business 71.81% 69.12% 67.84% 61.87% 75.09% 73.54% 81.44% 80.75% 78.02% 64.63% 74.89%
Financial Position (Thousands of Dollars)
Current assets $÷«374,579 $«««462,122 $«««405,054 $«««319,657 $«««330,141 $«««316,556 $«««290,329 $«««295,150 $205,527 $194,183 $188,810
Current liabilities 266,250 245,816 298,680 230,443 264,868 225,123 217,438 200,759 152,553 128,915 111,093
Working capital 108,329 216,306 106,374 89,214 65,273 91,433 72,891 94,391 52,974 65,268 77,717
Net property, plant, and equipment 311,344 312,368 353,270 404,971 454,312 455,591 444,177 341,030 234,616 210,033 177,844
Total assets 1,021,657 1,021,826 1,020,552 961,891 1,022,470 906,723 864,469 754,673 513,514 409,518 372,568
% return on beginning assets employed 17.46% 14.69% 14.83% 12.04% 19.63% 16.94% 23.74% 28.27% 25.93% 17.91% 24.72%
Long-term debt and capital lease obligations $÷÷÷«3,645 $«««««÷4,126 $«««««««9,837 $«««««80,830 $«««128,285 $«««124,173 $«««135,563 $«««134,511 $««77,605 $««42,581 $««45,877
Shareholders’ equity 669,163 709,889 646,893 592,680 573,342 501,271 462,022 381,662 252,397 216,235 194,640
Retained earnings 606,632 641,732 587,731 532,555 495,796 416,034 351,786 265,203 227,365 193,505 174,642
Current ratio 1.41 1.88 1.36 1.39 1.25 1.41 1.34 1.47 1.35 1.51 1.70
Current Share Data
Number of shares outstanding at year-end 55,303,323 58,238,519 58,373,607 58,672,933 59,796,891 60,171,753 61,289,618 61,659,316 59,426,530 60,788,674 61,349,206
Weighted-average shares outstanding during year – basic 57,127,110 58,178,739 58,789,851 59,087,963 60,140,302 60,854,579 61,649,531 59,779,508 60,228,590 60,991,284 62,435,450
Number of shareholders of record at year-end 6,465 6,416 6,777 6,694 6,563 6,737 5,877 5,399 5,319 5,479 5,556
Other Operational Data
Capital expenditures (thousands of dollars) $÷÷«32,417 $«««««34,842 $«««««25,885 $«««««36,851 $«««««59,840 $«««««71,474 $«««149,717 $«««««85,491 $««44,684 $««53,879 $««35,005
Members (employees) at year-end 10,589(b) 8,926 8,828 9,029(b) 11,543(b) 10,095 9,824(b) 9,390(b) 6,502(b) 5,933 6,131
(a) Per SFAS No. 142, “Goodwill and Other Intangible Assets,” the Company has ceased recording of goodwill and indefinite-lived intangible amortization.(b) Includes acquisitions completed during the fiscal year.

To the Board of Directors and Shareholders of HNI Corporation:
We have completed an integrated audit of HNI Corporation’s (formerly HON INDUSTRIES Inc.) fiscal year 2004 consolidated financial statements and of its internal control over financial reporting as of January 1, 2005 and audits of its January 3, 2004 and December 28, 2002 consolidated financial statements in accordance with the standards of the Public Company Accounting Oversight Board (United States). Our opinions, based on our audits, are presented below.
Consolidated financial statements In our opinion, the accompanying consolidated balance sheets and the related consolidated statements of income, shareholders’ equity and cash flows present fairly, in all material respects, the financial position of HNI Corporation and its subsidiaries (the “Company”) at January 1, 2005, January 3, 2004, and December 28, 2002 and the results of their operations and their cash flows for each of the three years in the period ended January 1, 2005 in conformity with accounting principles generally accepted in the United States of America. These financial statements are the responsibility of the Company’s management. Our responsibility is to express an opinion on these financial statements based on our audits. We conducted our audits of these statements in accordance with the standards of the Public Company Accounting Oversight Board (United States). Those standards require that we plan and perform the audit to obtain reasonable assurance about whether the financial statements are free of material misstatement. An audit of financial statements includes examining, on a test basis, evidence supporting the amounts and disclosures in the financial statements, assessing the accounting principles used and significant estimates made by management, and evaluating the overall financial statement presentation. We believe that our audits provide a reasonable basis for our opinion.
Internal control over financial reportingAlso, in our opinion, management’s assessment, included in the accompanying Management Report on Internal Control Over Financial Reporting that the Company maintained effective internal control over financial reporting as of January 1, 2005 based on criteria established in Internal Control – Integrated Framework issued by the Committee of Sponsoring Organizations of the Treadway Commission (“COSO”), is fairly stated, in all material respects, based on those criteria. Furthermore, in our opinion, the Company maintained, in all material respects, effective internal control over financial reporting as of January 1, 2005, based on criteria established in Internal Control – Integrated Framework issued by the COSO. The Company’s management is responsible for maintaining effective internal control over financial reporting and for its assessment of the effectiveness of internal control over financial reporting. Our responsibility is to express opinions on management’s assessment and on the effectiveness of the Company’s internal control over financial reporting based on our audit. We conducted our audit of internal control over financial reporting in accordance with the standards of the Public Company Accounting Oversight Board (United States). Those standards require that we plan and perform the audit to obtain reasonable assurance about whether effective internal control over financial reporting was main-tained in all material respects. An audit of internal control over financial reporting includes obtaining an understanding of internal control over financial reporting, evaluating management’s assessment, testing and evaluating the design and operating effectiveness of internal control, and performing such other procedures as we consider necessary in the circumstances. We believe that our audit provides a reasonable basis for our opinions.
A company’s internal control over financial reporting is a process designed to provide reasonable assurance regarding the reliability of financial reporting and the preparation of financial statements for external purposes in accordance with generally accepted accounting principles. A company’s internal control over financial reporting includes those policies and procedures that (i) pertain to the maintenance of records that, in reasonable detail, accurately and fairly reflect the transactions and dispositions of the assets of the company; (ii) provide reasonable assurance that transactions are recorded as necessary to permit preparation of financial statements in accordance with generally accepted accounting principles, and that receipts and expenditures of the company are being made only in accordance with authorizations of management and directors of the company; and (iii) provide reasonable assurance regarding prevention or timely detection of unauthorized acquisition, use, or disposition of the company’s assets that could have a material effect on the financial statements.
Because of its inherent limitations, internal control over financial reporting may not prevent or detect misstatements. Also, projections of any evaluation of effectiveness to future periods are subject to the risk that controls may become inadequate because of changes in conditions, or that the degree of compliance with the policies or procedures may deteriorate.
PricewaterhouseCoopers LLPChicago, IllinoisFebruary 23, 2005
R E P O R T O F I N D E P E N D E N T R E GI S T E R E D P U B L I C A C C O U N T I N G F I R M
5 4 H N I C o r p o r a t i o n 2 0 0 4 A n n u a l R e p o r t

Management of HNI Corporation is responsible for establishing and maintaining adequate internal control over financial reporting as defined in Rules 13a–15(f) and 15d–15(f) under the Securities Exchange Act of 1934. HNI Corporation’s internal control over financial reporting is a process designed to provide reasonable assurance regarding the reliability of financial reporting and the preparation of financial statements for external purposes in accordance with accounting principles generally accepted in the United States of America. The Company’s internal control over financial reporting includes those written policies and procedures that: • Pertain to the maintenance of records that, in reasonable detail, accurately and fairly reflect the transactions and dispositions of the assets of HNI Corporation;
• Provide reasonable assurance that transactions are recorded as necessary to permit preparation of financial statements in accordance with accounting principles generally accepted in the United States of America, and that receipts and expenditures of HNI Corporation are being made only in accordance with authorizations of management and directors of HNI Corporation; and
• Provide reasonable assurance regarding prevention or timely detection of unauthorized acquisition, use or disposition of assets that could have a material effect on the consolidated financial statements.
Internal control over financial reporting includes the controls themselves, monitoring (including internal auditing practices),and actions taken to correct deficiencies as identified.
Because of its inherent limitations, internal control over financial reporting may not prevent or detect misstatements. Also, projections of any evaluation of effectiveness to future periods are subject to the risk that controls may become inadequate because of changes in conditions, or that the degree of compliance with the policies or procedures may deteriorate.
Management assessed the effectiveness of HNI Corporation’s internal control over financial reporting as of January 1, 2005. Management based this assessment on criteria for effective internal control over financial reporting described in Internal Control – Integrated Framework issued by the Committee of Sponsoring Organizations of the Treadway Commission. Management’s assessment included an evaluation of the design of the Company’s internal control over financial reporting and testing of the operational effectiveness of the Company’s internal control over financial reporting. Management reviewed the results of its assessment with the Audit Committee of our Board of Directors.
Based on this assessment, management determined that, as of January 1, 2005, HNI Corporation maintained effective internal control over financial reporting.
Management’s assessment of the effectiveness of the Company’s internal control over financial reporting as of January 1, 2005 has been audited by PricewaterhouseCoopers LLP, an independent registered public accounting firm, as stated in their report which appears herein.
Stan A. Askren Jerald K. DittmerChairman, President and Chief Executive Officer Vice President and Chief Financial Officer
February 18, 2005
M A N A G E M E N T R E P O R T O N I N T E R N A L C O N T R O L O V E R F I N A N C I A L R E P O R T I N G
H N I C o r p o r a t i o n 2 0 0 4 A n n u a l R e p o r t 5 5
A M E S S A G E F R O M T H E B O A R D O F D I R E C T O R S
Dear Shareholders:
In a market environment characterized by constant change, the HNI Corporation Board of Directors believes there is one thing in business that should never change: the paramount importance of integrity. Integrity is central to good corporate governance. As Board members, we are proud to uphold this and the other values expressed in HNI Corporation’s vision statement, which appears on the last page of this annual report. Those familiar with this company know that the HNI vision statement is a powerful expression of priorities for every member. It guides every major decision made across the organization, and it has for many years. Our responsibility on the Board is to fulfill our role in the implementation of the vision through sound policies and practices, through clear and open communication, and through a conservative and straightforward financial management philosophy. Equally important is to maintain a strong, committed, engaged and independent Board. To that end, our three committees of the Board (Audit; Human Resources and Compensation; and Public Policy and Corporate Governance) have long consisted entirely of outside directors. Succession planning also is a critical element of good governance. The Board was pleased to see the CEO succession process completed in 2004 with Stan Askren assuming the role of Chairman and Chief Executive Officer in addition to his duties as President. We are proud to serve on the HNI Board of Directors. As this company evolves and grows, rest assured that we will continue to work on our shareholders’ behalf to honor the values and priorities expressed in HNI’s vision statement.
Sincerely,The HNI Corporation Board of Directors
5 6 H N I C o r p o r a t i o n 2 0 0 4 A n n u a l R e p o r t
Stan A. Askren Miguel M. Calado Gary M. Christensen Cheryl A. Francis
John A. Halbrook Dennis J. Martin Jack D. Michaels Larry B. Porcellato
Joseph Scalzo Abbie J. Smith Richard H. Stanley
Brian E. Stern Ronald V. Waters, III

B O A R D O F D I R E C T O R S A N D O F F I C E R S
Board of Directors
Stan A. Askren Chairman, President and Chief Executive Officer, HNI Corporation
Miguel M. Calado Executive Vice President and President, International, Dean Foods Company
Gary M. ChristensenRetired President and Chief Executive Officer, Pella Corporation
Cheryl A. FrancisAdvisor/Consultant, Former Executive Vice President and Chief Financial Officer, RR Donnelley & Sons
John A. HalbrookChairman and Chief Executive Officer,Woodward Governor Company
Dennis J. MartinChairman, President and Chief Executive Officer, General Binding Corporation
Jack D. MichaelsChairman, Presidentand Chief Executive Officer,Snap-on IncorporatedRetired Chairman,HNI Corporation
Larry B. PorcellatoChief Executive Officer, ICI Paints North America
Joseph ScalzoGroup President, Personal Care and Global Value Chain, The Gillette Company
Abbie J. SmithChaired Professor, The University of Chicago Graduate School of Business
Richard H. StanleyVice Chairman, HNI Corporation Chairman, SC Companies, Inc. Chairman, Stanley Consultants, Inc.
Brian E. SternSenior Vice President, Xerox, Fuji Xerox Operations, Xerox Corporation
Ronald V. Waters, IIIChief Operating Officer, Wm. Wrigley Jr. Company
Committees of the Board
AuditRonald V. Waters, III, Chairperson
Miguel M. CaladoDennis J. MartinAbbie J. Smith
Human Resources and CompensationGary M. Christensen, Chairperson
John A. HalbrookLarry B. PorcellatoRichard H. Stanley
Public Policy and Corporate GovernanceBrian E. Stern, Chairperson
Cheryl A. FrancisJoseph Scalzo
HNI Corporation Officers
Stan A. AskrenChairman, President and Chief Executive Officer
Jerald K. DittmerVice President and Chief Financial Officer
Robert J. Driessnack Vice President, Controller
Melinda C. EllsworthVice President, Treasurer and Investor Relations
Tamara S. Feldman Vice President, Financial Reporting
Malcolm C. FieldsVice President and Chief Information Officer
Robert D. HayesVice President, Business Analysis and General Auditor
Jeffrey D. LorengerVice President, General Counsel and Secretary
Donald T. MeadVice President, Member and Community Relations
Timothy R. Summers Vice President, Lean Enterprise
Operating Companies
Timothy J. Anderson President, Omni Remanufacturing, Inc.
David C. BurdakinExecutive Vice President, HNI Corporation President, The HON Company
Bradley D. DetermanPresident, Hearth & Home Technologies Inc.
Thomas D. HeadVice President and General Manager, Holga Inc.
Eric K. JungbluthPresident, Allsteel Inc.
Russell S. MinickPresident, The Gunlocke Company L.L.C.
Marco V. MolinariPresident, International and Business Development
Jean M. ReynoldsPresident, Maxon Furniture Inc.
Thomas A. TolonePresident, Paoli Inc.
H N I C o r p o r a t i o n 2 0 0 4 A n n u a l R e p o r t 5 7
O U R V I S I O N
We, the members of HNI Corporation, are dedicated to creating long-term value for all of our stakeholders, to exceeding our customers’ expectations and to making our company a great place to work. We will always treat each other, as well as customers, suppliers, shareholders and our communities, with fairness and respect. Our success depends upon business simplification, rapid continuous improvement and innovation in everything we do, individual and collective integrity, and the relentless pursuit of the following long-standing beliefs:
We will be profitable.We pursue mutually profitable relationships with customers and suppliers. Only when our company achieves an adequate profit can the other elements of this Vision be realized.
We will create long-term value for shareholders.We create long-term value for shareholders by earning financial returns significantly greater than our cost of capital and pursuing profitable growth opportunities. We will safeguard our shareholders’ equity by maintaining a strong balance sheet to allow flexibility in responding to a continuously changing market and business environment.
We will pursue profitable growth.We pursue profitable growth on a global basis in order to provide continued job opportunities for members and financial success for all stakeholders.
We will be a supplier of quality products and services.We provide reliable products and services of high quality and brand value to our end-users. Our products and services exceed our customers’ expectations and enable our distribu-tors and our company to make a fair profit.
We will be a great place to work.We pursue a participative environment and support a culture that encourages and recognizes excellence, active involve-ment, ongoing learning and contributions of each member; that seeks out and values diversity; and that attracts and retains the most capable people who work safely, are motivated and are devoted to making our company and our members successful.
We will be a responsible corporate citizen.We conduct our business in a way that sustains the well-being of society, our environment and the economy in which we live and work. We follow ethical and legal business practices. Our company supports our volunteer efforts and provides charitable contributions so that we can actively participate in the civic, cultural, educational, environmental and governmental affairs of our society.
To our stakeholders:When our company is appreciated by its members, favored by its customers, supported by its suppliers, respected by the public and admired by its shareholders, this Vision is fulfilled.
5 8 H N I C o r p o r a t i o n 2 0 0 4 A n n u a l R e p o r t

What’s behind our performance
I N V E S T O R I N F O R M AT I O N
Schedule of Quarterly ResultsThe Company operates on a fiscal year ending on the Saturday nearest December 31. Quarterly results are typically announced within 25 days after the end of each quarter, and audited results are typically announced within 40 days after year-end.
Fiscal 2005 Quarter-End Dates1st Quarter: Saturday, April 22nd Quarter: Saturday, July 23rd Quarter: Saturday, October 14th Quarter: Saturday, December 31
Annual MeetingThe Company’s annual shareholders’ meeting will be held at 10:30 a.m. on Tuesday, May 3, 2005, at the Holiday Inn, Highways 61 & 38 North, Muscatine, Iowa. Shareholders and other interested investors are encouraged to attend the meeting.
Investor RelationsSend inquiries to:Investor RelationsHNI Corporation414 East Third StreetMuscatine, IA 52761Telephone: 563.264.7400Fax: 563.264.7655E-mail: [email protected]
Corporate HeadquartersHNI Corporation414 East Third StreetP.O. Box 1109Muscatine, IA 52761-0071Telephone: 563.264.7400Fax: 563.264.7217Website: www.hnicorp.com
Independent Public AccountantsPricewaterhouseCoopers LLPOne North Wacker DriveChicago, IL 60606
Common StockHNI Corporation common stock trades on the New York Stock Exchange under the symbol: HNI. Stock price quotations can be found in major daily newspapers and The Wall Street Journal.Journal.Journal
Transfer AgentShareholders may report a change of address or make inquiries by writing or calling:Computershare Investor Services, LLC2 North LaSalle StreetChicago, IL 60602Telephone: 312.588.4991
Forward-Looking StatementsStatements in this report that are not strictly historical, including statements as to plans, objectives, and future financial performance, are “forward-looking” statements that are made pursuant to the safe harbor provisions of the Private Securities Litigation Reform Act of 1995. Forward-looking statements involve known and unknown risks, which may cause the Company’s actual results in the future to differ materially from expected results.
Because of the following risks, as well as other variables affecting the Company’s operating results, past fi nancial performance may not be a reliable indicator of future performance, and historical trends should not be used to anticipate results or trends in future periods:
• competition within the office furniture and fireplace industries, including competition from imported products and competitive pricing;
• increases in the cost of raw materials, including steel, which is the Company’s largest raw material category;
• the ability of the Company to realize financial benefits through price realization from its price increases;
• increases in the cost of health care benefits provided by the Company;
• reduced demand for the Company’s storage products caused by changes in office technology, including the change from paper record storage to electronic record storage;
• the effects of economic conditions on demand for office furniture, customer insolvencies, and related bad debts and claims against the Company that it received preferential payments;
• changes in demand and order patterns from the Company’s customers, particularly its top 10 customers, which represented approximately 36% of net sales in 2004;
• issues associated with acquisitions and integration of acquisitions;
• the ability of the Company to realize cost savings and productivity improvements from its cost containment and business simplification initiatives;
• the ability of the Company to realize financial benefits from investments in new products;
• the ability of the Company’s distributors and dealers to successfully market and sell the Company’s products;
• the availability and cost of capital to finance planned growth; and
• other risks, uncertainties, and factors described from time to time in the Company’s filings with the Securities and Exchange Commission.
We caution the reader that the above list of factors may not be exhaustive. The Company does not assume any obligation to update any forward-looking statement, whether as a result of new information, future events or otherwise.
Des
ign:
BCN
Com
mun
icat
ions
/ w
ww
.bcn
com
m.c
om
Exe
cuti
ve P
hoto
grap
hy: J
ames
Sch
nepf
P
rintin
g: C
enve
o A
nder
son
Lith
ogra
ph

414 East Third StreetMuscatine, Iowa 52761www.hnicorp.com
HNI Corporation
2004 Annual Report
Behind the Numbers. HN
I Corporation 2004 Annual Report