Begin Yennifer Castellon Period 2 Macro $100 $200 $300 $400 $500 Unit 1 Unit2 All Around...
32
Begin Begin Yennifer Castellon Period 2 Macro
-
Upload
lucinda-lewis -
Category
Documents
-
view
217 -
download
1
Transcript of Begin Yennifer Castellon Period 2 Macro $100 $200 $300 $400 $500 Unit 1 Unit2 All Around...

BeginBegin
Yennifer CastellonPeriod 2Macro

$100 $100 $100 $100 $100$100
$200 $200 $200 $200 $200$200
$300 $300 $300 $300 $300$300
$400 $400 $400 $400 $400$400
$500 $500 $500 $500 $500$500
Unit 1 Unit 1 Unit Unit
22 All AroundAll AroundGraphsGraphsSummerSummerWorkWork Unit 3Unit 3

SummerSummer Work- $100 Work- $100
The demand for what shifts when thereare changes in GDP?
Demand for money

Summer Work- $200
Increasing the money supply lowersinterest rates why?
Because surplus money moves into thebond market,

Summer Work- $300
Points above full employment indicate what?
They indicate an overheated economy withinflationary problems.

Summer Work- $400
Other countries want U.S. goods when?
A. Ours are cheaperB. Our inflation is less than theirsC. Our interest rate is higher D. The other country is growing faster

Summer Work- $500
What are shifters of investment demand?
A. Acquisition, maintenance, and operating costB. Business TaxesC. Technological ChangeD. Stick of capital goods on handE. Expectations
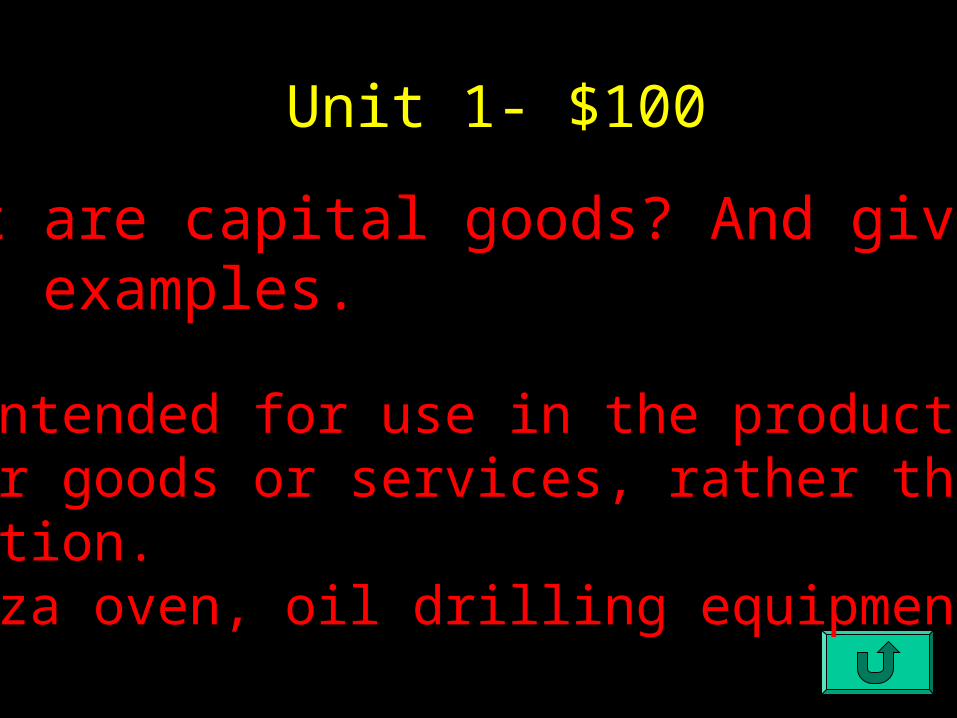
Unit 1Unit 1- $100
What are capital goods? And givetwo examples.
Goods intended for use in the production of other goods or services, rather than finalconsumption.Ex. pizza oven, oil drilling equipment
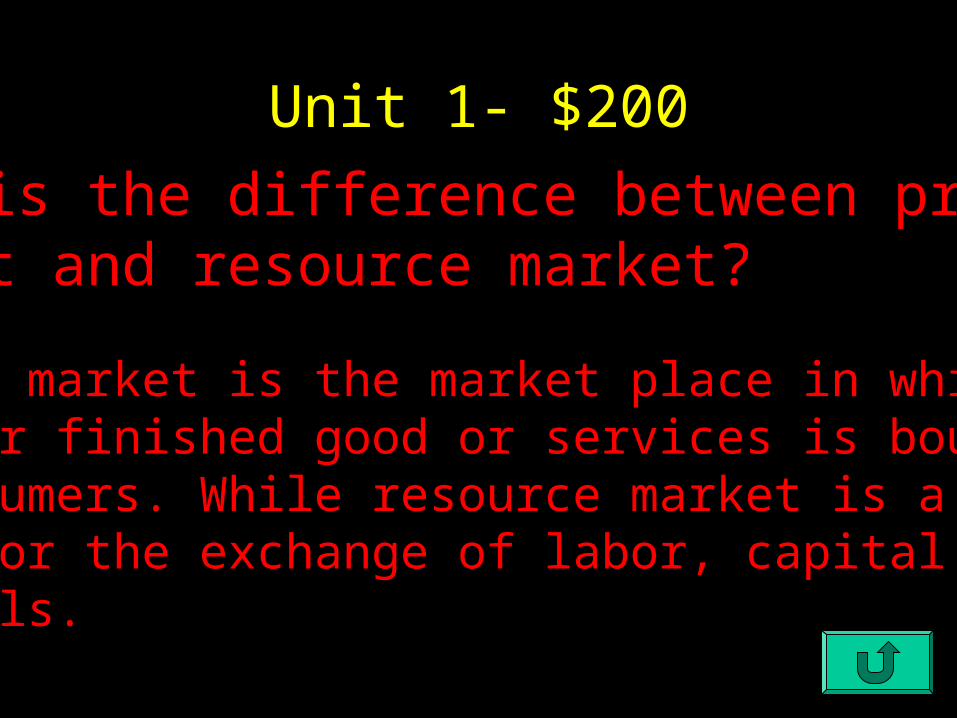
Unit 1- $200
What is the difference between productmarket and resource market?
Product market is the market place in which a final or finished good or services is boughtby consumers. While resource market is a marketplace for the exchange of labor, capital or raw materials.

Unit 1- $300This is a model that illustrates the flow of goods and services through the economy.
Circular Flow Model

Unit 1- $400
What are four factors of production?
1. Land2. Labor3. Capital4. Entrepreneurship

Unit 1- $500
Which are the five determinants of demand.
1. Tastes and Preferences2. Number of Consumers3. Price of related goods4. Income5. Future Expectations
Unit 2- $100
What is GDP?
The total value of all final goods and services produced in the economy during a given year.

Unit 2- $200
What are final goods and services?
Goods and services sold to the final or end.

Unit 2- $300What unemployment rate arises form the effect of frictional and structural unemployment?
Natural Rate of unemployment

Unit 2- $400
Consumers buy more of a good when its price decreases and less when its price increases.
Law of Demand
Unit 2- $500The principle that suppliers will normally offer more for sale at higher prices and less at lower prices.
Law of Supply
Unit 3- $100
Aggregate Demand
It is the total demand for final goods and services in the economy at a given time and price level.

Unit 3- $200
What is aggregate supply?
It is the total supply of goods and services that firms in a national economy plan on selling during a specific time period .

Unit 3- $300If aggregate demand increases and aggregated supply decreases the price level:
Will increase but real output is indeterminate

Unit 3- $400
This unemployment occurs when people take time to find a job.
Frictional Unemployment

Unit 3- $500Unemployment that rises during economic downturns and falls when the economy improves is?
Cyclical Unemployment

All Around- $100
What is an example of a substitute.
Ex. Coke and Pepsi

All Around- $200
What is scarcity?
Resources are not unlimited and are not unlimited and are not available in sufficientquantities to satisfy all the various ways a society wants to use them.
All Around- $300
What is the difference between concave vs. convex?
Concave is a surface that is curved inward in the middle.Convex is a surface that curved outward inthe middle.

All Around- $400
What is supply shock?
Is an event that shifts the short-runaggregate.
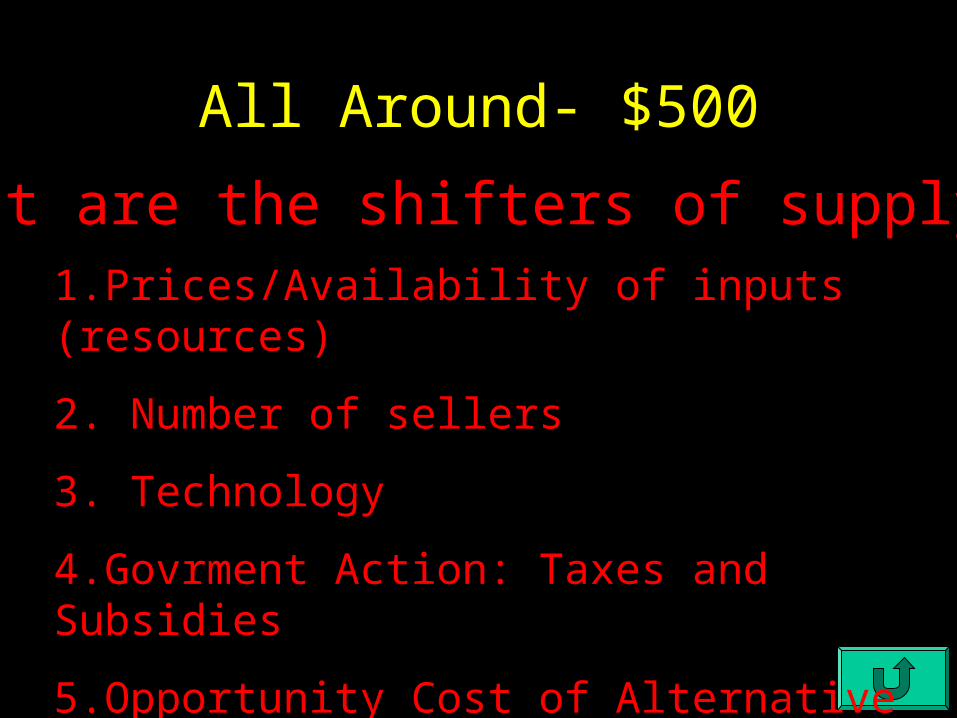
All Around- $500
1.Prices/Availability of inputs (resources)
2. Number of sellers
3. Technology
4.Govrment Action: Taxes and Subsidies
5.Opportunity Cost of Alternative Production
6. Expectations of Future Profit
What are the shifters of supply?

Graphs- $100
What is this graph called?
PPC

Graphs- $200
What is this graph called?
PPF

Graphs- $300
What graph is this?
Supply and Demand
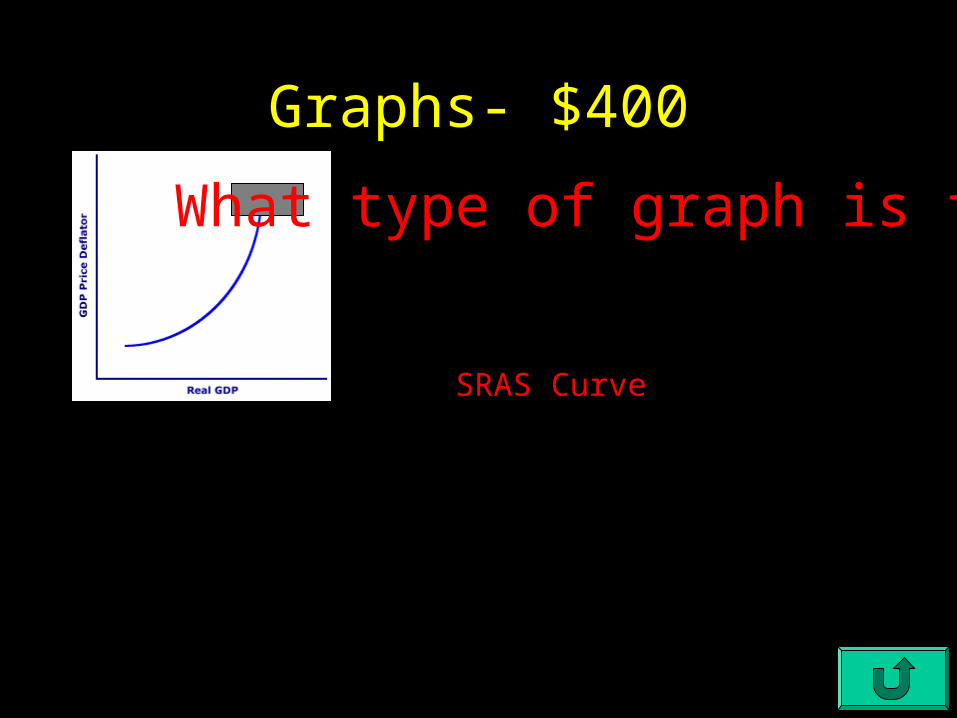
Graphs- $400
What type of graph is this?
SRAS Curve
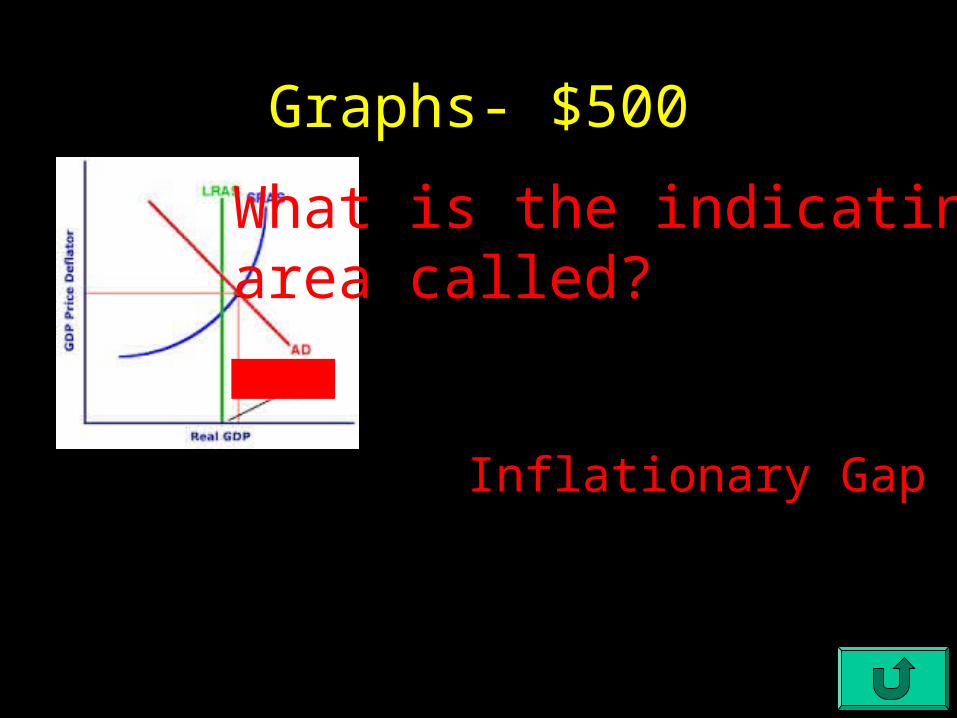
Graphs- $500
What is the indicating area called?
Inflationary Gap