BEFORE THE STATE WATER RESOURCES CONTROL BOARD · BEFORE THE STATE WATER RESOURCES CONTROL BOARD...
28
1 2 3 4 5 6 7 8 9 10 11 12 13 14 15 16 17 18 19 20 21 22 23 24 25 26 BEFORE THE STATE WATER RESOURCES CONTROL BOARD In the Matter of the State Water Resources ) Control Board (State Water Board) ) Hearing Date: July 23 - 25, 2008 Hearing to Determine whether to Adopt a ) Draft Cease & Desist Order against ) California American Water Regarding its ) Carmel River in Monterey County Diversion of Water from the Carmel River ) in Monterey County under Order WR 95-10 ) ____________________________________) EXHIBIT MPWMD-TC16 MONTEREY PENINSULA WATER MANAGEMENT DISTRICT
Transcript of BEFORE THE STATE WATER RESOURCES CONTROL BOARD · BEFORE THE STATE WATER RESOURCES CONTROL BOARD...
1
2
3
4
5
6
7
8
9
10
11
12
13
14
15
16
17
18
19
20
21
22
23
24
25
26
BEFORE THE STATE WATER RESOURCES CONTROL BOARD
In the Matter of the State Water Resources ) Control Board (State Water Board) ) Hearing Date: July 23 - 25, 2008 Hearing to Determine whether to Adopt a ) Draft Cease & Desist Order against ) California American Water Regarding its ) Carmel River in Monterey County Diversion of Water from the Carmel River ) in Monterey County under Order WR 95-10 ) ____________________________________)
EXHIBIT MPWMD-TC16
MONTEREY PENINSULA WATER MANAGEMENT DISTRICT
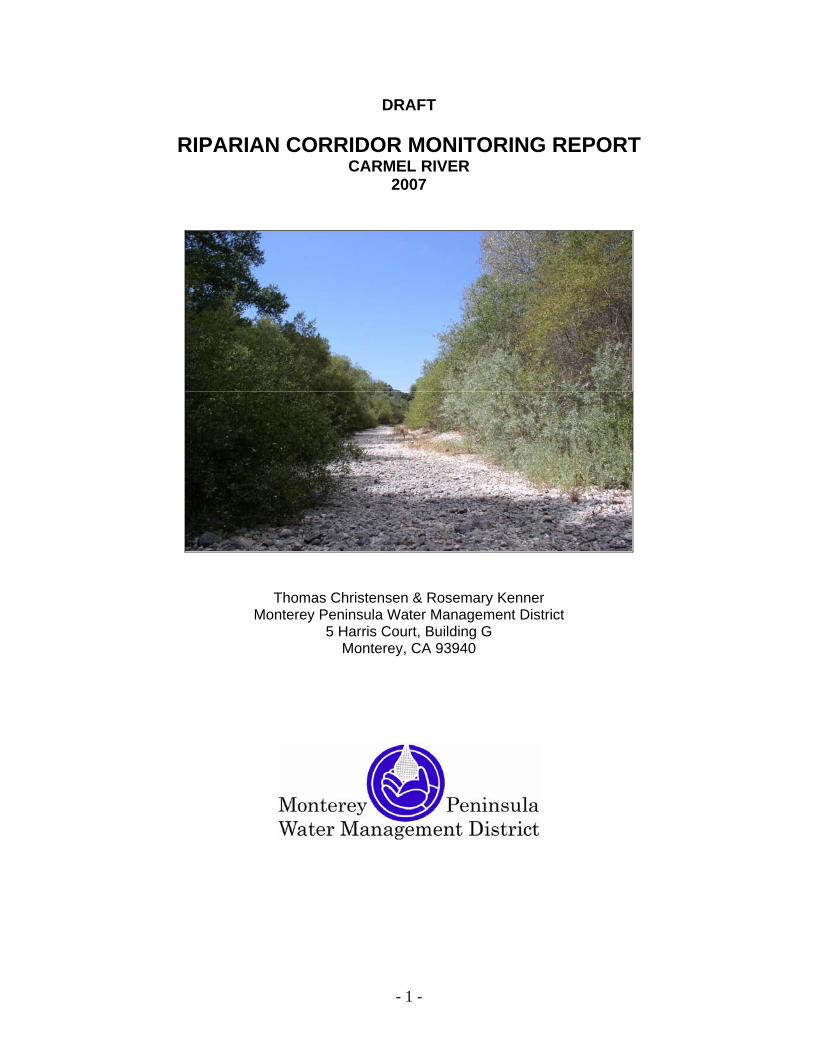
DRAFT
RIPARIAN CORRIDOR MONITORING REPORT CARMEL RIVER
2007
Thomas Christensen & Rosemary Kenner Monterey Peninsula Water Management District
5 Harris Court, Building G Monterey, CA 93940
- 1 -
TABLE OF CONTENTS
I. INTRODUCTION.............................................................................................................................................. - 3 -
II. SITE DESCRIPTIONS .................................................................................................................................... - 4 - Figure 1. The four vegetation monitoring sites and the Carmel River watershed ....................................... - 5 -
III. METHODS ....................................................................................................................................................... - 7 -
DATA COLLECTION METHODS...................................................................................................................... - 7 - CANOPY RATING ................................................................................................................................................. - 7 - GROUNDWATER MONITORING ........................................................................................................................... - 8 - SOIL MOISTURE MEASUREMENT ....................................................................................................................... - 8 -
Figure 2:Tensiometer Diagram ..................................................................................................................... - 8 - Table 2. Attributes of the Carmel River Alluvial Aquifer Monitoring Wells Selected for Study ................. - 9 -
DATA ANALYSIS METHODS .......................................................................................................................... - 10 -
IV. RESULTS ....................................................................................................................................................... - 10 -
RANCHO CAÑADA ............................................................................................................................................ - 10 -
SAN CARLOS ...................................................................................................................................................... - 12 -
VALLEY HILLS .................................................................................................................................................. - 12 - Figure 5: Average Daily Canopy Rating for cottonwood and willow at Valley Hills vs. depth-to- groundwater level at Williams South monitoring well................................................................................ - 12 -
SCHULTE ................................................................................................................................................................ - 13 - Figure 6: Average Daily Canopy Rating for Cottonwood and Willow at Schulte vs. depth-to- groundwater levels at Reimers monitoring well. ............................................................................................................... - 13 -
SOIL MOISTURE................................................................................................................................................ - 13 -
SAN CARLOS ...................................................................................................................................................... - 13 - Figure 7: San Carlos toe and terrace tensiometer soil moisture values vs. depth-to-groundwater at San Carlos monitoring well................................................................................................................................. - 14 -
VALLEY HILLS .................................................................................................................................................. - 14 - Figure 8: Valley Hills toe and terrace tensiometer soil moisture values vs. depth-to-groundwater at Williams South monitoring well. ................................................................................................................. - 15 -
SCHULTE............................................................................................................................................................. - 15 - Figure 9: Schulte toe and terrace tensiometer soil moisture values vs. depth-to-groundwater at Reimers monitoring well............................................................................................................................................. - 16 -
V. DISCUSSION................................................................................................................................................... - 16 -
VI. CONCLUSION............................................................................................................................................... - 18 -
VIII. REFERENCES........................................................................................................................................... - 19 -
APPENDIX A: HISTORICAL DEPTH TO GROUNDWATER FOR SELECTED WELLS ...................... - 21 -
- 2 -

- 3 -
I. INTRODUCTION The mission of the Monterey Peninsula Water Management District (MPWMD) is to manage, augment, and protect water resources for the benefit of the community and the environment. The Monterey Peninsula relies entirely on local water resources, primarily surface and groundwater from the Carmel River, to meet water supply needs.. As an independent Special District, created by an act of the California State legislature in 1977, MPWMD has the power to regulate water production and distribution within its boundaries which include the Monterey Peninsula and much of the Carmel River watershed.
Since the early 1980s, MPWMD has integrated water supply management with an active program to mitigate for the impacts from water extraction including restoration of degraded natural resources in the Carmel River. The 1990 Water Allocation Program Environmental Impact Report (EIR) documented environmental degradation associated with water extraction. In 1995, the State Water Resources Control Board (SWRCB) found that the California-American Water (CAW) had been illegally diverting 10,730 acre-feet per year from the Carmel River and its alluvial aquifer. To help mitigate the degradation of the Carmel River, the MPWMD established mitigation programs in fisheries, riparian restoration, and erosion protection. Historically, water diversion has been one of the primary impacts to the Carmel River.
Over the last century, the Carmel River has undergone a transformation from a wide, meandering, shallow watercourse to a moderately incised channel. Major alterations in the hydrologic regime began in 1921 with the construction of the San Clemente Dam and Reservoir and in 1948 when the Los Padres Dam and Reservoir was built. A combination of floodplain development, trapping of sediment load behind the dams, and gravel mining in the channel bottom downstream of the dams, has led to channel incision. As the Carmel River transformed into a moderately incised channel, the population continued to grow on the Monterey Peninsula.
Increased community development and a severe two-year drought (1976-1977) put an enormous amount of pressure on the limited water resources. Groundwater levels declined to unprecedented lows causing widespread mortality to riparian vegetation. El Nino events between 1978 and 1983 created high flows which destabilized the alluvial portion of the denuded riparian bank. The degradation of the river corridor and decline of the wildlife habitat galvanized efforts within the community to find solutions to the environmental problems. In 1983, after 83 percent of riverfront property owners approved a benefit assessment zone along the river to help fund projects, MPWMD began a restoration program.
Healthy riparian corridors are an essential part of a river’s overall health. Riparian corridors provide erosion control, shade; improve water quality and habitat for aquatic and terrestrial species. Species that benefit from a healthy riparian corridor include the California red-legged frog (Rana aurora draytonii) and steelhead trout (Oncorhynchus mykiss) which are both listed as threatened under the Federal Endangered Species Act in the Carmel River watershed. The riparian corridor along the Carmel River primarily consists of willow (Salix ssp.), cottonwood (Populus ssp.), white alder (Alnus ssp.), and sycamore (Plantanus ssp.).
In studies contracted by the MPWMD a close connection has been demonstrated between groundwater pumping and the health of the riparian vegetation and increased channel instability

- 4 -
(McNeish 1986, ’88, ’99, ‘91a, ‘91b). It was determined that plant stress was directly related to soil water availability and depth to groundwater and that mitigation was necessary in the form of irrigation if all four of the following criteria were met (McNeish, 1986).
1. Dry river channel
2. Drop in the water table by greater than 2feet/ week or seasonally 8 feet or more
below the elevation of the river channel
3. Unacceptable soil moisture levels
4. Unacceptable vegetation stress
To determine these conditions MPWMD developed a monitoring system to measure plant stress, soil moisture, and depth to groundwater. When necessary, supplemental irrigation is applied to help mitigate the effects of unacceptable vegetation stress. This report summarizes the 2007 monitoring methods and results.
II. SITE DESCRIPTIONS The 36-mile-long Carmel River drains 255 square miles of the central coast of California. The watershed includes the Santa Lucia Mountains to the south and the Sierra del Salinas Range to the north. Bedrock in the basin consists mainly of Sur Series crystalline rock (granite, gneiss, schist), Monterey Shale and sandstone (Page and Matthews, 1984). Upper reaches on the Carmel River flow through steep-sided canyons, while the lower 16 miles is a relatively flat alluvial valley to the ocean. Mean annual rainfall varies from approximately 14 inches along the northeast perimeter of the basin to over 40 inches in the high peaks (up to approximately 5,000 feet in elevation) of the southern portion (James, 1999). The total rainfall for 2007 was 11.81 inches (CAW, 2007). The average annual runoff at the San Clemente Dam site is 69,000 acre-feet (James, 2003). The bankfull flow near the mouth of the river is 2,200 cubic feet per second (cfs). The largest flow event recorded on the Carmel River occurred on March 10, 1995, where the river discharge peaked at 16,000 cfs.
In order to accurately assess vegetation stress throughout the flat alluvial valley, MPWMD designated four vegetation monitoring sites. These sites are: Rancho Cañada, San Carlos, Valley Hills, and Schulte. Rancho Cañada and San Carlos are located in the lower portion of the alluvial valley and Valley Hills and Schulte are located in the mid portion of the alluvial valley (Fig. 1). All sites are within proximity to a CAW production well.
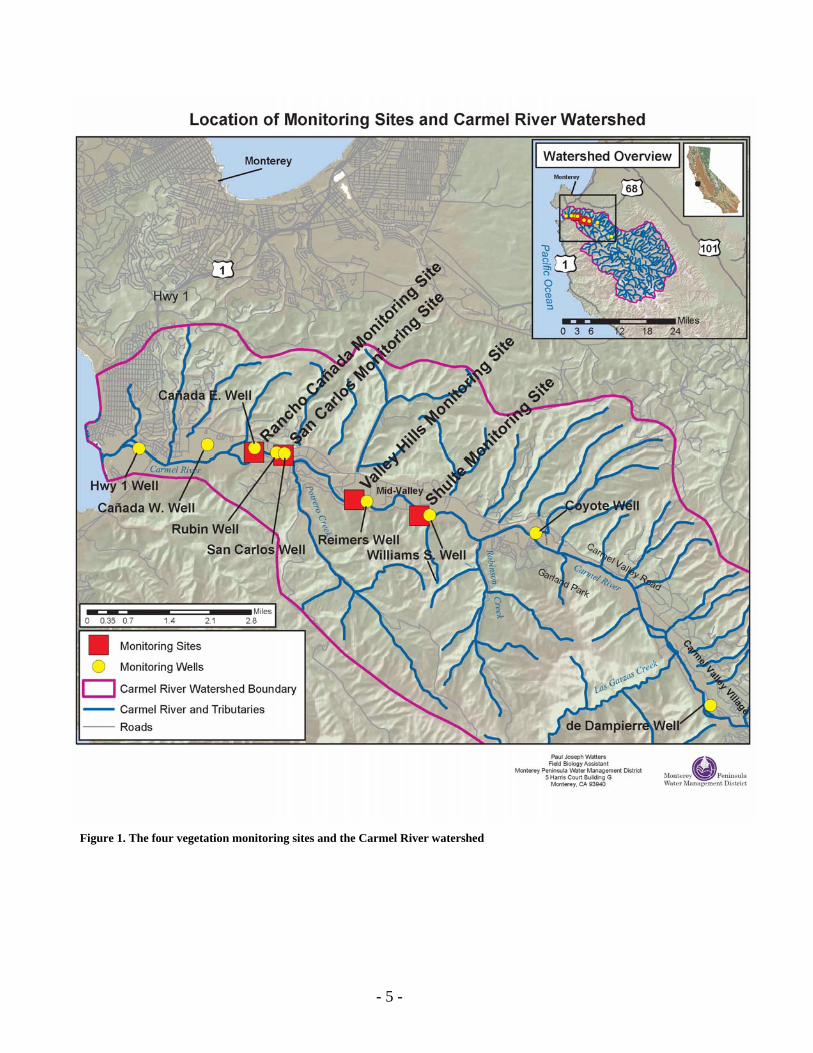
Figure 1. The four vegetation monitoring sites and the Carmel River watershed
- 5 -

The Rancho Cañada monitoring site is located 3.24 miles upstream of the Carmel River mouth in the vicinity of CAW’s Cañada production well. This well has the capacity to pump up to 5 cubic feet/second and can negatively effect riparian vegetation. The north bank is comprised of relatively young riparian vegetation that is part of restoration efforts by the Rancho Cañada Golf course. Thus, the vegetation on the north bank is watered by irrigation run-off from the adjacent golf course. The south bank is a more mature stand of willows and cottonwoods and is watered by an irrigation system operated by the Hacienda Carmel Community Association.
The San Carlos monitoring site is located 3.60 miles upstream of the Carmel River mouth. This site encompasses one of the largest mature riparian areas remaining in the lower Carmel Valley. It consists of a high terrace with large black cottonwoods and relatively steep banks consisting mostly of red and arroyo willows. In July of this year the San Carlos production well, which is capable of pumping 2.24 cubic feet/second went into production. Previously, this well has not been in operation since 2002 when the Monterey County Environmental Health Department determined it to be under the influence of surface water.
The Valley Hills monitoring site is located 5.60 miles upstream of the Carmel River mouth. This restoration site, installed in 1992, is 1,500 linear feet along the river channel and is located adjacent to agricultural lands. The Cypress production well is adjacent to the site with a pumping capacity of 3.03 cubic feet/second.
The Schulte river monitoring site is located 6.70 miles upstream of the Carmel River mouth. This restoration project was completed in January of 1988 and consisted of 3,200 lineal feet of channel realignment and floodplain modification. The Schulte production well is adjacent to the monitoring site with a pumping capacity of 1.24 cubic feet/second.
- 6 -
III. METHODS The 2007 Riparian Vegetation Monitoring Program (RVMP) includes updated data collection and analysis methods. In previous years, the riparian vegetation monitoring program consisted of taking pre-dawn moisture stress samples, depth-to-groundwater and soil moisture measurements every two weeks from monitoring sites (MPWMD Riparian Corridor Monitoring Report, 2004). This year’s program methods were changed to assigning a canopy rating, depth-to-groundwater and soil moisture measurements. In addition, photos were taken of monitoring trees and river corridor to document vegetation canopy cover change over time. All sites were monitored weekly from May through October. Similar to previous monitoring years, there were trees that were being irrigated and trees that were not being irrigated (‘control trees’). Canopy Rating
Canopy Rating (CR) methods have been used by MPWMD to assess vegetation health since the 1980s. The canopy rating that was used for the 2007 RVMP (Tbl.1) was based on MPWMD historic canopy rating scales. However, additional ‘rates’ were added to better assess vegetation conditions. Willow (Salix spp.) and cottonwood (Populus spp.) trees were randomly selected from monitoring trees analyzed in previous MPWMD vegetation monitoring programs. Randomly selected monitoring trees at Rancho Cañada consisted of two cottonwoods (C2, C3) and three willows (W2, W3, W07; W07 willow was added because W2 appeared sickly at beginning of the monitoring season). The trees monitored at San Carlos consisted of two cottonwoods (C3, C5) and two willows (W98, W99). The trees monitored at Valley Hills consisted of two cottonwoods (C96, C03) and two willows (W00, W99B). The trees monitored at Schulte consisted of three cottonwoods (W2, W3, W4; Schulte has 6 monitoring trees becausto select from). All trees were labeled to be easily idetrees’ canopy was evaluated based on the canopy ratiphotograph was taken to document the monitoring tr In order to show the effects of irrigation on the treeseach of cottonwood and willow, at both the Valley Hand monitored for plant moisture stress.
- 7 -
Table 1: MPWMD Canopy Rating Scale for the 2007 RVMP
(C1, C2, C4) and three willows e there was a larger group of trees ntified. Each week the monitoring ng table and assigned a rating. A ees’ canopy.
1 Green, obviously vigorous2 Some visisble yellowing3 Leaves mostly yellowing4 < 10% Defoliated5 Defoliated 10% to 30%6 Defoliated 30% to 50%7 Defoliated 50% to 70%8 Defoliated 70% to 90%9 > 90% Defoliated
10 Dormant11 Dead
Canopy Rating Scale
, two ‘control’ monitoring trees, one ills and Schulte sites, were irrigated
- 8 -
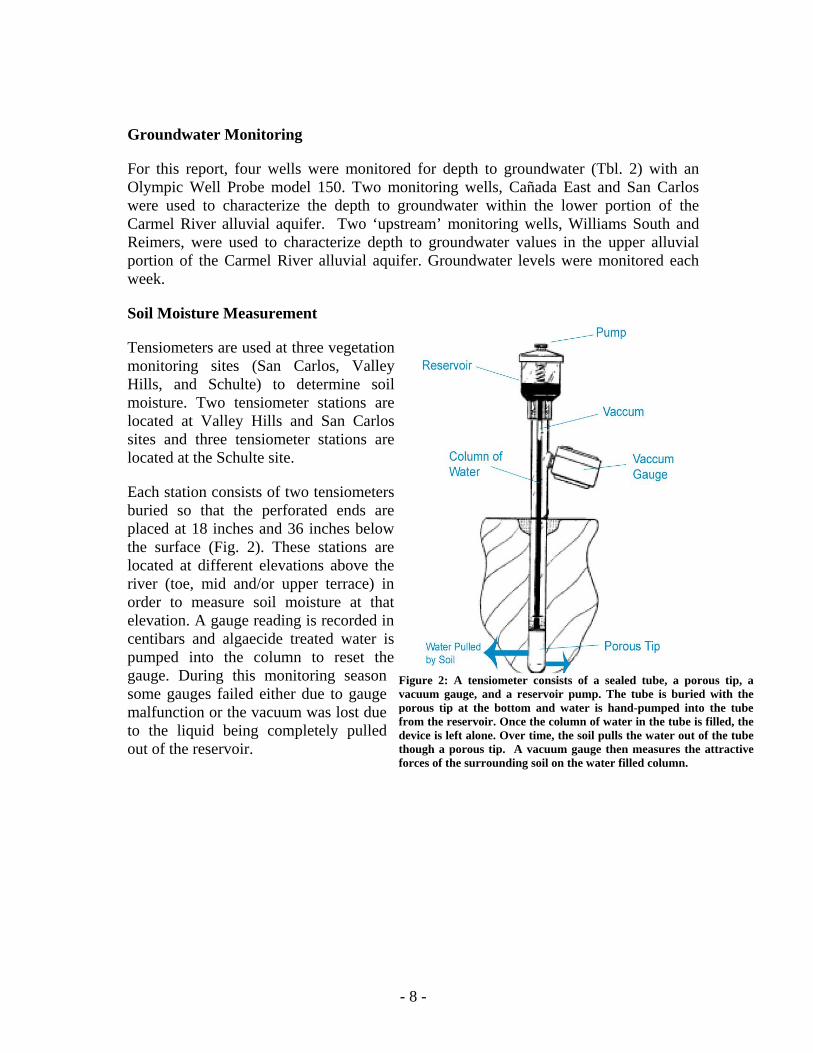
Each station consists of two tensiometers buried so that the perforated ends are placed at 18 inches and 36 inches below the surface (Fig. 2). These stations are located at different elevations above the river (toe, mid and/or upper terrace) in order to measure soil moisture at that elevation. A gauge reading is recorded in centibars and algaecide treated water is pumped into the column to reset the gauge. During this monitoring season some gauges failed either due to gauge malfunction or the vacuum was lost due to the liquid being completely pulled out of the reservoir.
Tensiometers are used at three vegetation monitoring sites (San Carlos, Valley Hills, and Schulte) to determine soil moisture. Two tensiometer stations are located at Valley Hills and San Carlos sites and three tensiometer stations are located at the Schulte site.
Soil Moisture Measurement
For this report, four wells were monitored for depth to groundwater (Tbl. 2) with an Olympic Well Probe model 150. Two monitoring wells, Cañada East and San Carlos were used to characterize the depth to groundwater within the lower portion of the Carmel River alluvial aquifer. Two ‘upstream’ monitoring wells, Williams South and Reimers, were used to characterize depth to groundwater values in the upper alluvial portion of the Carmel River alluvial aquifer. Groundwater levels were monitored each week.
Groundwater Monitoring
Figure 2: A tensiometer consists of a sealed tube, a porous tip, a vacuum gauge, and a reservoir pump. The tube is buried with the porous tip at the bottom and water is hand-pumped into the tube from the reservoir. Once the column of water in the tube is filled, the device is left alone. Over time, the soil pulls the water out of the tube though a porous tip. A vacuum gauge then measures the attractive forces of the surrounding soil on the water filled column.

Name Used1 Other Common Name Year Drilled
State Well No. River Mile2
Distance from River
(feet)
Well Depth (feet)
Screened Interval
(feet)
Reference Point Elevation
(feet AMSL)3
Date of Maximum Depth to
Groundwater Measured
Maximum Measured Depth to Groundwater 2004
(feet) Cañada East Rancho Cañada North Deep 1978 T16S/R1E-17Lb 3.13 360 100 60-80 49.69 (s) 10/22/04 43.80San Carlos San Carlos Deep (#2) 1983 T16S/R1E-17Jc 3.65 170 68 48-68 51.32 (s) 10/25/07 33.51Williams South Williams Monitor 1984 T16S/R1E-22Fc 5.57 90 100 5-100 87.08 (s) 10/25/07 60.10Reimers Reimers #1 1988 T16S/R1E-23La 6.72 150 122 50-122 102.10 (s) 10/25/07 29.07
NOTES:1. Name used in this project2. River Mile designations are calculated in distance from the mouth of the Carmel River at Carmel Bay3. (s) = surveyed elevation
Table 2. Attributes of the Carmel River Alluvial Aquifer Monitoring Wells Selected for Monitoring
- 9 -
Data Analysis Methods All data was entered into Microsoft Excel spreadsheets. Average Weekly Canopy Ratings (AWCR) were calculated by summing the canopy rating and dividing by the total number of either cottonwood or willow trees monitored at each site. Monitoring photos were downloaded to the computer, named, and placed into an appropriate folder. All photo names contained the site name, tree number and date. No calculations were applied to depth-to-groundwater data. Tensiometer data was converted from centibars to bars by dividing centibars by 100. All data was graphed.
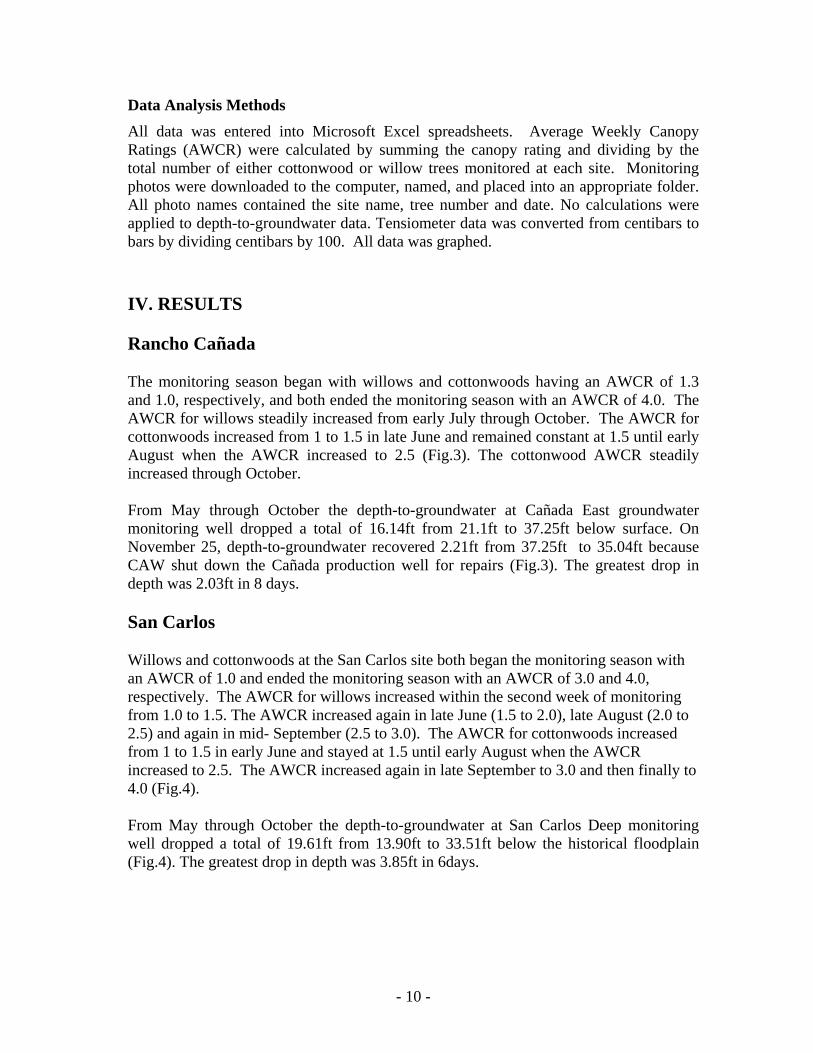
IV. RESULTS Rancho Cañada The monitoring season began with willows and cottonwoods having an AWCR of 1.3 and 1.0, respectively, and both ended the monitoring season with an AWCR of 4.0. The AWCR for willows steadily increased from early July through October. The AWCR for cottonwoods increased from 1 to 1.5 in late June and remained constant at 1.5 until early August when the AWCR increased to 2.5 (Fig.3). The cottonwood AWCR steadily increased through October. From May through October the depth-to-groundwater at Cañada East groundwater monitoring well dropped a total of 16.14ft from 21.1ft to 37.25ft below surface. On November 25, depth-to-groundwater recovered 2.21ft from 37.25ft to 35.04ft because CAW shut down the Cañada production well for repairs (Fig.3). The greatest drop in depth was 2.03ft in 8 days. San Carlos Willows and cottonwoods at the San Carlos site both began the monitoring season with an AWCR of 1.0 and ended the monitoring season with an AWCR of 3.0 and 4.0, respectively. The AWCR for willows increased within the second week of monitoring from 1.0 to 1.5. The AWCR increased again in late June (1.5 to 2.0), late August (2.0 to 2.5) and again in mid- September (2.5 to 3.0). The AWCR for cottonwoods increased from 1 to 1.5 in early June and stayed at 1.5 until early August when the AWCR increased to 2.5. The AWCR increased again in late September to 3.0 and then finally to 4.0 (Fig.4). From May through October the depth-to-groundwater at San Carlos Deep monitoring well dropped a total of 19.61ft from 13.90ft to 33.51ft below the historical floodplain (Fig.4). The greatest drop in depth was 3.85ft in 6days.
- 10 -
0
0.5
1
1.5
2
2.5
3
3.5
4
4.5
04/28/07 05/18/07 06/07/07 06/27/07 07/17/07 08/06/07 08/26/07 09/15/07 10/05/07 10/25/07 11/14/07
Date
Ave
rage
Can
opy
Rat
ing
0.00
5.00
10.00
15.00
20.00
25.00
30.00
35.00
40.00
45.00
Dep
th-to
-Gro
undw
ater
(ft)
Cottonwood Willow Groundwater level Figure 3: Average Weekly Canopy Rating for cottonwoods and willows at Cañada vs. depth-to-groundwater at the Cañada East monitoring well.
0
0.5
1
1.5
2
2.5
3
3.5
4
4.5
04/28/07 05/18/07 06/07/07 06/27/07 07/17/07 08/06/07 08/26/07 09/15/07 10/05/07 10/25/07 11/14/07Date
Ave
rage
Can
opy
Rat
ing
0.00
5.00
10.00
15.00
20.00
25.00
30.00
35.00
40.00
Dep
th-to
-Gro
undw
ater
(ft)
Cottonwood Willow Groundwater level
Figure 4: Average Weekly Canopy Rating for cottonwoods and willows at San Carlos vs. depth-to-groundwater at the San Carlos monitoring well.
- 11 -

Valley Hills Monitored willows and cottonwoods both began the monitoring season with an AWCR of 1.0 and ended the monitoring season with an AWCR of 7.5 and 3.5, respectively. The AWCR for willows may be skewed due to an early dormancy or death of willow 00. The AWCR for willow 00 was 7.0 compared to an AWCR of 2.75 for Willow 99B. The AWCR for willows increased in late May from 1.0 to 2.0 and steadily increased until late June when the AWCR plateaued at 5.0. The AWCR increased again in late July to 5.5 and then again in early September to 7.0 and finally to 7.5 in October. The AWCR for cottonwoods increased from 1 to 1.5 in early June and stayed at 1.5 until early August when the AWCR increased to 2.0. By August AWCR for cottonwoods increased to 3.5 (Fig.5). The depth-to-groundwater at Williams South monitoring well dropped a total of 32.83ft from 27.27ft to 60.10ft below surface May through October (Fig.5). The greatest drop in depth was 2.34ft in 7days.
0
1
2
3
4
5
6
7
8
04/28/07 05/18/07 06/07/07 06/27/07 07/17/07 08/06/07 08/26/07 09/15/07 10/05/07 10/25/07 11/14/07
Date
Ave
rage
Can
opy
Rat
ing
0.00
10.00
20.00
30.00
40.00
50.00
60.00
70.00
Dep
th-to
-Gro
undw
ater
(ft)
Cottonwood Willow Groundwater Level
Figure 5: Average Weekly Canopy Rating for cottonwoods and willows at Valley Hills vs. depth-to- groundwater at the Williams South monitoring well.
- 12 -

Schulte Monitored willows and cottonwoods both began the monitoring season with an AWCR of 1.3, and ended the monitoring season with an AWCR of 5.6 and 5.0 respectively. The AWCR for willows increased mid May from 1.3 to 1.7 and increased from 1.7 to 4.3 through June. The AWCR for willows increased again in mid-July to 5.0 and steadily climbed to an AWCR peak of 5.7. The AWCR for cottonwoods increased from 1.3 to 2.0 through June and stayed at 2.0 until early August when the AWCR began to increase to a peak of 5.0 in October (Fig.6). May through October the depth-to-groundwater at Reimers monitoring well dropped a total of 10.38ft from 18.69ft to 29.07ft below surface (Fig.6). The greatest drop in depth was 1.07ft in 10days.
0.0
1.0
2.0
3.0
4.0
5.0
6.0
04/28/07 05/18/07 06/07/07 06/27/07 07/17/07 08/06/07 08/26/07 09/15/07 10/05/07 10/25/07 11/14/07
Date
Ave
rage
Can
opy
Rat
ing
0.00
5.00
10.00
15.00
20.00
25.00
30.00
35.00
Dep
th-to
-Gro
undw
ater
(ft)
Cottonwood Willow Groundwater Level
Figure 6: Average Weekly Canopy Rating for cottonwoods and willows at Schulte vs. depth-to- groundwater at the Reimers monitoring well. Soil Moisture San Carlos
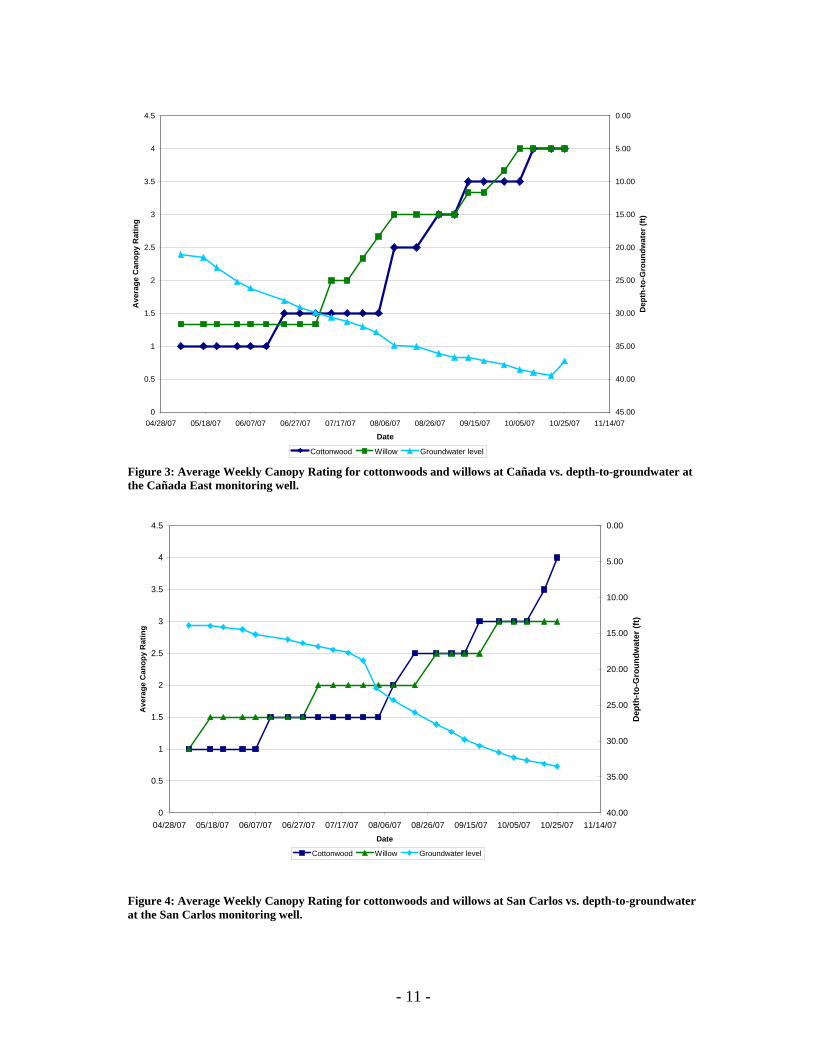
Tensiometer values at the toe (close to river channel bottom) began at approximately 0.10 bars (18'') and 0.14 bars (36'') in early May and rose steeply to 0.72 bars and 0.66
- 13 -
bars, respectively, by early July (Fig.7). Tensiometer values at the terrace (above river channel) began at approximately 0.34 bars (18'') and 0.14 bars (36'') in early May. In August the terrace 18'' tensiometer was no longer functional. The terrace 36'' tensiometer increased over the monitoring season to 0.78 bars.
At San Carlos, there is a good relationship between depth-to-groundwater and an increase in tensiometer values. Based on the data this relationship is apparent in August when all properly functioning tensiometers were between 0.70 and 0.80 centibars and the depth-to-groundwater had dropped 12.12ft to 26.02ft.
0.00
0.10
0.20
0.30
0.40
0.50
0.60
0.70
0.80
0.90
5/7/
2007
5/14
/200
7
5/21
/200
7
5/28
/200
7
6/4/
2007
6/11
/200
7
6/18
/200
7
6/25
/200
7
7/2/
2007
7/9/
2007
7/16
/200
7
7/23
/200
7
7/30
/200
7
8/6/
2007
8/13
/200
7
8/20
/200
7
8/27
/200
7
9/3/
2007
9/10
/200
7
9/17
/200
7
9/24
/200
7
10/1
/200
7
10/8
/200
7
10/1
5/20
07
10/2
2/20
07
Date
Tens
ion
(bar
s)
0.00
5.00
10.00
15.00
20.00
25.00
30.00
35.00
40.00
Dep
th-to
-Gro
undw
ater
(ft)
San Carlos Terrace 18" San Carlos Terrace 36" San Carlos Toe 18" San Carlos Toe 36" Depth-to-Groundwater
Figure 7: San Carlos toe and terrace tensiometer soil moisture values vs. depth-to-groundwater at San Carlos monitoring well. Valley Hills Tensiometer values at the toe (close to river channel bottom) began at approximately 0.20 bars (18'') and 0.34 bars (36'') in early May. The toe 18'' tensiometer peaked at 0.40 bars and ended the season at 0.18 bars. The toe 36'' tensiometer peaked at 0.50 bars and ended the season at 0.24 bars. Tensiometer values at the terrace (above river channel) began at approximately 0.12 bars (18'') and 0.29 bars (36'') in early May. The terrace18'' tensiometer peaked at 0.89 bars and ended the season at 0.08 bars. The terrace 36'' tensiometer peaked at 0.52 bars and ended the season at 0.00 bars (gauge may have been broken; Fig. 8).
- 14 -

At the Valley Hills site conditions were dry and tensiometers often failed (vacuum tension broken and guage goes to 0 bars). This made it problematic so see the relationship between soil moisture and depth to groundwater. What we do know from the data is that soil conditions became very dry around mid June.
0.00
0.10
0.20
0.30
0.40
0.50
0.60
0.70
0.80
0.90
1.00
5/7/20
07
5/14/2
007
5/21/2
007
5/28/2
007
6/4/20
07
6/11/2
007
6/18/2
007
6/25/2
007
7/2/20
07
7/9/20
07
7/16/2
007
7/23/2
007
7/30/
Tens
ion
(bar
s)
2007
8/6/20
07
8/13/2
007
8/20/2
007
8/27/2
007
9/3/20
07
9/10/2
007
9/17/2
007
9/24/2
007
10/1/
2007
10/8/
2007
10/15
/2007
10/22
/2007
Date
0.00
10.00
20.00
30.00
40.00
50.00
60.00
70.00
Dep
th-to
-Gro
undw
ater
(ft)
Valley Hills Toe 18" Valley Hills Toe 36" Valley Hills Terrace 18" Valley Hills Terrace 36" Depth-to-Groundwater
Figure 8: Valley Hills toe and terrace tensiometer soil moisture values vs. depth-to-groundwater at Williams South monitoring well. Schulte Tensiometer values at the toe (close to river channel bottom) began at approximately 0.59 bars (18'') and 0.35 bars (36'') in early May. The toe 18'' tensiometer peaked at 0.77 bars and ended the season at 0.70 bars. The toe 36'' tensiometer peaked at 0.58 bars and ended the season at 0.48 bars. Tensiometer values at the middle terrace (above river channel) began at approximately 0.06 bars (18'') and 0.08 bars (36'') in early May. The mid-terrace 18'' tensiometer peaked at 0.87 bars and ended the season at 0.64 bars. The mid-terrace 36'' tensiometer peaked at 0.74 bars and ended the season at 0.74 bars (Fig.9). Tensiometer values at the upper terrace (above river channel) began at approximately 0.24 bars (18'') and 0.04 bars (36'') in early May. The upper terrace 18'' tensiometer peaked at 0.88 bars and ended the season at 0.68 bars. The upper terrace 36'' tensiometer peaked at 0.68 bars and ended the season at 0.00 bars (gauge may have been broken).
- 15 -
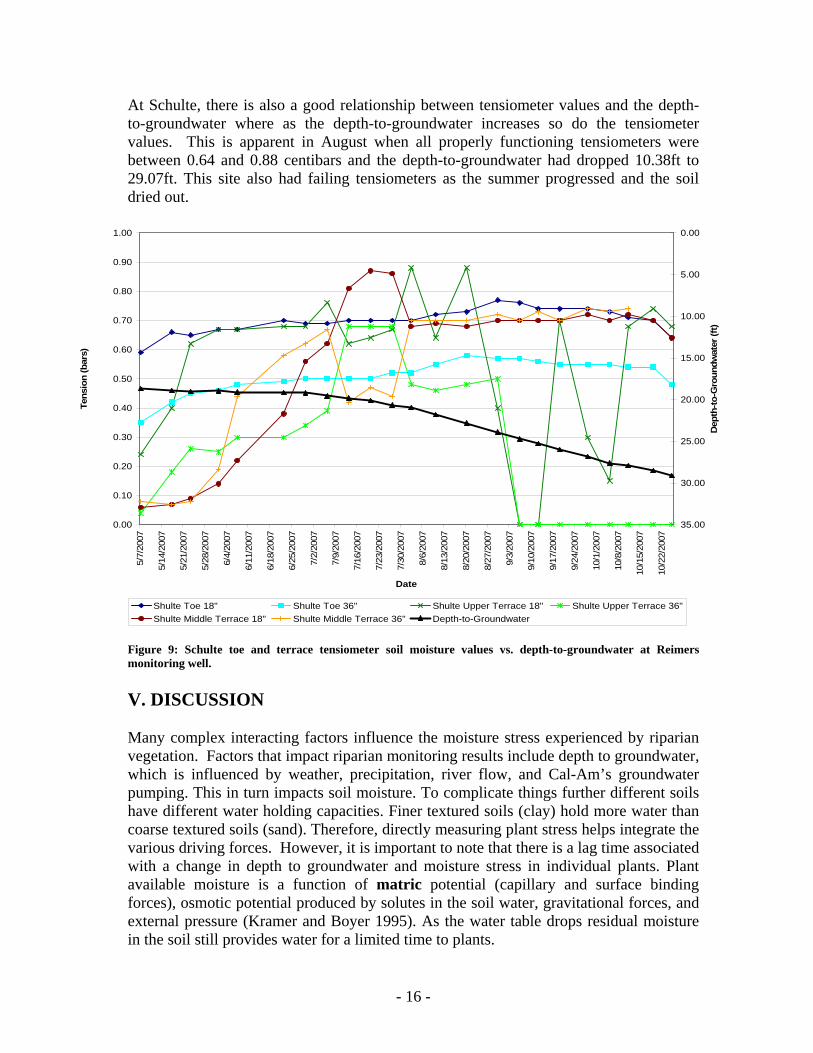
At Schulte, there is also a good relationship between tensiometer values and the depth-to-groundwater where as the depth-to-groundwater increases so do the tensiometer values. This is apparent in August when all properly functioning tensiometers were between 0.64 and 0.88 centibars and the depth-to-groundwater had dropped 10.38ft to 29.07ft. This site also had failing tensiometers as the summer progressed and the soil dried out.
0.00
0.10
0.20
0.30
0.40
0.50
0.60
0.70
0.80
0.90
1.00
5/7/
2007
5/14
/200
7
5/21
/200
7
5/28
/200
7
6/4/
2007
6/11
/200
7
6/18
/200
7
6/25
/200
7
7/2/
2007
7/9/
2007
7/16
/200
7
7/23
/200
7
7/30
/200
7
8/6/
2007
8/13
/200
7
8/20
/200
7
8/27
/200
7
9/3/
2007
9/10
/200
7
9/17
/200
7
9/24
/200
7
10/1
/200
7
10/8
/200
7
10/1
5/20
07
10/2
2/20
07
Date
Tens
ion
(bar
s)
0.00
5.00
10.00
15.00
20.00
25.00
30.00
35.00
Dep
th-to
-Gro
undw
ater
(ft)
Shulte Toe 18" Shulte Toe 36" Shulte Upper Terrace 18" Shulte Upper Terrace 36"Shulte Middle Terrace 18" Shulte Middle Terrace 36" Depth-to-Groundwater
Figure 9: Schulte toe and terrace tensiometer soil moisture values vs. depth-to-groundwater at Reimers monitoring well. V. DISCUSSION Many complex interacting factors influence the moisture stress experienced by riparian vegetation. Factors that impact riparian monitoring results include depth to groundwater, which is influenced by weather, precipitation, river flow, and Cal-Am’s groundwater pumping. This in turn impacts soil moisture. To complicate things further different soils have different water holding capacities. Finer textured soils (clay) hold more water than coarse textured soils (sand). Therefore, directly measuring plant stress helps integrate the various driving forces. However, it is important to note that there is a lag time associated with a change in depth to groundwater and moisture stress in individual plants. Plant available moisture is a function of matric potential (capillary and surface binding forces), osmotic potential produced by solutes in the soil water, gravitational forces, and external pressure (Kramer and Boyer 1995). As the water table drops residual moisture in the soil still provides water for a limited time to plants.
- 16 -
All of Cal-Am’s on line production wells in Carmel Valley impact overall flow in the Carmel River. However, the most notable impacts to riparian vegetation occur between Cal- Am’s four well system (Canada, San Carlos, Cypress, and Pearce). The results show that riparian vegetation experiences an increase in moisture stress in relation to a reduction in stream flow and a drop in the water table elevation. Initial studies on the Carmel River done by McNeish state that severe water stress is defined by a draw down rate of two or more feet per seven days; mild water stress is defined by a draw down rate of one to two feet per seven days or a total draw down of eight feet below the elevation of the adjacent river channel; and no effect is defined as draw down of less than one foot per week throughout summer and autumn and a total draw down of less than four feet below the adjacent river channel (McNeish, 1986). Draw down on the Carmel River peaked at San Carlos with a 3.85 ft draw down for a one week period starting July 27, 2007. Other studies show that on coarse substrates in dry regions, early establishment and growth of Populus spp. seedlings may require water tables within 3.3-6.6 feet of the established surface (McBride and Strahan 1984, Mahoney and Rood 1992, Seqelquist and others 1993, Stromberg and others 1996). Root growth of established trees allow survival during gradual water table decline. Mature trees are more suited to withstand channel incision and flood plain isolation (Everitt 1968, Hereford 1986). Cottonwoods typically grow where the depth to the water table is 11.5 feet (Busch and others 1992, Scott and others 1997, Stromberg and others 1997), although cottonwoods have been observed to exist in areas where the water table is 23 to 29.5 feet deep (Robinson 1958). Mature black cottonwoods were also found 33.5 feet above the water table on a historic floodplain in the San Carlos area. These values appear to be close to the limit of what black cottonwoods on the Carmel River can withstand. Mortality may have been avoided simply because these are mature black cottonwoods, with extensive root structures, growing in a soil with higher organic content than some of the sandy areas with riparian vegetation. Fine textured soils have a greater holding capacity for moisture and buffer some groundwater-dependent plants against rapid water table declines (Sorenson and others 1991). The higher organic content in the San Carlos soil would enable a greater degree of water retention and capillary rise from the root zone toward the soil surface. Obtaining an accurate characterization of soil moisture can be difficult in alluvial areas. In the past MPWMD used a neutron probe to test soil moisture in riparian areas. This system was complicated because it depended on radioactive equipment and a special license. Currently MPWMD uses tensiometers and gypsum blocks which include some limitations. One limitation with tensiometers is that they are difficult to install deeper than 3 feet and are designed for homogenous agricultural soils. Working with tensiometers in gravel and sandy areas give a relative indication of soil drying and wetting. The ideal tensiometer range is 0.0 to 0.5 bars with a peak of 0.8 bars. Highly stressed vegetation exceeds the potential of this tool. Laboratory results indicate that the vegetation wilting point is reached at 15 bars and 0.3 bars indicates field capacity or total soil saturation. This range varies according to soil type. (Kramer & Boyer 1995)* As a result this equipment can provide a limited set of information concerning riparian vegetation stress. Ideally soil moisture measuring devices would be installed 5 to 8 feet down where the roots would be interacting with more available moisture.
- 17 -
The canopy rating results provide an overall look at how riparian vegetation responds to greater depth-to-groundwater. The results show that riparian vegetation experiences an increased canopy rating (more defoliation) in relation to a reduction in stream flow and a drop in the water table elevation. From the results it can be concluded that both willows and cottonwoods experience not only increases of AWCR but also plateaus. The results provide evidence that willows, in general, respond to stress before cottonwoods. Willows at Rancho Cañada responded to stress after cottonwoods, however, the majority of willow monitoring trees are located near the Hacienda Carmel Community Association irrigation system. It should also be noted that the canopy was rated based on human judgment and therefore small errors may occur. However, the health of the riparian canopy is a viable indicator of the overall health of the streamside vegetation.
Generally, willows and cottonwoods in the lower river had relatively similar AWCR and followed a similar pattern. In the mid valley reach, the AWCR for willows increased early in the monitoring season and continued to have a greater AWCR than cottonwoods. However, AWCR for willows at Valley Hills was considerably greater due to a dormant or dead tree.
VI. CONCLUSION The health and vigor of riparian vegetation is dependant on the amount of water available. Plant available moisture is dependant on a complex interaction of factors which includes: the total amount of precipitation, CAW pumping regimes and legal/illegal diversions. During the 2007 water year, the total annual rainfall was 11.81 inches at the San Clemente Dam, located mid-watershed. Precipitation for this season was 55 percent of normal (21.40 inches is the average annual rainfall at San Clemente from 1922 to the 2007). Monitoring stream flow, depth to groundwater, soil moisture, and canopy defoliation help determine when supplemental irrigation should be applied to riparian vegetation and provide riparian managers with an effective means to identify vegetation stress. During the 2007 monitoring season an overall trend towards higher stress during the summer was observed. In addition, monitoring results show that pumping does impact depth to groundwater at specific sites thus impacting soil moisture and riparian vegetation.
In 2007 MPWMD irrigated eleven project areas (de Dampierre, Trail and Saddle Club, Scarlett, Begonia, Schulte South, Shulte Bridge, Schulte, All Saints, Valley Hills, San Carlos, and San Carlos at the Dow property) with a total of 11.81 acre-feet of supplemental water to offset stress associated with water diversions from the Carmel River. Mitigation in the form of irrigation can be used to prevent plant mortality along the riparian corridor thus contributing to stable riverbanks and habitat for wildlife.
- 18 -
VIII. REFERENCES
Boyer, J. S. 1995. Measuring the water status of plants and soil. Academic Press, San Diego.
Busch, D. E. and S. D. Bradley. 1995. Mechanisms associated with decline of woody species in riparian ecosystems of the Southwestern U.S. Ecological Monographs 65(3): 347-370.
Christensen, T. 2001. MPWMD Staff Notes.
Everitt, B. L. 1995. Hydrologic factors in regeneration of Fremont cottonwoods along the Fremont River, Utah. Geophysical Monograph 89: 197-208.
James, G. 1999. Carmel River Basin – Surface Water Resources Data Report, Water Years 1996-1999, Monterey Peninsula Water Management District, December 1999.
James, G. 2003. Carmel River Basin – Surface Water Resources Data Report, Water Years 2000-2003, Monterey Peninsula Water Management District, January 2004.
Kramer, P.J. 1995. Water Relations of Plants. Academic Press, New York
Mahoney, J. M. and S. B. Rood. 1992. Response of a hybrid poplar to water table decline in different substrates. Forest Ecology and Management 54: 141-156.
McBride, J. R. and J. Strahan. 1984. Establishment and survival of wood riparian species on gravel bars of an intermittent stream. American Midland Naturalist 112(2):235-245.
McNeish, C.M. 1988. A methodology for predicting riparian vegetation impacts due to pumping the Carmel Valley Aquifer. Unpublished report to the MPWMD.
McNeish, Charles. 1988. The Effects of Groundwater Pumping on Riparian Vegetation: Carmel Valley-Draft, Dec. 1988
McNeish, C.M. 1986. Effects of production well pumping on plant water stress in the riparian corridor of the lower Carmel Valley. Unpublished report to the MPWMD.
MPWMD. 1993. Ten-Year Review Carmel River Management Program, April, 2003.
MPWMD. 1997. California-American Water Company Production Wells and Pumping Capacities. October, 1997 (except San Carlos Well that reflects the 1999 well replacement). Table Compiled.
- 19 -

Page, G. and Matthews, G. 1984. Carmel River Management Plan, Monterey Peninsula Water Management District.
Scott, M. L. 1997. Responses of Riparian cottonwoods to Alluvial Water Table Declines. Environmental Management Vol. 23, No. 3 pp. 347-358.
Scott, M. L., G. T. Abule, and J. M. Friedman. 1997. Flood dependency of cottonwood establishment along the Missouri River, Montana. Ecological Applications 7(2): 677-690.
Stromberg, J. C., Tiller, R., and Richter, B. 1996. Effects of groundwater decline on riparian vegetation of semiarid regions: The San Pedro, Arizona. Ecological Applications 6: 113-131.
Woodhouse, Dr. R. 1983. Baseline analysis of the riparian vegetation in the lower Carmel Valley.
U:\Thomas\wp\fielddatareport\RiparianReport2007.doc
- 20 -

- 21 -
APPENDIX A: Historical Depth to Groundwater for Selected Monitoring Wells

Reimers Monitoring Well Annual Minimum and Maximum Depth to Groundwater (feet)
0
10
20
30
40
50
60
1988
1989
1990
1991
1992
1993
1994
1995
1996
1997
1998
1999
2000
2001
2002
2003
2004
2005
Dep
th to
Gro
undw
ater
(fee
t)
Minimum Depth
Maximum Depth
- 22 -
Year

Cañada East Monitoring Well Annual Minimum and Maximum Depth to Groundwater (feet)
0
10
20
30
40
50
60
70
80
1983
1984
1985
1986
1987
1988
1989
1990
1991
1992
1993
1994
1995
1996
1997
1998
1999
2000
2001
2002
2003
2004
2005
Year
Dep
th to
Gro
undw
ater
(fee
t)
Minimum DepthMaximum Depth
- 23 -
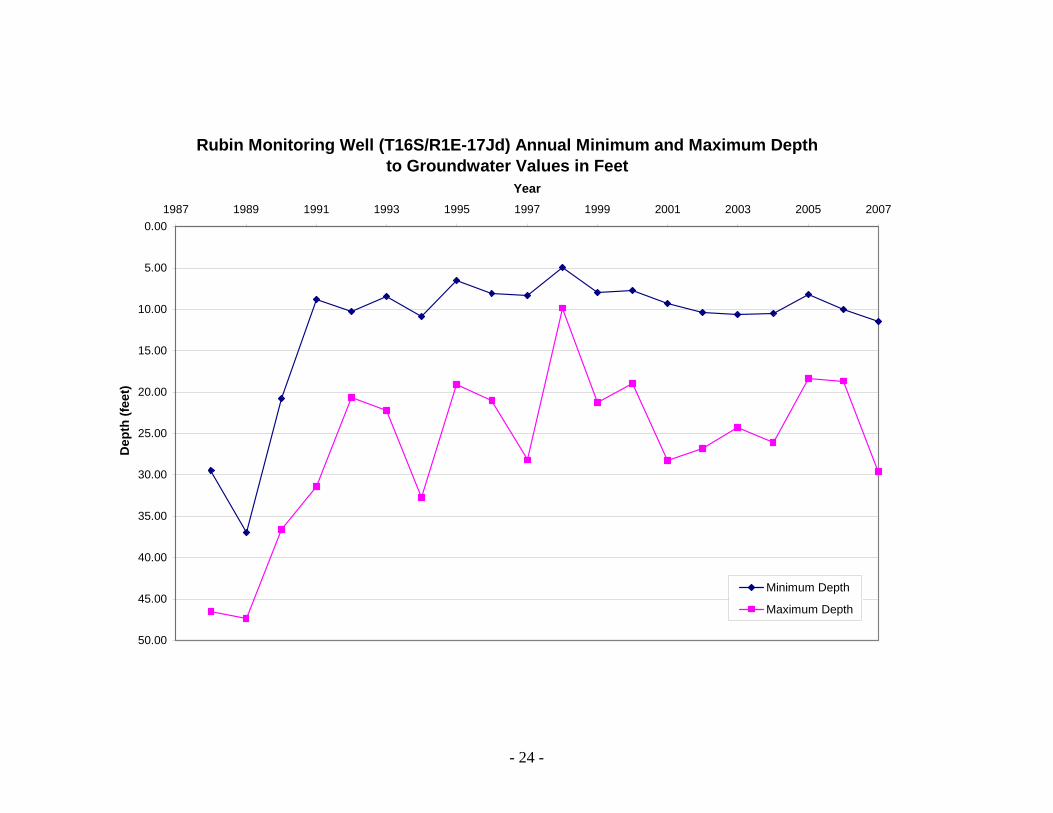
Rubin Monitoring Well (T16S/R1E-17Jd) Annual Minimum and Maximum Depth to Groundwater Values in Feet
0.00
5.00
10.00
15.00
20.00
25.00
30.00
35.00
40.00
45.00
50.00
1987 1989 1991 1993 1995 1997 1999 2001 2003 2005 2007
Year
Dep
th (f
eet)
Minimum Depth
Maximum Depth
- 24 -
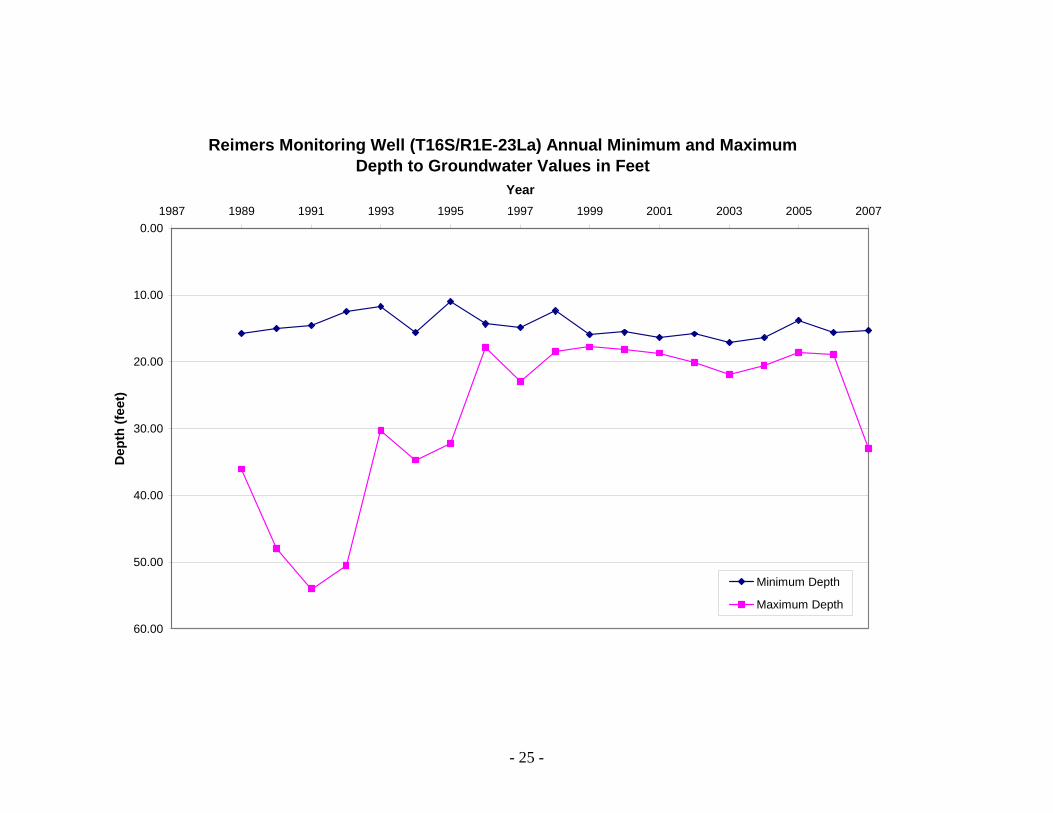
Reimers Monitoring Well (T16S/R1E-23La) Annual Minimum and Maximum Depth to Groundwater Values in Feet
0.00
10.00
20.00
30.00
40.00
50.00
60.00
1987 1989 1991 1993 1995 1997 1999 2001 2003 2005 2007
Year
Dep
th (f
eet)
Minimum Depth
Maximum Depth
- 25 -
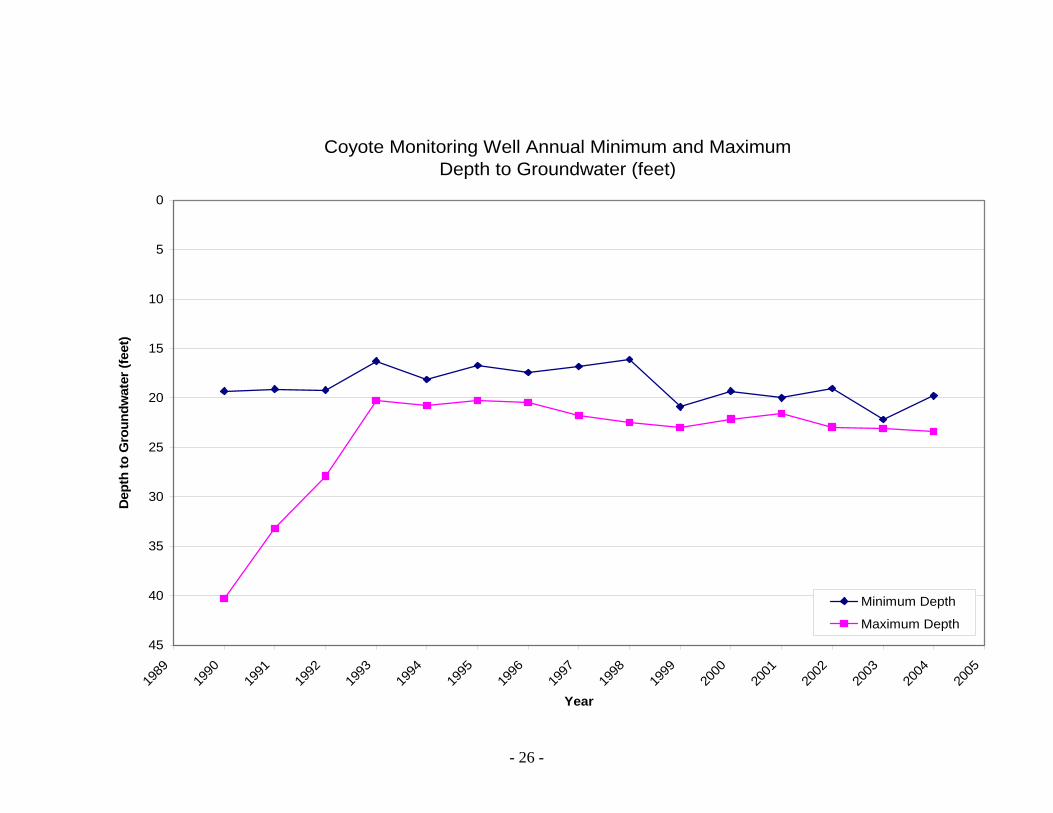
Coyote Monitoring Well Annual Minimum and Maximum Depth to Groundwater (feet)
0
5
10
15
20
25
30
35
40
45
1989
1990
1991
1992
1993
1994
1995
1996
1997
1998
1999
2000
2001
2002
2003
2004
2005
Year
Dep
th to
Gro
undw
ater
(fee
t)
Minimum Depth
Maximum Depth
- 26 -
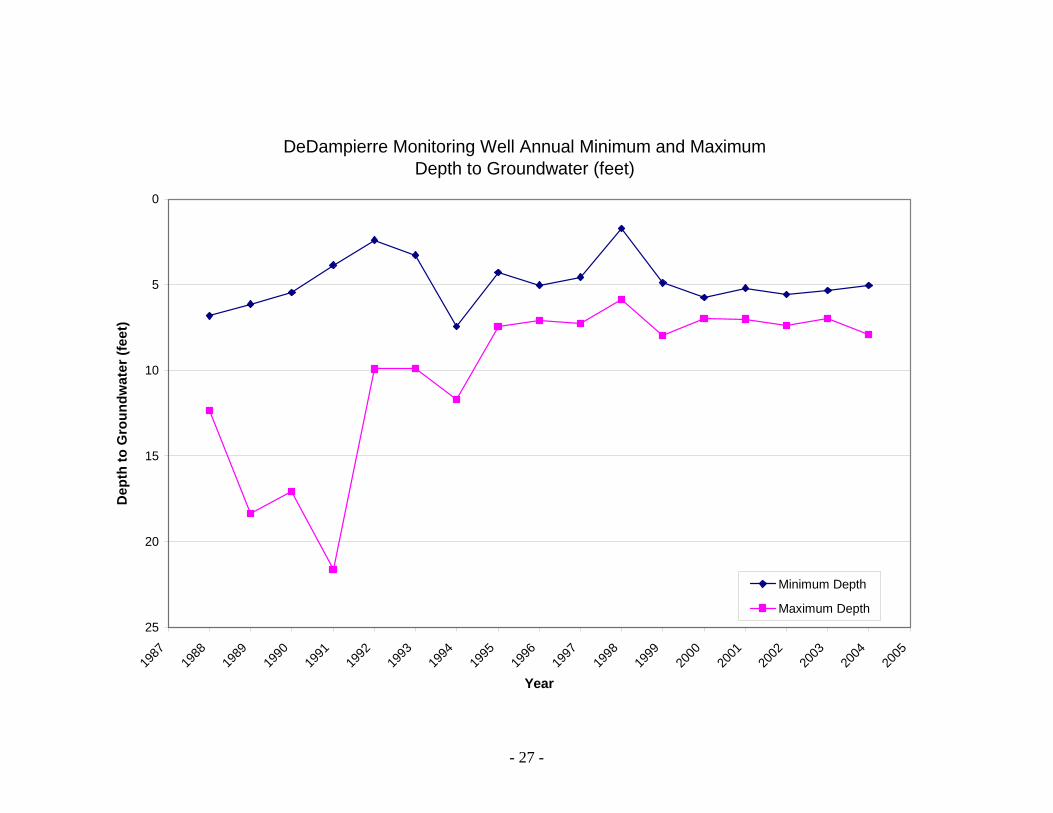
DeDampierre Monitoring Well Annual Minimum and Maximum Depth to Groundwater (feet)
0
5
10
15
20
25
1987
1988
1989
1990
1991
1992
1993
1994
1995
1996
1997
1998
1999
2000
2001
2002
2003
2004
2005
Year
Dep
th to
Gro
undw
ater
(fee
t)
Minimum Depth
Maximum Depth
- 27 -


![BEFORE THE SURFACE TRANSPORTATION BOARD STB EX …1].pdf · SURFACE TRANSPORTATION BOARD STB EX PARTE NO. 672 RAIL TRANSPORTATION OF RESOURCES CRITICAL ... agriculture, and consumer](https://static.fdocuments.us/doc/165x107/5f9a0fb7ec21ca345205f6f1/before-the-surface-transportation-board-stb-ex-1pdf-surface-transportation-board.jpg)