Bectochem_customer Satisfaction Index
79
1 Summer Internship Project Development of a Customer Satisfaction Index
-
Upload
rakesh-kumar-purohit -
Category
Documents
-
view
19 -
download
2
Transcript of Bectochem_customer Satisfaction Index

1
Summer Internship Project
Development of a Customer
Satisfaction Index
2
Development of a Customer Satisfaction Index
By
RAKESH KUMAR PUROHIT
Under the Guidance of
Mr. Sanjay Jadhav Ms. Gunjan Malhotra
Business Head Assistant Proffessor
Bectochem Consultants and Engineers Pvt. Ltd. IMT, GHAZIABAD
Mumbai
April-May, 2011

3
The following Summer Project Report titled "Development of a Customer Satisfaction Index” is hereby approved as a
certified study in management carried out and presented in a manner satisfactory to warrant its acceptance as a
prerequisite for the award of Post-Graduate Diploma in Business Management for which it has been submitted. It is
understood that by this approval the undersigned do not necessarily endorse or approve any statement made, opinion
expressed or conclusion drawn therein but approve the Summer Project Report only for the purpose it is submitted.
Summer Project Report Examination Committee for evaluation of Summer Project Report
Name Signature
1. Faculty Examiner _____________________ ___________________
2. PG Summer Project Co-coordinator _____________________ ___________________

4
Certificate from Summer Project Guides
This is to certify that Mr. Rakesh Kumar Purohit, a student of the Post-Graduate Diploma in Business Management,
has worked under our guidance and supervision. This Summer Project Report has the requisite standard and to the best of
our knowledge no part of it has been reproduced from any other summer project, monograph, report or book.
Mr. Sanjay Jadhav Ms. Gunjan Malhotra
Business Head Assistant Proffessor
Bectochem Consultants and Engineers Pvt. Ltd. IMT, GHAZIABAD
Mumbai
5
Acknowledgement
It is indeed a great pleasure to express my sense of profound gratitude & indebtedness to all the people who have been
instrumental in making my internship a rich experience. I got the opportunity to do a challenging project in Bectochem
Consultants and Engineers Pvt. Ltd. The project is the important part of our study and gives us a real practical exposure
to the corporate world and it is almost impossible to do the same without the guidance of mentors .While doing the
topic “Development of a Customer Satisfaction Index” I received immense guidance and help from several mentors
It gives me immense pleasure to acknowledge Bectochem Consultants and Engineers Pvt. Ltd, which has been
kind enough to give me a chance to do my summer training and provided me wonderful support throughout my training
period.
I am thankful to Mr. Sanjay Jadhav for allowing me to do my research on Customer responses and their issues.
I am grateful for his exceptional support for my study throughout these eight weeks. I have learned the meaning of
marketing and professionalism from this great personality.
I wish to thank my project guide Dr. Gunjan Malhotra for her guidance during my project. I am grateful to my college
director Dr. Bibek Banerjee for his support.
Rakesh Kumar Purohit
6
ABSTRACT
Bectochem is a very well-known industry in the process manufacturing fraternity. Since its inception in 1978, it has
always taken greater strides in contributing a greater value to the sector. The various ranges of product lines of
Bectochem stand a testimony to the fact that continuous innovation can always help the company to gain a competitive
advantage. Being a great company it has always tried to match the demands of its prestigious clients.
It has a very big clientele with very big names like Hindustan unilever, proctor and gamble and glaxo smithkline
associated to it. The various quality control measures it follows make it one of the favored suppliers for the
pharmaceutical clients. There are various international joint ventures of Bectochem which helped it in bringing a lot
of new technologies on board .
The main objective of the project is to do an extensive analysis of the customer responses and to find out the problems
in the industry from the customers perception. The secondary objective is laying down satisfaction levels of the
customer, identifying the priorities , laying down strategies for the company keeping the cultural and the social
environmental and resources in mind .
Towards the attainment of this objective I have done a thorough analysis of all the clients’ responses to a
questionnaire. I have also done a trend analysis of all the parameters to find out the areas on which the company has
improved or degraded. I have done a regression analysis to find out the degree of explainable variation of the
dependent variable by the independent variable. This has also helped me in trying to find out the priorities in the
customer service from the users perception. After a thorough analysis I have laid down strategies giving ample proof
for each strategy. The individual divisional analysis has also been done to identify the amount of problems in each
product line and the consumer behavior in each of them.
It was found that the major problem lies in the communication and post sales service. The timely delivery is also a
major problem which gets hampered due to the lack of proper communication from both the cleints and company side
but the customer lays down the communication variable a greater importance then the timely delivery as far as new
installation machines are concerned but for the post sales service , timely responsiveness of the complaints personnel
is taken as high priority .

7
The strategies laid down are in consultation with internal as well as external customers keeping the company capacities
in mind. I have also designed a customer satisfaction questionnaire which can he hence forth be used for all customer
touch points.
8
Contents
1. INTRODUCTION
1.1 - COMPANY HISTORY ----------------------------------------------------------------------------- 11
1.2 VISION------------------------------------------------------------------------------------------------13
1.3 MISSION -----------------------------------------------------------------------------------------------13
1.4 CERTIFICATIONS ------------------------------------------------------------------------------------13
1.5 SWOT-----------------------------------------------------------------------------------------------------14
2. OPERATING PROCEDURES
2.1 KICK OFF MEETING IN MUMBAI -------------------------------------------------------------------16
2.2 DESIGN --------------------------------------------------------------------------------------------------18
2.3 PLANNING ----------------------------------------------------------------------------------------------18
2.4 MANUFACTURING-------------------------------------------------------------------------------------19
2.5 TESTING--------------------------------------------------------------------------------------------------19
2.6 DISPATCH AND INSTALLATION---------------------------------------------------------------------19
3. RESEARCH METHODOLOGY
3.1 PROBLEM FORMULATION----------------------------------------------------------------------------22
3.2 RESEARCH DESIGN----------------------------------------------------------------------------------------23
3.3 PERIOD OF STUDY ----------------------------------------------------------------------------------------23
3.4 SAMPLING DESIGN -----------------------------------------------------------------------------------23
3.5 LIMITATIONS-------------------------------------------------------------------------------------------24
4. DATA ANALYSIS AND INTERPRETATION
4.1 OLD CUSTOMER SATISFACTION FORM ----------------------------------------------------26
4.2 ANAMOLIES ------------------------------------------------------------------------------------26
4.3 INDIVIDUAL VARIBLE ANALYSIS OF THE OLD CUSTOMER SATISFACTION FORM--29
4.4 INFERENCES----------------------------------------------------------------------------------------31
4.5 NEW CUSTOMER SATISFACTION FORM---------------------------------------------------33
4.6 ANAMOLIES-----------------------------------------------------------------------------------------37
9
4.7 ANALYSIS OF THE NEW CUSTOMER SATISFACTION FORM ---------------------------------38
4.7.1 REGRESSION ANALYSIS ----------------------------------------------------------------38
4.7.2 INDIVIDUAL VARIABLE ANALYSIS---------------------------------------------------- 39
4.7.3 DESCRIPTIVE STATISTICS---------------------------------------------------------------44
4.8 COMPARATIVE ANALYSIS BETWEEN OLD CUSTOMER SATISFACTION FORM AND THE NEW CUSTOMER
SATISFACTION FORM -------------------------------------------------------------------------------- --52
4.9 INDVIDUAL SECTOR ANALYSIS
4.9.1 ISOLATOR DIVISON----------------------------------------------------------------------------56
4.9.2 PHARMA DIVISON----------------------------------------------------------------------------- 66
4.10 CUSTOMER FRIENDLY FEEDBACK FORM -------------------------------------------------------------------67
4.11 MOTIVATION AND BUYING EXPERIENCE SURVEY QUESTIONNAIRE----------------------------------67
4.12 RECCOMMENDATION----------------------------------------------------------------------------------------------70
4.13 OVERALL SATISFACTION LEVEL-----------------------------------------------------------------------------------70
5. STRATEGIES--------------------------------------------------------------------------------------------------------------------71
5.1 COMMUNICATION --------------------------------------------------------------------------------------------------72
5.2 POST SALES SERVICE ----------------------------------------------------------------------------------------------74
6. CONCLUSION -------------------------------------------------------------------------------------------------------------------77
7. APPENDIX -----------------------------------------------------------------------------------------------------------------------79

10
INTRODUCTION
11
-
It is one of the leading process equipment manufacturers in INDIA since 1978.It deals in pharmaceutical, active
pharmaceutical ingredients, food and cosmetics and allied industries. It has a 500 + work force in INDIA. It has
manufacturing setups at ANKALESHWAR (Gujarat) and PUNE (Maharashtra).It has Joint ventures with 6 organizations
in INDIA.
They are:-
1. FITZPATRICK
2. Hecht
3. Sterivalve
4. Riva
5. RML
6. CSP
BECTOR- HECHT – A joint venture company is largest containment solutions provider in the world.
Bectochem has 4 major product divisions:-
1. Pharma
2. Food and cosmetics
3. Isolators
4. API.
The products of Bectochem are found in 5 continents of the world. Introducing barrier isolator technology to
India in 2004, Bectochem is the acknowledged expert in the specialized and technically demanding field of
design & manufacture of high specification barrier containment systems.
The industries that are served are:-
1. API Manufacturing
2. Solids Formulations
3. Liquid Formulations
4. Ointment Formulations
12
Bectochem has been a major exhibitor in many of the exhibitions happening in and out of the country. Some of the
notables ones were:-
1. Pak Pharma Expo ’08 held on 14-16 October ’08 at Karachi Expo Center, Karachi, Pakistan
2. Israchem, the International exhibition for Industrial Processing, Chemical Engineering, Measurement,
Control and Instrumentation, Water & Fluid in Israel held on February 17th-19th, 2009
3. Official Sponsors of Scientific Program-cum-Workshop Seminar on Quality Risk & management held on
23-24 March ’09 at Amman, Jordan.
4. ChemProtech Exhibition at Bombay Exhibition Center, NSE ground, Mumbai 15th & 16th April 2010.
13
Think Different Engineer Smart
To be an INR 1000 million company by 2011
Passion
Respect
Integrity
Diligence
Ethical
Values are enhanced through:-
Product
People
Process

14
STRENGTH:-
Product Quality
Product Diversity
A diversified network of Agents.
WEAKNESS:-
Lack of communication
Delays on Delivery
Lack of certain data
Customer Service
Lack of Team Work
OPPURTUNITIES:-
Taylor to made machinery for changing needs
Untapped Market
THREATS:-
Competitors
Low efficiency

15
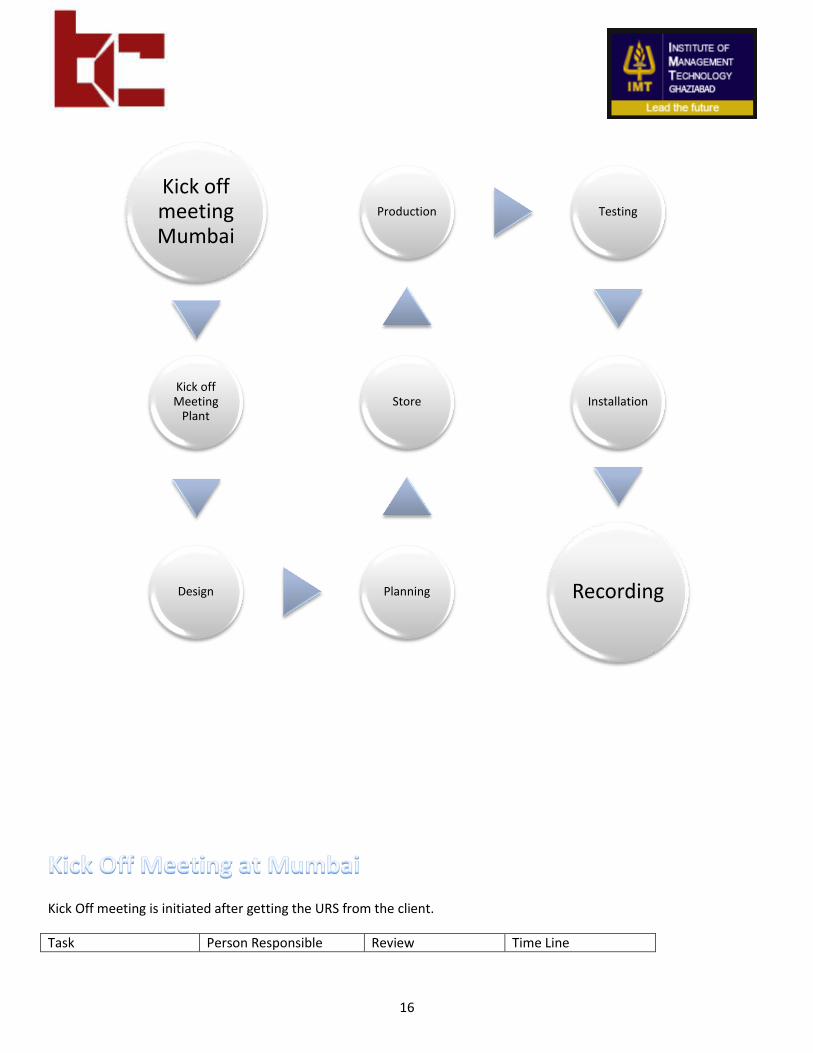
Operation Procedure
16
Kick Off meeting is initiated after getting the URS from the client.
Task Person Responsible Review Time Line
Kick off meeting Mumbai
Kick off Meeting
Plant
Design Planning
Store
Production Testing
Installation
Recording
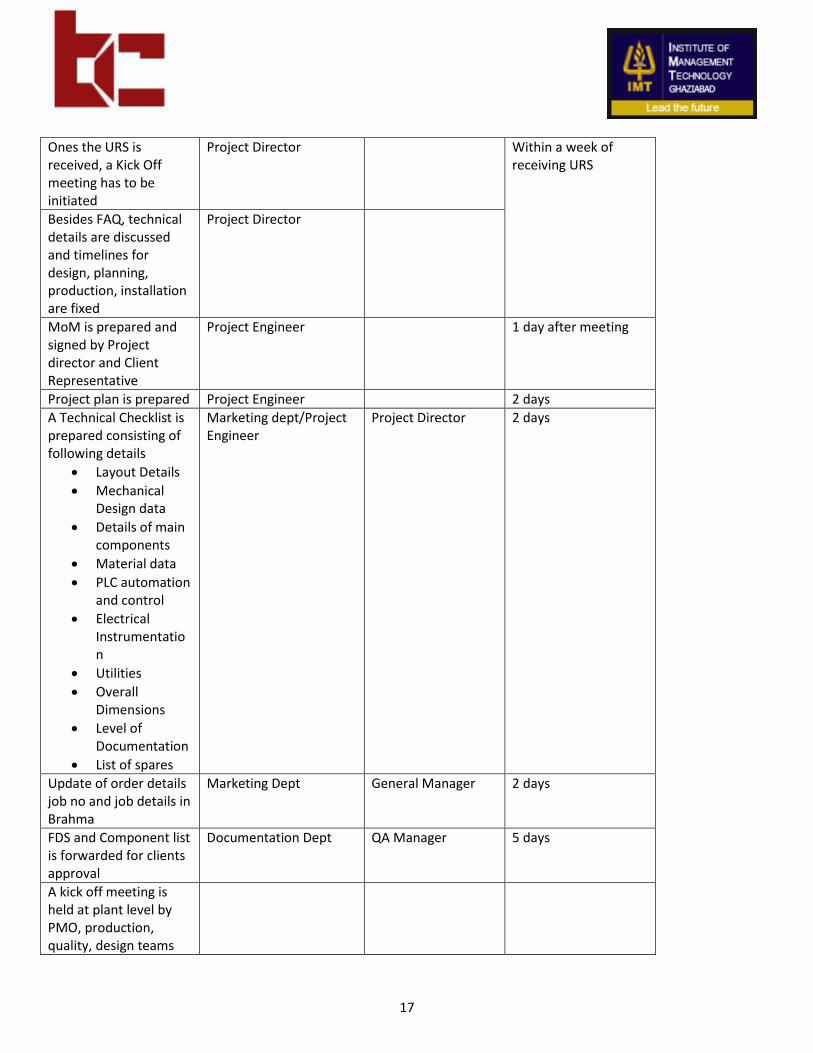
17
Ones the URS is received, a Kick Off meeting has to be initiated
Project Director Within a week of receiving URS
Besides FAQ, technical details are discussed and timelines for design, planning, production, installation are fixed
Project Director
MoM is prepared and signed by Project director and Client Representative
Project Engineer 1 day after meeting
Project plan is prepared Project Engineer 2 days
A Technical Checklist is prepared consisting of following details
Layout Details
Mechanical Design data
Details of main components
Material data
PLC automation and control
Electrical Instrumentation
Utilities
Overall Dimensions
Level of Documentation
List of spares
Marketing dept/Project Engineer
Project Director 2 days
Update of order details job no and job details in Brahma
Marketing Dept General Manager 2 days
FDS and Component list is forwarded for clients approval
Documentation Dept QA Manager 5 days
A kick off meeting is held at plant level by PMO, production, quality, design teams
18
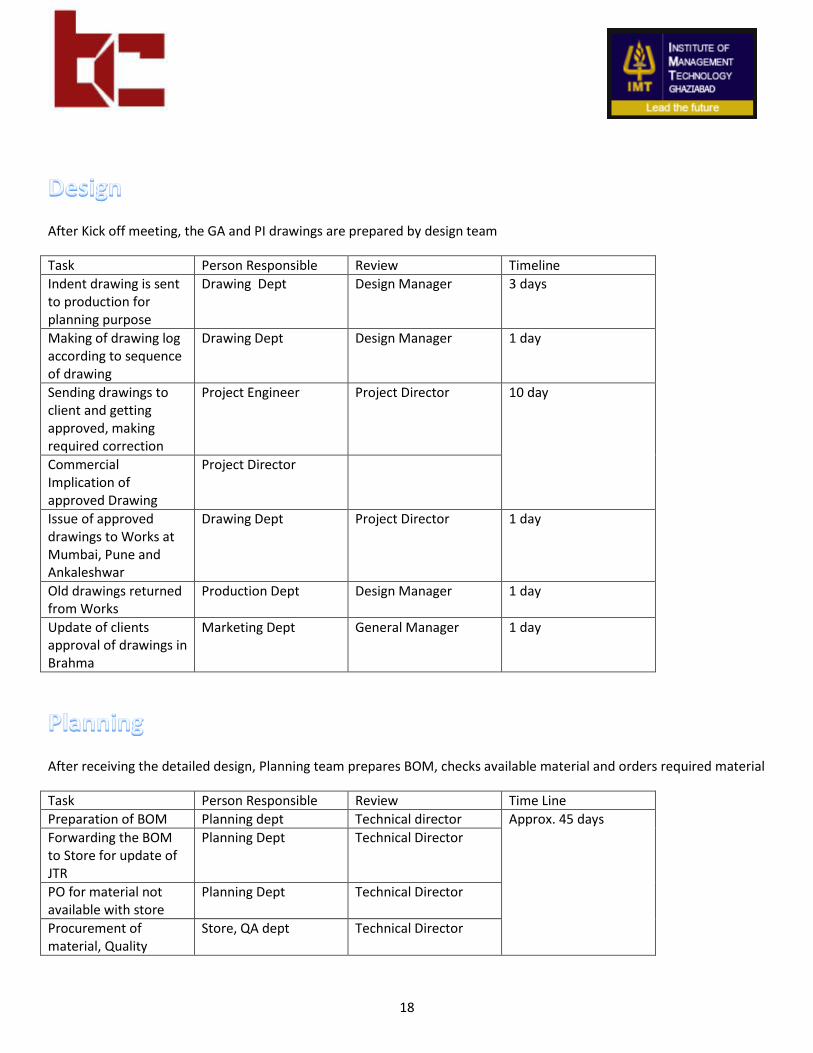
After Kick off meeting, the GA and PI drawings are prepared by design team
Task Person Responsible Review Timeline
Indent drawing is sent to production for planning purpose
Drawing Dept Design Manager 3 days
Making of drawing log according to sequence of drawing
Drawing Dept Design Manager 1 day
Sending drawings to client and getting approved, making required correction
Project Engineer Project Director 10 day
Commercial Implication of approved Drawing
Project Director
Issue of approved drawings to Works at Mumbai, Pune and Ankaleshwar
Drawing Dept Project Director 1 day
Old drawings returned from Works
Production Dept Design Manager 1 day
Update of clients approval of drawings in Brahma
Marketing Dept General Manager 1 day
After receiving the detailed design, Planning team prepares BOM, checks available material and orders required material
Task Person Responsible Review Time Line
Preparation of BOM Planning dept Technical director Approx. 45 days
Forwarding the BOM to Store for update of JTR
Planning Dept Technical Director
PO for material not available with store
Planning Dept Technical Director
Procurement of material, Quality
Store, QA dept Technical Director

19
testing of the material and binning, MRN update in Focus
Ones the material is procured, production process starts
Task Person Responsible Review Timeline
Production of Job Production Dept Technical Director
Monitoring progress of job
Production Engineer
Technical Director
Weekly reporting of the status of job
Production Manager
Technical Director
After production the job is tested as follows
Task Person Responsible Review Timeline
Pre FAT Production Dept
FAT trail by QA department and client
QA Engineer Production Manager
Documentation of FAT protocol
Documentation Dept QA manager
Ones the job is OK tested, it is prepared for dispatch
Task Person Responsible Review Timeline
Issuance of Dispatch Instructions to plant
Project Director
Advance intimation by factory 10 days before
Production Manager
Thorough checking of equipment before
QA Engineer
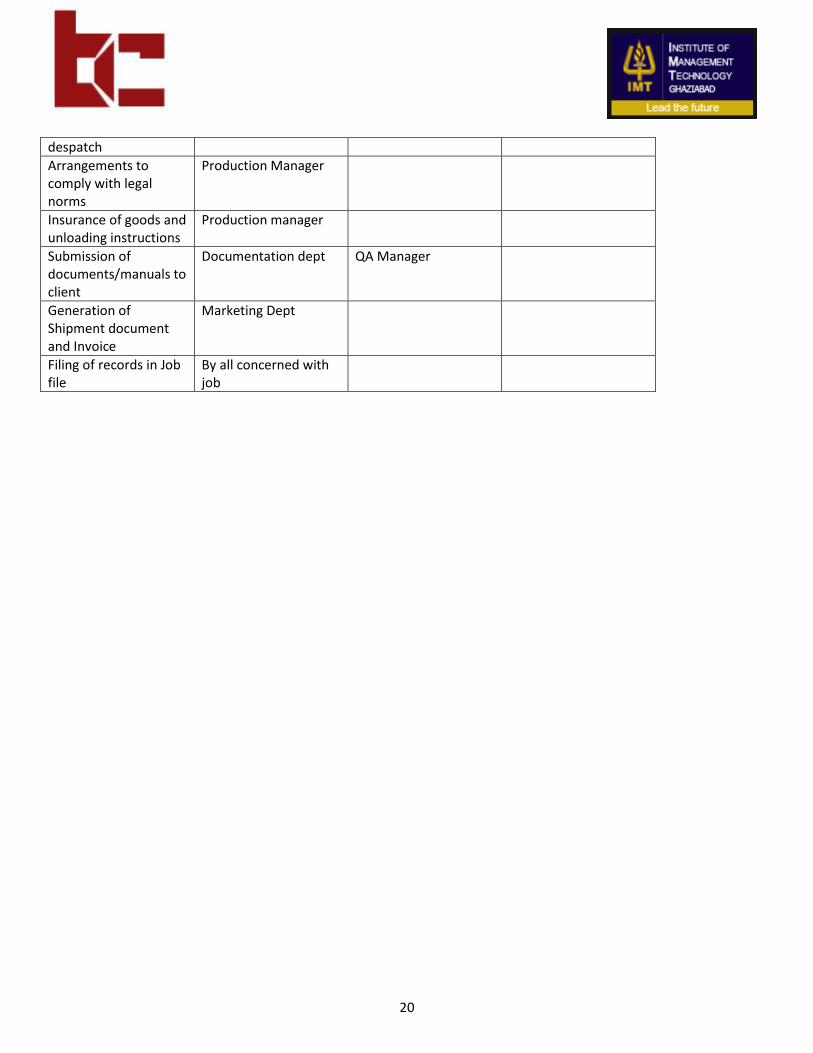
20
despatch
Arrangements to comply with legal norms
Production Manager
Insurance of goods and unloading instructions
Production manager
Submission of documents/manuals to client
Documentation dept QA Manager
Generation of Shipment document and Invoice
Marketing Dept
Filing of records in Job file
By all concerned with job
21
Research Methodology
22
:
As we now have an overview of the issues in the industry, I have gone forward to understand the customer perceptions
about the industry and the changes that are visible to them.
Developing a customer satisfaction index usually ends up in getting the following results:-
1. Identifying the customer satisfaction parameters.
2. Consumer preferences.
3. Valuation of the company in front of the competitors
4. To understand the future needs of the customer in terms of the service.
5. Understanding the customer touch points where the service goes wrong.
So, for this I have formulated some variables which I could find out from the interaction, analysis of the old
customer data and through a factor analysis on the old data. These factors were also drawn out by a sample
questionnaire survey on a pilot group.
The variables are:-
1. Communication
2. Technical proficiency
3. Quality of service
4. Quality of product
5. Performance
6. Wider benefits of the customer
7. Post sales service
The communication tests the inner communication between the company and the also to the cleints part
The technical proficiency variable is of utmost importance as this is a clear indicator of the type of service by
the post sales service personnel
Quality of service, quality of product is the general independent variables which are affected by a lot of factors.
The other factors are more of trying to give the customer the extra perceived benefits which are generally
expected in satisfaction.
23
-
The general method of research design was more of a primary research. The total survey was done all the business to
business clients. This was more of a descriptive research method which was used to find out the customer preferences and
laying down strategies for that.
:-
The study was conducted for a period of around 50 days starting from 6h April 2010 to 25
th May
2010.
Type of universe:-
The first step in developing any sample design is to define the set of objects, technically called the'
Universe' to be studied. The universe of this research study is 'finite' in nature because the total number of
items is certain. There were around 40 clients.
Sampling Unit:
In this research, the entire universe was not taken for the study. The sample included the pharmaceutical
industries, processed food industries.
Sample size:
This refers to the number of passengers who are all interviewed from the universe to constitute a sample.
The size of the sample should be neither excessively large nor too small.
The sample size of this study is 40 clients.
Sampling Technique:
The sample technique is the judgment sampling technique. Judgment sampling is a common non-
probability method. The research selects the sample based on judgment. This is usually an extension of
24
convenience sampling, for example, a researcher may decide to draw the entire sample from one
"representative" population.
Data collection:-
A primary method of data collection was used in it by the use of questionnaire survey. The mode of
data collection was online.
There are certain limitations when the research was done. The limitations are as follows:
1. Only a small percentage of the population were interviewed and questioned.
2. The work was generally delegated to the assistants due to whom the exact statistics may not have
been reflected.
25
Data Analysis and Interpretation
26
.
The old customer form which was earlier done by the company employees had not been analyzed and questionnaire is as
follows:
How do you rate Bectochem in terms of the following?
1. Quality and performance
2. Installation
3. Timely delivery
4. Post sales service
5. Communication
The problem with the old customer satisfaction form is as follows:
1. Conformance quality should have included the following factors:-
• The quality of the raw materials used
• The quality of finishing
• Has the product been manufactured according to the specification laid down by the client
• Has the controls been clearly calibrated
• Have the spares used in that are according to the standards laid down by the client
27
2. The performance should have been valued by:-
• Whether it is working properly
• In what time do the parts or the spares of the machine need replacement
• Are the spares performing alright
• Is it giving the required amount promised or is it exceeding that or less than that what is expected
• Has the use of such machines solved some other problems of the company
3. The timely delivery should have been valued by:-
• Timely dispatch of machines at the client’s site
• Timely dispatch of shares at the client’s site
• Adherence of each stage of work to the clients
• Timely receipt or status of raw materials to the company should also be known to the client
• Timely arrival of the after sales service person or technician in case of any emergency
4. The installation and commissioning should have been valued by:
• Proper installation of machines at the clients place
• Proper manufacture of the equipment according to the required dimensions
• Proper SAT being done
• Proper FAT being done
• Has the equipment properly in dimension at the clients place
• SAT deviance report properly prepared
5. The variable of communication and co-ordination can be valued by:
• Proper real time communication being conveyed to the clients about the development of their work
• Timely reports being sent to client regarding the development
28
• Behavior of the employees when any question or query is being sent by the clients
• Ease of Access to after sales service personnel
• Involvement of the client in a restricted manner in the total manufacturing process
6. The variable of after sales service should have been valued by:
• The availability of the after sales service personnel
• The swiftness of response to any complaints of the client
• The efficiency of the after sales service professional in correcting the errors or disorders in the system
• The behavior of the after sales service personnel
• The timely visits or any mode of correspondence of the after post sales service personnel
29
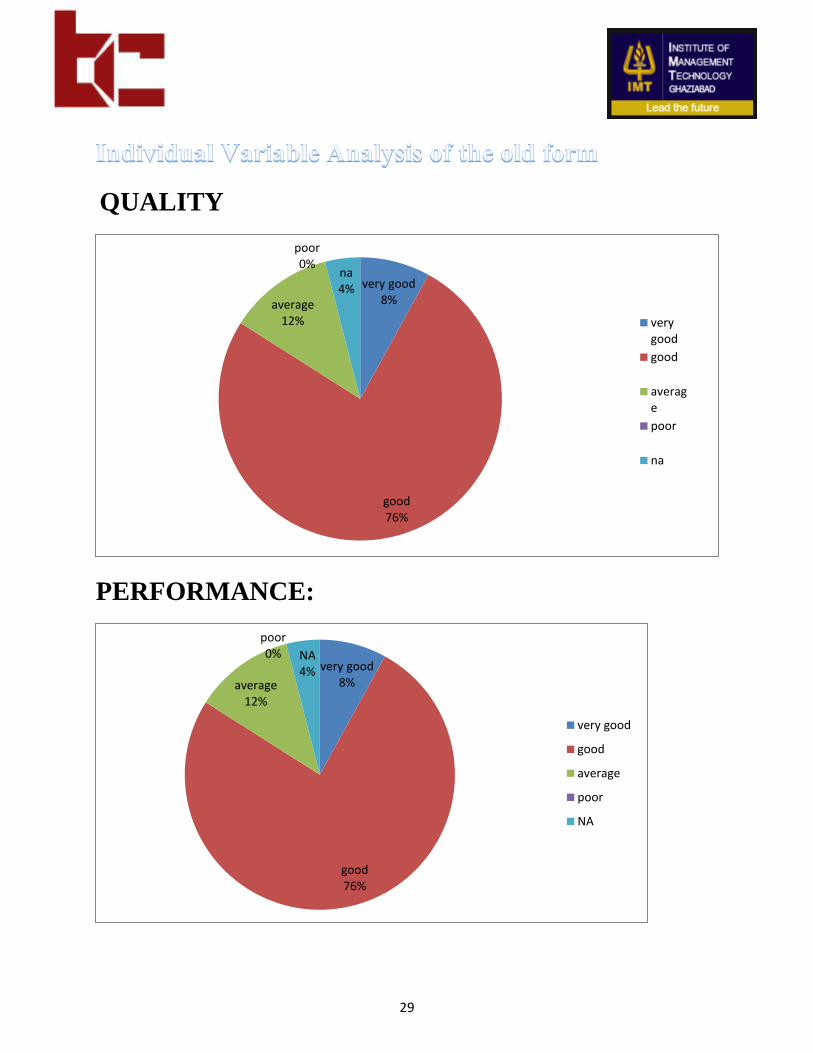
QUALITY
PERFORMANCE:
very good 8%
good 76%
average 12%
poor 0%
na 4%
verygood
good
average
poor
na
very good 8%
good 76%
average 12%
poor 0% NA
4%
very good
good
average
poor
NA
30
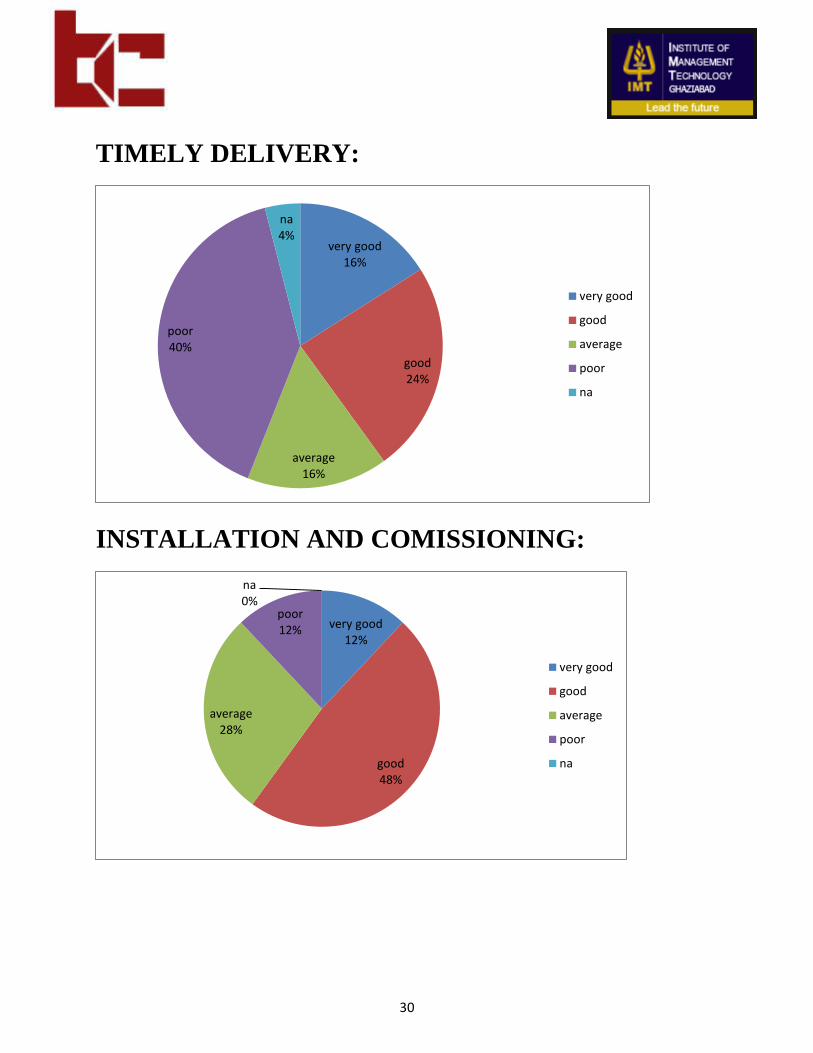
TIMELY DELIVERY:
INSTALLATION AND COMISSIONING:
very good 16%
good 24%
average 16%
poor 40%
na 4%
very good
good
average
poor
na
very good 12%
good 48%
average 28%
poor 12%
na 0%
very good
good
average
poor
na
31
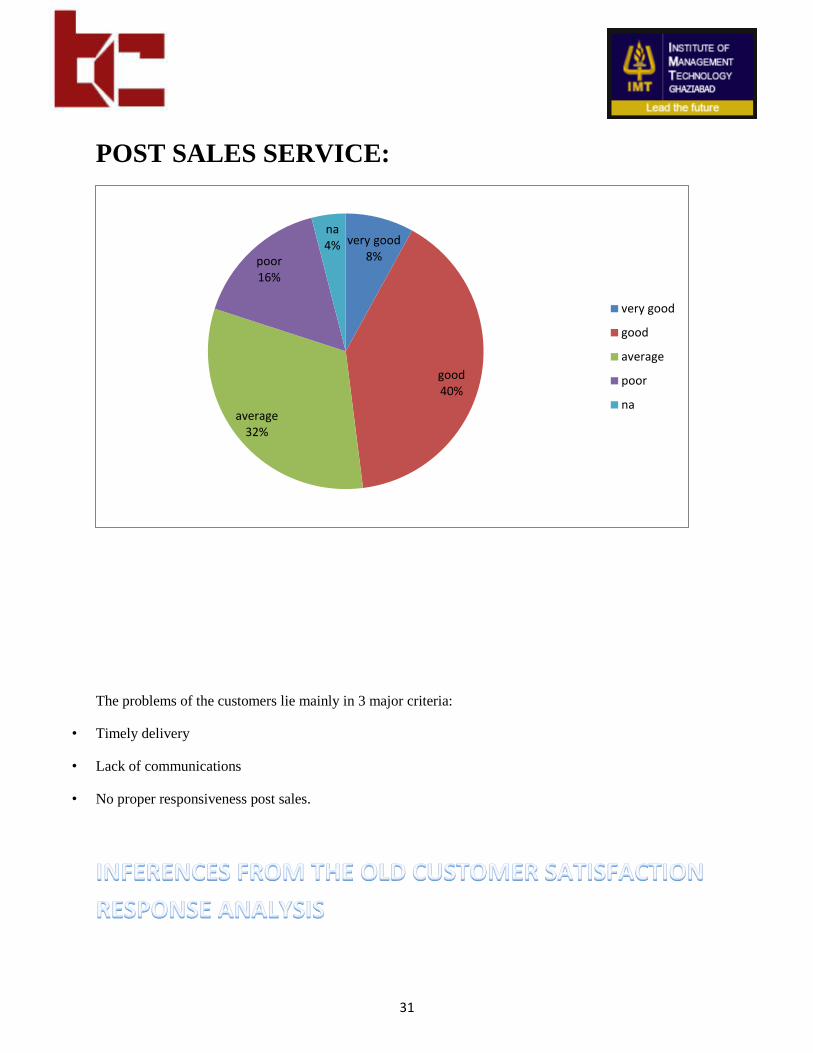
POST SALES SERVICE:
The problems of the customers lie mainly in 3 major criteria:
• Timely delivery
• Lack of communications
• No proper responsiveness post sales.
very good 8%
good 40%
average 32%
poor 16%
na 4%
very good
good
average
poor
na

32
• There is no proper visit of the after sales service personnel. And if sent they are not proficient enough to correct
the disorders.
• The after sales service is not prompt enough or responsive.
• No proper timely delivery of the product. Deadlines have not been adhered to.(score is very poor on this grounds )
• The communication is not being done to the clients at regular intervals and also no timely reports have been sent.
33
:
BECTOCHEM CONSULTANTS & ENGINEERS PVT LTD
204-205/5C, MITTAL INDUSTRIAL ESTATE, ANDHERI (EAST)
MUMBAI 400 059, INDIA
Phone: +91 22 2850 0008 / 2850 2400
Fax: +9122 28506785
www.bectochem.com
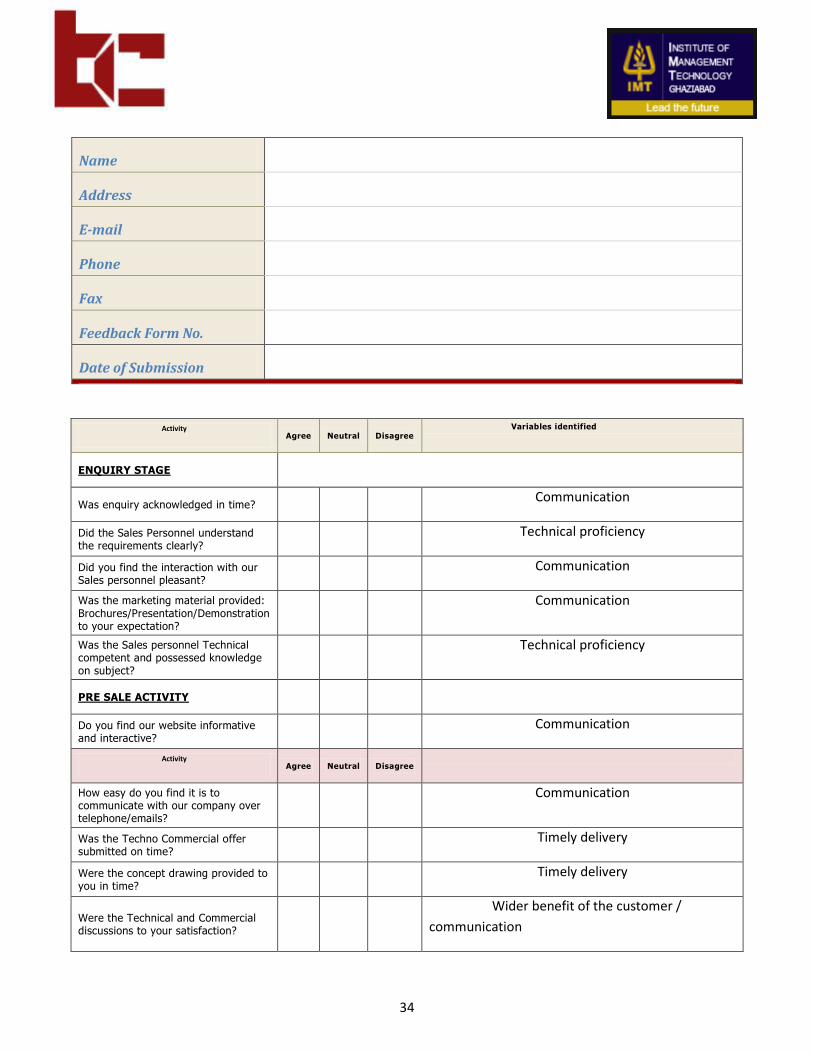
We are always looking for ways to improve the quality of our services. Please take a few minutes to answer the following questions based on your expectations of our product. Your comments and suggestions will be used to improve processes and our ability to respond to your future requests for services.
Please use this symbol to indicate your choice
34
Name
Address
Phone
Fax
Feedback Form No.
Date of Submission
Activity Agree Neutral Disagree
Variables identified
ENQUIRY STAGE
Was enquiry acknowledged in time? Communication
Did the Sales Personnel understand the requirements clearly?
Technical proficiency
Did you find the interaction with our Sales personnel pleasant?
Communication
Was the marketing material provided: Brochures/Presentation/Demonstration to your expectation?
Communication
Was the Sales personnel Technical competent and possessed knowledge on subject?
Technical proficiency
PRE SALE ACTIVITY
Do you find our website informative and interactive?
Communication
Activity Agree Neutral Disagree
How easy do you find it is to communicate with our company over telephone/emails?
Communication
Was the Techno Commercial offer submitted on time?
Timely delivery
Were the concept drawing provided to you in time?
Timely delivery
Were the Technical and Commercial discussions to your satisfaction?
Wider benefit of the customer /
communication
35
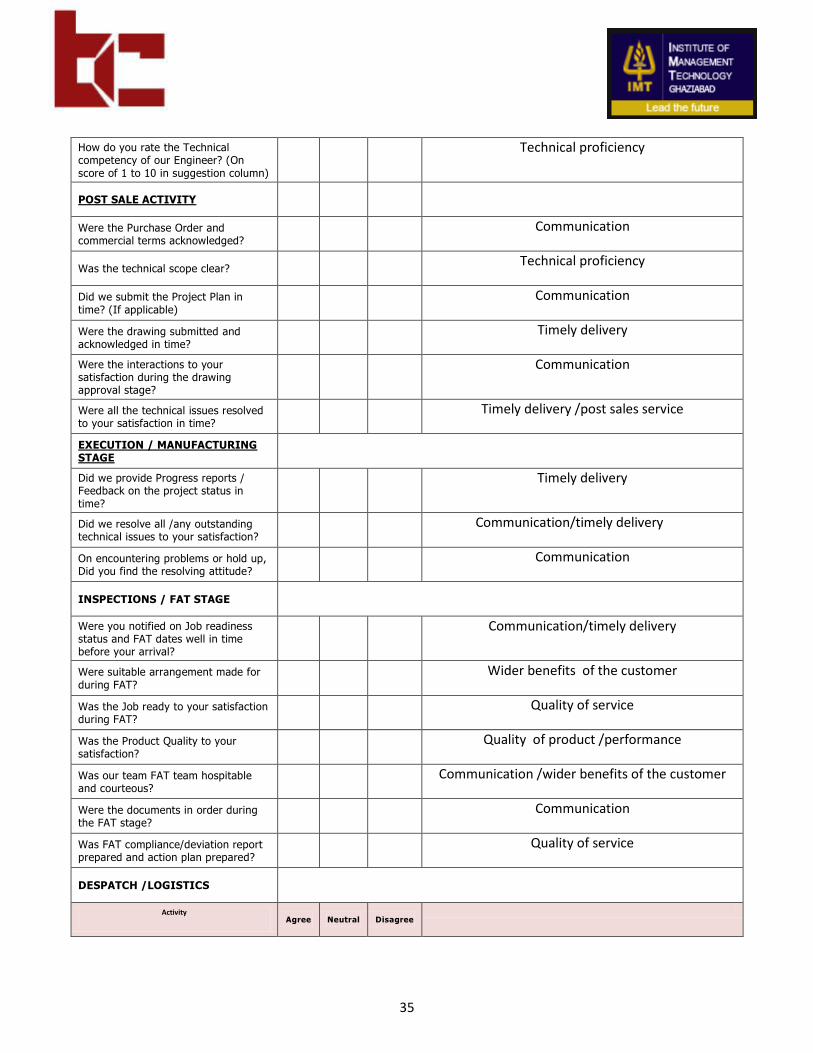
How do you rate the Technical competency of our Engineer? (On score of 1 to 10 in suggestion column)
Technical proficiency
POST SALE ACTIVITY
Were the Purchase Order and commercial terms acknowledged?
Communication
Was the technical scope clear? Technical proficiency
Did we submit the Project Plan in time? (If applicable)
Communication
Were the drawing submitted and acknowledged in time?
Timely delivery
Were the interactions to your satisfaction during the drawing approval stage?
Communication
Were all the technical issues resolved to your satisfaction in time?
Timely delivery /post sales service
EXECUTION / MANUFACTURING STAGE
Did we provide Progress reports / Feedback on the project status in time?
Timely delivery
Did we resolve all /any outstanding technical issues to your satisfaction?
Communication/timely delivery
On encountering problems or hold up, Did you find the resolving attitude?
Communication
INSPECTIONS / FAT STAGE
Were you notified on Job readiness status and FAT dates well in time before your arrival?
Communication/timely delivery
Were suitable arrangement made for during FAT?
Wider benefits of the customer
Was the Job ready to your satisfaction during FAT?
Quality of service
Was the Product Quality to your satisfaction?
Quality of product /performance
Was our team FAT team hospitable and courteous?
Communication /wider benefits of the customer
Were the documents in order during the FAT stage?
Communication
Was FAT compliance/deviation report prepared and action plan prepared?
Quality of service
DESPATCH /LOGISTICS
Activity Agree Neutral Disagree
36
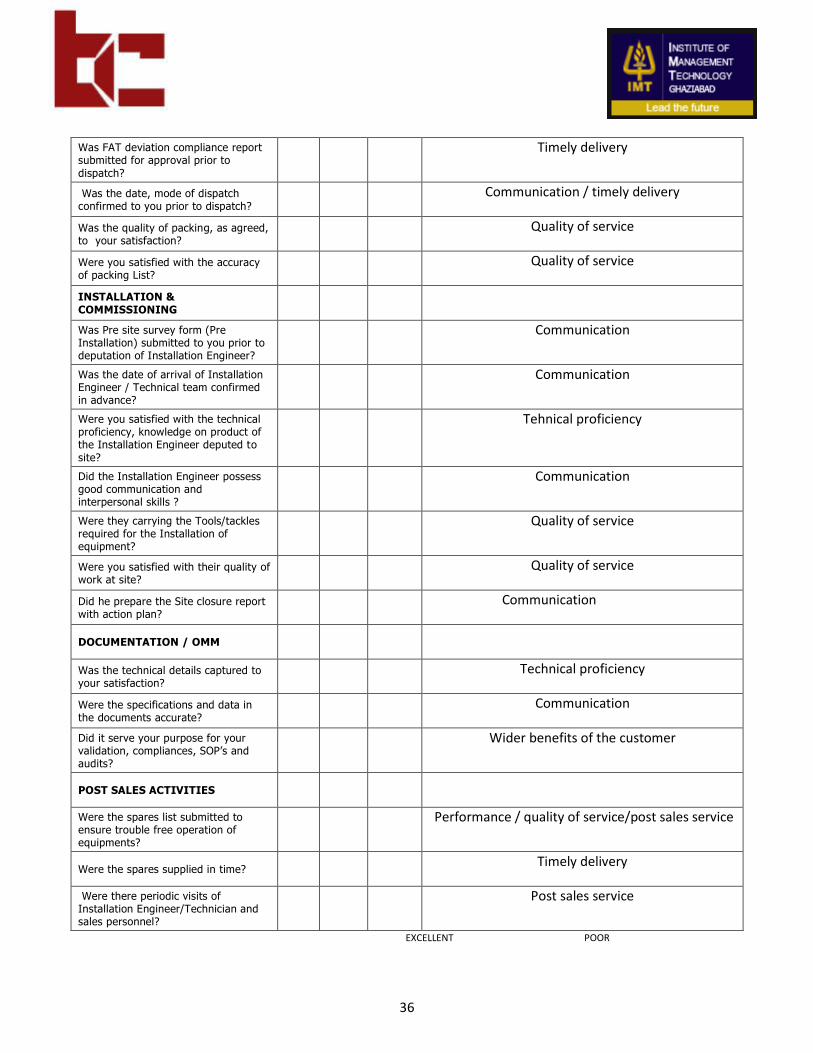
Was FAT deviation compliance report submitted for approval prior to dispatch?
Timely delivery
Was the date, mode of dispatch confirmed to you prior to dispatch?
Communication / timely delivery
Was the quality of packing, as agreed, to your satisfaction?
Quality of service
Were you satisfied with the accuracy of packing List?
Quality of service
INSTALLATION & COMMISSIONING
Was Pre site survey form (Pre Installation) submitted to you prior to deputation of Installation Engineer?
Communication
Was the date of arrival of Installation Engineer / Technical team confirmed in advance?
Communication
Were you satisfied with the technical proficiency, knowledge on product of the Installation Engineer deputed to site?
Tehnical proficiency
Did the Installation Engineer possess good communication and interpersonal skills ?
Communication
Were they carrying the Tools/tackles required for the Installation of equipment?
Quality of service
Were you satisfied with their quality of work at site?
Quality of service
Did he prepare the Site closure report with action plan?
Communication
DOCUMENTATION / OMM
Was the technical details captured to your satisfaction?
Technical proficiency
Were the specifications and data in the documents accurate?
Communication
Did it serve your purpose for your validation, compliances, SOP’s and audits?
Wider benefits of the customer
POST SALES ACTIVITIES
Were the spares list submitted to ensure trouble free operation of equipments?
Performance / quality of service/post sales service
Were the spares supplied in time? Timely delivery
Were there periodic visits of Installation Engineer/Technician and sales personnel?
Post sales service
EXCELLENT POOR

37
How would you rate the overall service provided? 5 4 3 2 1
Quality of service
-
• From the customer perspective
a) very large form ( around 48 questions )
b) given as a doc and not as a link ( hence not friendly)
c) Very rigorous follow up was done
d) On a very busy schedule nobody would find time to fill such a large form trying to analysis all the aspects of the
transaction
e) The form was forwarded to more than one person in the same client company.
From the company’s perspective:
a) No Likert scale added.
b) Many variable like
1. Idea of next transaction
2. Recommendation of our product
c) Many feedbacks are taken before SAT , so we don’t get a proper view of all the aspects of the transaction
38
d) Quality of product did not have many questions to it
e) very large form to do a quantitative analysis
The detailed analysis has been structured into 3 parts:
• Regression analysis
• Individual variable analysis
• Vertical analysis
Regression Analysis:-
The regression analysis has been done of some of the variables. These variables have been arrived as having a
possible regression relationship between them
• They are :
39
1. Communication vs. quality of service
2. Communication vs. timely delivery
3. Quality of service vs. performance
4. Technical proficiency vs. Quality of service
5. Post sales service vs. quality of service.
6. Timely delivery vs. performance
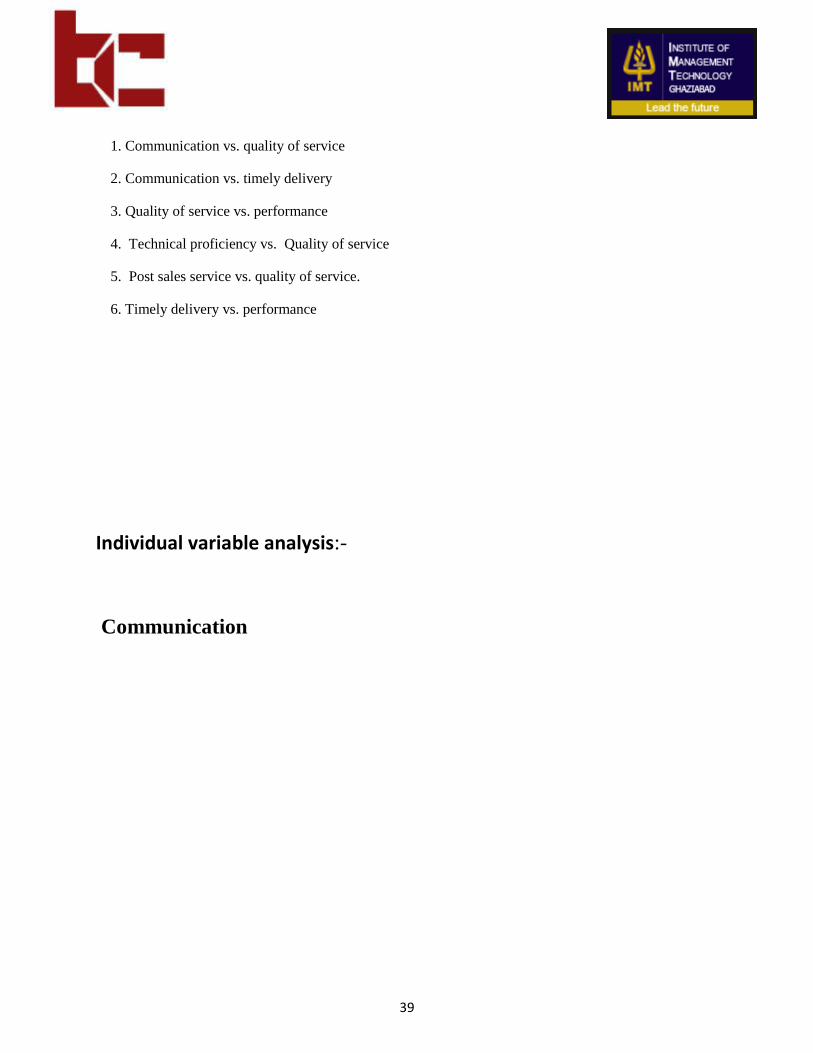
Individual variable analysis:-
Communication
40
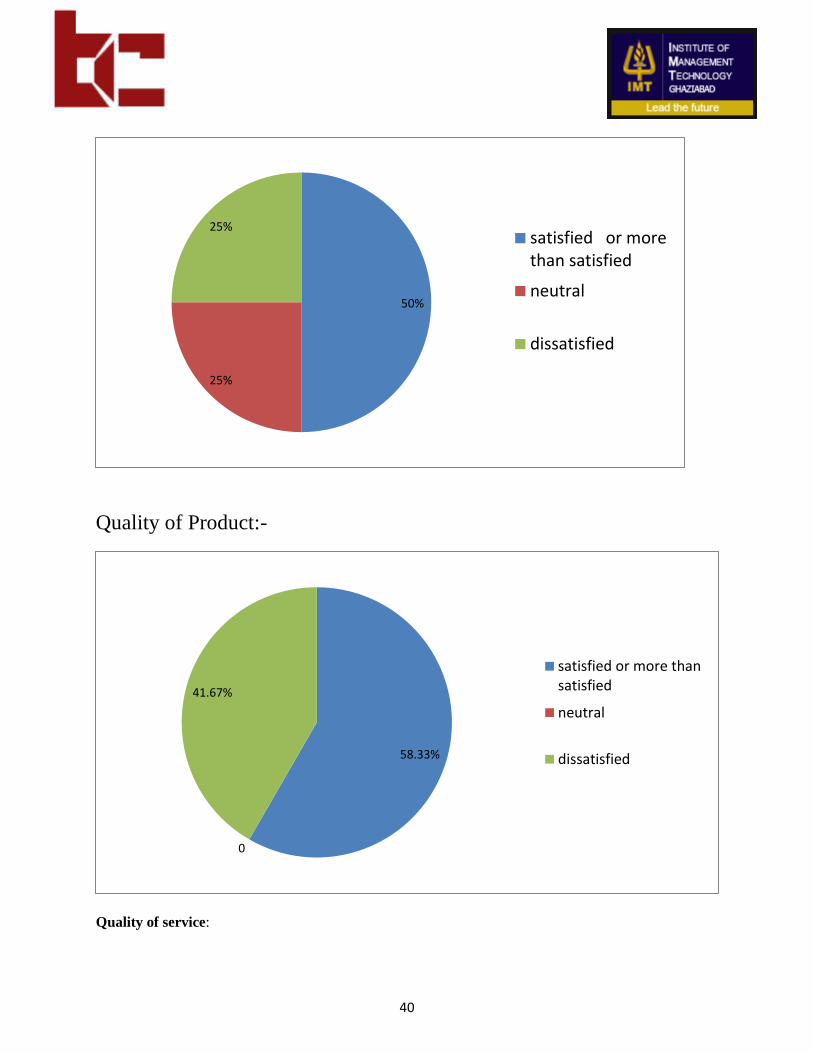
Quality of Product:-
Quality of service:
58.33%
0
41.67%
satisfied or more thansatisfied
neutral
dissatisfied
50%
25%
25% satisfied or morethan satisfied
neutral
dissatisfied
41
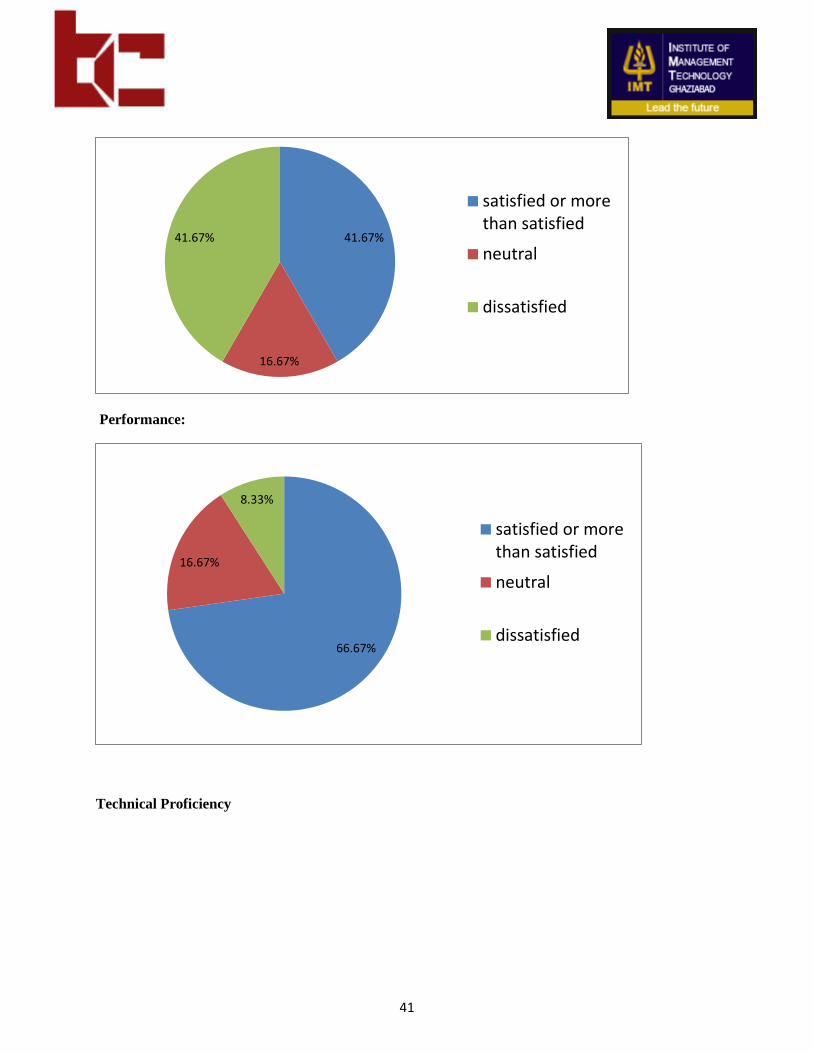
Performance:
Technical Proficiency
41.67%
16.67%
41.67%
satisfied or morethan satisfied
neutral
dissatisfied
66.67%
16.67%
8.33%
satisfied or morethan satisfied
neutral
dissatisfied
42
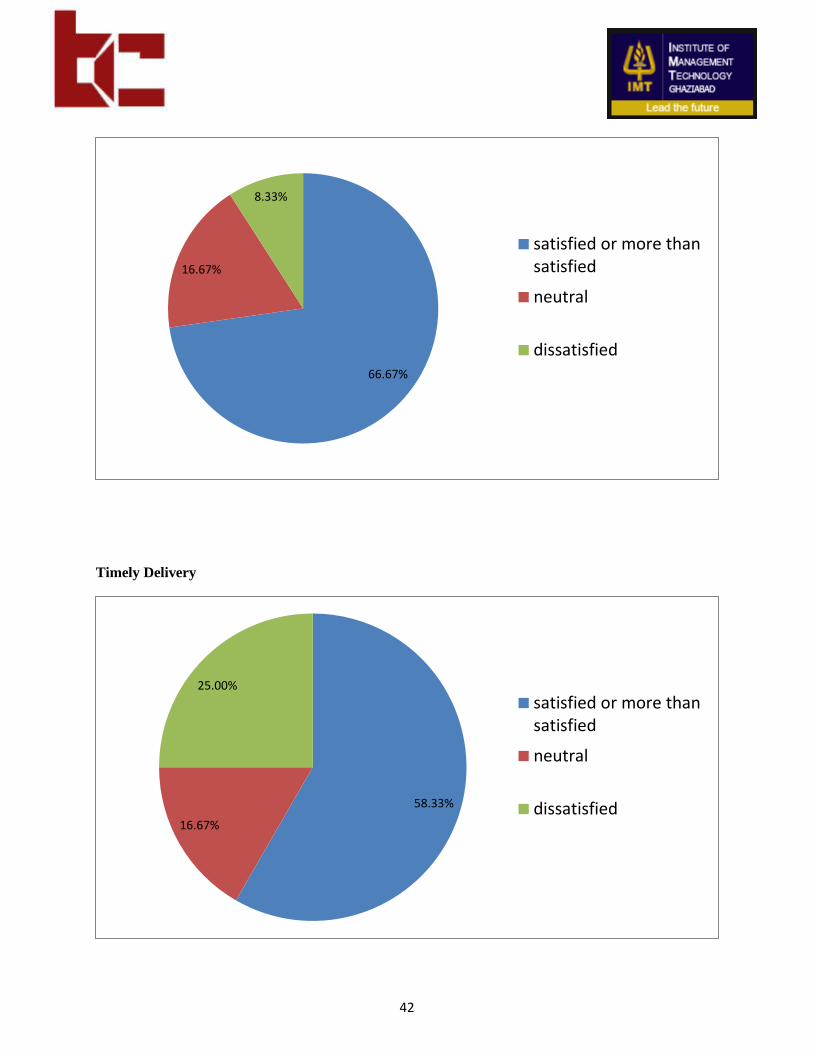
Timely Delivery
66.67%
16.67%
8.33%
satisfied or more thansatisfied
neutral
dissatisfied
58.33%
16.67%
25.00%
satisfied or more thansatisfied
neutral
dissatisfied
43
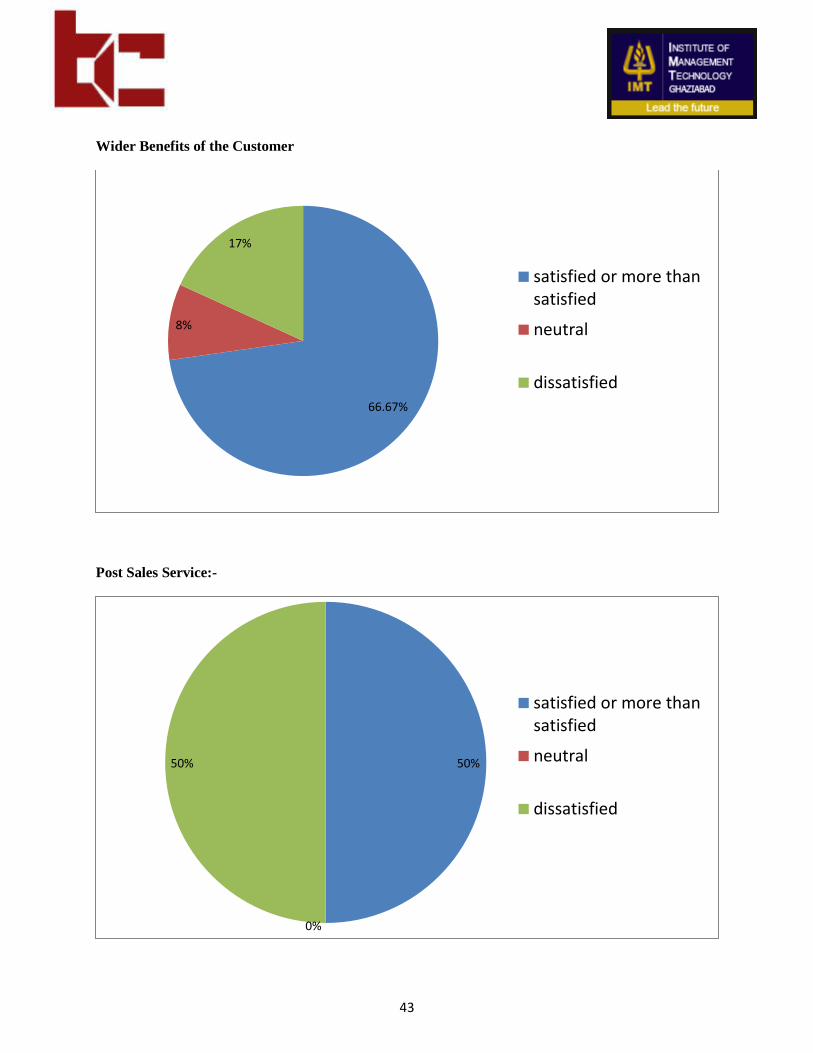
Wider Benefits of the Customer
Post Sales Service:-
66.67%
8%
17%
satisfied or more thansatisfied
neutral
dissatisfied
50%
0%
50%
satisfied or more thansatisfied
neutral
dissatisfied
44
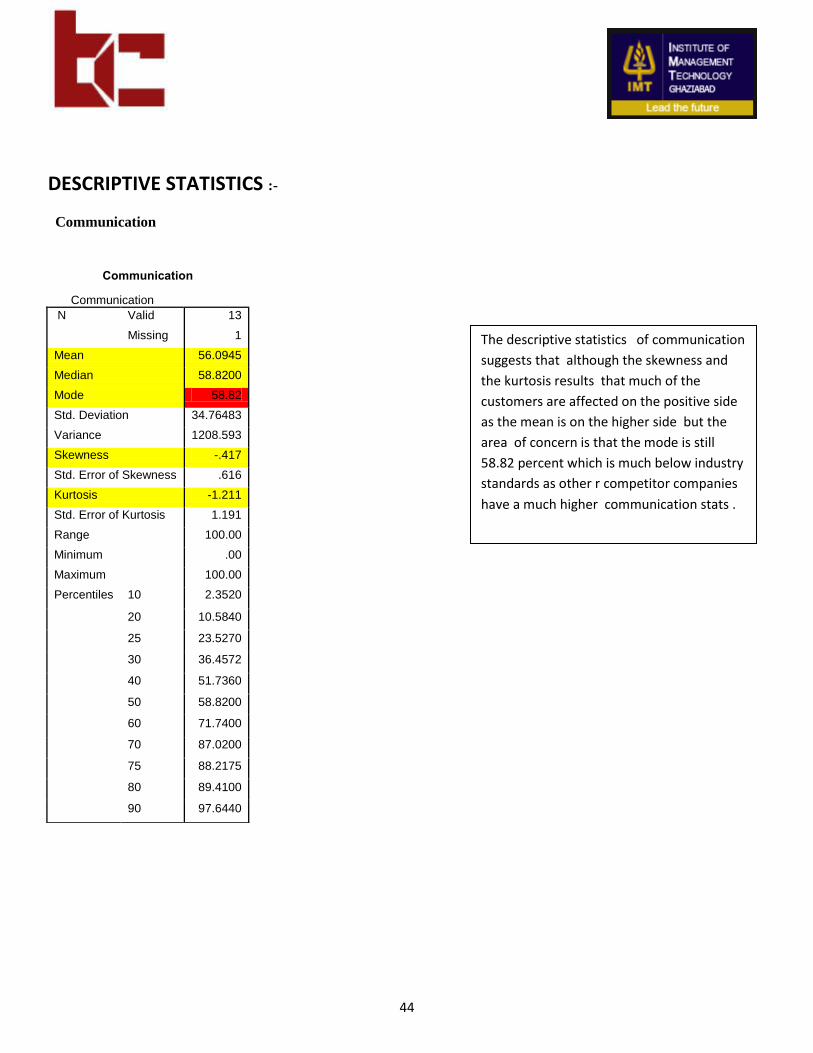
DESCRIPTIVE STATISTICS :-
Communication
Communication
Communication
N Valid 13
Missing 1
Mean 56.0945
Median 58.8200
Mode 58.82
Std. Deviation 34.76483
Variance 1208.593
Skewness -.417
Std. Error of Skewness .616
Kurtosis -1.211
Std. Error of Kurtosis 1.191
Range 100.00
Minimum .00
Maximum 100.00
Percentiles 10 2.3520
20 10.5840
25 23.5270
30 36.4572
40 51.7360
50 58.8200
60 71.7400
70 87.0200
75 88.2175
80 89.4100
90 97.6440
The descriptive statistics of communication
suggests that although the skewness and
the kurtosis results that much of the
customers are affected on the positive side
as the mean is on the higher side but the
area of concern is that the mode is still
58.82 percent which is much below industry
standards as other r competitor companies
have a much higher communication stats .

45
Quality of product:
quality of product
product quality
N Valid 13
Missing 1
Mean 53.8462
Median 100.0000
Mode 100.00
Std. Deviation 51.88745
Variance 2692.308
Skewness -.175
Std. Error of Skewness
.616
Kurtosis -2.364
Std. Error of Kurtosis 1.191
Range 100.00
Minimum .00
Maximum 100.00
Percentiles 10 .0000
20 .0000
25 .0000
30 .0000
40 .0000
50 100.0000
60 100.0000
70 100.0000
75 100.0000
80 100.0000
90 100.0000
The Quality of product did not have
optimum no. of questions through which it
can be properly analyzed but this certainly
provides us with a trend as to how the
customers perceive the product. The mean
is very low at around 53.38 percent which
suggests that the product is just to their
expectations and they need improvements
on this. The negative skewness and the
negative kurtosis just give an idea that
many of the customers are feeling the
same kind of quality which is hovering
around 53 percent .
46
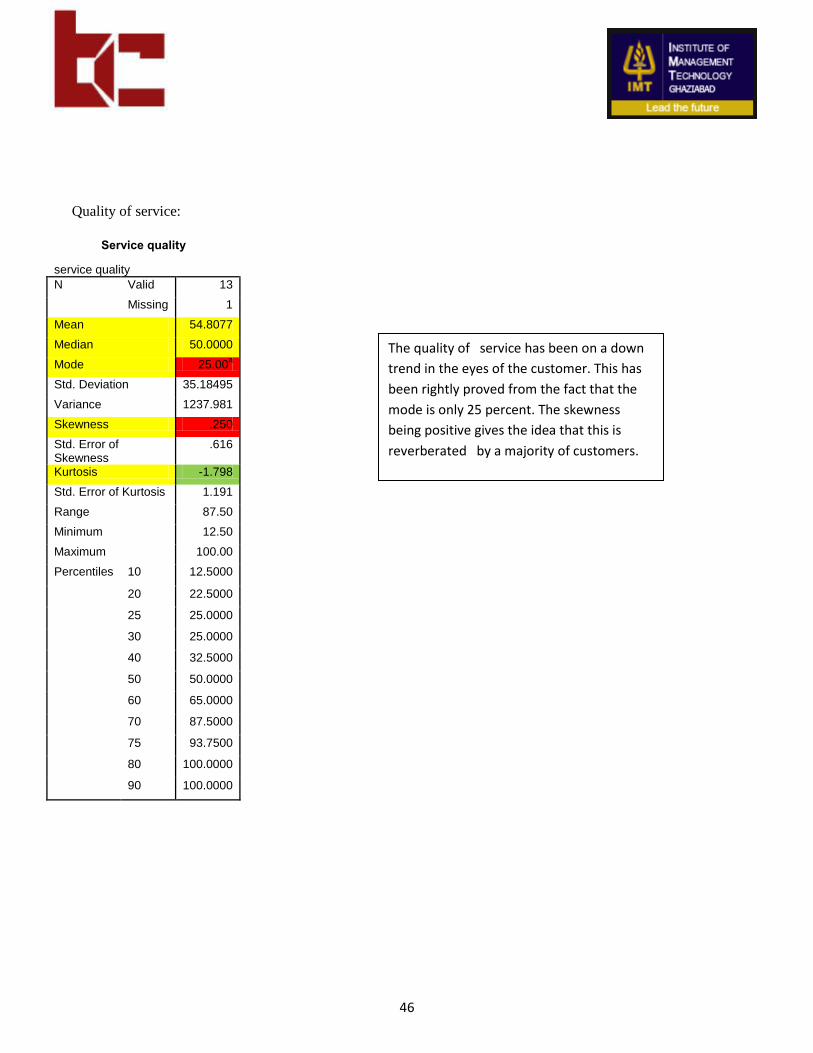
Quality of service:
Service quality
service quality
N Valid 13
Missing 1
Mean 54.8077
Median 50.0000
Mode 25.00a
Std. Deviation 35.18495
Variance 1237.981
Skewness .250
Std. Error of Skewness
.616
Kurtosis -1.798
Std. Error of Kurtosis 1.191
Range 87.50
Minimum 12.50
Maximum 100.00
Percentiles 10 12.5000
20 22.5000
25 25.0000
30 25.0000
40 32.5000
50 50.0000
60 65.0000
70 87.5000
75 93.7500
80 100.0000
90 100.0000
The quality of service has been on a down
trend in the eyes of the customer. This has
been rightly proved from the fact that the
mode is only 25 percent. The skewness
being positive gives the idea that this is
reverberated by a majority of customers.

47
Performance:-
Performance
Performance
N Valid 13
Missing 1
Mean 38.4615
Median 50.0000
Mode .00
Std. Deviation 41.60251
Variance 1730.769
Skewness .498
Std. Error of Skewness
.616
Kurtosis -1.339
Std. Error of Kurtosis 1.191
Range 100.00
Minimum .00
Maximum 100.00
Percentiles 10 .0000
20 .0000
25 .0000
30 .0000
40 .0000
50 50.0000
60 50.0000
70 50.0000
75 75.0000
80 100.0000
90 100.0000
The mode is 0 percent which means that the
maximum no. of customers feel that the
performance of the product is nil. The
positive skewness only reinforces the fact.
(The standard deviation is high because of
the less no. of responses and the low no. of
questions which were used to test the
parameter of performance .
48
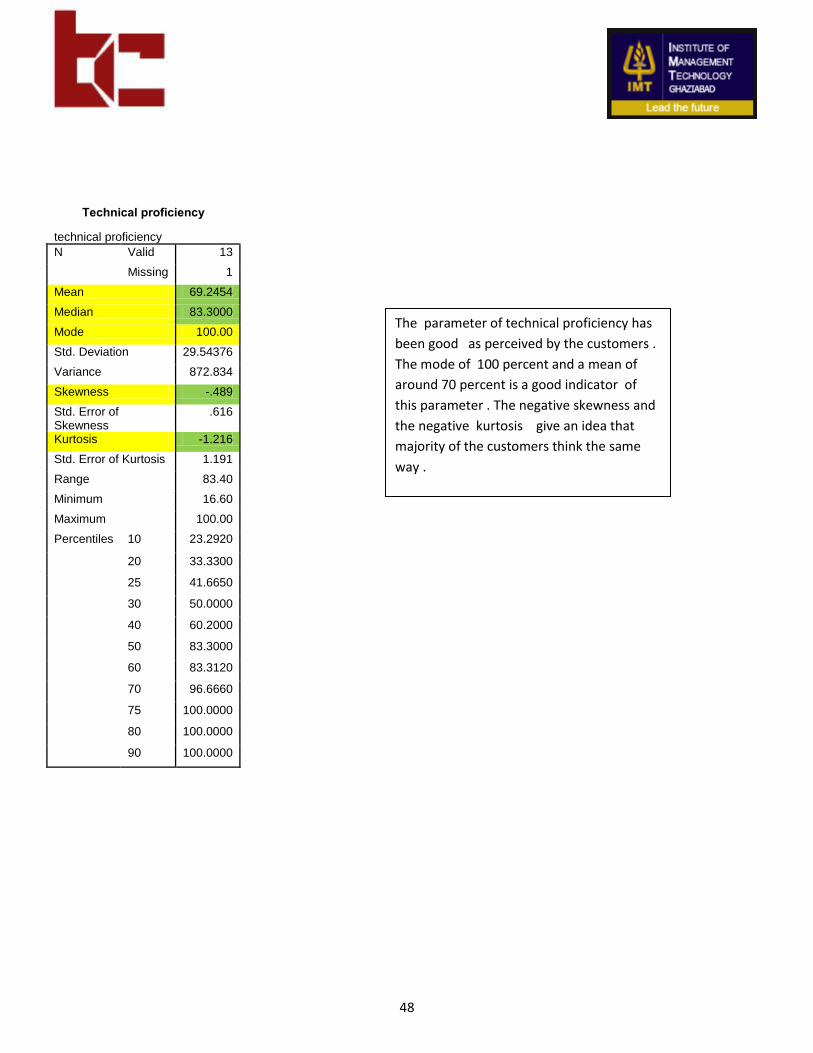
Technical proficiency
technical proficiency
N Valid 13
Missing 1
Mean 69.2454
Median 83.3000
Mode 100.00
Std. Deviation 29.54376
Variance 872.834
Skewness -.489
Std. Error of Skewness
.616
Kurtosis -1.216
Std. Error of Kurtosis 1.191
Range 83.40
Minimum 16.60
Maximum 100.00
Percentiles 10 23.2920
20 33.3300
25 41.6650
30 50.0000
40 60.2000
50 83.3000
60 83.3120
70 96.6660
75 100.0000
80 100.0000
90 100.0000
The parameter of technical proficiency has
been good as perceived by the customers .
The mode of 100 percent and a mean of
around 70 percent is a good indicator of
this parameter . The negative skewness and
the negative kurtosis give an idea that
majority of the customers think the same
way .
49
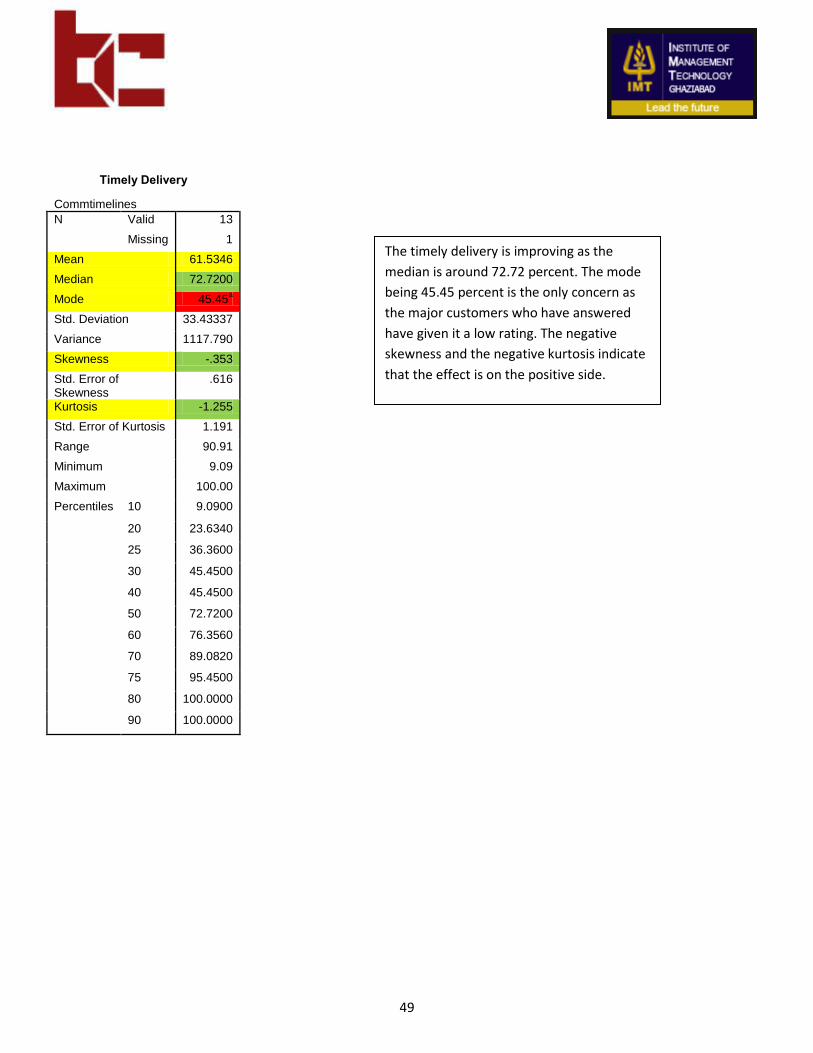
Timely Delivery
Commtimelines
N Valid 13
Missing 1
Mean 61.5346
Median 72.7200
Mode 45.45a
Std. Deviation 33.43337
Variance 1117.790
Skewness -.353
Std. Error of Skewness
.616
Kurtosis -1.255
Std. Error of Kurtosis 1.191
Range 90.91
Minimum 9.09
Maximum 100.00
Percentiles 10 9.0900
20 23.6340
25 36.3600
30 45.4500
40 45.4500
50 72.7200
60 76.3560
70 89.0820
75 95.4500
80 100.0000
90 100.0000
The timely delivery is improving as the
median is around 72.72 percent. The mode
being 45.45 percent is the only concern as
the major customers who have answered
have given it a low rating. The negative
skewness and the negative kurtosis indicate
that the effect is on the positive side.
50
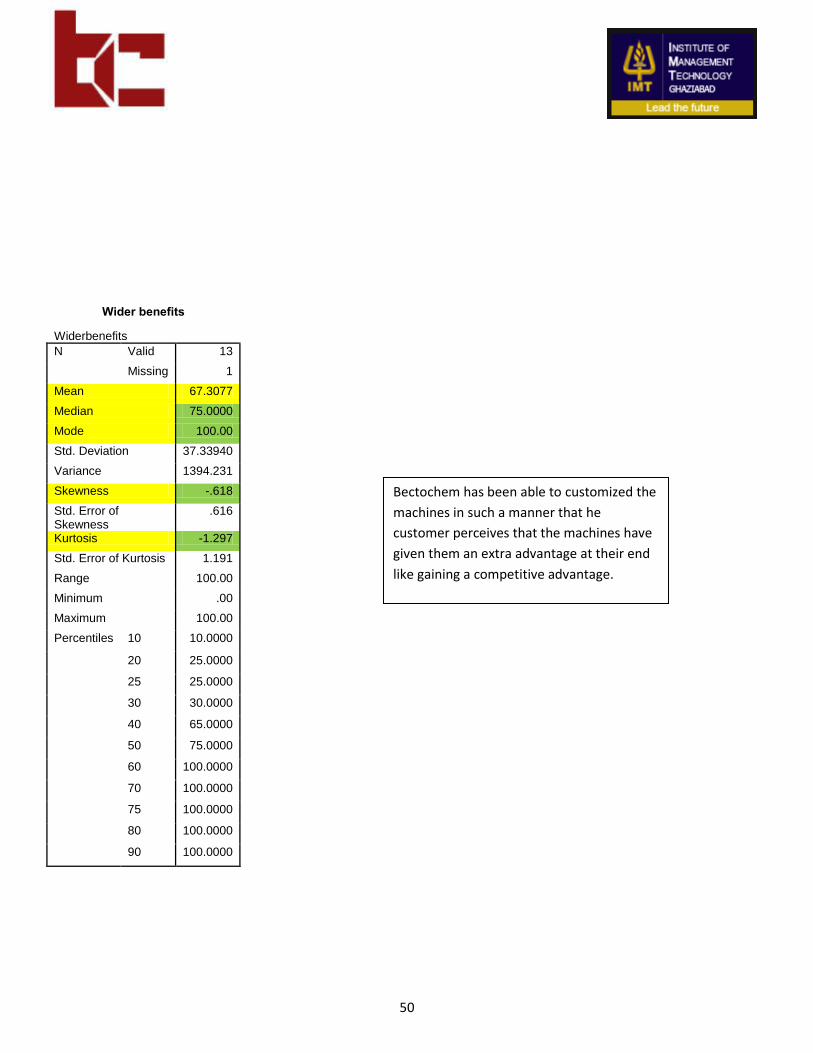
Wider benefits
Widerbenefits
N Valid 13
Missing 1
Mean 67.3077
Median 75.0000
Mode 100.00
Std. Deviation 37.33940
Variance 1394.231
Skewness -.618
Std. Error of Skewness
.616
Kurtosis -1.297
Std. Error of Kurtosis 1.191
Range 100.00
Minimum .00
Maximum 100.00
Percentiles 10 10.0000
20 25.0000
25 25.0000
30 30.0000
40 65.0000
50 75.0000
60 100.0000
70 100.0000
75 100.0000
80 100.0000
90 100.0000
Bectochem has been able to customized the
machines in such a manner that he
customer perceives that the machines have
given them an extra advantage at their end
like gaining a competitive advantage.
51
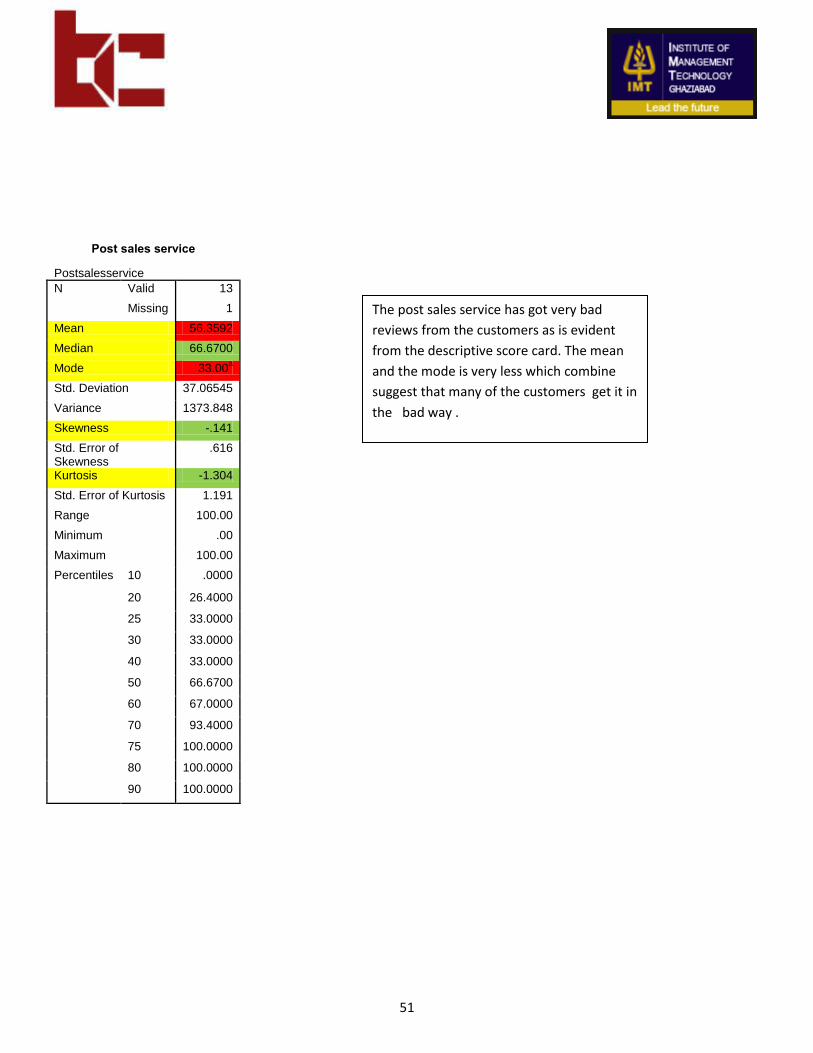
Post sales service
Postsalesservice
N Valid 13
Missing 1
Mean 56.3592
Median 66.6700
Mode 33.00a
Std. Deviation 37.06545
Variance 1373.848
Skewness -.141
Std. Error of Skewness
.616
Kurtosis -1.304
Std. Error of Kurtosis 1.191
Range 100.00
Minimum .00
Maximum 100.00
Percentiles 10 .0000
20 26.4000
25 33.0000
30 33.0000
40 33.0000
50 66.6700
60 67.0000
70 93.4000
75 100.0000
80 100.0000
90 100.0000
The post sales service has got very bad
reviews from the customers as is evident
from the descriptive score card. The mean
and the mode is very less which combine
suggest that many of the customers get it in
the bad way .
52
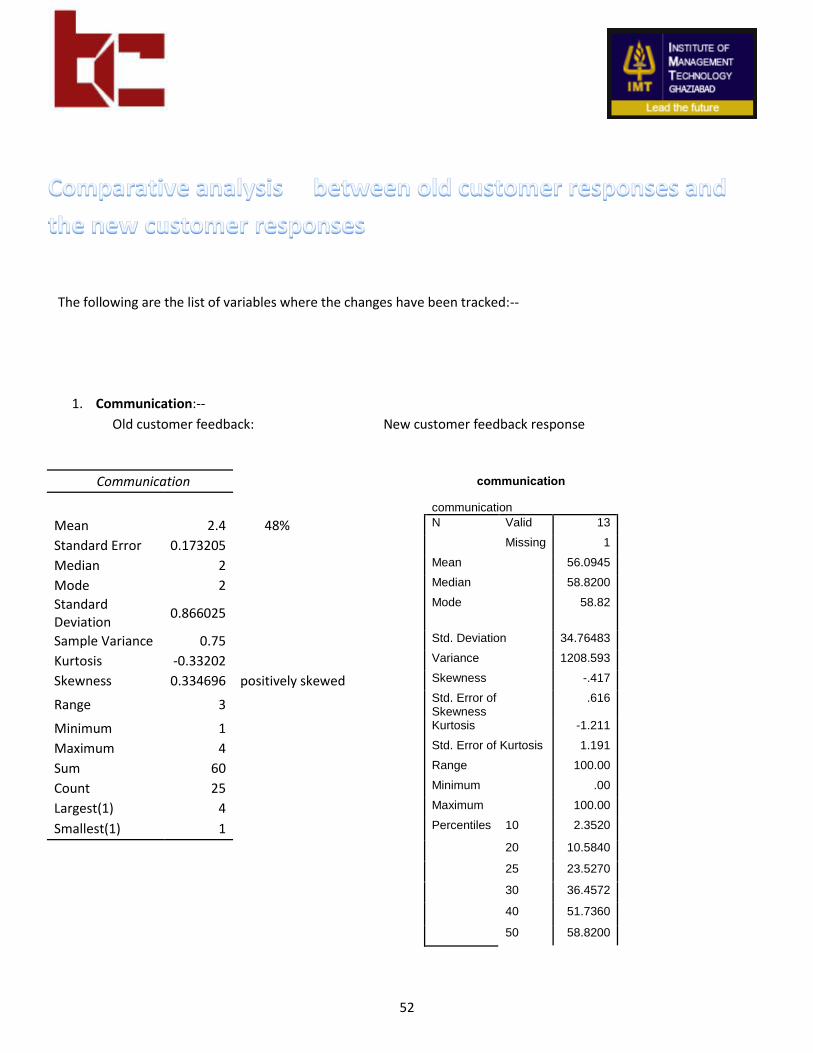
The following are the list of variables where the changes have been tracked:--
1. Communication:--
Old customer feedback: New customer feedback response
Communication
communication
communication
Mean 2.4 48%
N Valid 13
Standard Error 0.173205
Missing 1
Median 2
Mean 56.0945
Mode 2
Median 58.8200
Standard Deviation
0.866025
Mode 58.82
Sample Variance 0.75
Std. Deviation 34.76483
Kurtosis -0.33202
Variance 1208.593
Skewness 0.334696 positively skewed
Skewness -.417
Range 3
Std. Error of Skewness
.616
Minimum 1
Kurtosis -1.211
Maximum 4
Std. Error of Kurtosis 1.191
Sum 60
Range 100.00
Count 25
Minimum .00
Largest(1) 4
Maximum 100.00
Smallest(1) 1
Percentiles 10 2.3520
20 10.5840
25 23.5270
30 36.4572
40 51.7360
50 58.8200

53
60 71.7400
70 87.0200
75 88.2175
80 89.4100
90 97.6440
This clearly shows that we are improving on the communication grounds as the overall mean has increase from 48 to 56
% with a skewness change from +ve to -ve . This proves the customer has seen an improvement of 8 percent and many
customers have seen it.
2. Post sales service: the quality of post sales service has shown some trends over the years. This can be proved
from the following numerical analysis.
New customer satisfaction form Old customer satisfaction form
Statistics
Postsalesservice
N Valid 13
Column1
Missing 1
Mean 56.3592
Mean 2.48 50%
Median 66.6700
Standard Error 0.200998
Mode 33.00a
Median 2
Std. Deviation 37.06545
Mode 2
Variance 1373.848
Standard Deviation 1.004988
Skewness -.141
Sample Variance 1.01
Std. Error of Skewness
.616
Kurtosis 0.252126
Kurtosis -1.304
Skewness -0.34224 negatively skewed
Std. Error of Kurtosis 1.191
Range 4
Range 100.00
Minimum 0
Minimum .00
Maximum 4
Maximum 100.00
Sum 62
Percentiles 10 .0000
Count 25
20 26.4000
Largest(1) 4
25 33.0000
Smallest(1) 0
30 33.0000
54
40 33.0000
50 66.6700
60 67.0000
70 93.4000
75 100.0000
80 100.0000
90 100.0000
We can clearly see the mean increasing from 50% to 56% and the skewness has also increased from -.31 to -.14. This
shows that although it is still on the higher side but now it hasn’t been properly dispatched to all the clients.
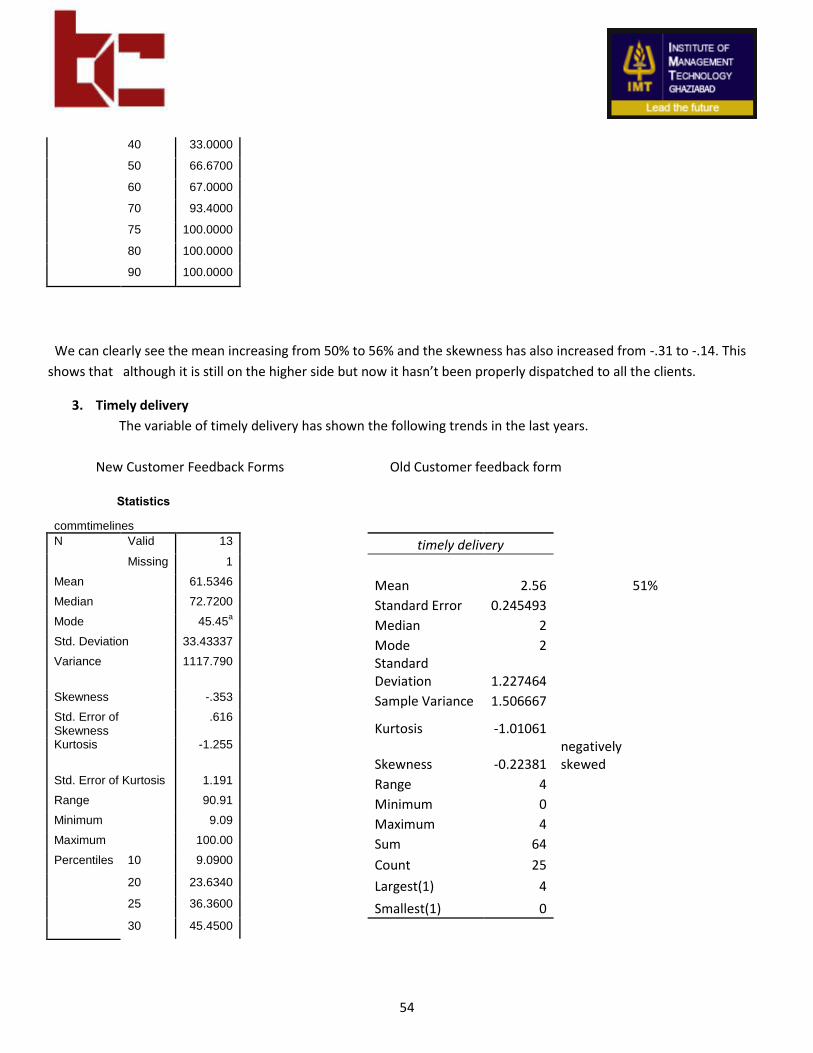
3. Timely delivery
The variable of timely delivery has shown the following trends in the last years.
New Customer Feedback Forms Old Customer feedback form
Statistics
commtimelines
N Valid 13
timely delivery
Missing 1
Mean 61.5346
Mean 2.56 51%
Median 72.7200
Standard Error 0.245493
Mode 45.45a
Median 2
Std. Deviation 33.43337
Mode 2
Variance 1117.790
Standard Deviation 1.227464
Skewness -.353
Sample Variance 1.506667
Std. Error of Skewness
.616
Kurtosis -1.01061
Kurtosis -1.255
Skewness -0.22381
negatively skewed
Std. Error of Kurtosis 1.191
Range 4
Range 90.91
Minimum 0
Minimum 9.09
Maximum 4
Maximum 100.00
Sum 64
Percentiles 10 9.0900
Count 25
20 23.6340
Largest(1) 4
25 36.3600
Smallest(1) 0
30 45.4500
55
40 45.4500
50 72.7200
60 76.3560
70 89.0820
75 95.4500
80 100.0000
90 100.0000
This variable shows a maximum growth of around 11 % in mean and also the media and mode has increase from 50%
to 72%. This is a remarkable increase. The skewness has also become more negative leading to a conclusion that this
variable has affected many a customers.
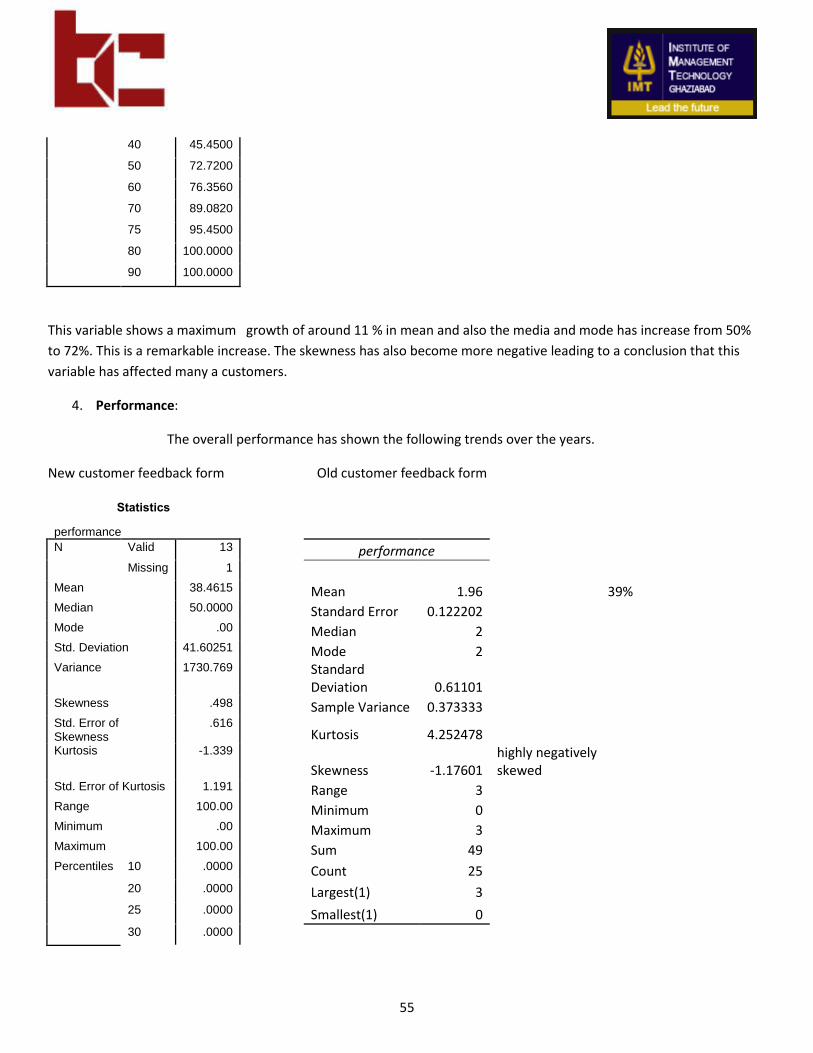
4. Performance:
The overall performance has shown the following trends over the years.
New customer feedback form Old customer feedback form
Statistics
performance
N Valid 13
performance
Missing 1
Mean 38.4615
Mean 1.96 39%
Median 50.0000
Standard Error 0.122202
Mode .00
Median 2
Std. Deviation 41.60251
Mode 2
Variance 1730.769
Standard Deviation 0.61101
Skewness .498
Sample Variance 0.373333
Std. Error of Skewness
.616
Kurtosis 4.252478
Kurtosis -1.339
Skewness -1.17601
highly negatively skewed
Std. Error of Kurtosis 1.191
Range 3
Range 100.00
Minimum 0
Minimum .00
Maximum 3
Maximum 100.00
Sum 49
Percentiles 10 .0000
Count 25
20 .0000
Largest(1) 3
25 .0000
Smallest(1) 0
30 .0000
56
40 .0000
50 50.0000
60 50.0000
70 50.0000
75 75.0000
80 100.0000
90 100.0000
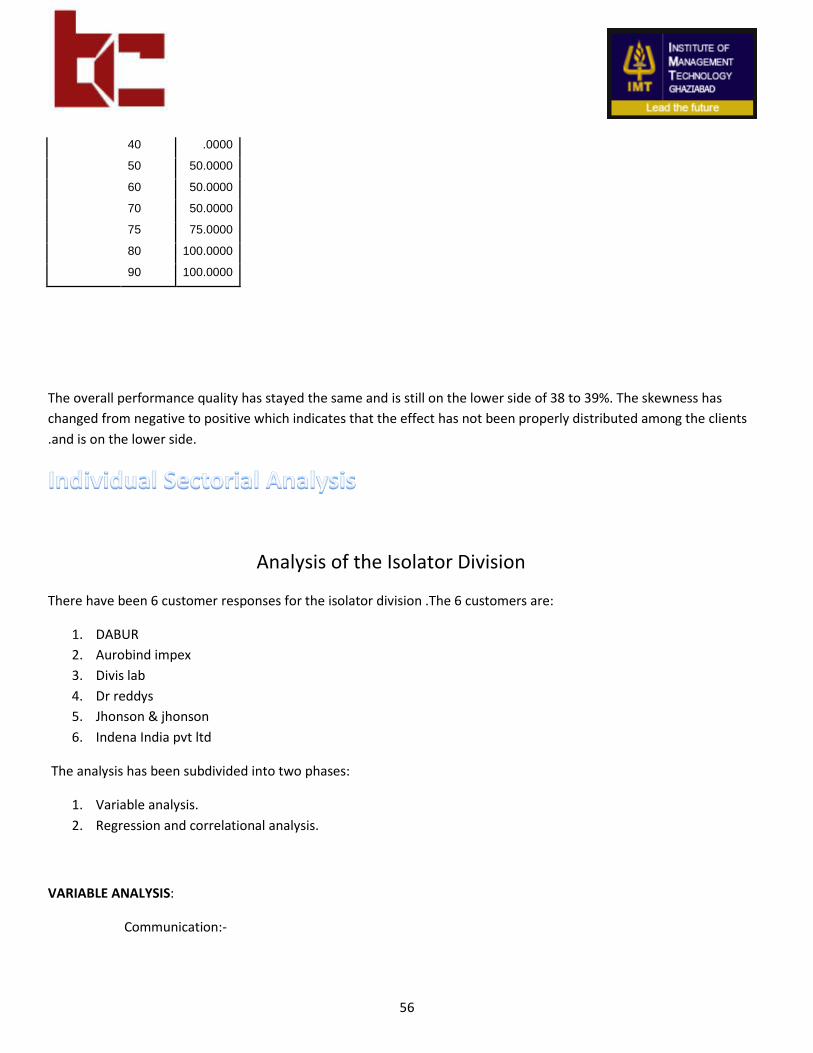
The overall performance quality has stayed the same and is still on the lower side of 38 to 39%. The skewness has
changed from negative to positive which indicates that the effect has not been properly distributed among the clients
.and is on the lower side.
Analysis of the Isolator Division
There have been 6 customer responses for the isolator division .The 6 customers are:
1. DABUR
2. Aurobind impex
3. Divis lab
4. Dr reddys
5. Jhonson & jhonson
6. Indena India pvt ltd
The analysis has been subdivided into two phases:
1. Variable analysis.
2. Regression and correlational analysis.
VARIABLE ANALYSIS:
Communication:-
57
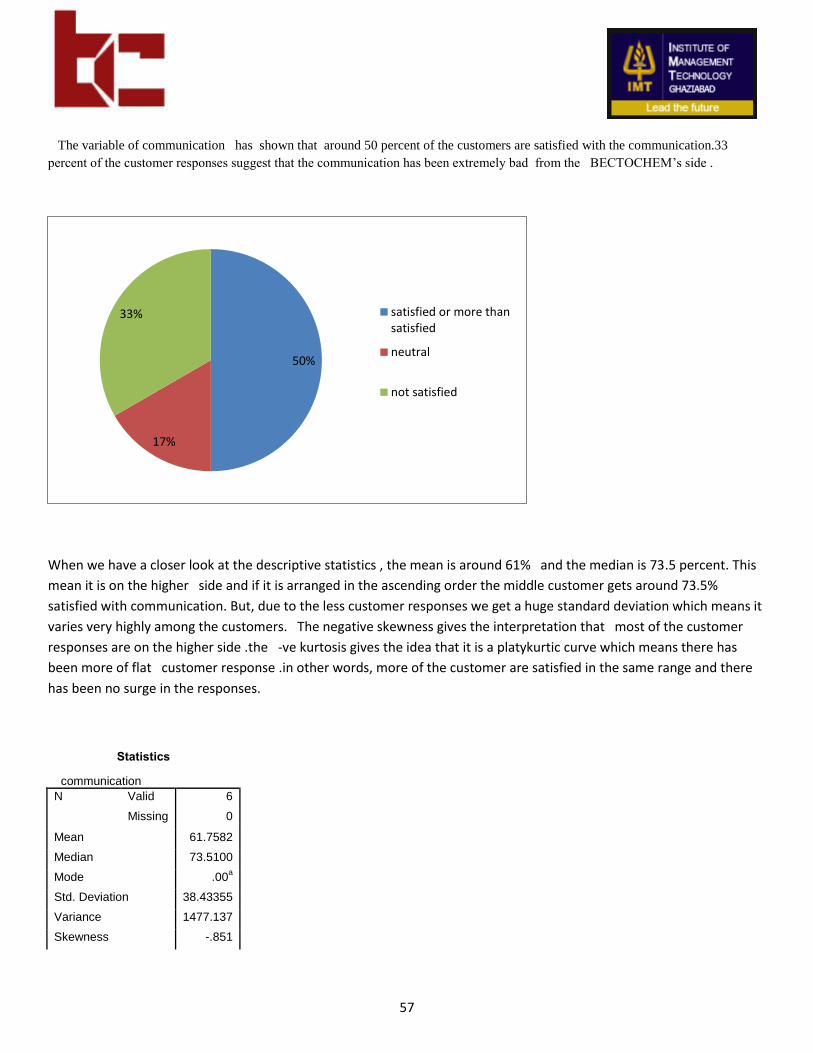
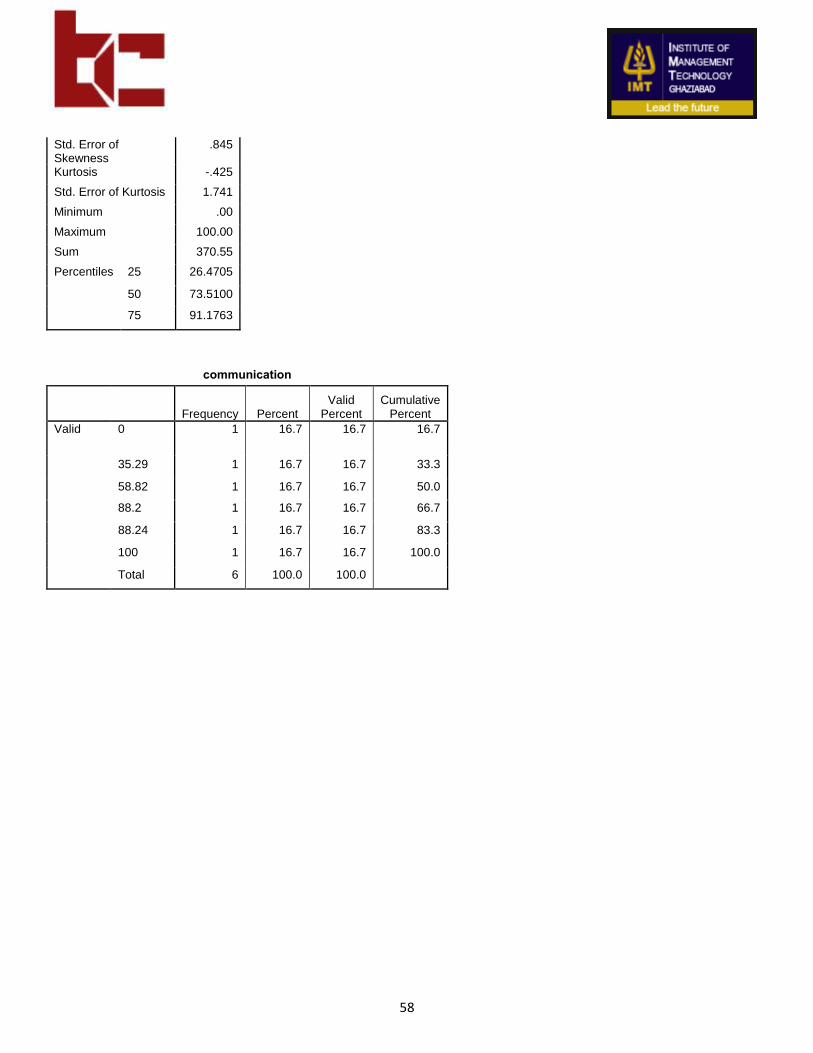
The variable of communication has shown that around 50 percent of the customers are satisfied with the communication.33
percent of the customer responses suggest that the communication has been extremely bad from the BECTOCHEM’s side .
When we have a closer look at the descriptive statistics , the mean is around 61% and the median is 73.5 percent. This
mean it is on the higher side and if it is arranged in the ascending order the middle customer gets around 73.5%
satisfied with communication. But, due to the less customer responses we get a huge standard deviation which means it
varies very highly among the customers. The negative skewness gives the interpretation that most of the customer
responses are on the higher side .the -ve kurtosis gives the idea that it is a platykurtic curve which means there has
been more of flat customer response .in other words, more of the customer are satisfied in the same range and there
has been no surge in the responses.
Statistics
communication
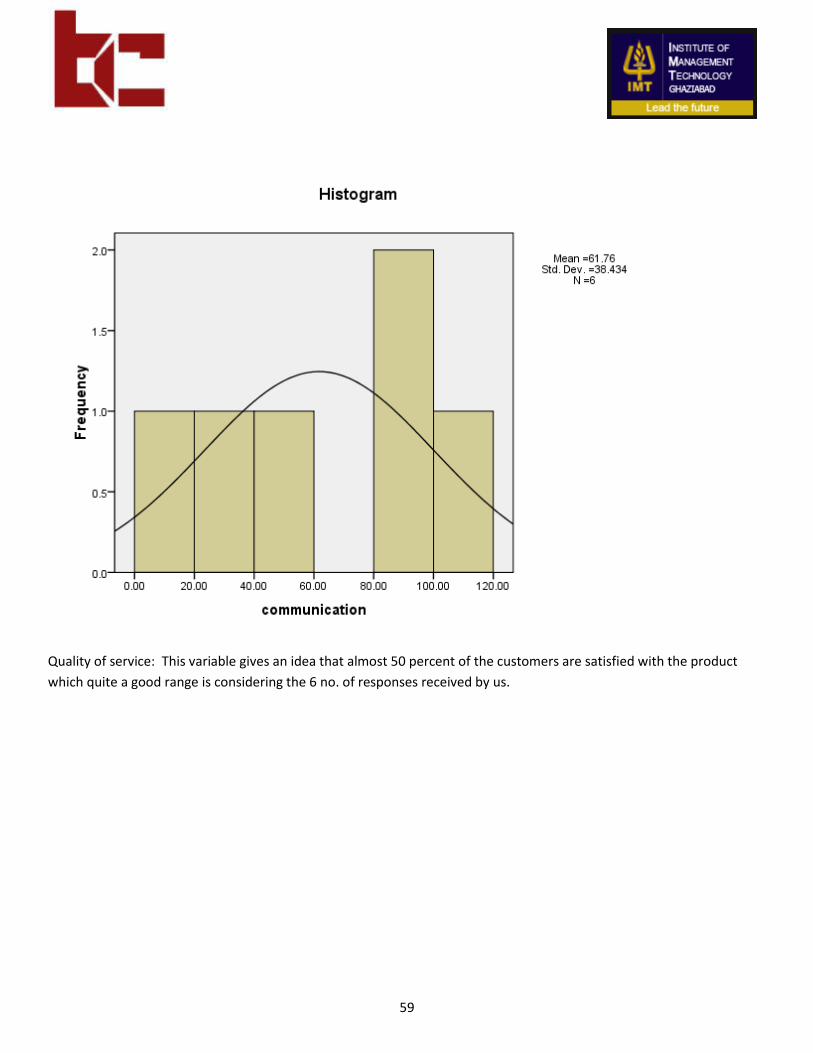
N Valid 6
Missing 0
Mean 61.7582
Median 73.5100
Mode .00a
Std. Deviation 38.43355
Variance 1477.137
Skewness -.851
50%
17%
33% satisfied or more thansatisfied
neutral
not satisfied
58
Std. Error of Skewness
.845
Kurtosis -.425
Std. Error of Kurtosis 1.741
Minimum .00
Maximum 100.00
Sum 370.55
Percentiles 25 26.4705
50 73.5100
75 91.1763
communication
Frequency Percent
Valid Percent
Cumulative Percent
Valid 0 1 16.7 16.7 16.7
35.29 1 16.7 16.7 33.3
58.82 1 16.7 16.7 50.0
88.2 1 16.7 16.7 66.7
88.24 1 16.7 16.7 83.3
100 1 16.7 16.7 100.0
Total 6 100.0 100.0
59
Quality of service: This variable gives an idea that almost 50 percent of the customers are satisfied with the product
which quite a good range is considering the 6 no. of responses received by us.
60
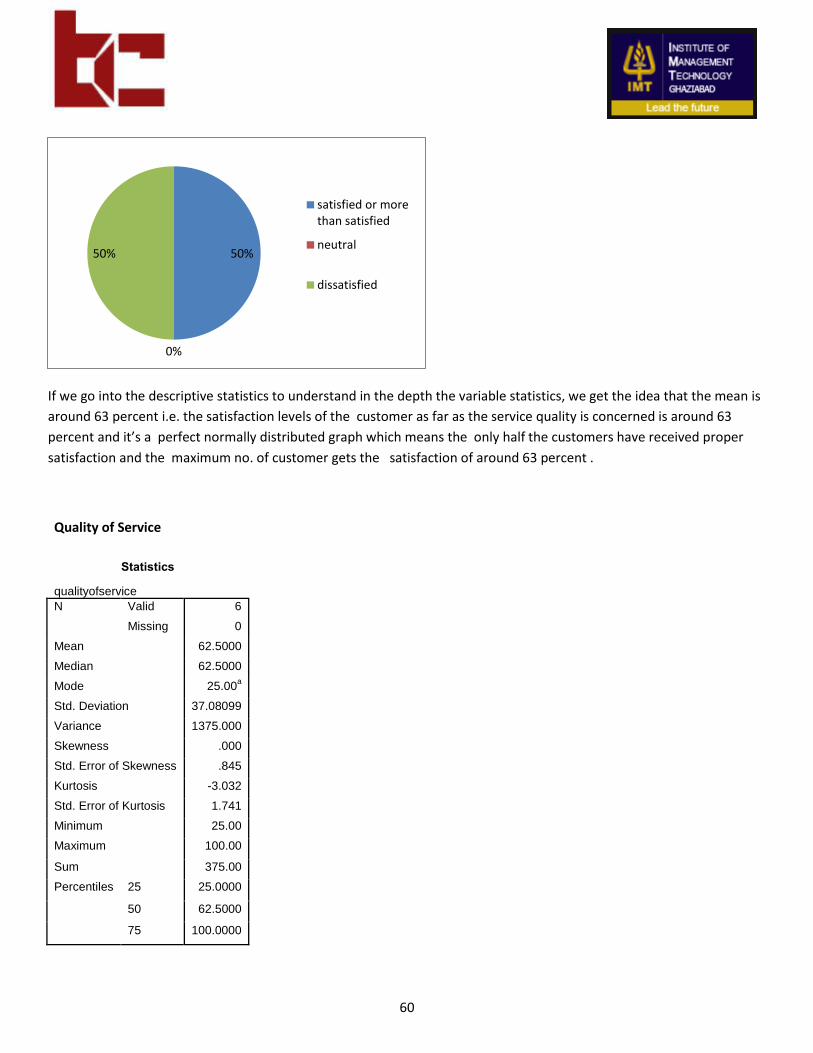
If we go into the descriptive statistics to understand in the depth the variable statistics, we get the idea that the mean is
around 63 percent i.e. the satisfaction levels of the customer as far as the service quality is concerned is around 63
percent and it’s a perfect normally distributed graph which means the only half the customers have received proper
satisfaction and the maximum no. of customer gets the satisfaction of around 63 percent .
Quality of Service
Statistics
qualityofservice
N Valid 6
Missing 0
Mean 62.5000
Median 62.5000
Mode 25.00a
Std. Deviation 37.08099
Variance 1375.000
Skewness .000
Std. Error of Skewness .845
Kurtosis -3.032
Std. Error of Kurtosis 1.741
Minimum 25.00
Maximum 100.00
Sum 375.00
Percentiles 25 25.0000
50 62.5000
75 100.0000
50%
0%
50%
satisfied or morethan satisfied
neutral
dissatisfied
61
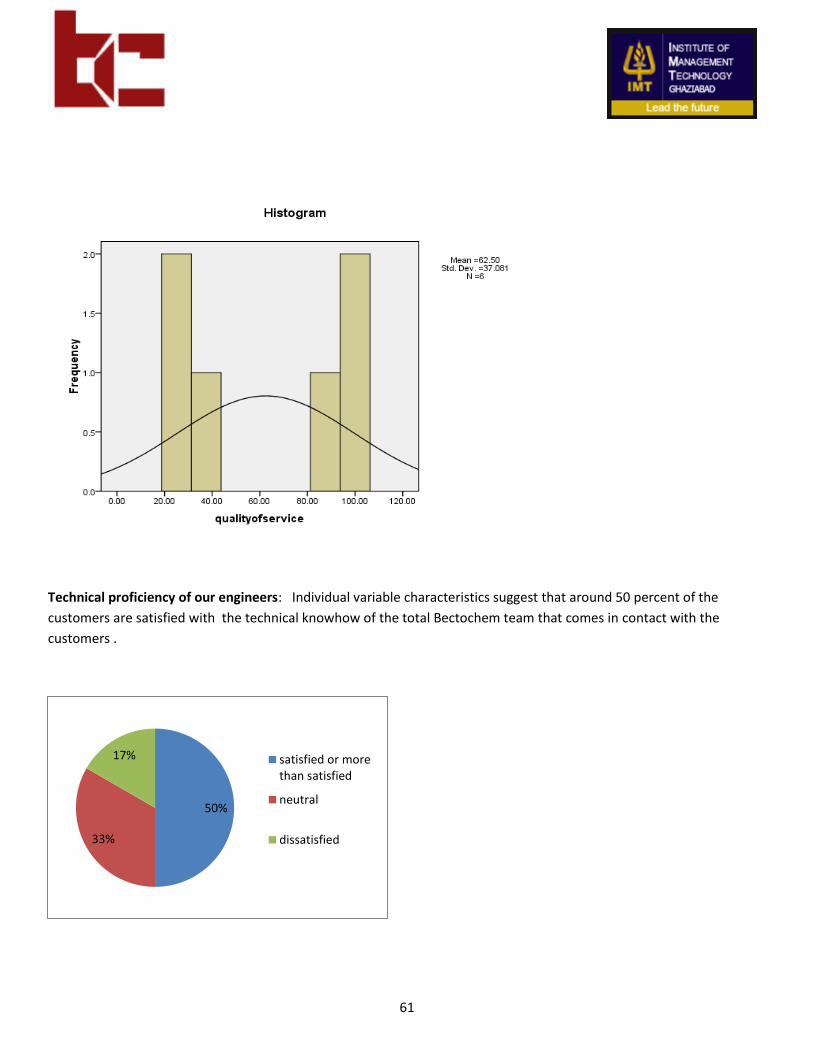
Technical proficiency of our engineers: Individual variable characteristics suggest that around 50 percent of the
customers are satisfied with the technical knowhow of the total Bectochem team that comes in contact with the
customers .
50%
33%
17% satisfied or morethan satisfied
neutral
dissatisfied
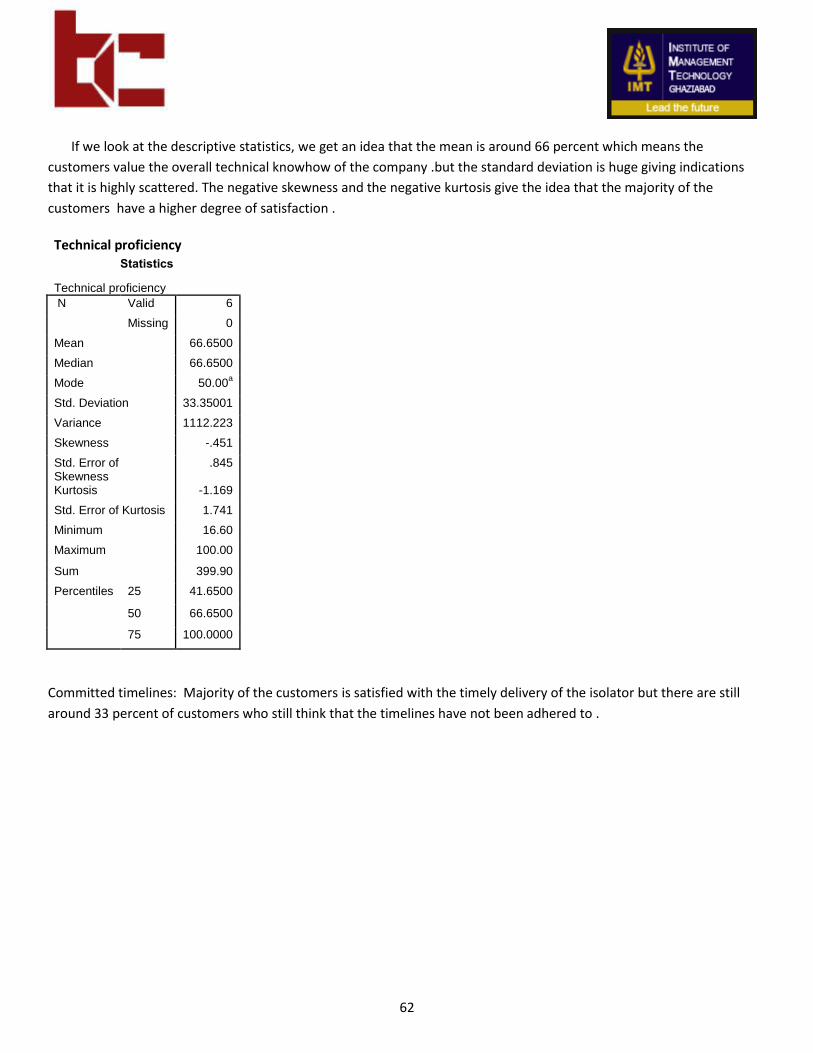
62
If we look at the descriptive statistics, we get an idea that the mean is around 66 percent which means the
customers value the overall technical knowhow of the company .but the standard deviation is huge giving indications
that it is highly scattered. The negative skewness and the negative kurtosis give the idea that the majority of the
customers have a higher degree of satisfaction .
Technical proficiency Statistics
Technical proficiency
N Valid 6
Missing 0
Mean 66.6500
Median 66.6500
Mode 50.00a
Std. Deviation 33.35001
Variance 1112.223
Skewness -.451
Std. Error of Skewness
.845
Kurtosis -1.169
Std. Error of Kurtosis 1.741
Minimum 16.60
Maximum 100.00
Sum 399.90
Percentiles 25 41.6500
50 66.6500
75 100.0000
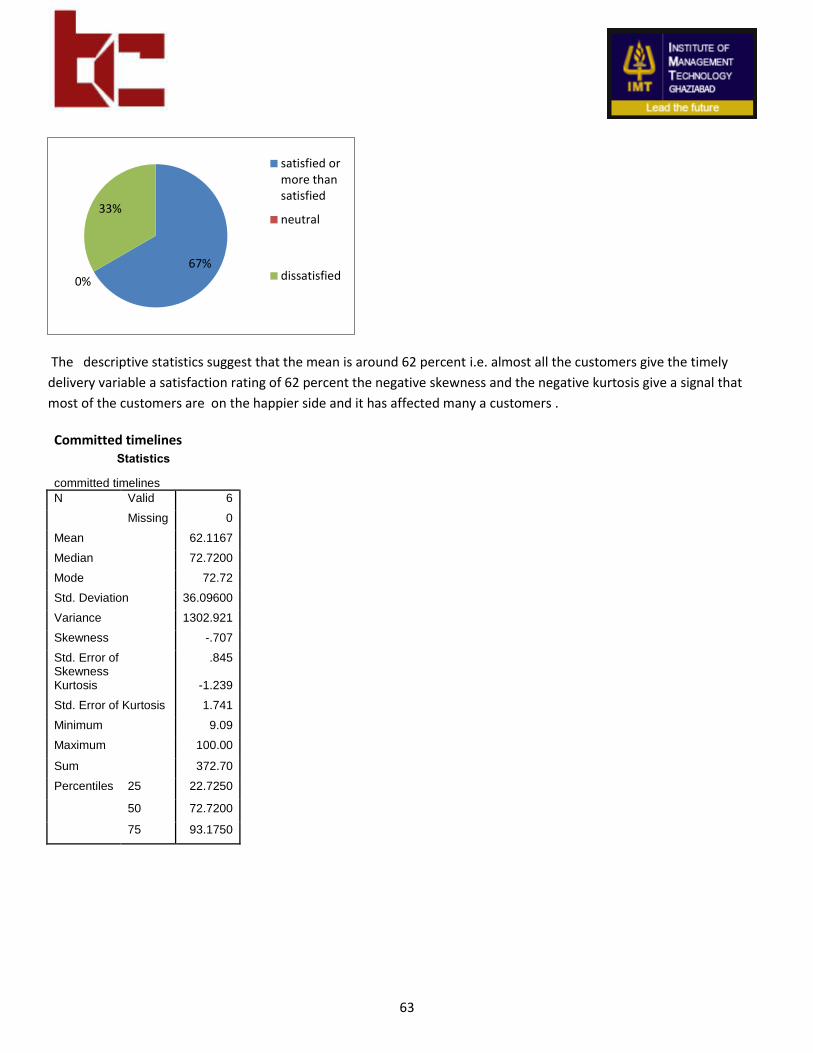
Committed timelines: Majority of the customers is satisfied with the timely delivery of the isolator but there are still
around 33 percent of customers who still think that the timelines have not been adhered to .
63
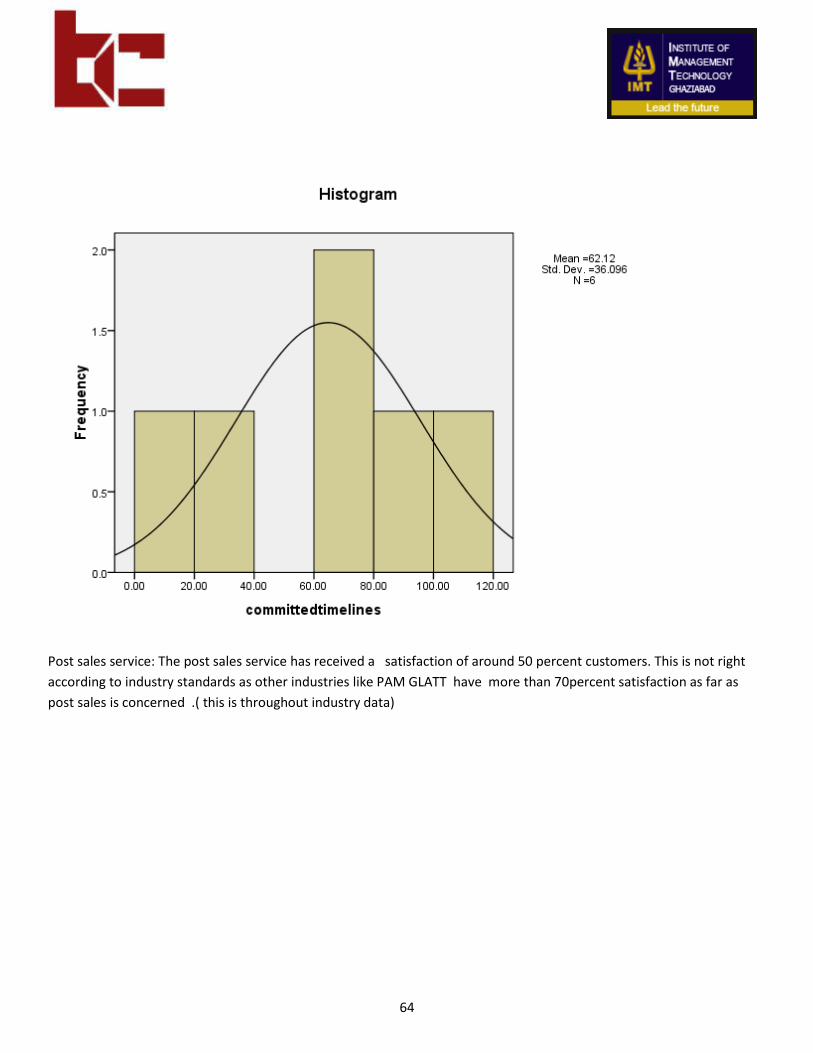
The descriptive statistics suggest that the mean is around 62 percent i.e. almost all the customers give the timely
delivery variable a satisfaction rating of 62 percent the negative skewness and the negative kurtosis give a signal that
most of the customers are on the happier side and it has affected many a customers .
Committed timelines Statistics
committed timelines
N Valid 6
Missing 0
Mean 62.1167
Median 72.7200
Mode 72.72
Std. Deviation 36.09600
Variance 1302.921
Skewness -.707
Std. Error of Skewness
.845
Kurtosis -1.239
Std. Error of Kurtosis 1.741
Minimum 9.09
Maximum 100.00
Sum 372.70
Percentiles 25 22.7250
50 72.7200
75 93.1750
67%
0%
33%
satisfied ormore thansatisfied
neutral
dissatisfied
64
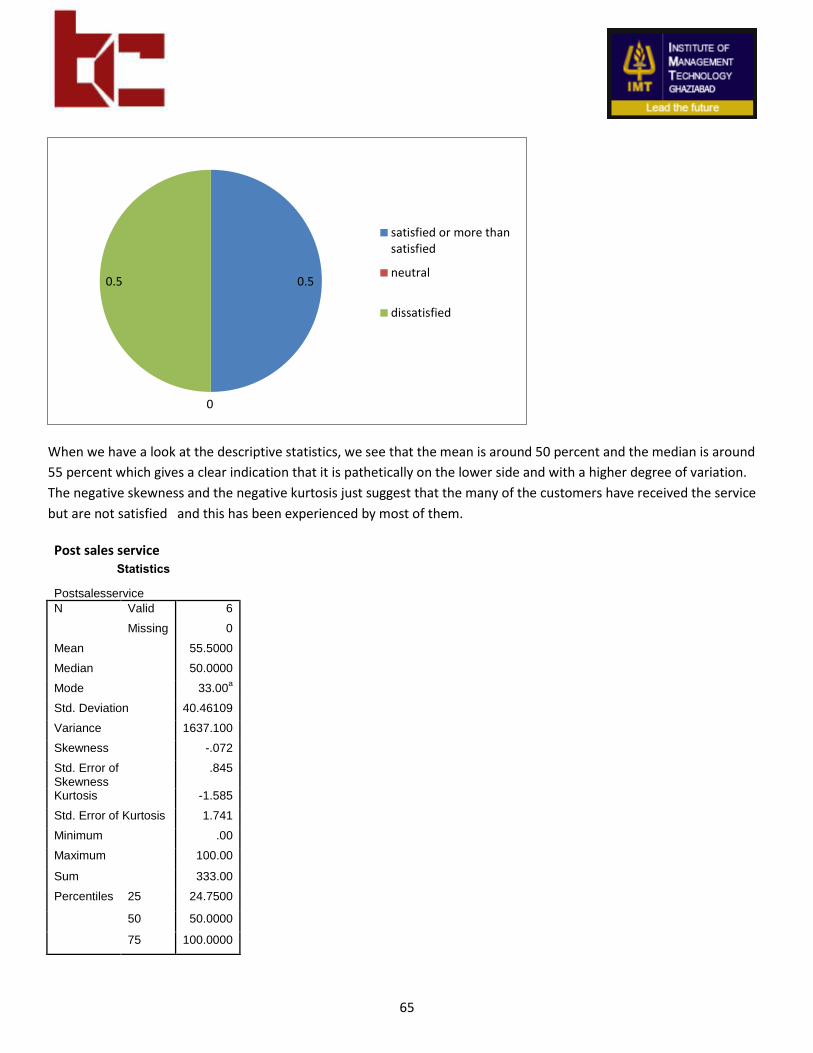
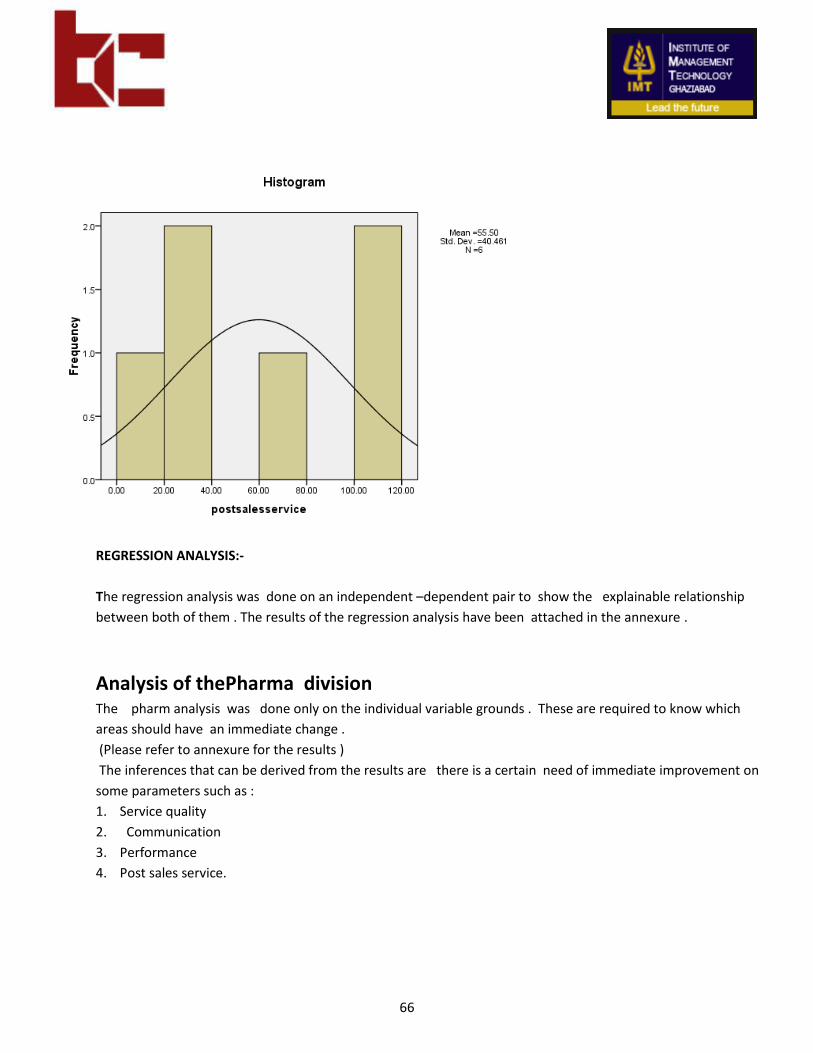
Post sales service: The post sales service has received a satisfaction of around 50 percent customers. This is not right
according to industry standards as other industries like PAM GLATT have more than 70percent satisfaction as far as
post sales is concerned .( this is throughout industry data)
65
When we have a look at the descriptive statistics, we see that the mean is around 50 percent and the median is around
55 percent which gives a clear indication that it is pathetically on the lower side and with a higher degree of variation.
The negative skewness and the negative kurtosis just suggest that the many of the customers have received the service
but are not satisfied and this has been experienced by most of them.
Post sales service Statistics
Postsalesservice
N Valid 6
Missing 0
Mean 55.5000
Median 50.0000
Mode 33.00a
Std. Deviation 40.46109
Variance 1637.100
Skewness -.072
Std. Error of Skewness
.845
Kurtosis -1.585
Std. Error of Kurtosis 1.741
Minimum .00
Maximum 100.00
Sum 333.00
Percentiles 25 24.7500
50 50.0000
75 100.0000
0.5
0
0.5
satisfied or more thansatisfied
neutral
dissatisfied
66
REGRESSION ANALYSIS:-
The regression analysis was done on an independent –dependent pair to show the explainable relationship
between both of them . The results of the regression analysis have been attached in the annexure .
Analysis of thePharma division The pharm analysis was done only on the individual variable grounds . These are required to know which
areas should have an immediate change .
(Please refer to annexure for the results )
The inferences that can be derived from the results are there is a certain need of immediate improvement on
some parameters such as :
1. Service quality
2. Communication
3. Performance
4. Post sales service.

67
After taking due considerations and the overall data that needs to be captured in the next feedback form ,
a form has been developed which includes all the variables and the factors involving it .
The variables needed to calculate the net promoter scores have also been taken into account .
The link is :-
http://edu.surveygizmo.com/s3/523753/BECTOTOCHEM-CUSTOMER-SATISFACTION-SURVEY
A product buying a motivation experience survey questionnaire has also been designed as this tracks the
consumer preferences and their behavior during the time of placing the order .
The link is :
https://docs.google.com/document/d/1aInIDSpze3VSFbpLpyz8mG3xTM2nqAngoPIwQUw1P0A/edit
?hl=en#
The associated doc unmet is :-
1. In the past year, which of the BECTOCHEM products have you purchased?
a) RMG
b) FBD
c) STERILE /FLEXIBLE/ANDF DISCHARGE/ AIRJET MILL ISOLATOR
d) OTHERS ( PLEASE SPECIFY )
2. For how long have you used BECTOCHEM products/services?
a) LESS THAN OR EQAUL TO 1 YEAR
b) 1 YEAR TO 3 YEARS.
c) MORE THAN 3 YEARS
3. How satisfied were you overall with the purchasing experience from your last purchase from
BECTOCHEM?
a) VERY SATISFIED
b) SATISFIED
c) NEITHER SATISFIED NOR DISSATISFIED
d) DISSATISFIED
e) VERY DISSATISFIED
68
.
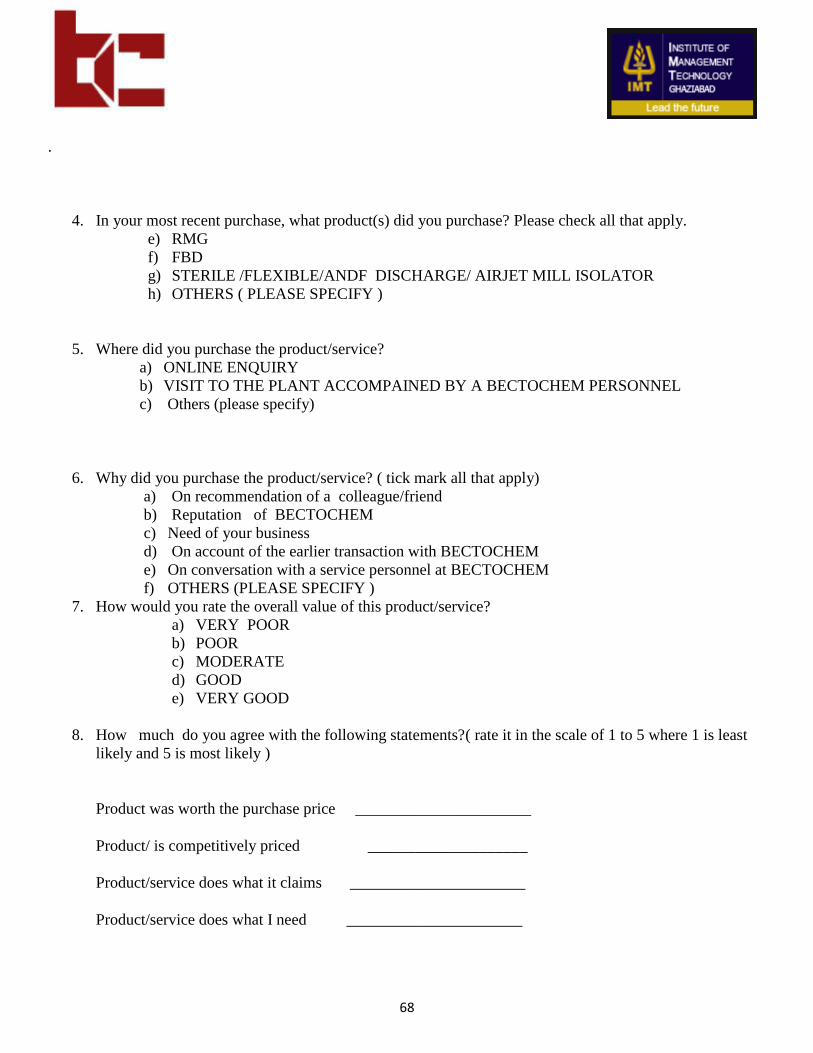
4. In your most recent purchase, what product(s) did you purchase? Please check all that apply.
e) RMG
f) FBD
g) STERILE /FLEXIBLE/ANDF DISCHARGE/ AIRJET MILL ISOLATOR
h) OTHERS ( PLEASE SPECIFY )
5. Where did you purchase the product/service?
a) ONLINE ENQUIRY
b) VISIT TO THE PLANT ACCOMPAINED BY A BECTOCHEM PERSONNEL
c) Others (please specify)
6. Why did you purchase the product/service? ( tick mark all that apply)
a) On recommendation of a colleague/friend
b) Reputation of BECTOCHEM
c) Need of your business
d) On account of the earlier transaction with BECTOCHEM
e) On conversation with a service personnel at BECTOCHEM
f) OTHERS (PLEASE SPECIFY )
7. How would you rate the overall value of this product/service?
a) VERY POOR
b) POOR
c) MODERATE
d) GOOD
e) VERY GOOD
8. How much do you agree with the following statements?( rate it in the scale of 1 to 5 where 1 is least
likely and 5 is most likely )
Product was worth the purchase price ______________________
Product/ is competitively priced ____________________
Product/service does what it claims ______________________
Product/service does what I need ______________________
69
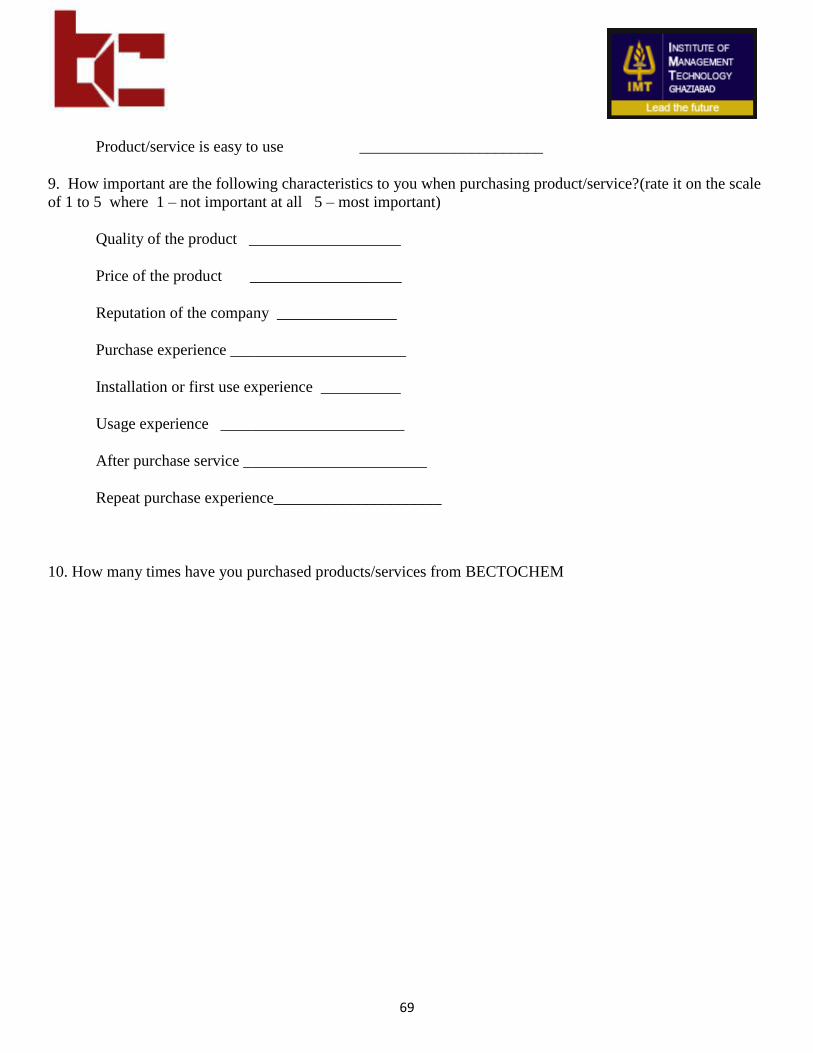
Product/service is easy to use _______________________
9. How important are the following characteristics to you when purchasing product/service?(rate it on the scale
of 1 to 5 where 1 – not important at all 5 – most important)
Quality of the product ___________________
Price of the product ___________________
Reputation of the company _______________
Purchase experience ______________________
Installation or first use experience __________
Usage experience _______________________
After purchase service _______________________
Repeat purchase experience_____________________
10. How many times have you purchased products/services from BECTOCHEM
70
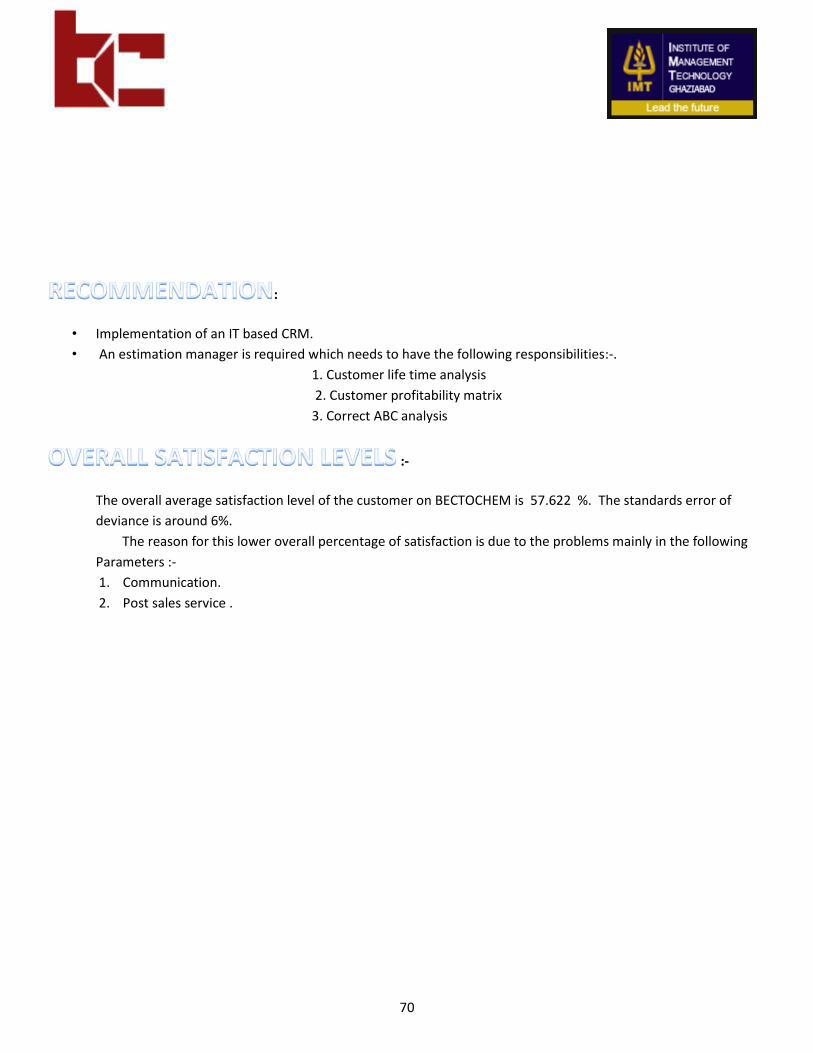
:
• Implementation of an IT based CRM.
• An estimation manager is required which needs to have the following responsibilities:-.
1. Customer life time analysis
2. Customer profitability matrix
3. Correct ABC analysis
:-
The overall average satisfaction level of the customer on BECTOCHEM is 57.622 %. The standards error of
deviance is around 6%.
The reason for this lower overall percentage of satisfaction is due to the problems mainly in the following
Parameters :-
1. Communication.
2. Post sales service .

71
STRATEGIES
72
:-
The customer values information or communication more than timely delivery .Hence, our priority should be on to
make the communication and the post sales service better than what they were.
As communication is the variable which can be fast corrected than the post sales service, this should be highly
prioritized.
1. The status of the project should be put in one spreadsheet whose viewing rights should be with the client.
Because that would help in the giving him real time communication.
2. A co-coordinator in the CRM department should be responsible to maintain the data up-to- date online for all
the clients.
3. The same data sheet should be visible to all the departments.
4. Purchase order:-acknowledgement or an auto generated mail should be kept in place for all the customer
complaints.
5. All the customer complaints should come through a common window and should be updated in a spreadsheet.
This sheet should be integrated with the main database which is to be visible to all the departments. The
Concerned departments should respond back to the CRM department with the developments in the things at
real time .
6. A separate sheet should be maintained on each client about the history of complaints and orders and list of
complaints of all the clients should also be maintained in the database.
7. A customer service report should be made in the form an online spreadsheet and he should be appraised every
48 hours about the developments till the end of the query.
8. The CRM should have workshops about how to remain courteous, to understand other machines in the
particular client center, how to build a repo with the working team, to share the innovative ways among
themselves to solve some client problems and the approach. ( this is more of an internal customer selling )
9. The optimization should be such that each customer cares personnel at a point of time he should not be
handling more than 5 orders/ clients.
10. Every time the technical person has a customer touch point he should understand the views and have a proper
documentation in the company about the problems and the way he solved it.
11. In any customer touch point, the customer satisfaction form should be duly filled. the customer form should
carry all the variable so that this becomes easy for us to quantitatively analyze at each point the customer’s
73
perception .( a sample example :- http://edu.surveygizmo.com/s3/523753/BECTOTOCHEM-CUSTOMER-
SATISFACTION-SURVEY)
12. A proper client database should be managed .Client database should be managed .the data can be done during
the SAT . The data that should be collected are
a) Name
b) Designation
c) Part in the sales team
d) Birthdays
e) Product lines involved
f) Product cycles of the major drugs and products.
g) Frequency of launch of products.
h) Etc.
(This can be only made with a good repo with the purchase team in the clients section. A PR officer
(or specifically somebody who can do the job) should always accompany the installation team and he
should be technically proficient.
The cross selling can be done then and there itself.)
13. A visit to all the clients should be made in the same region as a part of relationship building with all the other
clients in the region. Also a regular research of the prospective clients can be done through the agents at the
regional level and they should also be visited.
14. A call within a gap period which is half the time between two customer queries or orders can be made and
spoken for any new product launch in the future.
15. A continuous customer profitability analysis should be done for a period of 10 years.
16. A net promoter score should be calculated and this should be tied to each vertical
17. Financial / non-financial incentives should be awarded to the agents with respect to the new clients added.
18. A special R& D lab to be commissioned as soon as possible for all expos .after every expo a competitor SWOT
analysis should be done.
19. All the pharm expos should also be targeted for new product lines.
20. AMC should be removed, rather it should be added up with the normal product and the product can priced a bit
higher.
21. Those who work during the installation of the machine or the manufacturing should be encouraged to give
feedbacks and the ground problems should be recorded
22. Encourage high customer participation to forecast the amount of process critical items or spares needed and
forecast using proper models according to that.
These are some of the strategies involved in the vertical of communication to go ahead.
The net promoter score can be easily calculated by the customer satisfaction form.
The customer lifetime analysis can be done by the ABC costing that needs to be done by an estimation officer
who should do it thoroughly.
74
:-
- There should be an extensive training for the customer service professionals unlike which is done
right now.
- The customer care service should start right after the order is received.
- There should be customer care and training sessions at the SAT site.
- Timely workshops should be done and the customer working teams should be properly
taught from the service engineers of BECTOCHEM and the customer service personnel should be
certified on proper grounds.
- Workshops can be conducted in the own cities of the clients explaining them the use of machine
and its proper maintenance.
- There should be proactive steps from the factory side in the maintenance of the resource which
are critical for the process. (This will help us to add extra value to the customer .and at the same
time this would be more of a brand building thing for BECTOCHEM )
- Bectochem can outsource the post sales service with a business model as follows :-
a) Every strategic place can have an agency to which it can be hired. A yearly contract
can be made with the agency.
b) Every design failures , manufacturing failures, qualification failures, and fabrication
failures can be dealt in the best possible way by the agency. If it’s still not possible the
machine will be sent back to the ankaleshwar/PUNE factory.
Benefits of the above strategy
1. The cost of post sales would be less
2. The response rate would be high
3. The branding strategy might also be good for this
4. The complaints would decrease significantly.
5. The customer service personnel at the company can be less work burdened
and the warranty periods can be increased by pricing a product a bit higher
because the customer would be getting more value by this and hence the
brand value of the product increases to a great extent.
6. The customer service personnel can become more efficient. This would decrease
internal attrition rates .(more of an internal customer strategy )
7. The benefit at the customer end increases. Hence the net promoter score and
the customer perceived benefits increases which helps as an overall
development strategy of the company.
8. Along with the quotation expos in various cities need to be participated to keep a
proper contact with the existing customers. This would help in getting more and
more orders.
75
Need for the above strategy:
More than 30 customer complaint calls in 3 months which amounts to an average to more than 120 complaint calls per
year
1. If every work is to be processed and then checked. This might lead to a more time wastage and also human resources
wastage.
2. Generally this leads a more communication delay at the company end and also at the client end.
3. Even after the warranty period is over the client can find it easy to contact the local agencies than the main company
and this kind of complaints are high for BECTOCHEM.
4. The customer service professionals are not adequate in the company and all are not equally proficient.
5. In a capital equipment manufacturing industry, after sales service is one of the vital part where it can have a leading
competitive advantage .
6. The competitors like GEA –PHARMA AND pam glatt are cashing on more for a good post sales service.
7. When the company is in a growing stage , branding is a more important part of the corporate strategy in front of the
target customers and the prospective customers .
8. With the growth of pharmaceutical industry at around 9 percent year on year and the growth of processed foods and
the cosmetics industry growing at more than 13 percent .Hence the derived demand would grow phenomenally and
at such a time gaining a huge market share is important by the quality of service being given .
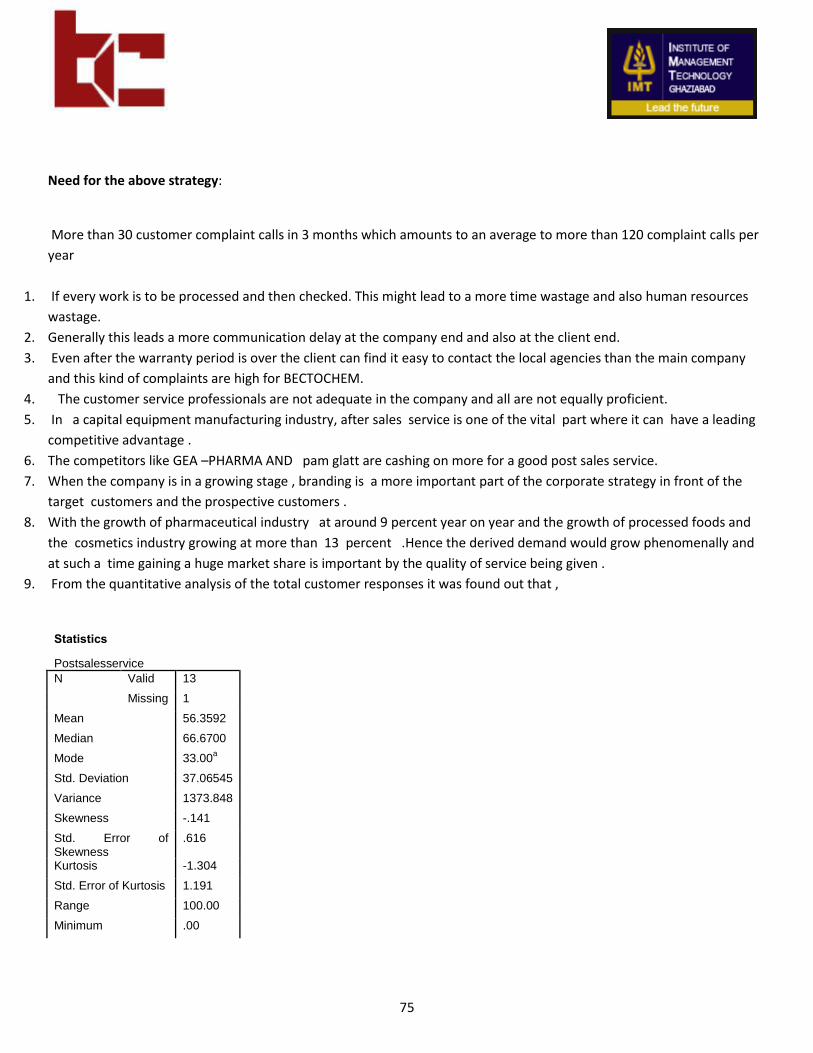
9. From the quantitative analysis of the total customer responses it was found out that ,
Statistics
Postsalesservice
N Valid 13
Missing 1
Mean 56.3592
Median 66.6700
Mode 33.00a
Std. Deviation 37.06545
Variance 1373.848
Skewness -.141
Std. Error of Skewness
.616
Kurtosis -1.304
Std. Error of Kurtosis 1.191
Range 100.00
Minimum .00
76
Maximum 100.00
Percentiles 10 .0000
20 26.4000
25 33.0000
30 33.0000
40 33.0000
50 66.6700
60 67.0000
70 93.4000
75 100.0000
80 100.0000
90 100.0000
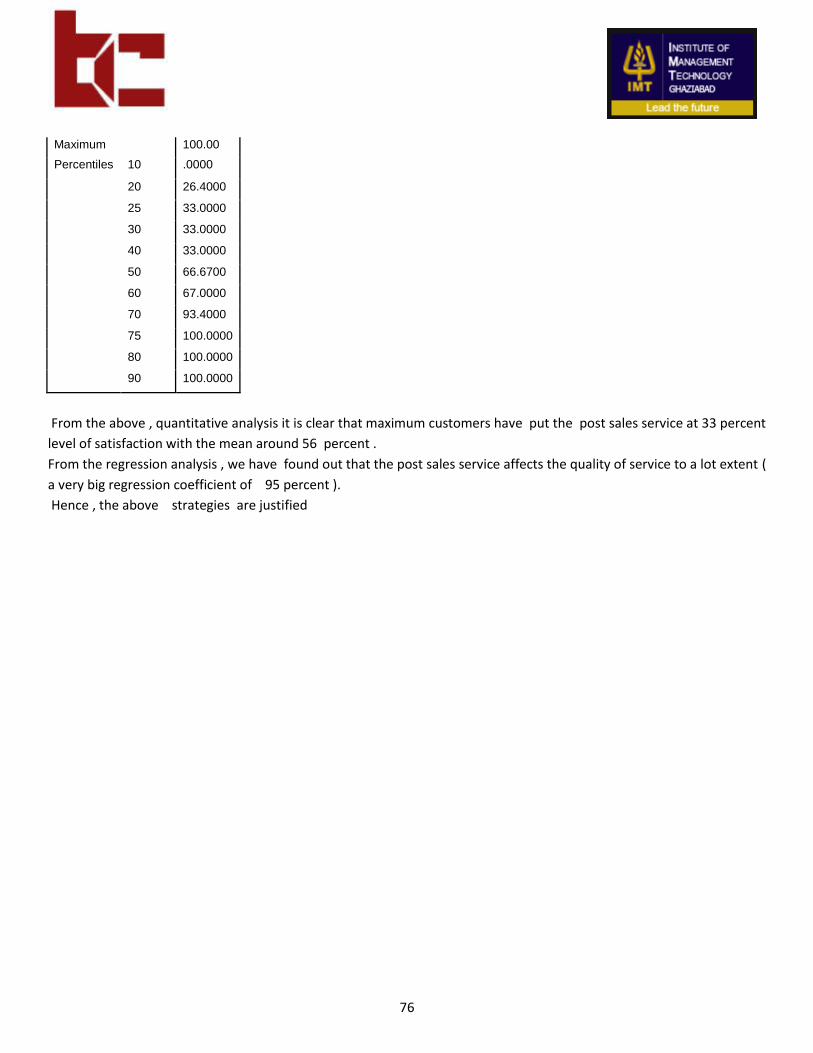
From the above , quantitative analysis it is clear that maximum customers have put the post sales service at 33 percent
level of satisfaction with the mean around 56 percent .
From the regression analysis , we have found out that the post sales service affects the quality of service to a lot extent (
a very big regression coefficient of 95 percent ).
Hence , the above strategies are justified

77
CONCLUSION :-

78
There have been certain marked improvements in the overall satisfaction of the customer but that still needs to
Improve a lot as far as communication to the clients and the post sales service is concerned. The aspect of
timely delivery although not at the best doesn’t have much of significance with respect to satisfaction

79
APPENDIX