Customer Satisfaction Survey Final Report May 2007Customer Satisfaction Index . Customer...
26
USDA Farm Service Agency Marketing Assistance Loan Program Customer Satisfaction Survey Final Report May 2007
Transcript of Customer Satisfaction Survey Final Report May 2007Customer Satisfaction Index . Customer...
USDA Farm Service Agency Marketing Assistance Loan Program
Customer Satisfaction Survey Final Report May 2007
USDA Farm Service Agency Marketing Assistance Loan Program Customer Satisfaction Study
Final Report 2007
This page intentionally left blank.
USDA Farm Service Agency Marketing Assistance Loan Program Customer Satisfaction Study
Table of Contents Page Introduction 3 Overview of ACSI Methodology 3 Data Collection 4 Respondent Background 5 ACSI Results 6 Customer Satisfaction Model 9 Drivers of Customer Satisfaction 11 Other Findings 17 Outcomes of Marketing Assistance Loan Program 20 Summary and Recommendations 22 Appendix A: Survey Questionnaire 25 Appendix B: Customer Background 35 Appendix C: Attribute Tables 41 Appendix D: Verbatim Comments 55
Final Report 1 2007
USDA Farm Service Agency Marketing Assistance Loan Program Customer Satisfaction Study
Final Report 2 2007
This page intentionally left blank.
USDA Farm Service Agency Marketing Assistance Loan Program Customer Satisfaction Study Introduction This report is about customer perceptions of services from the Marketing Assistance Loan Program of the U.S. Department of Agriculture Farm Service Agency. This report was produced by CFI Group in collaboration with the University of Michigan. If you have any questions regarding this report, please contact CFI Group at 734-930-9090. Overview of ACSI Methodology ACSI is produced by the University of Michigan in partnership with CFI Group, and the American Society for Quality. The American Customer Satisfaction Index (ACSI) is the national indicator of customer evaluations of the quality of goods and services available to U.S. residents. It is the only uniform, cross-industry/government measure of customer satisfaction. Since 1994, the ACSI has measured satisfaction, its causes, and its effects, for seven economic sectors, 41 industries and more than 200 private sector companies. ACSI has measured more than 100 programs of federal government agencies since 1999. This allows benchmarking between the public and private sectors and provides information unique to each agency on how its activities that interface with the public affect the satisfaction of customers. The effects of satisfaction are estimated, in turn, on specific objectives (such as public trust). Additional information can be found in the appendices of this report. Appendix A: Questionnaire The questionnaire used in the study was developed through a collaborative effort between CFI Group and the USDA Farm Service Agency. The questionnaire used is shown in Appendix A in the back of this report. Appendix B: Respondent Background The USDA Farm Service Agency provided respondent sample of customers who had participated in the Marketing Assistance Loan Program. Demographics such as age, race, income and gender and other background information about respondents such as distance to county office, ownership of PC, frequency of visiting county office, etc. can be found in Appendix B. Appendix C: Attribute Score Tables Respondents were asked to evaluate items on a 1 to 10 scale. Results to these questions are reported on a scale of 0 to 100 and are included in Appendix C: Attribute Tables. Aggregate scores are included in these tables as well as comparisons of scores by segments, such as age, income, distance to county office and others. Appendix D: Verbatims Verbatim comments from all open-ended responses are included in Appendix D.
Final Report 3 2007
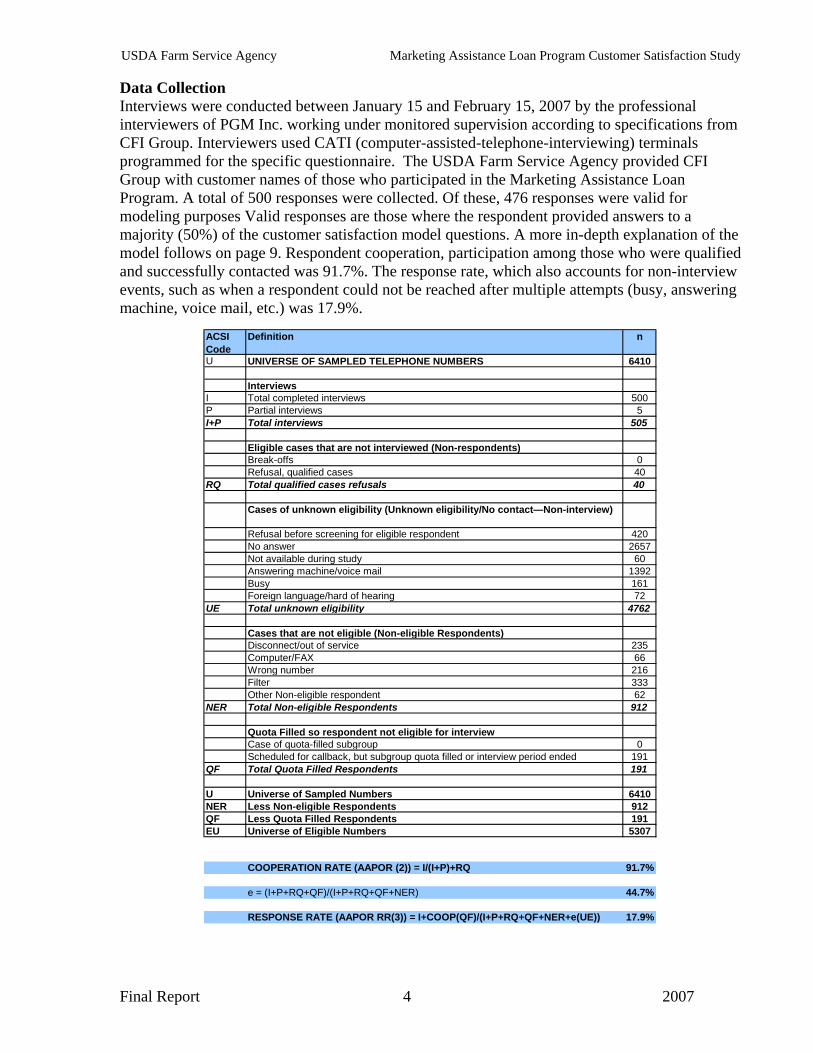
USDA Farm Service Agency Marketing Assistance Loan Program Customer Satisfaction Study Data Collection Interviews were conducted between January 15 and February 15, 2007 by the professional interviewers of PGM Inc. working under monitored supervision according to specifications from CFI Group. Interviewers used CATI (computer-assisted-telephone-interviewing) terminals programmed for the specific questionnaire. The USDA Farm Service Agency provided CFI Group with customer names of those who participated in the Marketing Assistance Loan Program. A total of 500 responses were collected. Of these, 476 responses were valid for modeling purposes Valid responses are those where the respondent provided answers to a majority (50%) of the customer satisfaction model questions. A more in-depth explanation of the model follows on page 9. Respondent cooperation, participation among those who were qualified and successfully contacted was 91.7%. The response rate, which also accounts for non-interview events, such as when a respondent could not be reached after multiple attempts (busy, answering machine, voice mail, etc.) was 17.9%.
ACSI Code
Definition n
U UNIVERSE OF SAMPLED TELEPHONE NUMBERS 6410
InterviewsI Total completed interviews 500P Partial interviews 5I+P Total interviews 505
Eligible cases that are not interviewed (Non-respondents)Break-offs 0Refusal, qualified cases 40
RQ Total qualified cases refusals 40
Cases of unknown eligibility (Unknown eligibility/No contact—Non-interview)
Refusal before screening for eligible respondent 420No answer 2657Not available during study 60Answering machine/voice mail 1392Busy 161Foreign language/hard of hearing 72
UE Total unknown eligibility 4762
Cases that are not eligible (Non-eligible Respondents)Disconnect/out of service 235Computer/FAX 66Wrong number 216Filter 333Other Non-eligible respondent 62
NER Total Non-eligible Respondents 912
Quota Filled so respondent not eligible for interviewCase of quota-filled subgroup 0Scheduled for callback, but subgroup quota filled or interview period ended 191
QF Total Quota Filled Respondents 191
U Universe of Sampled Numbers 6410NER Less Non-eligible Respondents 912QF Less Quota Filled Respondents 191EU Universe of Eligible Numbers 5307
COOPERATION RATE (AAPOR (2)) = I/(I+P)+RQ 91.7%
e = (I+P+RQ+QF)/(I+P+RQ+QF+NER) 44.7%
RESPONSE RATE (AAPOR RR(3)) = I+COOP(QF)/(I+P+RQ+QF+NER+e(UE)) 17.9%
Final Report 4 2007
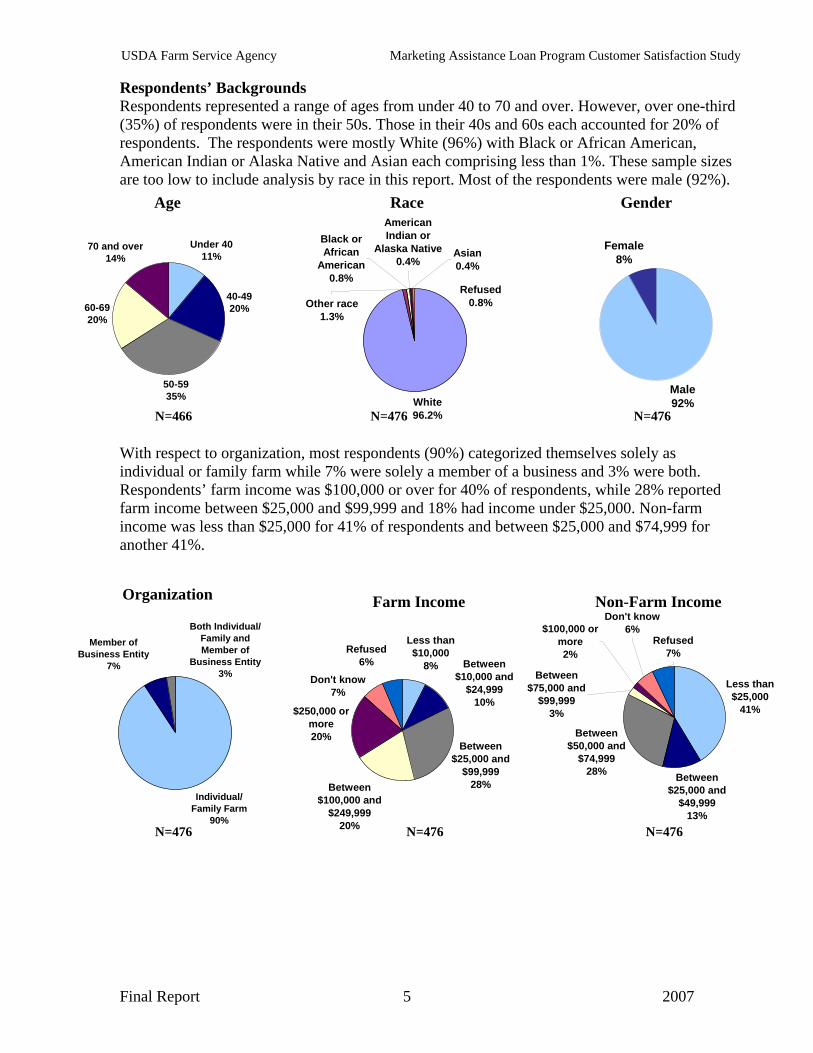
USDA Farm Service Agency Marketing Assistance Loan Program Customer Satisfaction Study Respondents’ Backgrounds Respondents represented a range of ages from under 40 to 70 and over. However, over one-third (35%) of respondents were in their 50s. Those in their 40s and 60s each accounted for 20% of respondents. The respondents were mostly White (96%) with Black or African American, American Indian or Alaska Native and Asian each comprising less than 1%. These sample sizes are too low to include analysis by race in this report. Most of the respondents were male (92%). Age Race
N=476 White96.2%
Refused0.8%
Asian0.4%
Other race1.3%
Black or African
American0.8%
American Indian or
Alaska Native0.4%
Gender
Under 4011%
40-4920%
50-5935%
60-6920%
70 and over14%
N=476
Male92%
Female8%
N=466 With respect to organization, most respondents (90%) categorized themselves solely as individual or family farm while 7% were solely a member of a business and 3% were both. Respondents’ farm income was $100,000 or over for 40% of respondents, while 28% reported farm income between $25,000 and $99,999 and 18% had income under $25,000. Non-farm income was less than $25,000 for 41% of respondents and between $25,000 and $74,999 for another 41%. Organization Farm Income Non-Farm Income
Less than $25,000
41%
Between $50,000 and
$74,99928% Between
$25,000 and $49,999
13%
$100,000 or more2%
Don't know6%
Refused7%
Between $75,000 and
$99,9993%
Individual/ Family Farm
90%
Member of Business Entity
7%
Both Individual/Family and Member of
Business Entity3%
N=476
Between $100,000 and
$249,99920%
$250,000 or more20%
Don't know7%
Refused6%
Less than $10,000
8% Between $10,000 and
$24,99910%
Between $25,000 and
$99,99928%
N=476 N=476
Final Report 5 2007
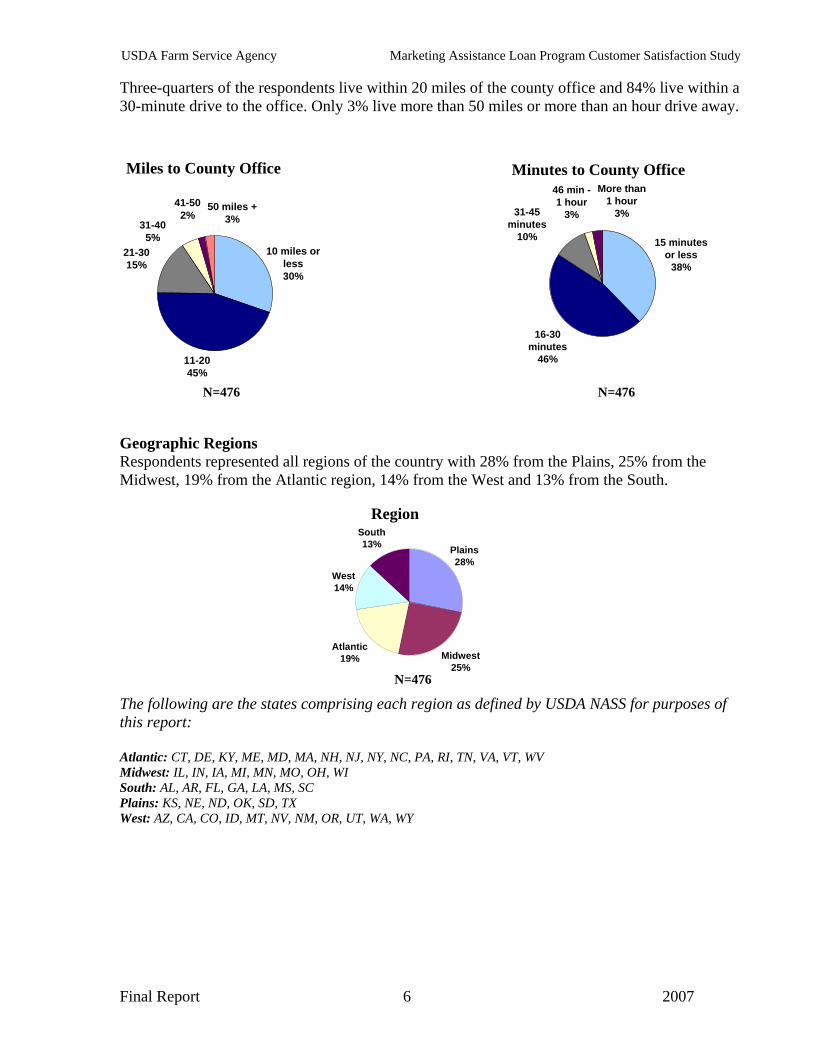
USDA Farm Service Agency Marketing Assistance Loan Program Customer Satisfaction Study Three-quarters of the respondents live within 20 miles of the county office and 84% live within a 30-minute drive to the office. Only 3% live more than 50 miles or more than an hour drive away. Miles to County Office Minutes to County Office
15 minutes or less
38%
16-30 minutes
46%
31-45 minutes
10%
46 min - 1 hour
3%
More than1 hour
3%
10 miles or less30%
21-3015%
31-405%
41-502%
50 miles +3%
11-2045%
N=476 N=476 Geographic Regions Respondents represented all regions of the country with 28% from the Plains, 25% from the Midwest, 19% from the Atlantic region, 14% from the West and 13% from the South.
Midwest25%
Atlantic19%
West14%
South13% Plains
28%
N=476
Region
The following are the states comprising each region as defined by USDA NASS for purposes of this report: Atlantic: CT, DE, KY, ME, MD, MA, NH, NJ, NY, NC, PA, RI, TN, VA, VT, WV Midwest: IL, IN, IA, MI, MN, MO, OH, WI South: AL, AR, FL, GA, LA, MS, SC Plains: KS, NE, ND, OK, SD, TX West: AZ, CA, CO, ID, MT, NV, NM, OR, UT, WA, WY
Final Report 6 2007
USDA Farm Service Agency Marketing Assistance Loan Program Customer Satisfaction Study Customer Satisfaction (ACSI)
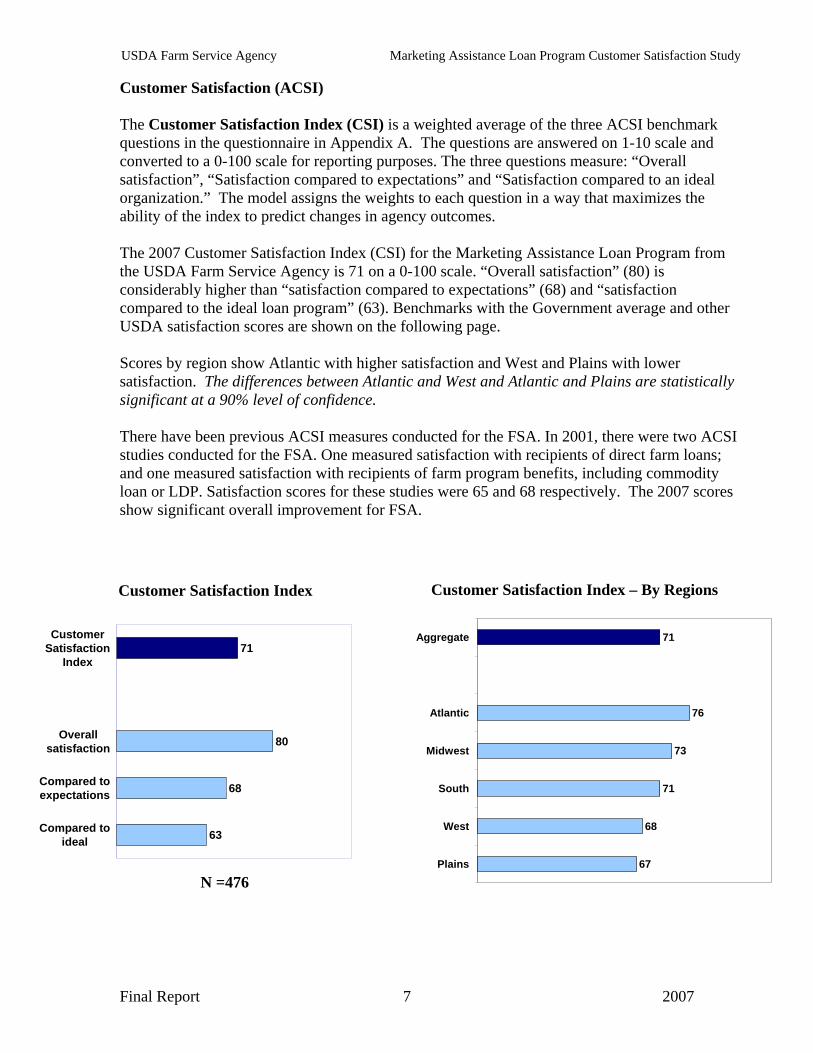
The Customer Satisfaction Index (CSI) is a weighted average of the three ACSI benchmark questions in the questionnaire in Appendix A. The questions are answered on 1-10 scale and converted to a 0-100 scale for reporting purposes. The three questions measure: “Overall satisfaction”, “Satisfaction compared to expectations” and “Satisfaction compared to an ideal organization.” The model assigns the weights to each question in a way that maximizes the ability of the index to predict changes in agency outcomes. The 2007 Customer Satisfaction Index (CSI) for the Marketing Assistance Loan Program from the USDA Farm Service Agency is 71 on a 0-100 scale. “Overall satisfaction” (80) is considerably higher than “satisfaction compared to expectations” (68) and “satisfaction compared to the ideal loan program” (63). Benchmarks with the Government average and other USDA satisfaction scores are shown on the following page. Scores by region show Atlantic with higher satisfaction and West and Plains with lower satisfaction. The differences between Atlantic and West and Atlantic and Plains are statistically significant at a 90% level of confidence. There have been previous ACSI measures conducted for the FSA. In 2001, there were two ACSI studies conducted for the FSA. One measured satisfaction with recipients of direct farm loans; and one measured satisfaction with recipients of farm program benefits, including commodity loan or LDP. Satisfaction scores for these studies were 65 and 68 respectively. The 2007 scores show significant overall improvement for FSA.
Customer Satisfaction Index – By Regions Customer Satisfaction Index
71
76
73
71
68
67
Aggregate
Atlantic
Midwest
South
West
Plains
71
80
68
63
CustomerSatisfaction
Index
Overallsatisfaction
Compared toexpectations
Compared toideal
N =476
Final Report 7 2007
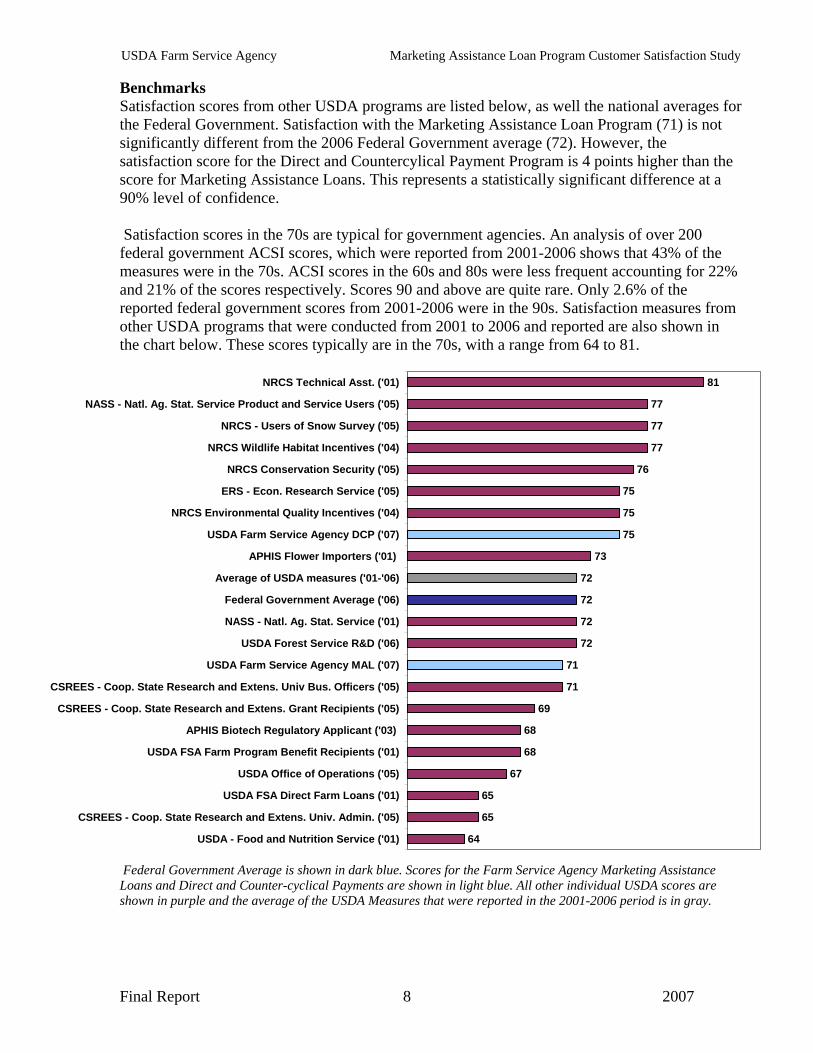
USDA Farm Service Agency Marketing Assistance Loan Program Customer Satisfaction Study Benchmarks Satisfaction scores from other USDA programs are listed below, as well the national averages for the Federal Government. Satisfaction with the Marketing Assistance Loan Program (71) is not significantly different from the 2006 Federal Government average (72). However, the satisfaction score for the Direct and Countercylical Payment Program is 4 points higher than the score for Marketing Assistance Loans. This represents a statistically significant difference at a 90% level of confidence. Satisfaction scores in the 70s are typical for government agencies. An analysis of over 200 federal government ACSI scores, which were reported from 2001-2006 shows that 43% of the measures were in the 70s. ACSI scores in the 60s and 80s were less frequent accounting for 22% and 21% of the scores respectively. Scores 90 and above are quite rare. Only 2.6% of the reported federal government scores from 2001-2006 were in the 90s. Satisfaction measures from other USDA programs that were conducted from 2001 to 2006 and reported are also shown in the chart below. These scores typically are in the 70s, with a range from 64 to 81.
81
77
77
77
76
75
75
75
73
72
72
72
72
71
71
69
68
68
67
65
65
64
NRCS Technical Asst. ('01)
NASS - Natl. Ag. Stat. Service Product and Service Users ('05)
NRCS - Users of Snow Survey ('05)
NRCS Wildlife Habitat Incentives ('04)
NRCS Conservation Security ('05)
ERS - Econ. Research Service ('05)
NRCS Environmental Quality Incentives ('04)
USDA Farm Service Agency DCP ('07)
APHIS Flower Importers ('01)
Average of USDA measures ('01-'06)
Federal Government Average ('06)
NASS - Natl. Ag. Stat. Service ('01)
USDA Forest Service R&D ('06)
USDA Farm Service Agency MAL ('07)
CSREES - Coop. State Research and Extens. Univ Bus. Officers ('05)
CSREES - Coop. State Research and Extens. Grant Recipients ('05)
APHIS Biotech Regulatory Applicant ('03)
USDA FSA Farm Program Benefit Recipients ('01)
USDA Office of Operations ('05)
USDA FSA Direct Farm Loans ('01)
CSREES - Coop. State Research and Extens. Univ. Admin. ('05)
USDA - Food and Nutrition Service ('01)
Federal Government Average is shown in dark blue. Scores for the Farm Service Agency Marketing Assistance Loans and Direct and Counter-cyclical Payments are shown in light blue. All other individual USDA scores are shown in purple and the average of the USDA Measures that were reported in the 2001-2006 period is in gray.
Final Report 8 2007
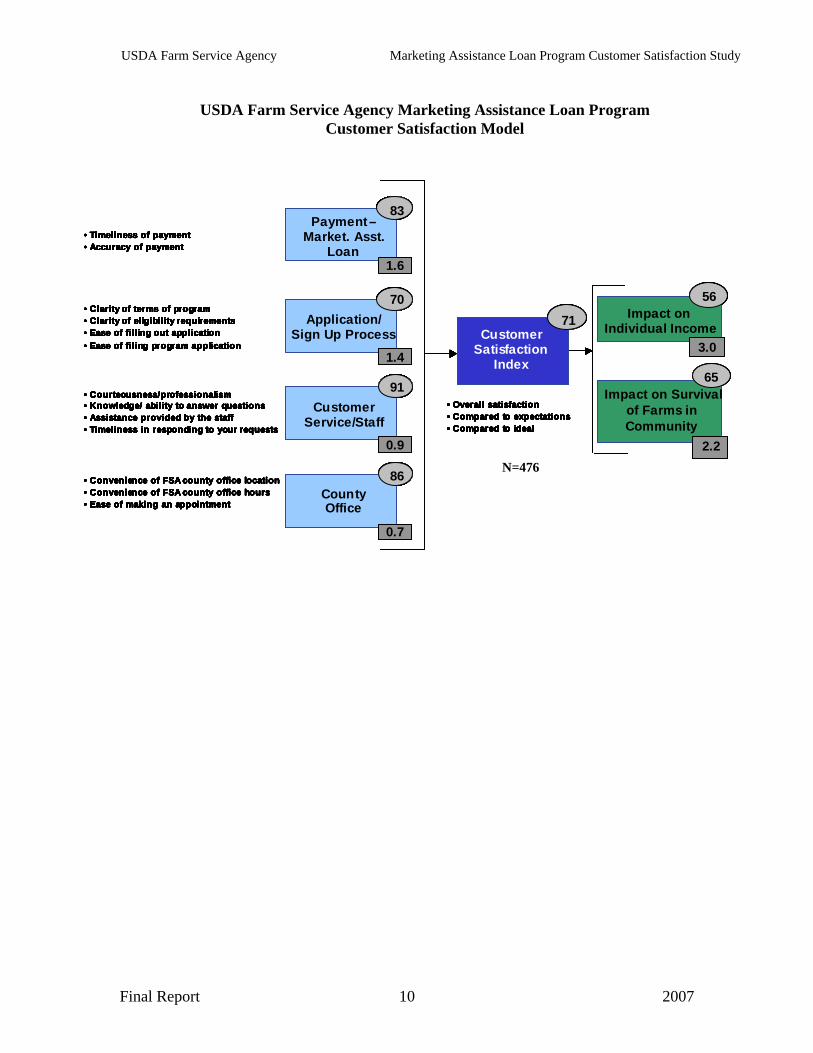
USDA Farm Service Agency Marketing Assistance Loan Program Customer Satisfaction Study Customer Satisfaction Model The Farm Service Agency Marketing Assistance Loan Program Customer Satisfaction model illustrated on the following page should be viewed as a cause-and-effect model that moves from left to right. The rectangles are multi-variable components that are measured by survey questions. The numbers in the lower right corners of the rectangles represent the strength of the effect of the component on the left to the one to which the arrow points on the right. These values represent "impacts." The larger the impact value, the more effect the component on the left has on the one on the right. The USDA Farm Service Agency can use the scores (in ovals) and impacts (in rectangles) from the model shown on the next two pages to target areas for improvement that will have the greatest leverage on Customer Satisfaction with the Marketing Assistance Loan Program. Attribute scores are the mean (average) respondent scores to each individual question that was asked in the survey. Respondents are asked to rate each item on a 1-10 scale with “1” being “poor” and “10” being “excellent.” CFI Group converts the mean responses to these items to a 0-100 scale for reporting purposes. It is important to note that these scores are averages, not percentages. The score is best thought of as an index, with “0” meaning “poor” and “100” meaning “excellent.” A component score in the ovals in the upper right corners is the weighted average of the individual attribute ratings given by each respondent to the questions presented in the survey. A score is a relative measure of performance for a component, as given for a particular set of respondents. In the model illustrated on the following page, scores for attributes such as “Timeliness of payment” and “Accuracy of payment” create the component score for “Payment-Marketing Assistance Loan.” Impacts should be read as the effect on the subsequent component if the initial driver (component) were to be improved or decreased by five points. The reason that a 5-point increment is used to explain the impact is that a 5-point increase is large enough to be noteworthy to an organization in terms of improved performance and in typical studies (where at least 250 responses are collected) is statistically significant as well. For example, if the score for Payment-Marketing Assistance Loans increased by 5 points (83 to 88), Customer Satisfaction would increase by the amount of its impact, 1.6 points, (from 71 to 72.6). If the driver increases by less than or more than five points, the resulting change in the subsequent component would be the corresponding fraction of the original impact. Impacts are additive. Thus, if multiple areas were to each improve by 5 points the related improvement in satisfaction will be the sum of the impacts. Similarly, if the Customer Satisfaction Index were to increase by 5 points, outcomes such as respondents’ perception of “Program Impact” or “Survival of Farms” would increase by the amount of their impact. In the case of Program Impact a 5-point increase in satisfaction would increase the Program Impact by 3 points from 56 to 59. As with scores, impacts are also relative to one another. A low impact does not mean a component is unimportant. Rather, it means that a five-point change in that one component is unlikely to result in much improvement in Satisfaction at this time. Therefore, components with higher impacts are generally recommended for improvement first, especially if scores are lower for those components.
Final Report 9 2007
USDA Farm Service Agency Marketing Assistance Loan Program Customer Satisfaction Study
USDA Farm Service Agency Marketing Assistance Loan Program
Customer Satisfaction Model
N=476
Payment –Market. Asst.
Loan
83
Application/ Sign Up Process
70
Customer Service/Staff
91
County Office
86
Payment –Market. Asst.
Loan
83
Application/ Sign Up Process
70
Customer Service/Staff
91
County Office
86
0.7
• Clarity of terms of program• Clarity of eligibility requirements• Ease of filling out application• Ease of filing program application
• Convenience of FSA county office location• Convenience of FSA county office hours• Ease of making an appointment
• Timeliness of payment• Accuracy of payment
• Courteousness/professionalism• Knowledge/ ability to answer questions• Assistance provided by the staff• Timeliness in responding to your requests
1.6
1.4
0.9
• Overall satisfaction• Compared to expectations• Compared to ideal
Payment –Market. Asst.
Loan
83
Application/ Sign Up Process
70
Customer Service/Staff
91
County Office
86
Payment –Market. Asst.
Loan
83
Application/ Sign Up Process
70
Customer Service/Staff
91
County Office
86
0.7
• Clarity of terms of program• Clarity of eligibility requirements• Ease of filling out application• Ease of filing program application
• Convenience of FSA county office location• Convenience of FSA county office hours• Ease of making an appointment
• Timeliness of payment• Accuracy of payment
• Courteousness/professionalism• Knowledge/ ability to answer questions• Assistance provided by the staff• Timeliness in responding to your requests
1.6
1.4
0.9
• Overall satisfaction• Compared to expectations• Compared to ideal
Customer Satisfaction
Index
71ProgramImpact
56
3.0
Survival of Farms
2.2
Payment –Market. Asst.
Loan
83
Application/ Sign Up Process
70
Customer Service/Staff
91
County Office
86
0.7
• Clarity of terms of program• Clarity of eligibility requirements• Ease of filling out application• Ease of filing program application
• Convenience of FSA county office location• Convenience of FSA county office hours• Ease of making an appointment
• Timeliness of payment• Accuracy of payment
• Courteousness/professionalism• Knowledge/ ability to answer questions• Assistance provided by the staff• Timeliness in responding to your requests
1.6
1.4
0.9
• Overall satisfaction• Compared to expectations• Compared to ideal
Customer Satisfaction
Index
71
56
3.0
65
2.2
Impact on Survival of Farms in Community
Impact on individual IncomeCustomer
Satisfaction Index
71ProgramImpact
56
3.0
Survival of Farms
2.2
Payment –Market. Asst.
Loan
83
Application/ Sign Up Process
70
Customer Service/Staff
91
County Office
86
Payment –Market. Asst.
Loan
83
Application/ Sign Up Process
70
Customer Service/Staff
91
County Office
86
0.7
• Clarity of terms of program• Clarity of eligibility requirements• Ease of filling out application• Ease of filing program application
• Convenience of FSA county office location• Convenience of FSA county office hours• Ease of making an appointment
• Timeliness of payment• Accuracy of payment
• Courteousness/professionalism• Knowledge/ ability to answer questions• Assistance provided by the staff• Timeliness in responding to your requests
1.6
1.4
0.9
• Overall satisfaction• Compared to expectations• Compared to ideal
Customer Satisfaction
Index
71
56
3.0
65
2.2
Impact on Survival of Farms in Community
Impact on Individual Income
Payment –Market. Asst.
Loan
83
Application/ Sign Up Process
70
Customer Service/Staff
91
County Office
86
Payment –Market. Asst.
Loan
83
Application/ Sign Up Process
70
Customer Service/Staff
91
County Office
86
0.7
• Clarity of terms of program• Clarity of eligibility requirements• Ease of filling out application• Ease of filing program application
• Convenience of FSA county office location• Convenience of FSA county office hours• Ease of making an appointment
• Timeliness of payment• Accuracy of payment
• Courteousness/professionalism• Knowledge/ ability to answer questions• Assistance provided by the staff• Timeliness in responding to your requests
1.6
1.4
0.9
• Overall satisfaction• Compared to expectations• Compared to ideal
Payment –Market. Asst.
Loan
83
Application/ Sign Up Process
70
Customer Service/Staff
91
County Office
86
Payment –Market. Asst.
Loan
83
Application/ Sign Up Process
70
Customer Service/Staff
91
County Office
86
0.7
• Clarity of terms of program• Clarity of eligibility requirements• Ease of filling out application• Ease of filing program application
• Convenience of FSA county office location• Convenience of FSA county office hours• Ease of making an appointment
• Timeliness of payment• Accuracy of payment
• Courteousness/professionalism• Knowledge/ ability to answer questions• Assistance provided by the staff• Timeliness in responding to your requests
1.6
1.4
0.9
• Overall satisfaction• Compared to expectations• Compared to ideal
Customer Satisfaction
Index
71ProgramImpact
56
3.0
Survival of Farms
2.2
Payment –Market. Asst.
Loan
83
Application/ Sign Up Process
70
Customer Service/Staff
91
County Office
86
Payment –Market. Asst.
Loan
83
Application/ Sign Up Process
70
Customer Service/Staff
91
County Office
86
0.7
• Clarity of terms of program• Clarity of eligibility requirements• Ease of filling out application• Ease of filing program application
• Convenience of FSA county office location• Convenience of FSA county office hours• Ease of making an appointment
• Timeliness of payment• Accuracy of payment
• Courteousness/professionalism• Knowledge/ ability to answer questions• Assistance provided by the staff• Timeliness in responding to your requests
1.6
1.4
0.9
• Overall satisfaction• Compared to expectations• Compared to ideal
Customer Satisfaction
Index
71
56
3.0
65
2.2
Impact on Survival of Farms in Community
Impact on individual IncomeCustomer
Satisfaction Index
71ProgramImpact
56
3.0
Survival of Farms
2.2
Payment –Market. Asst.
Loan
83
Application/ Sign Up Process
70
Customer Service/Staff
91
County Office
86
Payment –Market. Asst.
Loan
83
Application/ Sign Up Process
70
Customer Service/Staff
91
County Office
86
0.7
• Clarity of terms of program• Clarity of eligibility requirements• Ease of filling out application• Ease of filing program application
• Convenience of FSA county office location• Convenience of FSA county office hours• Ease of making an appointment
• Timeliness of payment• Accuracy of payment
• Courteousness/professionalism• Knowledge/ ability to answer questions• Assistance provided by the staff• Timeliness in responding to your requests
1.6
1.4
0.9
• Overall satisfaction• Compared to expectations• Compared to ideal
Customer Satisfaction
Index
71
56
3.0
65
2.2
Impact on Survival of Farms in Community
Impact on Individual Income
Final Report 10 2007
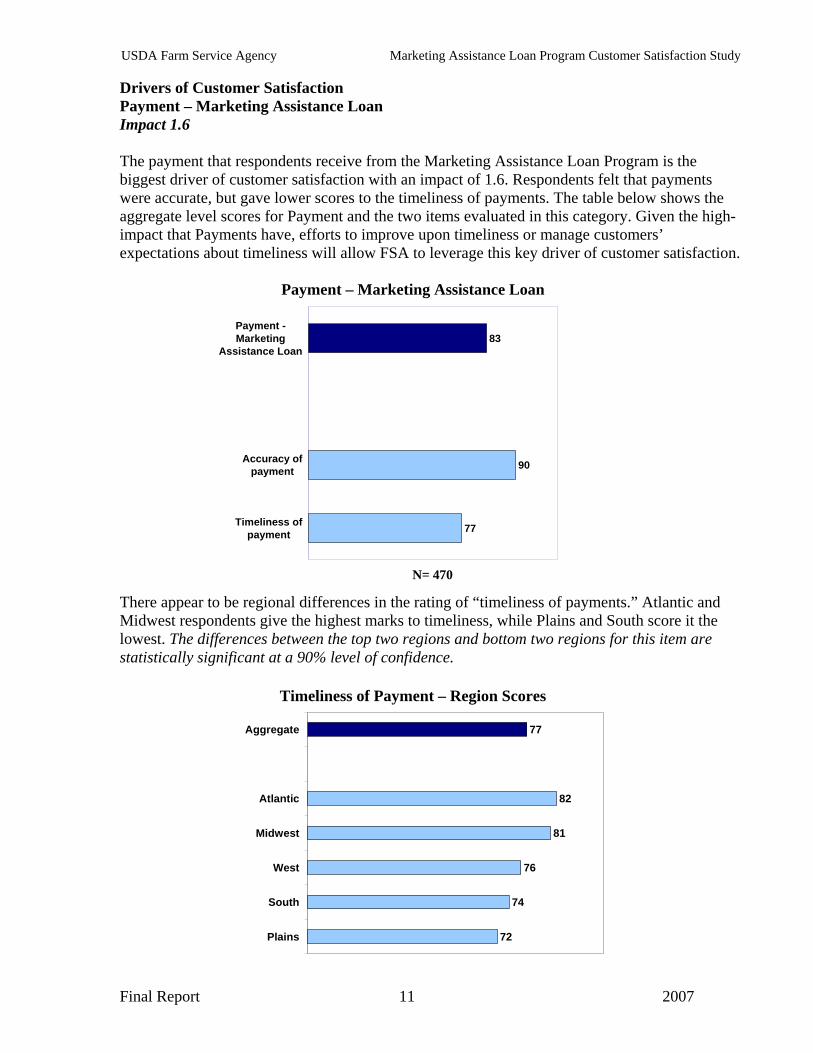
USDA Farm Service Agency Marketing Assistance Loan Program Customer Satisfaction Study Drivers of Customer Satisfaction Payment – Marketing Assistance Loan Impact 1.6 The payment that respondents receive from the Marketing Assistance Loan Program is the biggest driver of customer satisfaction with an impact of 1.6. Respondents felt that payments were accurate, but gave lower scores to the timeliness of payments. The table below shows the aggregate level scores for Payment and the two items evaluated in this category. Given the high-impact that Payments have, efforts to improve upon timeliness or manage customers’ expectations about timeliness will allow FSA to leverage this key driver of customer satisfaction.
Payment – Marketing Assistance Loan
83
90
77
Payment -Marketing
Assistance Loan
Accuracy ofpayment
Timeliness ofpayment
N= 470 There appear to be regional differences in the rating of “timeliness of payments.” Atlantic and Midwest respondents give the highest marks to timeliness, while Plains and South score it the lowest. The differences between the top two regions and bottom two regions for this item are statistically significant at a 90% level of confidence. Timeliness of Payment – Region Scores
77
82
81
76
74
72
Aggregate
Atlantic
Midwest
West
South
Plains
Final Report 11 2007

USDA Farm Service Agency Marketing Assistance Loan Program Customer Satisfaction Study Application/Sign Up Process Impact 1.4 The Application and Sign Up Process has a high impact on customer satisfaction with an impact of 1.4. This was also the lowest scoring area of all drivers with an aggregate rating of 70. Of the Application items rated respondents gave the lowest ratings to the clarity of terms of the program. However, filling out and filing the application were somewhat problematic as well. Application/Sign Up Process
70
72
70
69
67
Application/Sign-Up Process -Marketing Assistance Loan
Clarity of eligibility requirements
Ease of filing program application
Ease of filling out application
Clarity of terms of the program
Of note, “clarity of terms of the program” appears to be more problematic for respondents that are a member of a business entity. They scored this particular Application item significantly lower than individual family farm respondents did (59 versus 68). The 9-point difference between these scores is statistically significant at a 90% level of confidence. Regionally, Atlantic and Midwest scored Application/Sign Up highest, while West, Plains and South scored it lowest. The difference among regions is greatest for the “clarity of terms of the program.” Scores are shown below. The differences between the scores of either of the top two regions to any of the bottom three regions for this item are statistically significant at a 90% level of confidence.
N=457
Clarity of Terms – Region Scores
67
74
71
64
64
61
Aggregate
Atlantic
Midwest
South
Plains
West
Final Report 12 2007
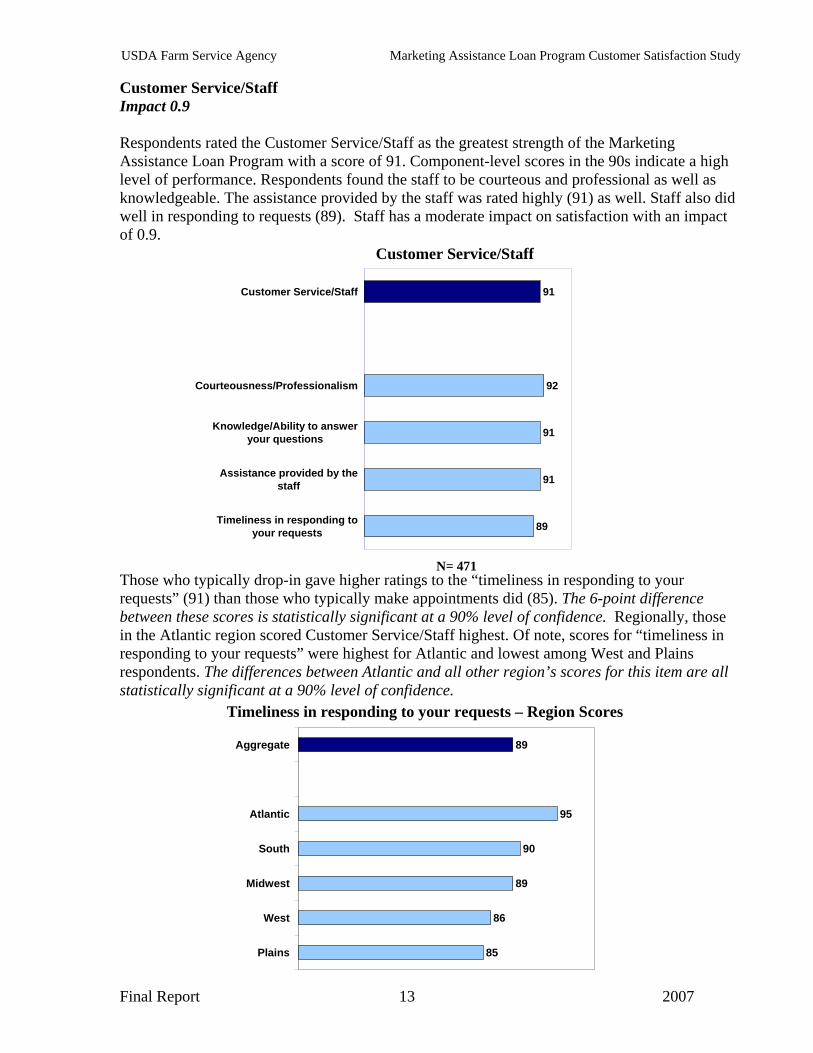
USDA Farm Service Agency Marketing Assistance Loan Program Customer Satisfaction Study Customer Service/Staff Impact 0.9 Respondents rated the Customer Service/Staff as the greatest strength of the Marketing Assistance Loan Program with a score of 91. Component-level scores in the 90s indicate a high level of performance. Respondents found the staff to be courteous and professional as well as knowledgeable. The assistance provided by the staff was rated highly (91) as well. Staff also did well in responding to requests (89). Staff has a moderate impact on satisfaction with an impact of 0.9. Customer Service/Staff
91
92
91
91
89
Customer Service/Staff
Courteousness/Professionalism
Knowledge/Ability to answeryour questions
Assistance provided by thestaff
Timeliness in responding toyour requests
Those who typically drop-in gave higher ratings to the “timeliness in responding to your requests” (91) than those who typically make appointments did (85). The 6-point difference between these scores is statistically significant at a 90% level of confidence. Regionally, those in the Atlantic region scored Customer Service/Staff highest. Of note, scores for “timeliness in responding to your requests” were highest for Atlantic and lowest among West and Plains respondents. The differences between Atlantic and all other region’s scores for this item are all statistically significant at a 90% level of confidence.
N= 471
Timeliness in responding to your requests – Region Scores
89
95
90
89
86
85
Aggregate
Atlantic
South
Midwest
West
Plains
Final Report 13 2007
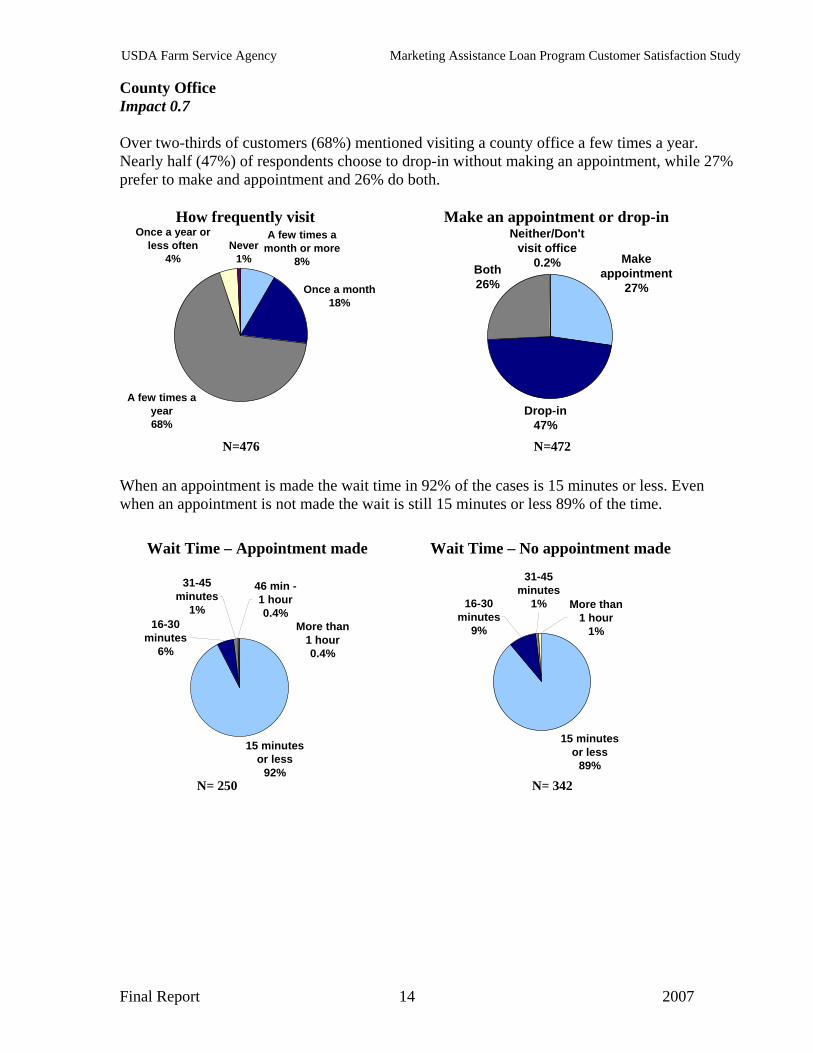
USDA Farm Service Agency Marketing Assistance Loan Program Customer Satisfaction Study County Office Impact 0.7 Over two-thirds of customers (68%) mentioned visiting a county office a few times a year. Nearly half (47%) of respondents choose to drop-in without making an appointment, while 27% prefer to make and appointment and 26% do both.
How frequently visit Make an appointment or drop-in
Once a month18%
Once a year or less often
4%
A few times a year68%
A few times a month or more
8%Never
1% Make appointment
27%
Drop-in47%
Both26%
Neither/Don't visit office
0.2%
N=476 N=472 When an appointment is made the wait time in 92% of the cases is 15 minutes or less. Even when an appointment is not made the wait is still 15 minutes or less 89% of the time.
Wait Time – Appointment made Wait Time – No appointment made
15 minutes or less
89%
16-30 minutes
9%
31-45minutes
1% More than1 hour
1%More than1 hour0.4%
46 min -1 hour0.4%
31-45minutes
1%16-30
minutes6%
15 minutes or less
92% N= 250 N= 342
Final Report 14 2007

USDA Farm Service Agency Marketing Assistance Loan Program Customer Satisfaction Study Overall, respondents found the County Office to be accessible and gave positive ratings to the convenience of the office hours (87) and ease of making appointment (86). The office location was mostly convenient as well with a rating of 84. Of the satisfaction drivers, County Office had the lowest impact on satisfaction. County Office
86
87
86
84
County Office
Convenience ofFSA countyoffice hours
Ease of makingan appointment
Convenience ofFSA county
office location
N= 472 While “convenience of FSA county office location” has an inverse relationship with the respondents’ drive time to the Office, satisfaction does not. There was not a significant difference in satisfaction among those with the shortest drives (less than 15 minutes) compared to those with longer drives (up to 45 minutes). While the chart below shows “convenience of location scores” falling for those with longer drives, it shows satisfaction remaining constant. Note that those with drives over 45 minutes are excluded (due to low sample sizes). Ninety-four percent of respondents have drives of 45 minutes or less and are included in the chart below.
Convenience of location and Satisfaction by time to drive to County Office
7270 71
92
83
73
15 minutes orless
16-30 minutes 31-45 minutes
SatisfactionIndex
Convenienceof location
N= 180 N= 221 N= 49
Final Report 15 2007
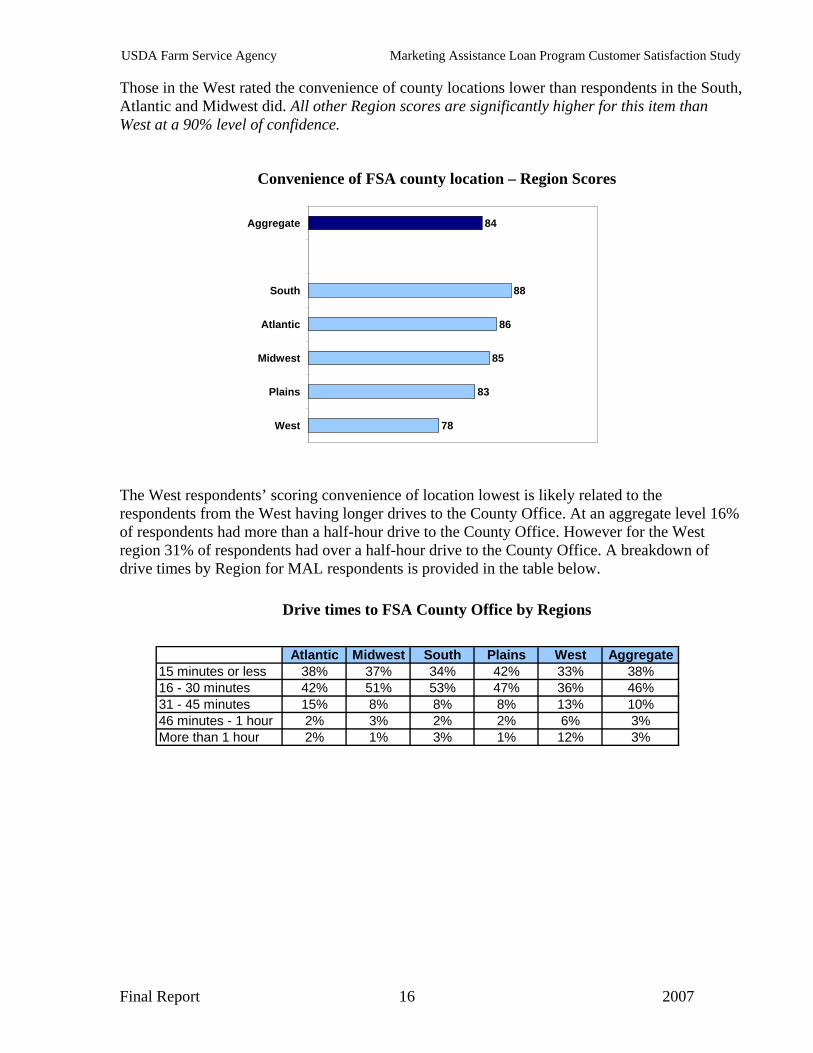
USDA Farm Service Agency Marketing Assistance Loan Program Customer Satisfaction Study Those in the West rated the convenience of county locations lower than respondents in the South, Atlantic and Midwest did. All other Region scores are significantly higher for this item than West at a 90% level of confidence.
Convenience of FSA county location – Region Scores
84
88
86
85
83
78
Aggregate
South
Atlantic
Midwest
Plains
West
The West respondents’ scoring convenience of location lowest is likely related to the respondents from the West having longer drives to the County Office. At an aggregate level 16% of respondents had more than a half-hour drive to the County Office. However for the West region 31% of respondents had over a half-hour drive to the County Office. A breakdown of drive times by Region for MAL respondents is provided in the table below. Drive times to FSA County Office by Regions
Atlantic Midwest South Plains West Aggregate15 minutes or less 38% 37% 34% 42% 33% 38%16 - 30 minutes 42% 51% 53% 47% 36% 46%31 - 45 minutes 15% 8% 8% 8% 13% 10%46 minutes - 1 hour 2% 3% 2% 2% 6% 3%More than 1 hour 2% 1% 3% 1% 12% 3%
Final Report 16 2007
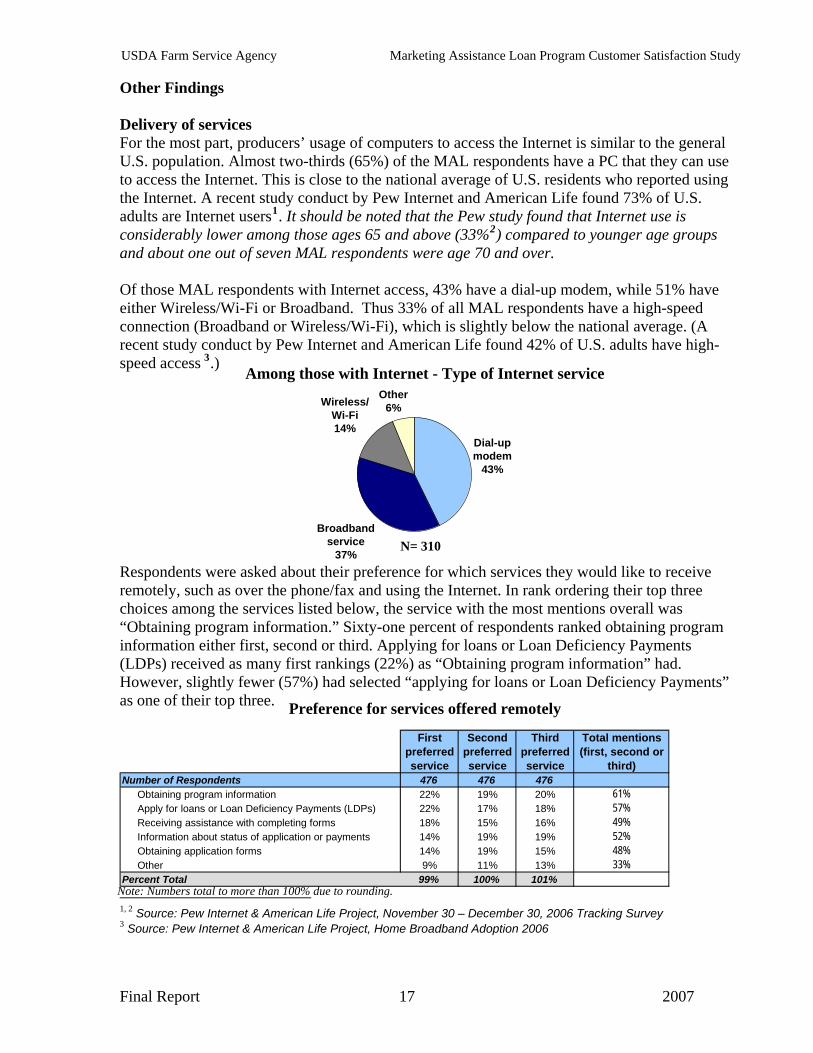
USDA Farm Service Agency Marketing Assistance Loan Program Customer Satisfaction Study Other Findings Delivery of services For the most part, producers’ usage of computers to access the Internet is similar to the general U.S. population. Almost two-thirds (65%) of the MAL respondents have a PC that they can use to access the Internet. This is close to the national average of U.S. residents who reported using the Internet. A recent study conduct by Pew Internet and American Life found 73% of U.S. adults are Internet users1. It should be noted that the Pew study found that Internet use is considerably lower among those ages 65 and above (33%2) compared to younger age groups and about one out of seven MAL respondents were age 70 and over. Of those MAL respondents with Internet access, 43% have a dial-up modem, while 51% have either Wireless/Wi-Fi or Broadband. Thus 33% of all MAL respondents have a high-speed connection (Broadband or Wireless/Wi-Fi), which is slightly below the national average. (A recent study conduct by Pew Internet and American Life found 42% of U.S. adults have high-speed access 3.)
Among those with Internet - Type of Internet service
Dial-up modem
43%
Broadband service
37%
Other6%Wireless/
Wi-Fi14%
N= 310
Respondents were asked about their preference for which services they would like to receive remotely, such as over the phone/fax and using the Internet. In rank ordering their top three choices among the services listed below, the service with the most mentions overall was “Obtaining program information.” Sixty-one percent of respondents ranked obtaining program information either first, second or third. Applying for loans or Loan Deficiency Payments (LDPs) received as many first rankings (22%) as “Obtaining program information” had. However, slightly fewer (57%) had selected “applying for loans or Loan Deficiency Payments” as one of their top three. Preference for services offered remotely
First preferred service
Second preferred service
Third preferred service
Total mentions (first, second or
third)Number of Respondents 476 476 476
Obtaining program information 22% 19% 20% 61%Apply for loans or Loan Deficiency Payments (LDPs) 22% 17% 18% 57%Receiving assistance with completing forms 18% 15% 16% 49%Information about status of application or payments 14% 19% 19% 52%Obtaining application forms 14% 19% 15% 48%Other 9% 11% 13% 33%
Percent Total 99% 100% 101%Note: Numbers total to more than 100% due to rounding. 1, 2 Source: Pew Internet & American Life Project, November 30 – December 30, 2006 Tracking Survey 3 Source: Pew Internet & American Life Project, Home Broadband Adoption 2006
Final Report 17 2007
USDA Farm Service Agency Marketing Assistance Loan Program Customer Satisfaction Study
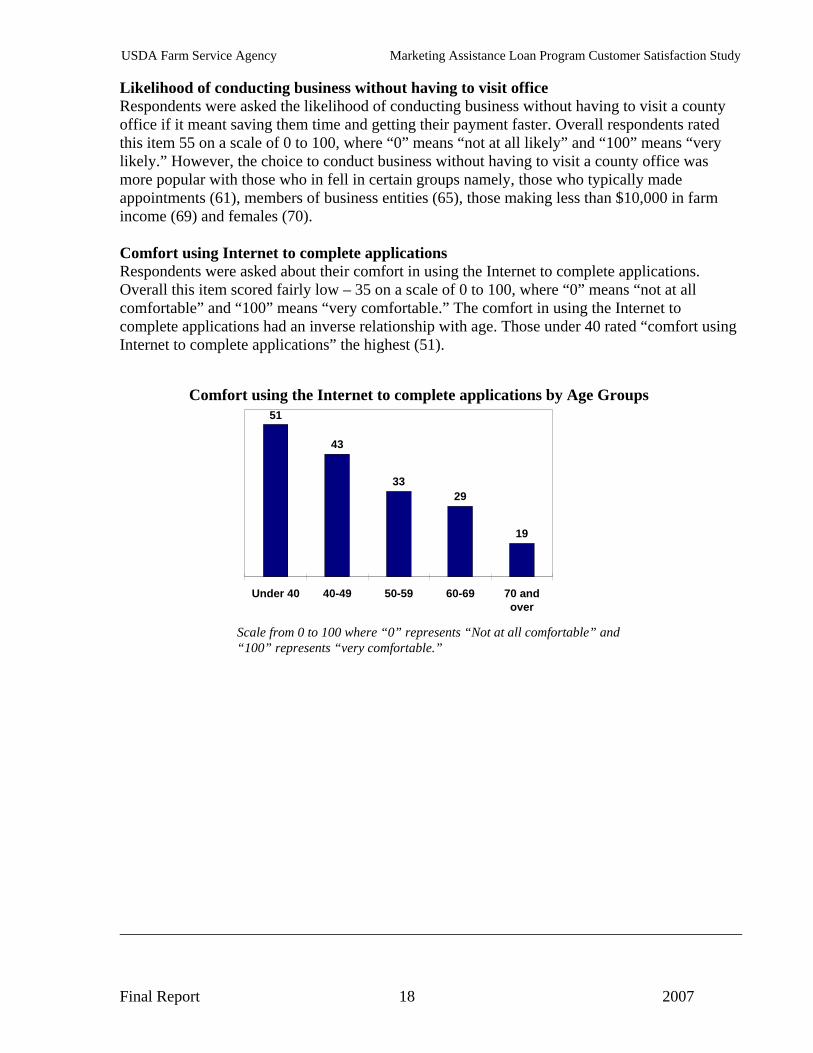
Likelihood of conducting business without having to visit office Respondents were asked the likelihood of conducting business without having to visit a county office if it meant saving them time and getting their payment faster. Overall respondents rated this item 55 on a scale of 0 to 100, where “0” means “not at all likely” and “100” means “very likely.” However, the choice to conduct business without having to visit a county office was more popular with those who in fell in certain groups namely, those who typically made appointments (61), members of business entities (65), those making less than $10,000 in farm income (69) and females (70). Comfort using Internet to complete applications Respondents were asked about their comfort in using the Internet to complete applications. Overall this item scored fairly low – 35 on a scale of 0 to 100, where “0” means “not at all comfortable” and “100” means “very comfortable.” The comfort in using the Internet to complete applications had an inverse relationship with age. Those under 40 rated “comfort using Internet to complete applications” the highest (51).
Comfort using the Internet to complete applications by Age Groups
Scale from 0 to 100 where “0” represents “Not at all comfortable” and “100” represents “very comfortable.”
51
43
3329
19
Under 40 40-49 50-59 60-69 70 andover
Final Report 18 2007

USDA Farm Service Agency Marketing Assistance Loan Program Customer Satisfaction Study Further analysis of distribution of scores shows that overall 22% of respondents felt mostly comfortable with using the Internet to complete applications. These respondents gave ratings of “8” or higher on the 1-10 scale. Like the overall mean score, the proportion of respondents who are most comfortable with the Internet for applications is also inversely related to age. While 36% of those under 40 rated their comfort “8” or higher, this proportion falls to 30% for those in their 40s. For those in their 50s (18%) and 60s (22%) even fewer feel as comfortable. Only 8% of respondents 70 and older feel that comfortable using the Internet for applications. Conversely, 38% of all respondents felt “not at all” comfortable. These respondents rated their comfort a “1.” Again, age is directly related to the proportion of respondents not at all comfortable using the Internet for applications. Only 19% of those under 40 rated their comfort this low, while 28% of respondents in their 40s did. For those in their 50s the percent climbs to 37% and for those in their 60s nearly half (47%) are not at all comfortable using the Internet for applications. Over three-fifths (62%) of those in their 70s rate their comfort level the lowest answer possible, “1.” E-Authentication Only 15% of respondents with a computer reported having an e-Authentication ID. Of those with an e-Authentication ID, 29% have used them to sign up for an electronic Loan Deficiency Payment. Those who had used e-Authentication to sign up for e-LDP (13 respondents) rated the ease of signing up for e-LDP 70 on a scale from 0 to 100.
Have used e-Authentication to sign up for e-LDPs
Have an e-Authentication ID
Don't know18%
Do not have an ID67%
Have an ID
15%
N=310
Used ID
29%
Have not used
ID71%
N=45
Final Report 19 2007

USDA Farm Service Agency Marketing Assistance Loan Program Customer Satisfaction Study Outcomes of MAL Program Respondents were asked about the impact that the Commodity Loan Program had on both their individual farm income and on the survival of the farms in their community over the past three years. On a scale where “0” means “not very much impact” and “100” means “a great deal of impact” the program impact on individual farm income received a rating of 56, while impact on survival of farms in their community scored higher (65). Some differences in perceived impact the Commodity Loan Program had were noted. Those with the highest farm income ($250,000 or more) rated the impact on survival in farms in their community lower than those from any other farm income group. At a region-level, those in the South (72) thought the program had more impact on Survival of Farms in their community compared to those in the Atlantic (63), Plains (63) and West (61). All of these noted differences are significant at a 90% level of confidence. Conversely, those in the West (51) likely thought the Commodity Loan Program had less impact on individual farm income than those in South (61) and Midwest (58) did. Both differences are significant at an 80% level of confidence.
Impact of Commodity Loan Program – Region Scores
56
61
58
57
56
51
65
72
67
63
63
61
Aggregate
South
Midwest
Atlantic
Plains
West
IndividualFarm Income
Survival ofFarms inCommunity
Final Report 20 2007
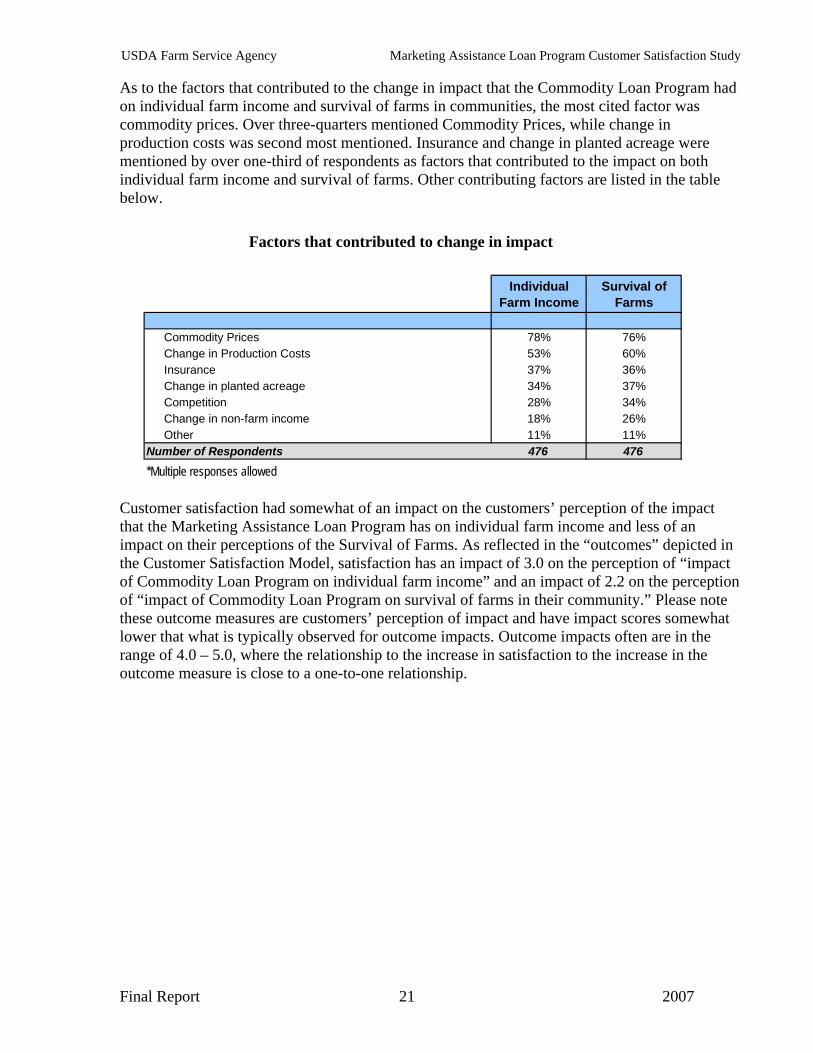
USDA Farm Service Agency Marketing Assistance Loan Program Customer Satisfaction Study As to the factors that contributed to the change in impact that the Commodity Loan Program had on individual farm income and survival of farms in communities, the most cited factor was commodity prices. Over three-quarters mentioned Commodity Prices, while change in production costs was second most mentioned. Insurance and change in planted acreage were mentioned by over one-third of respondents as factors that contributed to the impact on both individual farm income and survival of farms. Other contributing factors are listed in the table below. Factors that contributed to change in impact
Individual Farm Income
Survival of Farms
Commodity Prices 78% 76%Change in Production Costs 53% 60%Insurance 37% 36%Change in planted acreage 34% 37%Competition 28% 34%Change in non-farm income 18% 26%Other 11% 11%
Number of Respondents 476 476
*Multiple responses allowed Customer satisfaction had somewhat of an impact on the customers’ perception of the impact that the Marketing Assistance Loan Program has on individual farm income and less of an impact on their perceptions of the Survival of Farms. As reflected in the “outcomes” depicted in the Customer Satisfaction Model, satisfaction has an impact of 3.0 on the perception of “impact of Commodity Loan Program on individual farm income” and an impact of 2.2 on the perception of “impact of Commodity Loan Program on survival of farms in their community.” Please note these outcome measures are customers’ perception of impact and have impact scores somewhat lower that what is typically observed for outcome impacts. Outcome impacts often are in the range of 4.0 – 5.0, where the relationship to the increase in satisfaction to the increase in the outcome measure is close to a one-to-one relationship.
Final Report 21 2007

USDA Farm Service Agency Marketing Assistance Loan Program Customer Satisfaction Study Summary and Recommendations Satisfaction with the Marketing Assistance Loan Program is on par with the Federal Government average. There are some regional differences in satisfaction, with Atlantic respondents reporting higher satisfaction and West and Plains respondents reporting lower satisfaction. Satisfaction with the Direct and Counter-cyclical Payment Program was measured concurrently and was found to be 4 points higher than satisfaction with the MAL Program. Of the four performance areas or satisfaction drivers measured, respondents rated the area of Customer Service/Staff as the greatest strength of the MAL Program. Additionally, the areas of County Office and Payment were also rated favorably. The Application/Sign Up process was rated least favorably of all of the areas. Two areas in particular, Payments and the Application/Sign Up Process, are key drivers of customer satisfaction for the MAL Program. Customers thought the payments from the MAL Program were accurate and for the most part, timely. The other key driver of satisfaction, Application/Sign Up Process, was rated the lowest of all areas. Clarity of the terms of the program and eligibility requirement, ease of filing and filling out application are all potential opportunities for improvement with the MAL Program. Respondents found the in office Customer Service and Staff to be excellent. Respondents found staff to be highly professional, knowledgeable and providing valuable assistance in a timely manner. Nearly all of the respondents visit the office at least a few times a year or more often - as 94% of respondents are in this category. Almost half of respondents say they typically drop-in without making an appointment. The typical wait time is under 15 minutes regardless of whether the appointment was made or not. Respondents found the County Offices to have convenient hours and locations and they thought that making an appointment was easy. Those in the West gave lowest ratings to the convenience of locations, as they typically had longer drive times to offices. An inverse relationship appears between the amount of time to drive to the office location and the rating of convenience of the location – the longer the drive, the lower the rating of convenience. However, longer drives do not appear to lead to lower satisfaction (at least for those driving 45 minutes or less.) Satisfaction for those with drives of less than 15 minutes; 16-30 minutes and 31-45 minutes were all fairly similar, as only a statistically insignificant 2-point range in satisfaction scores exists among them. This contrasts with the 19-point range in the scores for “convenience of location.” A majority of respondents (65%) of respondents have a PC with access to the Internet and of those with Internet access half (51%) have a high-speed connection such as Broadband or Wi-Fi. These figures were close to the U.S. averages, but it should be noted that a number of MAL respondents (14%) were ages 70 and over – a group that typically has low Internet usage. Respondents indicated given the choice of remotely offered services, obtaining program information and information about status of application or payments would be most preferred. Overall, respondents are moderately likely to conduct business without having to visit the office (mean score was 55 on a scale of 0 to 100). However, nearly one-third of respondents indicated
Final Report 22 2007
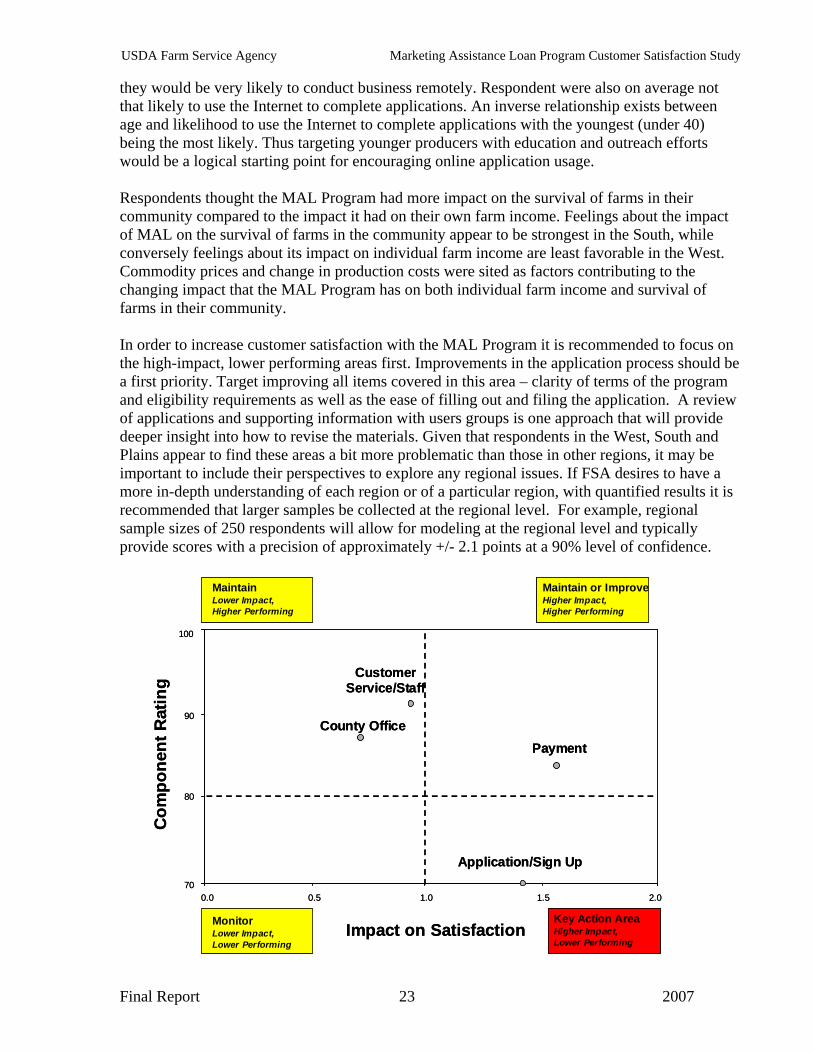
USDA Farm Service Agency Marketing Assistance Loan Program Customer Satisfaction Study they would be very likely to conduct business remotely. Respondent were also on average not that likely to use the Internet to complete applications. An inverse relationship exists between age and likelihood to use the Internet to complete applications with the youngest (under 40) being the most likely. Thus targeting younger producers with education and outreach efforts would be a logical starting point for encouraging online application usage. Respondents thought the MAL Program had more impact on the survival of farms in their community compared to the impact it had on their own farm income. Feelings about the impact of MAL on the survival of farms in the community appear to be strongest in the South, while conversely feelings about its impact on individual farm income are least favorable in the West. Commodity prices and change in production costs were sited as factors contributing to the changing impact that the MAL Program has on both individual farm income and survival of farms in their community. In order to increase customer satisfaction with the MAL Program it is recommended to focus on the high-impact, lower performing areas first. Improvements in the application process should be a first priority. Target improving all items covered in this area – clarity of terms of the program and eligibility requirements as well as the ease of filling out and filing the application. A review of applications and supporting information with users groups is one approach that will provide deeper insight into how to revise the materials. Given that respondents in the West, South and Plains appear to find these areas a bit more problematic than those in other regions, it may be important to include their perspectives to explore any regional issues. If FSA desires to have a more in-depth understanding of each region or of a particular region, with quantified results it is recommended that larger samples be collected at the regional level. For example, regional sample sizes of 250 respondents will allow for modeling at the regional level and typically provide scores with a precision of approximately +/- 2.1 points at a 90% level of confidence.
70
80
90
0.0
100
0.5
Impact on Satisfaction
Com
pone
nt R
atin
g
Maintain Lower Impact, Higher Performing
Application/Sign Up
PaymentCounty Office
Customer Service/Staff
Maintain or ImproveHigher Impact, Higher Performing
Monitor Lower Impact, Lower Performing
Key Action Area Higher Impact, Lower Performing
1.0 1.5 2.070
80
90
0.0
100
0.5
Impact on Satisfaction
Com
pone
nt R
atin
g
Maintain Lower Impact, Higher Performing
Application/Sign Up
PaymentCounty Office
Customer Service/Staff
Maintain or ImproveHigher Impact, Higher Performing
Monitor Lower Impact, Lower Performing
Key Action Area Higher Impact, Lower Performing
1.0 1.5 2.0
Final Report 23 2007
USDA Farm Service Agency Marketing Assistance Loan Program Customer Satisfaction Study While Payment is a high performing area, given the high-impact it has on satisfaction efforts to improve the timeliness of payments will allow FSA to leverage this key driver. A more reliable web system would contribute to this effort. Improved communications that help manage customer expectations about the timeliness of payments is another opportunity to improve in the area of Payment. Customer service and County Office are both high-performing areas where performance should be maintained.
Final Report 24 2007