
Governmentassignmentkennychrisaustin 091005142914 Phpapp01 091007142214 Phpapp01
Upload
robinson-gnanaduraiCategory
view
212download
0
8/23/2019 beappt-111125065835-phpapp01
http://slidepdf.com/reader/full/beappt-111125065835-phpapp01 1/17
ECONOMICS ASSIGNMENT
BREAK EVEN ANALYSIS
SUBMITTED TO :- MRS. V. KUTUMBLE
SUBMITTED BY:- SONAM JAIN
SOURABH MOYAL
MBA (FT)- SEC A

8/23/2019 beappt-111125065835-phpapp01
http://slidepdf.com/reader/full/beappt-111125065835-phpapp01 2/17
BREAK-EVEN ANALYSIS According to Martz,Curry and Frank, "A break-even analysis indicates at what
level cost and revenue are in equilibrium.”
•The BEP is that point of activity(sales volume) where total revenues and total
expenses are equal.
• Profit=0
EQUATION
[Break even sales = fixed cost + variable cost]
Fixed Costs Cost that do not change when production or sales levels do change, such as rent,
property tax, insurance, or interest expense. The fixed costs are summarized for
a specific time period (generally one month).
Variable Cost (Per Unit Cost) Variable costs are costs directly related to production units. Typical variablecosts include direct labor and direct materials. The variable cost times the
number of units sold will equal the Total Variable Cost. Total Variable costs plus
Fixed costs make up the total cost of production.

8/23/2019 beappt-111125065835-phpapp01
http://slidepdf.com/reader/full/beappt-111125065835-phpapp01 3/17
Selling Price (per unit price) The price that a unit is sold for. Sales Tax is not included the selling
price and sales taxes paid are not included as a cost. The SellingPrice times the number of units sold equals the Total Sales.
CHARACTERSTICS OF BREAK-EVEN
POINT
1.It is a point where losses cease to occur while profits
have not yet begun.
2. If the firm produces and sells less than what is suggested
by BEP, it would incur losses, while if it sells more thanlevel of BEP,it makes profit.
3.It indicates the minimum level of production/sales which
the company has to undertake in order to be economically
viable.
8/23/2019 beappt-111125065835-phpapp01
http://slidepdf.com/reader/full/beappt-111125065835-phpapp01 4/17
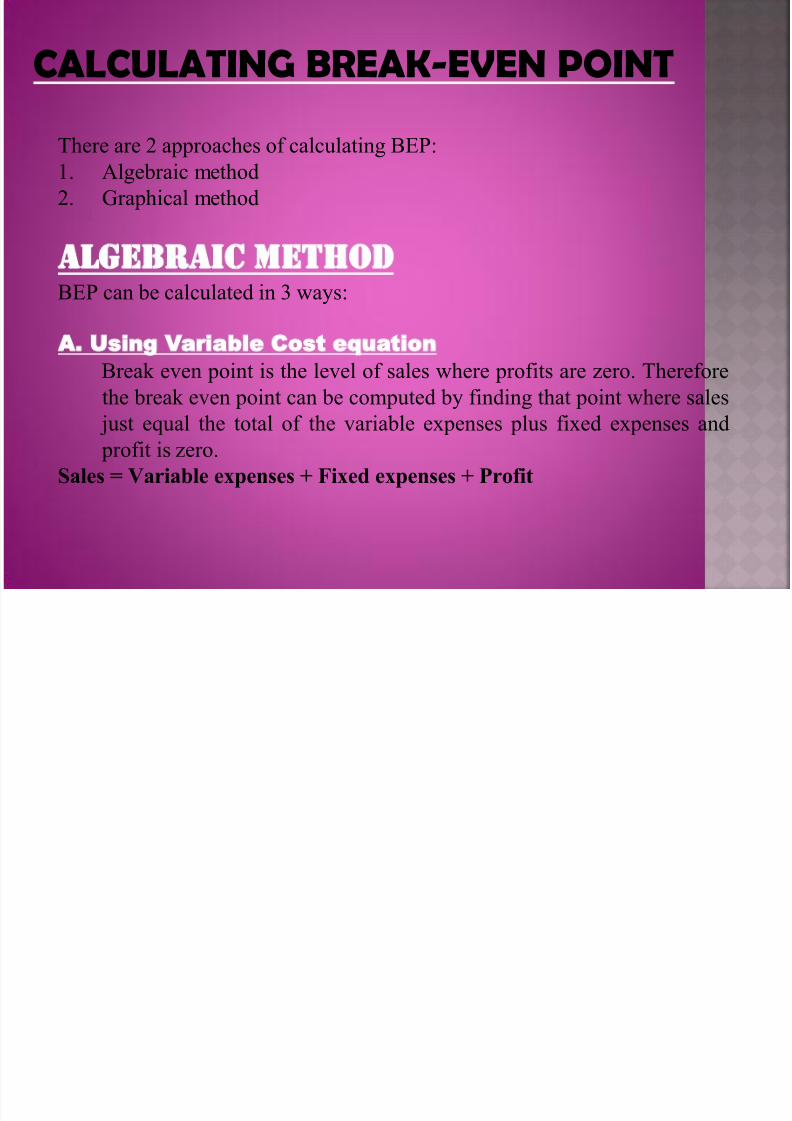
CALCULATING BREAK-EVEN POINT There are 2 approaches of calculating BEP:
1. Algebraic method
2. Graphical method
ALGEBRAIC METHODBEP can be calculated in 3 ways:
A. Using Variable Cost equation
Break even point is the level of sales where profits are zero. Therefore
the break even point can be computed by finding that point where sales
just equal the total of the variable expenses plus fixed expenses and
profit is zero.
Sales = Variable expenses + Fixed expenses + Profit

8/23/2019 beappt-111125065835-phpapp01
http://slidepdf.com/reader/full/beappt-111125065835-phpapp01 5/17
In the linear Cost-Volume-Profit analysis model, the break-even point (in
terms of Unit Sales (X)) can be directly computed in terms of Total Revenue
(TR) and Total Costs (TC) as:
TR=TC
S*X=TFC+V*X
S*X-V*X=TFC
(S-V)*X=TFC
X=TFC/(S-V)
Where:TFC is Total Fixed Costs,
S is Unit Sale Price, and
V is Unit Variable Cost.
Example: A coastal ship can carry 1,00,000 passengers per month at a fare of
Rs.850.Variable cost per passenger is Rs.100 while the fixed cost areRs.75,00,000per month. Find breakeven quantity and sales volume for the
ship.
8/23/2019 beappt-111125065835-phpapp01
http://slidepdf.com/reader/full/beappt-111125065835-phpapp01 6/17
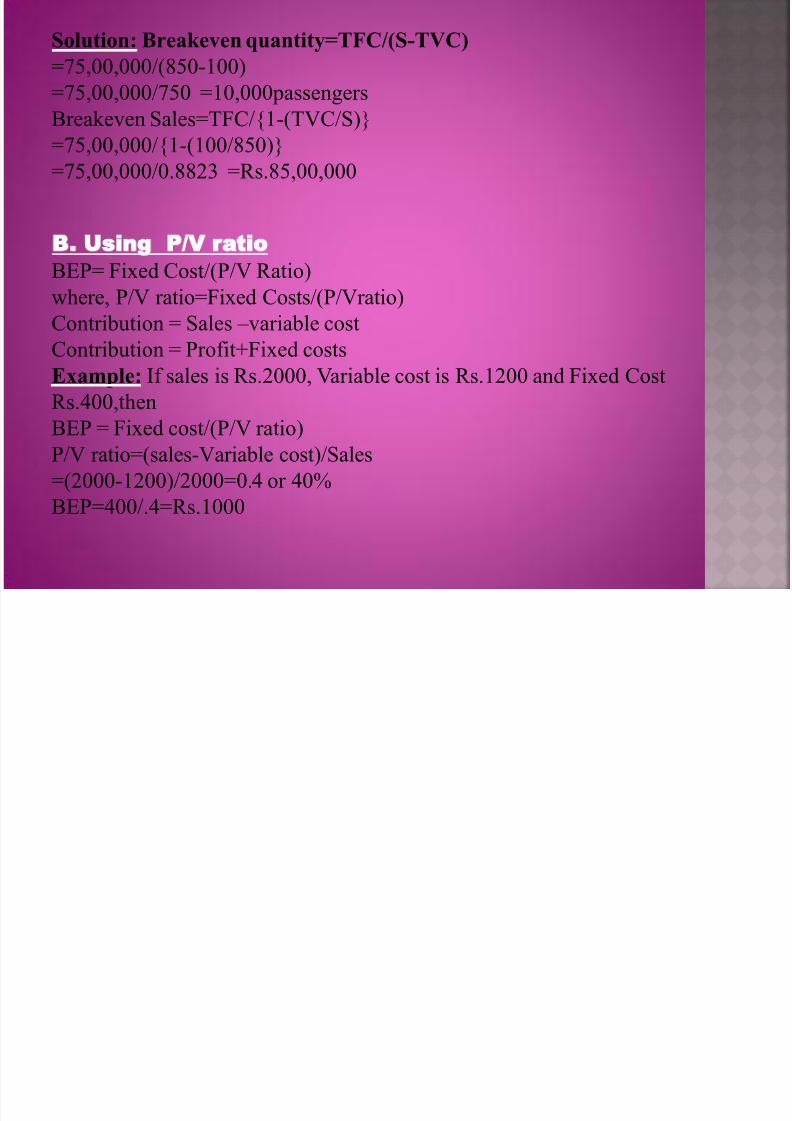
Solution: Breakeven quantity=TFC/(S-TVC)
=75,00,000/(850-100)
=75,00,000/750 =10,000passengers
Breakeven Sales=TFC/{1-(TVC/S)}
=75,00,000/{1-(100/850)}=75,00,000/0.8823 =Rs.85,00,000
B. Using P/V ratio
BEP= Fixed Cost/(P/V Ratio)where, P/V ratio=Fixed Costs/(P/Vratio)
Contribution = Sales – variable cost
Contribution = Profit+Fixed costs
Example: If sales is Rs.2000, Variable cost is Rs.1200 and Fixed Cost
Rs.400,then
BEP = Fixed cost/(P/V ratio)
P/V ratio=(sales-Variable cost)/Sales
=(2000-1200)/2000=0.4 or 40%
BEP=400/.4=Rs.1000
8/23/2019 beappt-111125065835-phpapp01
http://slidepdf.com/reader/full/beappt-111125065835-phpapp01 7/17
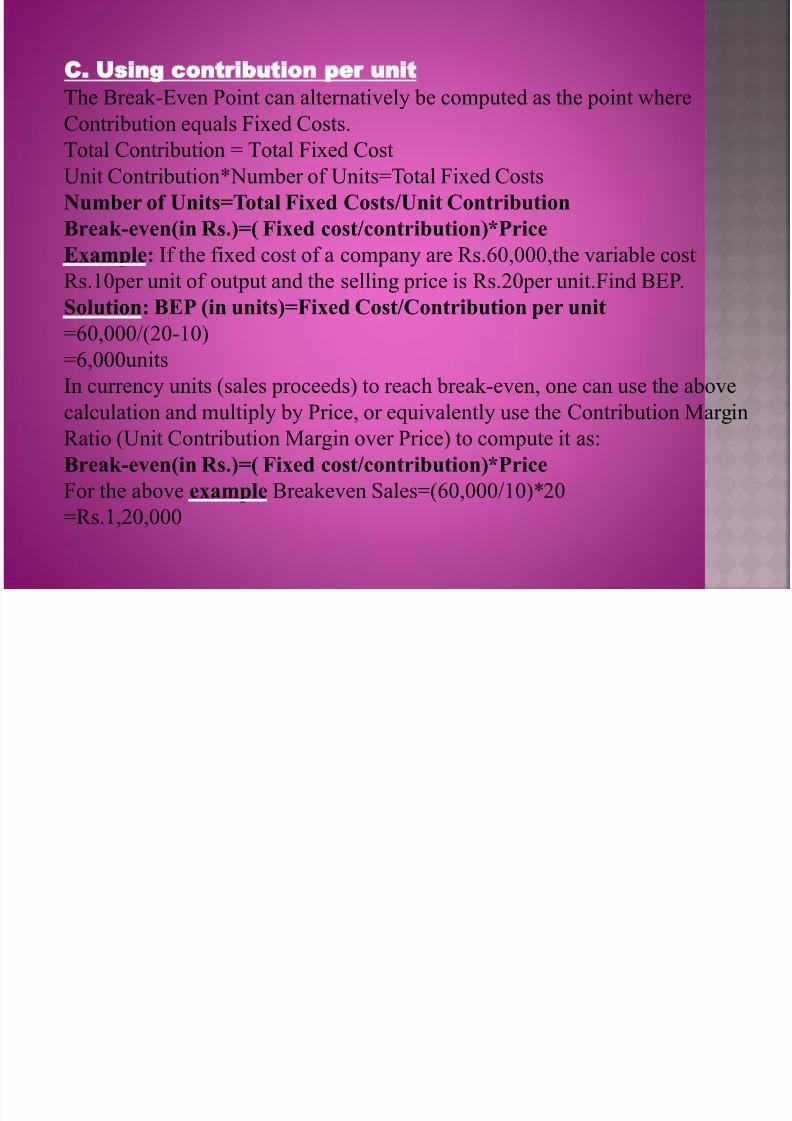
C. Using contribution per unit
The Break-Even Point can alternatively be computed as the point where
Contribution equals Fixed Costs.
Total Contribution = Total Fixed Cost
Unit Contribution*Number of Units=Total Fixed Costs
Number of Units=Total Fixed Costs/Unit Contribution
Break-even(in Rs.)=( Fixed cost/contribution)*Price
Example: If the fixed cost of a company are Rs.60,000,the variable cost
Rs.10per unit of output and the selling price is Rs.20per unit.Find BEP.Solution: BEP (in units)=Fixed Cost/Contribution per unit
=60,000/(20-10)
=6,000units
In currency units (sales proceeds) to reach break-even, one can use the above
calculation and multiply by Price, or equivalently use the Contribution MarginRatio (Unit Contribution Margin over Price) to compute it as:
Break-even(in Rs.)=( Fixed cost/contribution)*Price
For the above example Breakeven Sales=(60,000/10)*20
=Rs.1,20,000
8/23/2019 beappt-111125065835-phpapp01
http://slidepdf.com/reader/full/beappt-111125065835-phpapp01 8/17
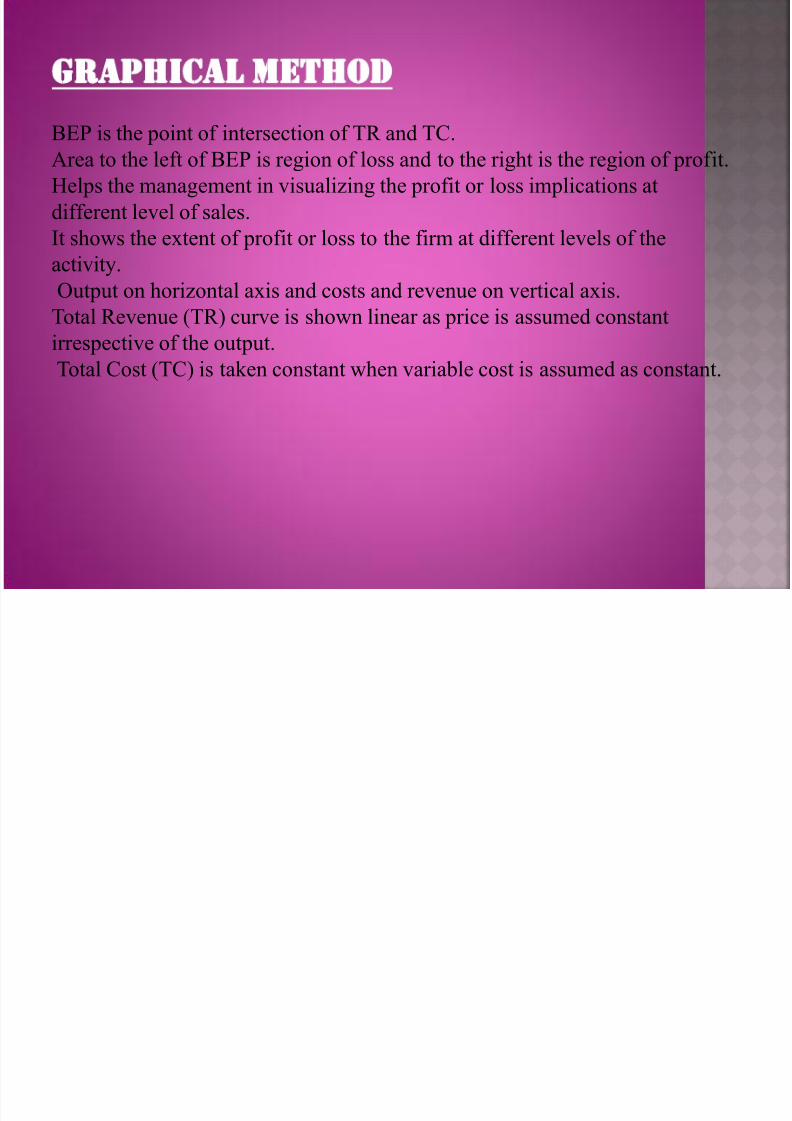
GRAPHICAL METHOD
BEP is the point of intersection of TR and TC.Area to the left of BEP is region of loss and to the right is the region of profit.
Helps the management in visualizing the profit or loss implications at
different level of sales.
It shows the extent of profit or loss to the firm at different levels of the
activity.
Output on horizontal axis and costs and revenue on vertical axis.
Total Revenue (TR) curve is shown linear as price is assumed constant
irrespective of the output.
Total Cost (TC) is taken constant when variable cost is assumed as constant.
8/23/2019 beappt-111125065835-phpapp01
http://slidepdf.com/reader/full/beappt-111125065835-phpapp01 9/17
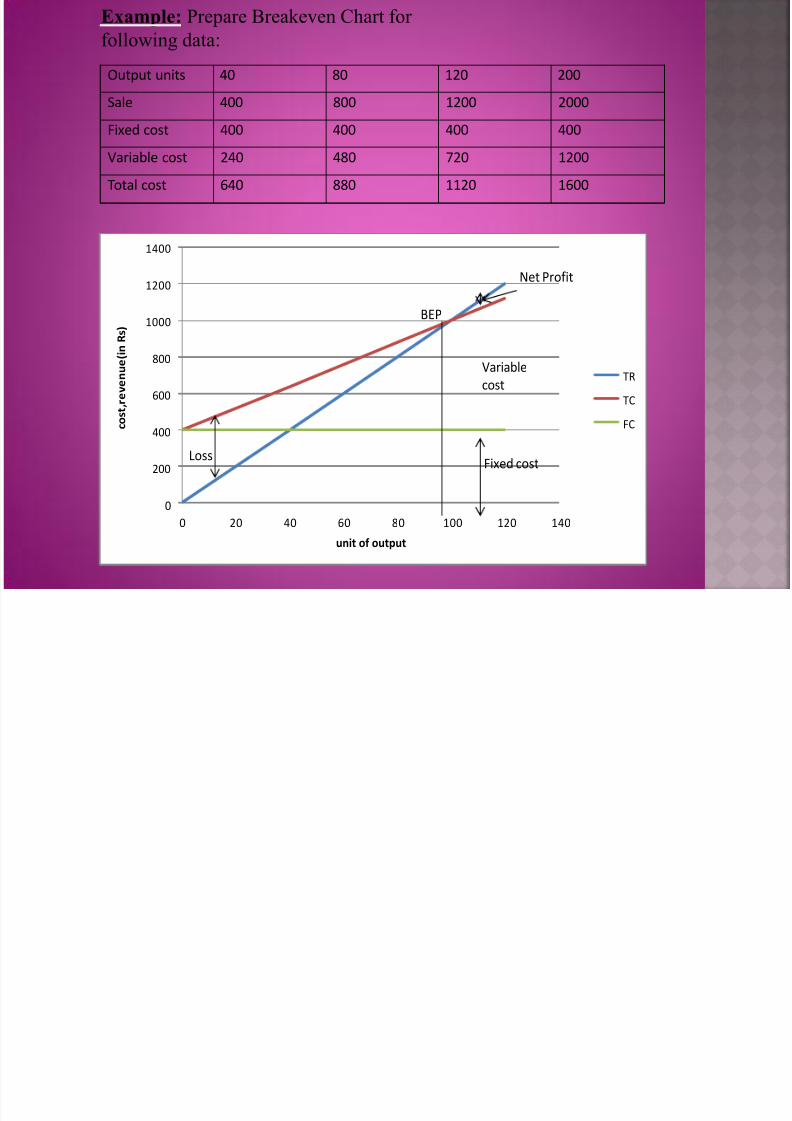
Example: Prepare Breakeven Chart for
following data:
Output units 40 80 120 200
Sale 400 800 1200 2000
Fixed cost 400 400 400 400
Variable cost 240 480 720 1200
Total cost 640 880 1120 1600
0
200
400
600
800
1000
1200
1400
0 20 40 60 80 100 120 140
c o s
t , r
e v e n u e ( i n
R s )
unit of output
TR
TC
FC
BEP
Net Profit
Variable
cost
Fixed costLoss
8/23/2019 beappt-111125065835-phpapp01
http://slidepdf.com/reader/full/beappt-111125065835-phpapp01 10/17
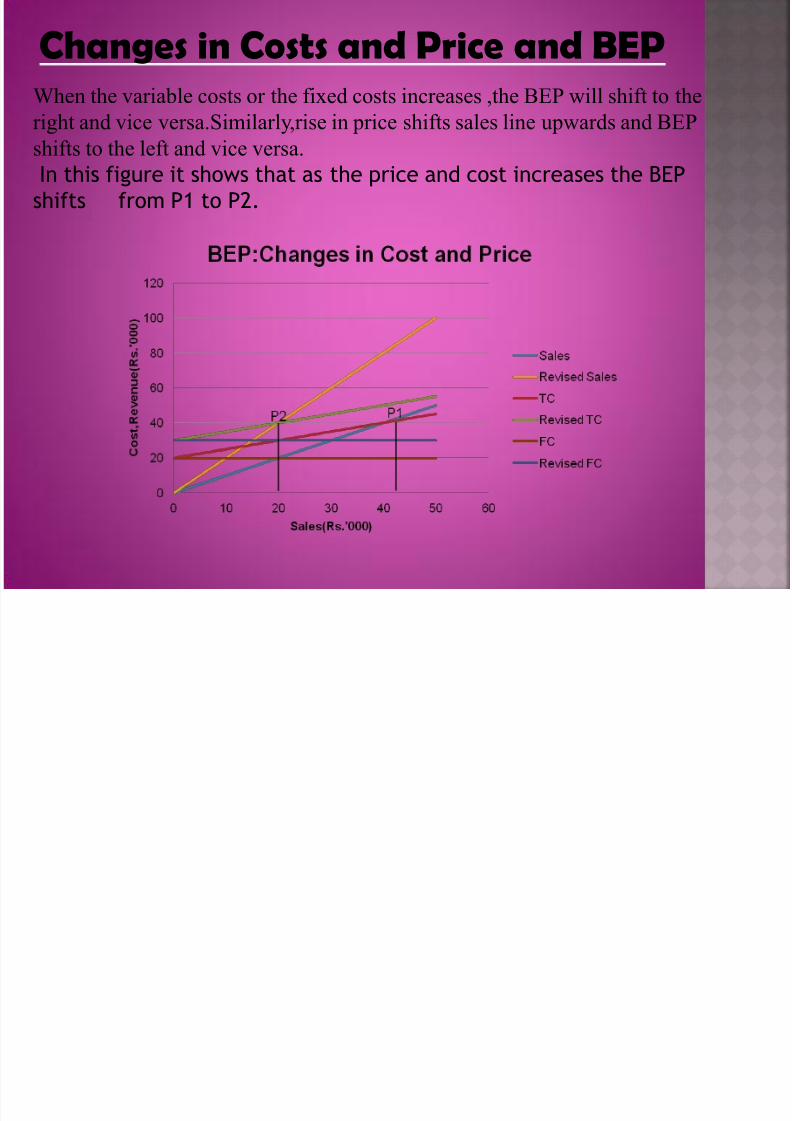
Changes in Costs and Price and BEP When the variable costs or the fixed costs increases ,the BEP will shift to the
right and vice versa.Similarly,rise in price shifts sales line upwards and BEP
shifts to the left and vice versa.
In this figure it shows that as the price and cost increases the BEP
shifts from P1 to P2.
8/23/2019 beappt-111125065835-phpapp01
http://slidepdf.com/reader/full/beappt-111125065835-phpapp01 11/17
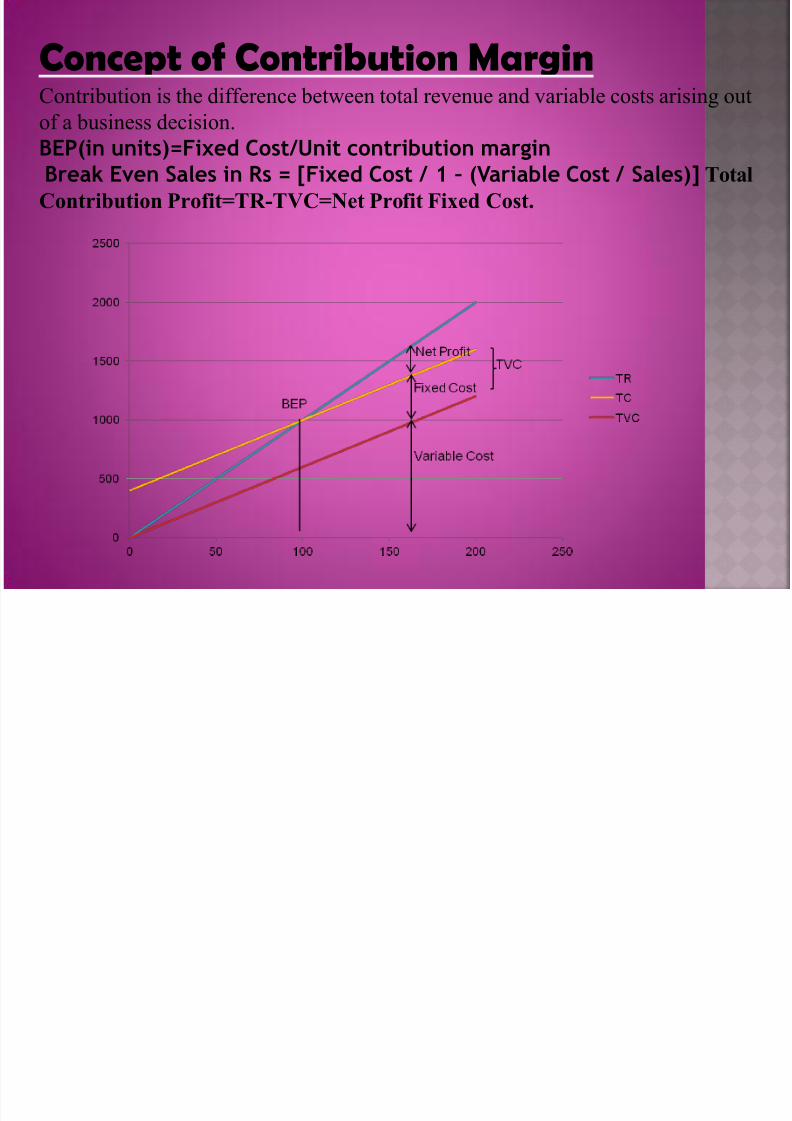
Concept of Contribution Margin Contribution is the difference between total revenue and variable costs arising out
of a business decision.
BEP(in units)=Fixed Cost/Unit contribution margin
Break Even Sales in Rs = [Fixed Cost / 1 – (Variable Cost / Sales)] Total
Contribution Profit=TR-TVC=Net Profit Fixed Cost.
8/23/2019 beappt-111125065835-phpapp01
http://slidepdf.com/reader/full/beappt-111125065835-phpapp01 12/17
MARGIN OF SAFETY Margin of safety represents the strength of the business.
It enables a business to know what is the exact amount it has
gained or lost and whether they are over or below the break even
point.margin of safety = (current output - breakeven output)
margin of safety% = {(current output-breakeven
output)/current output}x100
8/23/2019 beappt-111125065835-phpapp01
http://slidepdf.com/reader/full/beappt-111125065835-phpapp01 13/17
BASIC ASSUMPTIONSThere are several assumptions that affect the applicability of break-even analysis.
If these assumptions are violated, the analysis may lead to erroneous conclusions.
1.It assumes that cost can be classified into fixed and variable costs,thus ignoring
semi-variable costs.
2.Sale price of the product is assumed constant, thus giving linearity property to
total cost curve.
3.It assumes constant rate of increase in variable cost, thereby imparting linearityto total cost curve.
4.It assumes no improvement in technology and labor efficiency.
5.Changes in input prices are also ruled out.
6.Break-even analysis also assumes that the production and sales are
synchronized, in the sense that there is no addition or subtraction frominventory.A
8/23/2019 beappt-111125065835-phpapp01
http://slidepdf.com/reader/full/beappt-111125065835-phpapp01 14/17
BENEFITS/ADVANTAGES OF BREAK-
EVEN ANALYSIS
1.The main advantages of break even point analysis is that it explains the
relationship between cost, production, volume and returns.
2. It can be extended to show how changes in fixed cost, variable cost,commodity prices, revenues will effect profit levels and break even points.
3.Break even analysis is most useful when used with partial budgeting, capital
budgeting techniques.
4.It indicates the lowest amount of business activity necessary to prevent losses.
8/23/2019 beappt-111125065835-phpapp01
http://slidepdf.com/reader/full/beappt-111125065835-phpapp01 15/17
USES OF BEP1. It helps in determining the optimal level of output, below which it would not be
profitable for a firm to produce. 2.It helps in determining the target capcity for a firm to get the benefit of
minimum unit cost of production.
3.With the help of break-even analysis, the firm can determine minimum cost for
a given level of output.
4.It helps in deciding which products to be produced and which to be bought bythe firm.
5.Plant expansion or contraction decisions are often based on the break-even
analysis of the perceived situation.
6.Impact of changes in prices and costs on profits of the firm can also be analyzed
with the help of break even technique.
7.Effect of high fixed costs and low variable costs to the total cost can be studied.
8.Cash break even chart helps proper planning of cash requirements.
9.Helps in finding selling price which will be most beneficial for the firm.
10.Emphasizes the importance of capacity utilization for achieving economies.
8/23/2019 beappt-111125065835-phpapp01
http://slidepdf.com/reader/full/beappt-111125065835-phpapp01 16/17
LIMITATIONS OF BREAK-EVEN
ANALYSIS
•Break-even analysis is only a supply side (i.e. costs only) analysis, as it tells us
nothing about what sales are actually likely to be for the product at these various
prices.
•
It assumes that fixed costs (FC) are constant. Although, this is true in the shortrun, an increase in the scale of production is likely to cause fixed costs to rise.
•It assumes average variable costs are constant per unit of output, at least in the
range of likely quantities of sales. (i.e. linearity)
•It assumes that the quantity of goods produced is equal to the quantity of goods
sold (i.e., there is no change in the quantity of goods held in inventory at the
beginning of the period and the quantity of goods held in inventory at the end of
the period).
•It is a common knowledge that profit depend on various factors like
technological improvements, managerial effectiveness,etc.and not only on the
level of output. The break-even analysis, by assuming that profit are a function of
output alone, gives us only a partial view of situation.

8/23/2019 beappt-111125065835-phpapp01
http://slidepdf.com/reader/full/beappt-111125065835-phpapp01 17/17