beamer-example (2)
30
Graph Algorithms for Visualizing High Dimensional Data Abhinav Shankaranarayanan Venkataraman Directed by : Prof. Ricard Gavalda and Prof. Marta Arias Universitat Politecnica de Catalunya (UPC), Barcelona 27 June 2016 Abhinav S V (UPC Barcelona) Graph Viz. Project 27 June 2016 1 / 30
-
Upload
abhinav-shankar -
Category
Documents
-
view
143 -
download
0
Transcript of beamer-example (2)

Graph Algorithms for Visualizing High DimensionalData
Abhinav Shankaranarayanan VenkataramanDirected by : Prof. Ricard Gavalda and Prof. Marta Arias
Universitat Politecnica de Catalunya (UPC), Barcelona
27 June 2016
Abhinav S V (UPC Barcelona) Graph Viz. Project 27 June 2016 1 / 30
Outline
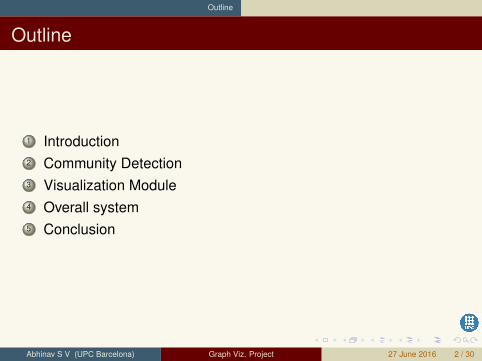
Outline
1 Introduction2 Community Detection3 Visualization Module4 Overall system5 Conclusion
Abhinav S V (UPC Barcelona) Graph Viz. Project 27 June 2016 2 / 30
Project Details
Project Research Group
I This project is carried out within the LARCA research group atUPC .
I Researchers within LARCA have in the last two years begancollaborations with hospital and health agencies for the analysis ofelectronic healthcare records [EHR].
I In previous work within the group, they proposed to organize theinformation in EHR in the form of graphs and hyper- graphs, whichcan then be navigated by experts and mined with graph andnetwork theoretic tools.
Abhinav S V (UPC Barcelona) Graph Viz. Project 27 June 2016 3 / 30
Introduction Goals of the Project
Goal of the Project
1 To survey a few algorithms that aim in community finding keepingin mind that the input is from the medical domain.
2 To choose an algorithms that benefit the purpose of organizinggraphs from medical domain and for the purpose of visualization.
3 To implement the algorithms and test the efficiency of thealgorithm using variety of graphs.
4 To build a Graphic User Interface (GUI) which enablesvisualization of the raw input on a web browser by drawing graphs.
Abhinav S V (UPC Barcelona) Graph Viz. Project 27 June 2016 4 / 30

Introduction Planning And Budget
Planning and Budget
1 Planning:I Required knowledge acquisitionI Paper AnalysisI Design and ImplementationI Testing II Testing III Report Writing
2 Economic budget: Hardware budget, Software Budget, HumanResource Budget
3 Sustainability: Economically sustainable, Socially sustainable,Environmentally sustainable
Abhinav S V (UPC Barcelona) Graph Viz. Project 27 June 2016 5 / 30
Introduction What is a Community?
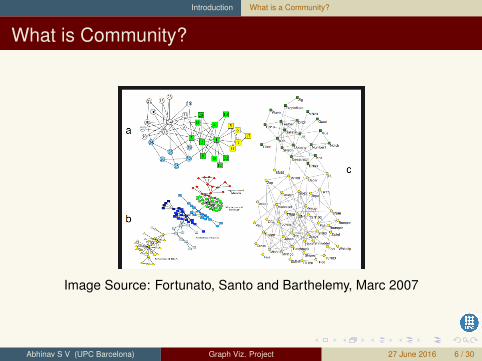
What is Community?
Image Source: Fortunato, Santo and Barthelemy, Marc 2007
Abhinav S V (UPC Barcelona) Graph Viz. Project 27 June 2016 6 / 30

State-of-the-art in Community Detection
State-of-the-art in Community Detection
1 Communities are a part of the graph that have fewer ties with therest of the system.
2 A community should be densely connected, well separated fromthe rest of the network and the members of the network should bemore similar among themselves than with the rest.
Exploring state of the art: [3]
Abhinav S V (UPC Barcelona) Graph Viz. Project 27 June 2016 7 / 30
Louvain Community Detection Algorithm Louvain Method
Louvain Algorithm [2]
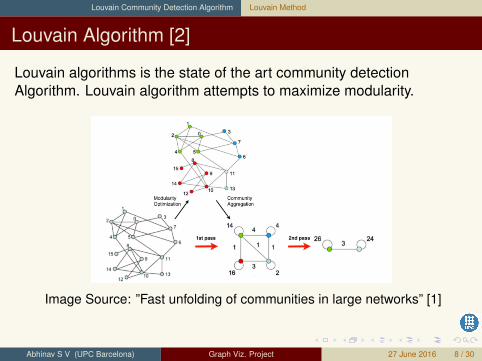
Louvain algorithms is the state of the art community detectionAlgorithm. Louvain algorithm attempts to maximize modularity.
Image Source: ”Fast unfolding of communities in large networks” [1]
Abhinav S V (UPC Barcelona) Graph Viz. Project 27 June 2016 8 / 30

Louvain Community Detection Algorithm Louvain Method
Mode of implementation
1 The implementation of the Algorithm is in Python. pyLouvain iscode that is freely available although considering the taskperformed by the project it is tough to use pyLouvain directly.Hence modifications were made to pyLouvain and some part ofthe code was reused.
2 The input data structure was altered. The Input file is stored in amatrix and its transpose is used to get the node set. This is usedto for a edge dictionary.
3 The first phase of pyLouvain is used as it is in the project and thesecond phase has been modified in the manner that relabelling isdone.
Abhinav S V (UPC Barcelona) Graph Viz. Project 27 June 2016 9 / 30

Louvain Community Detection Algorithm Louvain Method
N until 2000 and Q=0.4, Scale-Free degreedistribution Experiments
Abhinav S V (UPC Barcelona) Graph Viz. Project 27 June 2016 10 / 30

Louvain Community Detection Algorithm Louvain Method
Experiments on Real World Graph
Abhinav S V (UPC Barcelona) Graph Viz. Project 27 June 2016 11 / 30

Louvain Community Detection Algorithm Louvain Method
Famous Graphs Experiments
Abhinav S V (UPC Barcelona) Graph Viz. Project 27 June 2016 12 / 30
Visualization Libraries
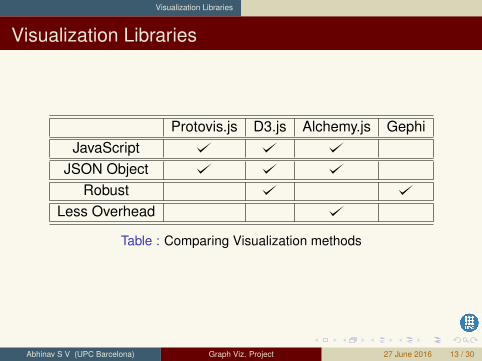
Visualization Libraries
Protovis.js D3.js Alchemy.js GephiJavaScript
JSON ObjectRobust
Less Overhead
Table : Comparing Visualization methods
Abhinav S V (UPC Barcelona) Graph Viz. Project 27 June 2016 13 / 30

Visualization Libraries Alchemy.js
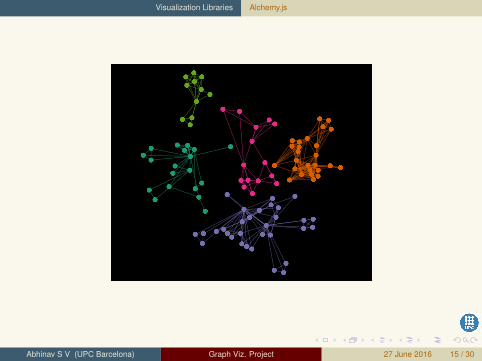
1 Alchemy needs three main units to form as an application namely:alchemy.css, alchemy.js and data.
2 Five simple steps to connect the JSON object to draw the graph.3 Tests:
Abhinav S V (UPC Barcelona) Graph Viz. Project 27 June 2016 14 / 30
Visualization Libraries Alchemy.js
Abhinav S V (UPC Barcelona) Graph Viz. Project 27 June 2016 15 / 30

Visualization Libraries Alchemy.js
Abhinav S V (UPC Barcelona) Graph Viz. Project 27 June 2016 16 / 30

Visualization Libraries Alchemy.js
Abhinav S V (UPC Barcelona) Graph Viz. Project 27 June 2016 17 / 30
Visualization Libraries Alchemy.js
Abhinav S V (UPC Barcelona) Graph Viz. Project 27 June 2016 18 / 30

Visualization Libraries Alchemy.js
Abhinav S V (UPC Barcelona) Graph Viz. Project 27 June 2016 19 / 30

Overall System
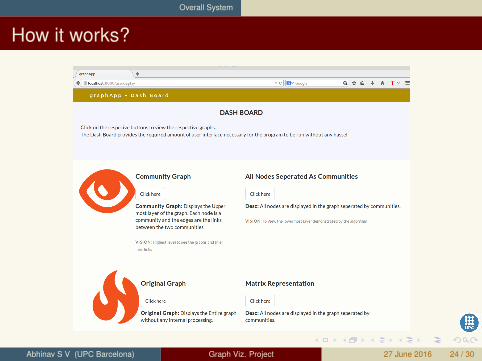
Web framework and Front-end
1 Angular.js was recommended by the main project, but toocomplex for our requirement.
2 Django, Grok and Web.py were considered. Web.py was finallychosen.
3 Bootstrap was used as the front-end framework. It was used forthe front-end contrasting with web.py which was used behind.
Abhinav S V (UPC Barcelona) Graph Viz. Project 27 June 2016 20 / 30

Overall System
How it works?
Abhinav S V (UPC Barcelona) Graph Viz. Project 27 June 2016 21 / 30

Overall System
How it works?
Abhinav S V (UPC Barcelona) Graph Viz. Project 27 June 2016 22 / 30

Overall System
How it works?
Abhinav S V (UPC Barcelona) Graph Viz. Project 27 June 2016 23 / 30
Overall System
How it works?
Abhinav S V (UPC Barcelona) Graph Viz. Project 27 June 2016 24 / 30

Overall System
How it works?
Abhinav S V (UPC Barcelona) Graph Viz. Project 27 June 2016 25 / 30

Conclusions
Conclusion
1 In the project we have surveyed a few algorithms that aim incommunity finding keeping in mind that the input is taken fromhealth care domain.
2 Louvain Community detection algorithm was chosen forcommunity detection and for visualization. Alchemy.js wereselected after considering the input and a few state of the artalgorithms.
3 The algorithms and frameworks thus found were implemented andtests were conducted for finding the efficiency of the algorithms.
4 A GUI implementing Web.py and Bootstrap was createdcombining the visualization and the computation.
Abhinav S V (UPC Barcelona) Graph Viz. Project 27 June 2016 26 / 30
Conclusions
Challenges
There were quite a few challenges in the project. I was from a puretheoretical background, so I had to learn all the following from scratch:
1 Python2 JavaScript3 WebFrame works - Django, web.py4 Learning Alchemy.js and web.py5 I had some experience in Linux, git and github
Abhinav S V (UPC Barcelona) Graph Viz. Project 27 June 2016 27 / 30

Conclusions Personal Learning
Personal Learning
1 Exploring and trying many softwares.2 Data visualization and Algorithms3 Building a web application4 Python and JavaScript in Depth
Abhinav S V (UPC Barcelona) Graph Viz. Project 27 June 2016 28 / 30

References
List of References that were used
Vincent D Blondel, Jean-Loup Guillaume, Renaud Lambiotte, andEtienne Lefebvre.Fast unfolding of communities in large networks.Journal of statistical mechanics: theory and experiment,2008(10):P10008, 2008.
Santo Fortunato.Community detection in graphs.Physics reports, 486(3):75–174, 2010.
Stanislav Sobolevsky, Riccardo Campari, Alexander Belyi, andCarlo Ratti.General optimization technique for high-quality communitydetection in complex networks.Physical Review E, 90(1):012811, 2014.
Abhinav S V (UPC Barcelona) Graph Viz. Project 27 June 2016 29 / 30

Gracies
Thank you
Thank you for all those who supported me throughout the project.It was a Great time at Barcelona working with Prof. Ricard and Prof.Marta.
Abhinav S V (UPC Barcelona) Graph Viz. Project 27 June 2016 30 / 30