BEACH ENERGY LIMITED CREDIT SUISSE AUSTRALIAN ENERGY ... · 6/14/2017 · CREDIT SUISSE AUSTRALIAN...
26
BEACH ENERGY LIMITED CREDIT SUISSE AUSTRALIAN ENERGY CONFERENCE 14 June 2017 For personal use only
Transcript of BEACH ENERGY LIMITED CREDIT SUISSE AUSTRALIAN ENERGY ... · 6/14/2017 · CREDIT SUISSE AUSTRALIAN...
BEACH ENERGY LIMITED
CREDIT SUISSE AUSTRALIAN ENERGY CONFERENCE
14 June 2017
For
per
sona
l use
onl
y
2
Disclaimer This presentation contains forward looking statements that are subject to risk factors associated with oil, gas and related businesses. It is believed that the expectations reflected in these statements are reasonable but they may be affected by a variety of variables and changes in underlying assumptions which could cause actual results or trends to differ materially, including, but not limited to: price fluctuations, actual demand, currency fluctuations, drilling and production results, reserve estimates, loss of market, industry competition, environmental risks, physical risks, legislative, fiscal and regulatory developments, economic and financial market conditions in various countries and regions, political risks, project delays or advancements, approvals and cost estimates.
EBITDA (earnings before interest, tax, depreciation, depletion, evaluation and impairment) and underlying profit are non-IFRS measures that are presented to provide an understanding of the performance of Beach’s operations. They have not been subject to audit or review by Beach’s external auditors but have been extracted from audited or reviewed financial statements. Underlying profit excludes the impacts of asset disposals and impairments, as well as items that are subject to significant variability from one period to the next. The non-IFRS financial information is unaudited however the numbers have been extracted from the audited financial statements.
All references to dollars, cents or $ in this presentation are to Australian currency, unless otherwise stated. References to “Beach” may be references to Beach Energy Limited or its applicable subsidiaries. Unless otherwise noted, all references to reserves and resources figures are as at 30 June 2016 and represent Beach’s share.
References to planned FY18 activity are subject to finalisation of work programs and Board approvals.
Competent persons statement The reserves and resources information in this presentation is based on, and fairly represents, information and supporting documentation prepared by, or under the supervision of, Mr Tony Lake (Manager Gas Development). Mr Lake is an employee of Beach Energy Limited and has a BE (Mech) degree from the University of Adelaide and is a member of the Society of Petroleum Engineers (SPE). The reserves and resources information in this presentation has been issued with the prior written consent of Mr Lake in the form and context in which it appears.
Compliance statements
For
per
sona
l use
onl
y
3
FY17/18 Outlook 4
Exploration and Development 9
East Coast Gas Market 14
A Unique Value Proposition 19
Appendix 21
Contents
For
per
sona
l use
onl
y
CREDIT SUISSE AUSTRALIAN ENERGY CONFERENCE
BEACH ENERGY LIMITED
FY17/18 OUTLOOK
For
per
sona
l use
onl
y
5
A robust base business supporting increased activity
Highly profitable Turnaround in underlying profit; +1,023% in H1 FY171
US$10 annual oil price increase delivers +$50 million NPAT and +$65 million operating cash flow
Increasing drill bit activity 50 wells drilled year-to-date at a success rate of 82%
Operated gas exploration success rate of 75% in FY17
Material increase in FY18 well count anticipated
Cost focused culture entrenched US$20/bbl cash flow breakeven2
Western Flank operated field costs ~$2.70/boe
>30% reduction in Cooper Basin JV drill costs and drill durations
Refreshed exploration focus Unlocking new reserves from proven reservoirs
Planned horizontal drilling in FY18 to optimise recoveries
Targeting full replacement of 2P reserves over next 2 years
Substantial liquidity $175 million net cash; $675 million available liquidity3
Establishment of dividend framework under consideration
Inorganic growth Shareholder value accretion primary objective
Multiple opportunities under review
1. Underlying net profit after tax; for a reconciliation to statutory net profit after tax, refer to results announcement of 20 February 2017 2. Cash flow breakeven and cost references relate to H1 FY17; refer slides 24-25 for further information 3. As at 31 March 2017
For
per
sona
l use
onl
y
6
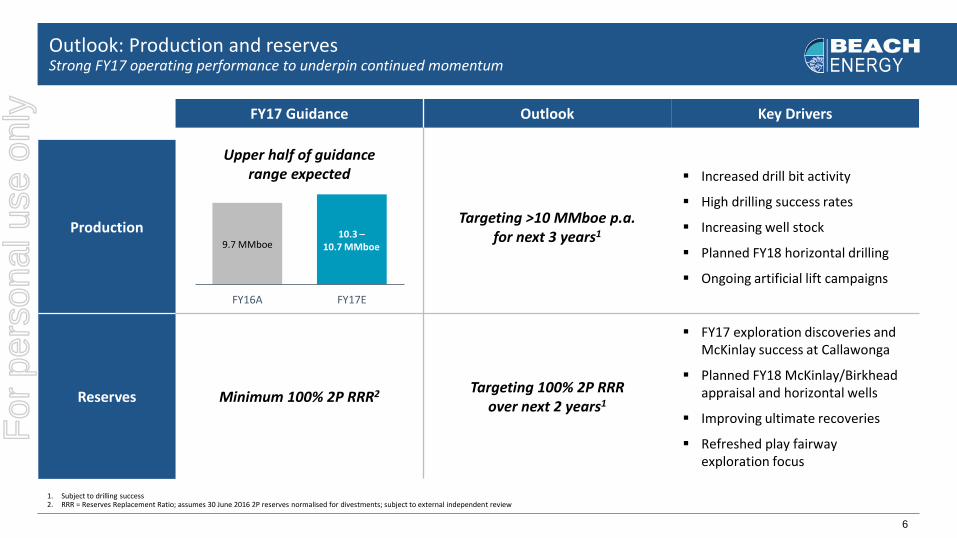
Outlook: Production and reserves Strong FY17 operating performance to underpin continued momentum
FY17 Guidance Outlook Key Drivers
Production
Upper half of guidance range expected
Targeting >10 MMboe p.a. for next 3 years1
Increased drill bit activity
High drilling success rates
Increasing well stock
Planned FY18 horizontal drilling
Ongoing artificial lift campaigns
Reserves Minimum 100% 2P RRR2 Targeting 100% 2P RRR over next 2 years1
FY17 exploration discoveries and McKinlay success at Callawonga
Planned FY18 McKinlay/Birkhead appraisal and horizontal wells
Improving ultimate recoveries
Refreshed play fairway exploration focus
FY16A FY17E
1. Subject to drilling success 2. RRR = Reserves Replacement Ratio; assumes 30 June 2016 2P reserves normalised for divestments; subject to external independent review
9.7 MMboe 10.3 –
10.7 MMboe
For
per
sona
l use
onl
y
7
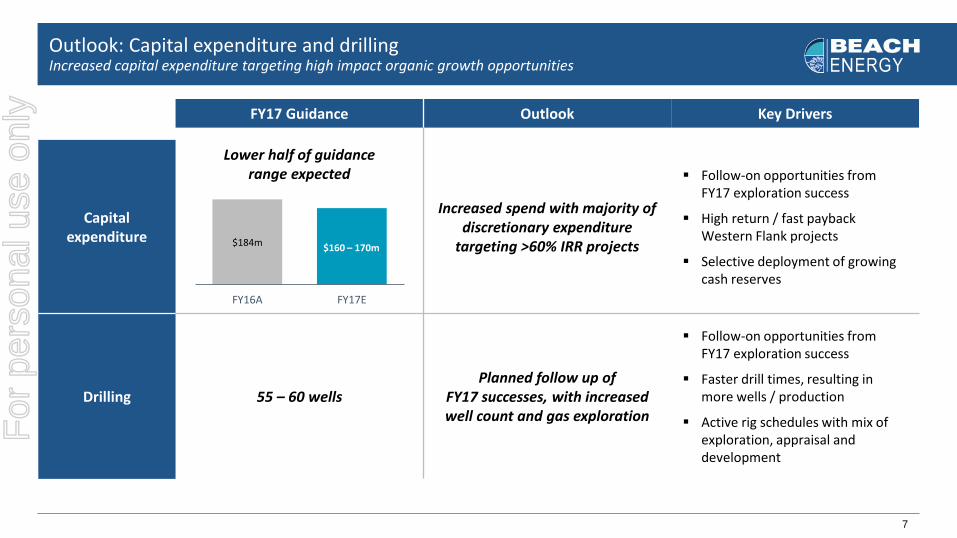
Outlook: Capital expenditure and drilling Increased capital expenditure targeting high impact organic growth opportunities
FY17 Guidance Outlook Key Drivers
Capital expenditure
Lower half of guidance range expected
Increased spend with majority of discretionary expenditure
targeting >60% IRR projects
Follow-on opportunities from FY17 exploration success
High return / fast payback Western Flank projects
Selective deployment of growing cash reserves
Drilling 55 – 60 wells Planned follow up of
FY17 successes, with increased well count and gas exploration
Follow-on opportunities from FY17 exploration success
Faster drill times, resulting in more wells / production
Active rig schedules with mix of exploration, appraisal and development
FY16A FY17E
$184m $160 – 170m
For
per
sona
l use
onl
y
8
Inorganic growth
Uniquely positioned to pursue value accretive growth opportunities
Clearly defined inorganic growth strategy underpinned by robust base business
Shareholder value accretion primary objective
Multiple opportunities under review
No single opportunity critical to achieving growth objectives
Significant available liquidity; Balance Sheet will not be stressed
Capital market support evident for compelling transactions
Licence to operate makes Beach an ideal partner for right opportunities For
per
sona
l use
onl
y
CREDIT SUISSE AUSTRALIAN ENERGY CONFERENCE
BEACH ENERGY LIMITED
EXPLORATION AND DEVELOPMENT
For
per
sona
l use
onl
y

10
Near-field, lower risk exploration focus for Namur fairway
– Immortals-1 to complete northern Namur campaign
– Improved definition of fairway boundaries
Extensive Birkhead fairway to be developed with modern seismic and drilling technologies
–Oil at Hoplite-1 supports potential northern fairway extension
Kangaroo-1 follow-up wells planned for FY18
–2 vertical exploration / appraisal wells and 2-3 horizontal wells
Marauder-1 Birkhead exploration well in ex PEL 104/111
Liberator 3D seismic augments coverage over core play fairways
Oil exploration – Cooper Basin Long-term running room from extensive play fairways
Birkhead Play Fairway Namur Play Fairway
For
per
sona
l use
onl
y

11
Untapped reserve potential in existing fields
–Extensive McKinlay Member prospects across ex PEL 91 and 92
–Proven yet broadly untested Birkhead Formation in ex PEL 91
Early McKinlay success in Callawonga Field
–100% success rate from first four wells of five-well campaign
–Wells high to prognosis, extending field area
–Potential five-well follow-on campaign in FY18/19
McKinlay horizontal drilling in Bauer Field planned for FY18
Birkhead Formation to be appraised in FY18
–4-5 exploration / appraisal wells, including horizontals
–Pennington and Stanleys wells to be connected as Birkhead producers
Bauer facility expansion completed in Q4 FY17; 60% increase in fluids handling capacity to 120,000 bfpd
Oil appraisal and development – Cooper Basin Targeting new reserves and sustained production from existing fields
Kangaroo-1 on EPT at
~220 bopd flow
>8 MMbbl gross EUR at
Spitfire / Growler
Bauer facility expansion to 120 kbfpd (+60%)
Callawonga Field
↓
For
per
sona
l use
onl
y

12
Gas exploration and development – Cooper Basin Significantly expanded FY18 program of 10-12 wells planned
1. Preliminary estimates; refer announcement of 5 April 2017 for further information and disclosures
Extensive Southwest Patchawarra (SWP) and Permian Edge (PE) play fairways
Expanded 10-12 well program under assessment for FY18
High impact PE prospects proposed for FY18 campaign
–~1,300 km2 under-explored PE fairway
–PEL 630 farm-in complements portfolio; full 3D coverage
Three SWP discoveries from four-well operated campaign in FY17
340 km2 Spondylus 3D survey to enhance SWP prospect portfolio
FY17 Gas Discoveries1
Canunda-3 Crockery-1 Mokami-1
Net gas pay 3 metres 7 metres 10 metres
Preliminary 2P reserve addition
1.0 MMboe
0.9 MMboe
1.5 MMboe
Estimated initial production
>3 MMscfd
3-8 MMscfd
8-12 MMscfd
Liquids content of raw gas
>150 bbl/MMscf
TBC 93
bbl/MMscf
Expected connection date
Q1 FY18 Q1 FY18 Q2 FY18
For
per
sona
l use
onl
y
13
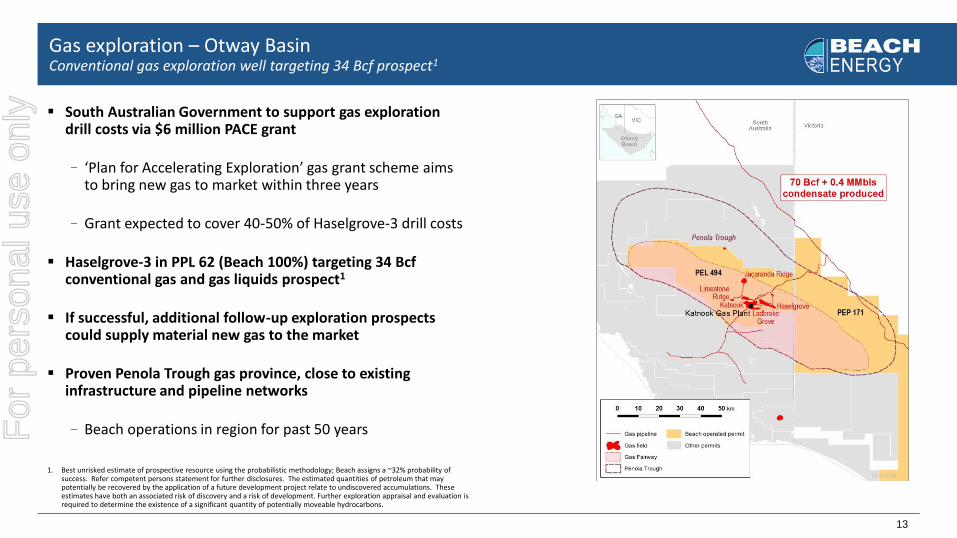
South Australian Government to support gas exploration drill costs via $6 million PACE grant
– ‘Plan for Accelerating Exploration’ gas grant scheme aims to bring new gas to market within three years
–Grant expected to cover 40-50% of Haselgrove-3 drill costs
Haselgrove-3 in PPL 62 (Beach 100%) targeting 34 Bcf conventional gas and gas liquids prospect1
If successful, additional follow-up exploration prospects could supply material new gas to the market
Proven Penola Trough gas province, close to existing infrastructure and pipeline networks
–Beach operations in region for past 50 years
Gas exploration – Otway Basin Conventional gas exploration well targeting 34 Bcf prospect1
1. Best unrisked estimate of prospective resource using the probabilistic methodology; Beach assigns a ~32% probability of success. Refer competent persons statement for further disclosures. The estimated quantities of petroleum that may potentially be recovered by the application of a future development project relate to undiscovered accumulations. These estimates have both an associated risk of discovery and a risk of development. Further exploration appraisal and evaluation is required to determine the existence of a significant quantity of potentially moveable hydrocarbons.
For
per
sona
l use
onl
y

CREDIT SUISSE AUSTRALIAN ENERGY CONFERENCE
BEACH ENERGY LIMITED
EAST COAST GAS MARKET
For
per
sona
l use
onl
y
15
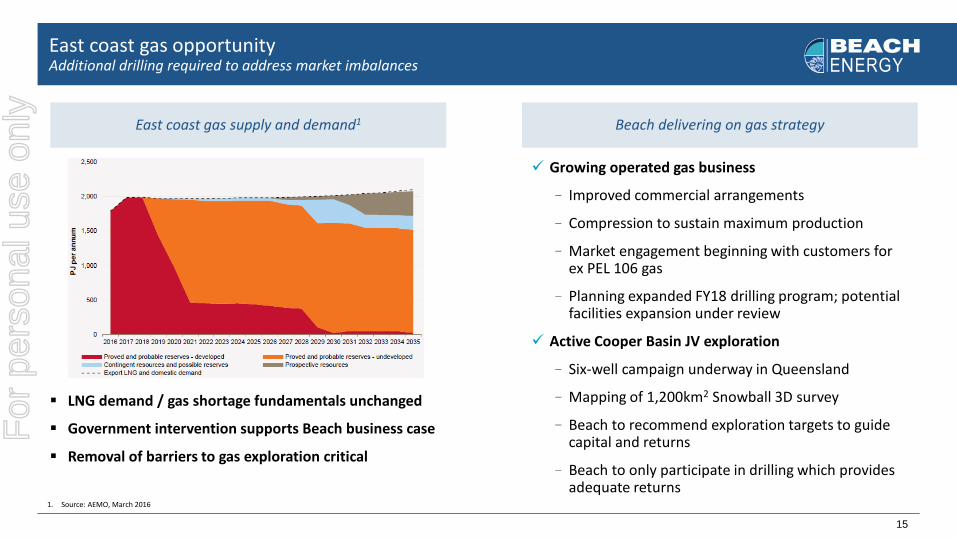
East coast gas opportunity Additional drilling required to address market imbalances
LNG demand / gas shortage fundamentals unchanged
Government intervention supports Beach business case
Removal of barriers to gas exploration critical
Beach delivering on gas strategy East coast gas supply and demand1
1. Source: AEMO, March 2016
Growing operated gas business
– Improved commercial arrangements
–Compression to sustain maximum production
–Market engagement beginning with customers for ex PEL 106 gas
–Planning expanded FY18 drilling program; potential facilities expansion under review
Active Cooper Basin JV exploration
–Six-well campaign underway in Queensland
–Mapping of 1,200km2 Snowball 3D survey
–Beach to recommend exploration targets to guide capital and returns
–Beach to only participate in drilling which provides adequate returns
For
per
sona
l use
onl
y
16
0
25
2012 2017 2022
MMscfd
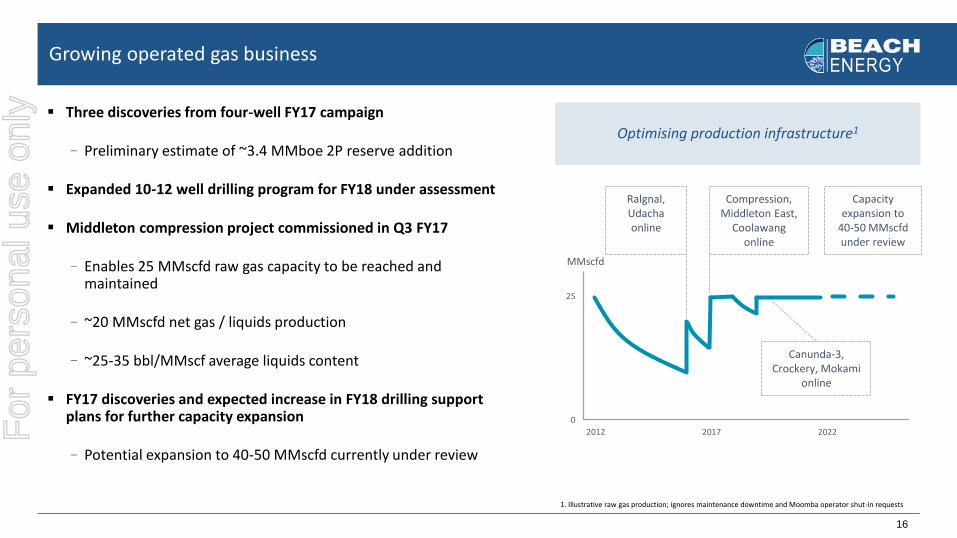
Growing operated gas business
Three discoveries from four-well FY17 campaign
–Preliminary estimate of ~3.4 MMboe 2P reserve addition
Expanded 10-12 well drilling program for FY18 under assessment
Middleton compression project commissioned in Q3 FY17
–Enables 25 MMscfd raw gas capacity to be reached and maintained
–~20 MMscfd net gas / liquids production
–~25-35 bbl/MMscf average liquids content
FY17 discoveries and expected increase in FY18 drilling support plans for further capacity expansion
–Potential expansion to 40-50 MMscfd currently under review
Optimising production infrastructure1
1. Illustrative raw gas production; ignores maintenance downtime and Moomba operator shut-in requests
Compression, Middleton East,
Coolawang online
Ralgnal, Udacha online
Canunda-3, Crockery, Mokami
online
Capacity expansion to
40-50 MMscfd under review
For
per
sona
l use
onl
y
17
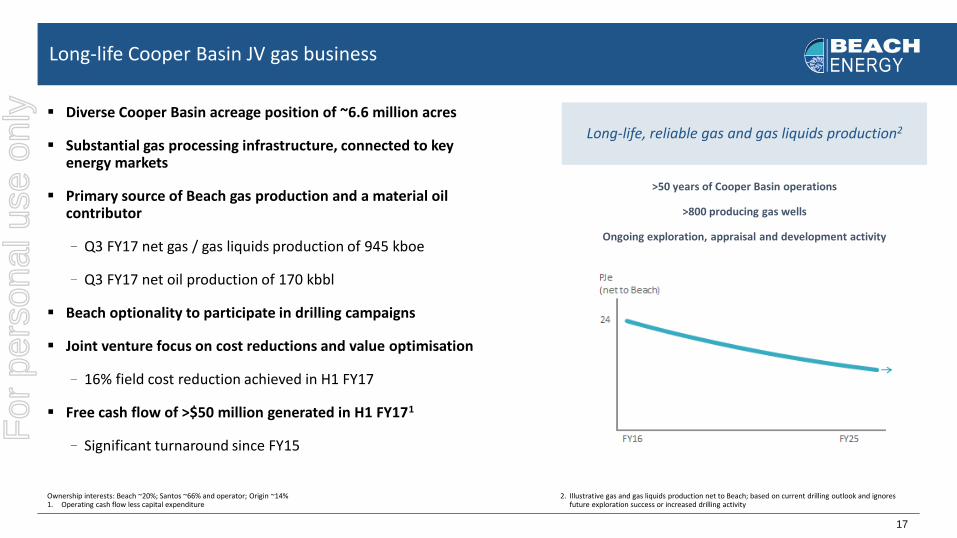
Long-life Cooper Basin JV gas business
Diverse Cooper Basin acreage position of ~6.6 million acres
Substantial gas processing infrastructure, connected to key energy markets
Primary source of Beach gas production and a material oil contributor
–Q3 FY17 net gas / gas liquids production of 945 kboe
–Q3 FY17 net oil production of 170 kbbl
Beach optionality to participate in drilling campaigns
Joint venture focus on cost reductions and value optimisation
–16% field cost reduction achieved in H1 FY17
Free cash flow of >$50 million generated in H1 FY171
–Significant turnaround since FY15
Long-life, reliable gas and gas liquids production2
2. Illustrative gas and gas liquids production net to Beach; based on current drilling outlook and ignores future exploration success or increased drilling activity
>50 years of Cooper Basin operations
>800 producing gas wells
Ongoing exploration, appraisal and development activity
Ownership interests: Beach ~20%; Santos ~66% and operator; Origin ~14% 1. Operating cash flow less capital expenditure
For
per
sona
l use
onl
y

18
Infrastructure ideally located to service southern, eastern and LNG markets
–Beach ownership interest in Cooper Basin JV infrastructure: ~20%
~6,000 kilometres of flowlines into Moomba
Moomba daily processing capacities:
–375 TJ gas (~70% utilised)
–600 tonnes LPG (~30% utilised)
–35 kbbl oil / condensate (~75% utilised)
–48 kbbl daily flowline capacity (Moomba to Port Bonython)
Gas storage capacity of ~75 PJ
Moomba processing plant accessible for new discoveries
Strategic infrastructure servicing key markets
For
per
sona
l use
onl
y
CREDIT SUISSE AUSTRALIAN ENERGY CONFERENCE
BEACH ENERGY LIMITED
A UNIQUE VALUE PROPOSITION
For
per
sona
l use
onl
y

20
A unique value proposition
Highly profitable Turnaround in underlying profit; +1,023% in H1 FY171
US$10 annual oil price increase delivers +$50 million NPAT and +$65 million operating cash flow
Increasing drill bit activity 50 wells drilled year-to-date at a success rate of 82%
Operated gas exploration success rate of 75% in FY17
Material increase in FY18 well count anticipated
Cost focused culture entrenched US$20/bbl cash flow breakeven2
Western Flank operated field costs ~$2.70/boe
>30% reduction in Cooper Basin JV drill costs and drill durations
Refreshed exploration focus Unlocking new reserves from proven reservoirs
Planned horizontal drilling in FY18 to optimise recoveries
Targeting full replacement of 2P reserves over next 2 years
Substantial liquidity $175 million net cash; $675 million available liquidity3
Establishment of dividend framework under consideration
Inorganic growth Shareholder value accretion primary objective
Multiple opportunities under review
1. Underlying net profit after tax; for a reconciliation to statutory net profit after tax, refer to results announcement of 20 February 2017 2. Cash flow breakeven and cost references relate to H1 FY17; refer slides 24-25 for further information 3. As at 31 March 2017
For
per
sona
l use
onl
y

CREDIT SUISSE AUSTRALIAN ENERGY CONFERENCE
BEACH ENERGY LIMITED
APPENDIX
For
per
sona
l use
onl
y

22
Australia’s largest onshore oil producer, with a major gas business
Core operations in the Cooper and Eromanga basins
Owner of strategic infrastructure linking key energy markets
Market capitalisation: ~$1.1 billion1
Cash flow breakeven of US$20/bbl2
Net cash of $175 million and available liquidity of $675 million
FY17 production guidance: 10.3 – 10.7 MMboe
FY17 capital expenditure guidance: $160 – 170 million
Beach Energy
1. Based on closing share price of $0.595 on 9 June 2017 2. Refer slide 25 for definition
Cooper Basin Joint Ventures
Western Flank Gas and Gas Liquids
Western Flank Oil
For
per
sona
l use
onl
y
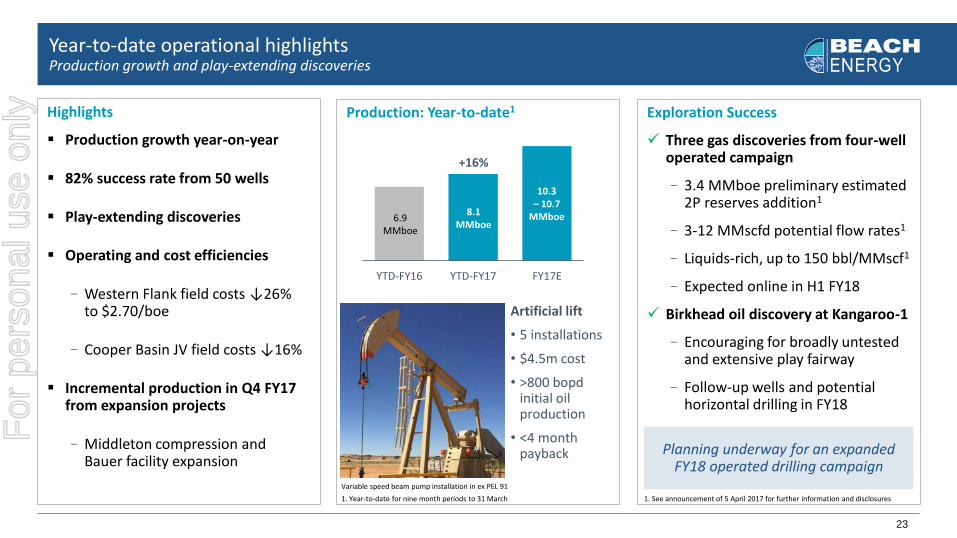
23
YTD-FY16 YTD-FY17 FY17E
Highlights
Production growth year-on-year
82% success rate from 50 wells
Play-extending discoveries
Operating and cost efficiencies
–Western Flank field costs ↓26% to $2.70/boe
–Cooper Basin JV field costs ↓16%
Incremental production in Q4 FY17 from expansion projects
–Middleton compression and Bauer facility expansion
Year-to-date operational highlights Production growth and play-extending discoveries
Variable speed beam pump installation in ex PEL 91
+16%
Artificial lift
• 5 installations
• $4.5m cost
• >800 bopd initial oil production
• <4 month payback
6.9 MMboe
8.1 MMboe
Production: Year-to-date1
Exploration Success
Three gas discoveries from four-well operated campaign
–3.4 MMboe preliminary estimated 2P reserves addition1
–3-12 MMscfd potential flow rates1
– Liquids-rich, up to 150 bbl/MMscf1
–Expected online in H1 FY18
Birkhead oil discovery at Kangaroo-1
–Encouraging for broadly untested and extensive play fairway
–Follow-up wells and potential horizontal drilling in FY18
10.3 – 10.7
MMboe
1. Year-to-date for nine month periods to 31 March
Planning underway for an expanded FY18 operated drilling campaign
1. See announcement of 5 April 2017 for further information and disclosures
For
per
sona
l use
onl
y

24
Highlights
Financial results benefiting from robust business model
–Strong production and operating performance
– Leverage to higher oil prices
–Reduced field operating costs
– Lean headcount and overheads
–Benefits of asset rationalisation
Strengthened financial position
–Net cash of $175 million; $675 million available liquidity1
Disciplined deployment of free cash flow to fund growth
No cash tax in FY17; expecting cash tax in FY18
First-half financial highlights Robust business model delivering turnaround in profitability
Key Financial Metrics: H1 FY17
Turnaround in HY Underlying NPAT1
1. As at 31 March 2017; movement relative to 31 March 2016
1. For a reconciliation of H1 FY17 net profit after tax to underlying net profit after tax, refer to results announcement of 20 February 2017
0
70
140
0
50
100
H1 FY15 H1 FY16 H1 FY17
$ million
+1,023%
A$/bbl Brent oil
Underlying NPAT A$/bbl Brent oil
Sales Revenue
$344m
NPAT
$103m
EBITDA $224m
Operating Cash Flow
$154m
Net Cash1
$175m
Interim Dividend 1 cps (ff)
+27% +$703m +153%
+19% +$170m +1.0 cps
1. As at 31 March 2017
For
per
sona
l use
onl
y
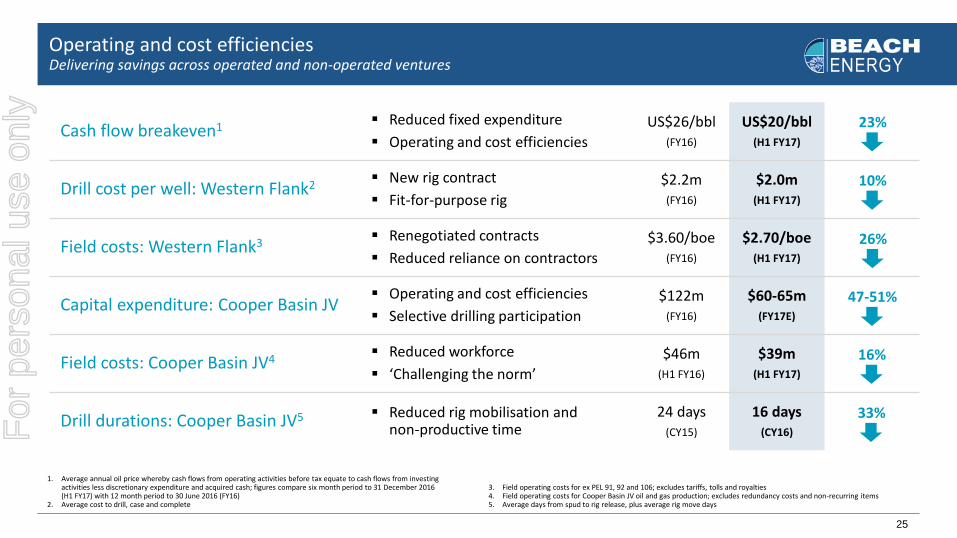
25
Cash flow breakeven1 Reduced fixed expenditure
Operating and cost efficiencies
US$26/bbl (FY16)
US$20/bbl (H1 FY17)
Drill cost per well: Western Flank2 New rig contract
Fit-for-purpose rig
$2.2m (FY16)
$2.0m (H1 FY17)
Field costs: Western Flank3 Renegotiated contracts
Reduced reliance on contractors
$3.60/boe (FY16)
$2.70/boe (H1 FY17)
Capital expenditure: Cooper Basin JV Operating and cost efficiencies
Selective drilling participation
$122m (FY16)
$60-65m (FY17E)
Field costs: Cooper Basin JV4 Reduced workforce
‘Challenging the norm’
$46m (H1 FY16)
$39m (H1 FY17)
Drill durations: Cooper Basin JV5 Reduced rig mobilisation and non-productive time
24 days (CY15)
16 days (CY16)
1. Average annual oil price whereby cash flows from operating activities before tax equate to cash flows from investing activities less discretionary expenditure and acquired cash; figures compare six month period to 31 December 2016 (H1 FY17) with 12 month period to 30 June 2016 (FY16)
2. Average cost to drill, case and complete
Operating and cost efficiencies Delivering savings across operated and non-operated ventures
3. Field operating costs for ex PEL 91, 92 and 106; excludes tariffs, tolls and royalties 4. Field operating costs for Cooper Basin JV oil and gas production; excludes redundancy costs and non-recurring items 5. Average days from spud to rig release, plus average rig move days
23%
10%
26%
47-51%
16%
33%
For
per
sona
l use
onl
y
CREDIT SUISSE AUSTRALIAN ENERGY CONFERENCE
BEACH ENERGY LIMITED
25 Conyngham Street, Glenside SA 5065 Tel: +61 8 8338 2833 Fax: +61 8 8338 2336 www.beachenergy.com.au
Investor Relations
Derek Piper Investor Relations Manager Tel: +61 8 8338 2833
For
per
sona
l use
onl
y