BCLC Gambling Service Provider Commissions Report 1997 ......of the poker room Minor maintenance and...
48
BCLC Gambling Service Provider Commissions Report 1997–2010
Transcript of BCLC Gambling Service Provider Commissions Report 1997 ......of the poker room Minor maintenance and...

BCLC Gambling Service Provider Commissions Report
1997–2010


table of contents
British Columbia’s Gambling Operations Model ........................................................................................... 1
Casino Service Provider Commissions ......................................................................................................... 3
Casino Service Provider Capital Investments and Development Commissions Earned ............................. 5
Commissions Earned by Casino Service Providers Annually....................................................................... 8
Community Gaming Service Provider Commissions .................................................................................. 21
Community Gaming Service Provider Capital Investments and Development Commissions Earned ....... 22
Commissions Earned by Community Gaming Service Providers Annually ................................................ 24
Appendix 1: Facility Development Commission Guidelines for BCLC Casino Service Providers .............. 32
Appendix 2: Facility Development Commission Guidelines for BCLC Bingo and Community Gaming Service Providers ................................................................................................ 36
Appendix 3: BCLC Casino and Community Gaming Facilities and Service Providers .............................. 42


1
British Columbia’s Gambling Operations Model
Under the Gaming Control Act (B.C.), BCLC is mandated to conduct, manage and operate commercial gaming on behalf of the Government of British Columbia. BCLC enters into contracts with private sector service providers to build and operate gambling facilities including casinos, community gaming centres and bingo halls.
Under this model, BCLC owns all the gambling equipment such as slot machines, table games and associated equipment. Service providers build, provide and operate the gambling facilities on BCLC’s behalf in addition to offering other entertainment amenities. The service provider finances the facility construction and pays the capital costs of development including any enhancements or upgrades. The service provider is also responsible for the ongoing costs of maintaining the facility to BCLC standards.
In return for operating the facility, service providers earn a commission that is divided into two parts: an operating commission and a Facility Development Commission (FDC). FDC is what the service provider earns as a percentage of revenue based on their investment in creating and maintaining high quality facilities.
Each jurisdiction in Canada has its own unique operating model, including those where the crown corporation owns and operates the facilities and assumes the capital cost and responsibility for developing, maintaining and operating the facilities. BCLC’s model has been highly effective. It eliminates many of the risks to BCLC associated with owning and operating facilities while still providing a safe gambling environment, high quality facilities and a significant return to government.
For example, in 2003/04 casino gambling provided a net to government of $418.3 million on revenues of $733.5 million. BCLC’s vision then began to evolve to higher quality facilities with better amenities. Service providers made significant investments in non-gaming, complimentary entertainment amenities. The investments contributed to significant revenues. By 2009/10 casino gaming provided a $731.3 million net to government on revenues of $1,321.6 million.
BCLC’s model has resulted in some of the best in class casinos and community gaming facilities in Canada.

2
The following chart outlines the percentage of net revenue from full service casino gaming that is returned to the province of jurisdiction. For the purposes of this chart, a full service casino operates commercially and includes live table games and slot games.
Information for this chart was obtained from publically available audited financial statements issued by each gaming jurisdiction.
For Alberta the 65% represents the approximate allocation to government based on available annual report information and assumptions with respect to expense allocations.
BCLC’s model is one of the most profitable full service casino models in Canada1.
1 Unlike any of the other provinces represented on this chart, Alberta’s casino model is limited to commercial slots with table
games operating under a charitable gaming model.
56.5%
35.8%32.4%
34.7%
65.0%
0%
10%
20%
30%
40%
50%
60%
70%
BC Ontario Quebec Nova Scotia Alberta
Net In
com
e a
s a
% o
f R
evenue
Canadian Full Service Casino Comparatives March 31, 2009

3
Casino Service Provider Commissions
B.C.’s casino operations model was developed in 1997 when the provincial government announced a
new gaming policy and issued a Request for Proposal—Destination and Charitable Gaming Facilities in
the Province of British Columbia (RFP). The compensation structure was for a total commission of 28 per
cent of net win from slots and 43 per cent net win from table games (net win = revenue after prizes
paid/won by the player). The 28 per cent commission is divided into two parts—25 per cent operating
commission, three per cent Facility Development Commission (FDC). The 43 per cent commission from
table games is also divided into 402 per cent operating commission and three per cent FDC.
This compensation structure is captured in the Casino Operational Services Agreement (COSA), which are typically 10 year contracts with a renewal option for an additional 10 years. The COSA defines service, operating and marketing responsibilities for the casino company and forms the basis for the 25 and 40 per cent per cent operating commission. It also defines the requirements for earning the three per cent FDC.
The three per cent FDC can be earned by the service provider if they incur costs related to casino and ancillary amenities development based on BCLC guidelines, subject to BCLC review and approval. Since taking responsibility for casino gambling in 1998, BCLC’s vision for gambling facilities in B.C. has been to build fewer, bigger, better facilities with comprehensive entertainment amenities such as restaurants and lounge areas.
In 2006, BCLC added the Accelerated Facility Development Commission (AFDC) of two per cent of net win. Service providers designate a one-time project to qualify for AFDC and may only do so once in the lifetime of the facility.
HOW BCLC DETERMINES FDC QUALIFYING EXPENDITURES
Before a redevelopment project begins, the service provider determines the scope of the project in discussion with BCLC. In order to qualify to earn FDC the service provider must incur FDC qualifying expenditures—costs associated with developing or redeveloping the facility, including BCLC approved entertainment amenities that will enhance the gaming experience.
Then the service provider submits to BCLC a detailed list of expenditures. BCLC reviews the submission and determines which, and the extent to which the expenditures that qualify for FDC, based on a set of guidelines (Appendix 1). BCLC also considers the merits of each specific project and the unique marketplace in which each facility operates.
In the event a service provider doesn’t have any qualifying expenditures, they are required to hold the three per cent of net win in a FDC designated bank account and cannot access these funds until they have incurred qualifying expenditures.
All service provider commissions are earned based on the net win generated by their facility, so the better the performance, the more the service provider will earn in commissions. It’s important to note that, depending upon the size of the capital investment and the net win generated, it may take a service provider 10 to 15 years to earn the equivalent to the qualifying costs they incurred.
ACCELERATED FACILITY DEVELOPMENT COMMISSION (AFDC)
Guidelines for AFDC qualifying expenditures are the same as those for FDC. However, service providers must designate a one-time project they would like to qualify for the two per cent AFDC. Only one AFDC
2 Commission on Poker is 75 per cent and commission on Craps is 75 percent on the first $270,000 in revenue earned (per
quarter) and 40 per cent on amounts above that (per quarter). These commissions reflect the higher staffing and operating costs required for these games.

4
project is permitted for the lifetime of each facility. For AFDC, the project must be substantially completed and in operation before the service provider is entitled to earn the AFDC.

5
Casino Service Provider Capital Investments and Development Commissions Earned
This chart details investments that have qualified for FDC/AFDC since 1997. In cases where a casino has relocated or where several casinos have merged into one larger redeveloped casino, total includes qualified amounts from all of those facilities. (in thousands of dollars)
Casino FDC Qualifying Projects AFDC Qualifying Projects
Total Capital Investment
(qualifying for FDC or AFDC)
Total FDC/AFDC Earned as at
March 31, 2010
Balance of qualified expenditures
remaining as at March 31, 2010
Billy Barker Casino Initial development of Billy Barker Casino
Redevelopment of Billy Barker Casino incorporating a show lounge
No project designated to date
4,348 3,532 816
Boulevard Casino Initial development of casino
Casino redevelopment and parkade
Show theatre 141,397 47,716 93,681
Cascades Casino/Royal Towers
Initial Royal Towers Casino development
Initial Cascades Casino development
Cascades Casino parkade development and casino enhancement
50,477 28,835 21,642
Casino of the Rockies Initial Development of the Casino of the Rockies Minor maintenance and renovations
No project designated to date
5,517 3,109 2,408
Edgewater Casino/ Grand Casino/Royal Diamond Casino
Initial development of the Grand Casino
Initial Development of the Royal Diamond Casino
Initial development of Edgewater Casino
Additional Edgewater Casino enhancements
Edgewater Casino poker room
No project designated to date
22,592 20,407 2,185
Fraser Downs Initial build out 2nd floor gaming relocation and addition of table games
44,886 15,323 29,563
Grand Villa/Burnaby Casino
Initial Burnaby Casino development
Development of Grand Villa Casino, convention space, restaurants hotel upgrade, show lounge and parkade redevelopment
77,313 51,139 26,174

6
Casino FDC Qualifying Projects AFDC Qualifying Projects
Total Capital Investment
(qualifying for FDC or AFDC)
Total FDC/AFDC Earned as at
March 31, 2010
Balance of qualified expenditures
remaining as at March 31, 2010
Hastings Park Temporary and permanent slots facility build out
38,069 2,157 35,912
Kamloops Initial development of the Kamloops Casino
Subsequent redevelopment and enhancement of Kamloops Casino
No project designated to date
7,322 10,932 (3,610)3
Kelowna Initial development of the Kelowna Casino
Reconfiguration and enhancement of the Kelowna Casino
Minor maintenance and renovations
No project designated to date
13,285 13,806 (521)
Nanaimo Initial Build out
Property refresh
10,979 15,904 (4,925)
Penticton Initial development of Penticton Casino
Development of direct access from the parkade and completion of the poker room
Minor maintenance and renovations
No project designated to date
10,660 8,184 2,476
River Rock Casino Initial development of the casino, show theatre, parkade and hotel upgrades
Development of convention space, second parkade, poker room, VIP gaming room, gaming floor reconfiguration
249,838 58,573 191,265
Starlight Casino/ Royal City Star Casino
Initial development of Royal City Star Casino
Subsequent Starlight gaming floor reconfiguration
Initial development of Starlight Casino and parkade
99,887 23,056 76,831
3 If a service provider operates more than one facility, BCLC allows for consolidation of FDC eligible expenditures from all
facilities. The service provider earns FDC based on the consolidated eligible expenditure balance. BCLC tracks FDC qualified and earned expenditures by facility, but where applicable, considers the consolidated qualifying expenditures in order to determine if a service provider is eligible to receive the FDC/AFDC earned. Therefore, some sites may show a negative balance of remaining qualified expenditures.

7
Casino FDC Qualifying Projects AFDC Qualifying Projects
Total Capital Investment
(qualifying for FDC or AFDC)
Total FDC/AFDC Earned as at
March 31, 2010
Balance of qualified expenditures
remaining as at March 31, 2010
Treasure Cove Casino/Casino Hollywood
Initial development of Casino Hollywood
Initial development of Treasure Cove Casino and Show Lounge
Reconfiguration and enhancement of Treasure Cove Casino
Incorporation of bingo into Treasure Cove Casino
22,985 13,377 9,608
Vernon Initial development
Minor maintenance and renovations
Redevelopment of relocated Vernon Casino
7,865 9,343 (1,479)
View Royal/Mayfair Minor renovations to Mayfair
Initial build-out of View Royal
Parkade construction and land purchase
41,874 20,926 20,949
Closed sites and transfers 4
20,545 18,013 2,532
Total 864,831 359,014 505,817
4 Total includes closed sites and transfers from the closed site to other sites in owned by the same service provider.

8
Commissions Earned by Casino Service Providers Annually
See Appendix 3 for further details on locations, service providers and former names of existing casinos.
1997–1998 (in thousands of dollars)
Casino Name Slot Revenue Total Table
Rev Total Revenue Operator
Commission FDC Earned AFDC Earned Total
Commission5
Billy Barker 1,161 - 1,161 290 35
325
Kelowna 7,896 - 7,896 1,974 237
2,211
Mandarin Centre 2,109 - 2,109 527 63
591
Newton 13,807 - 13,807 3,452 414
3,866
Royal Towers 10,622 - 10,622 2,655 319
2,974
Treasure Cove 1,849 - 1,849 462 55
518
Vernon 3,303 - 3,303 826 99
925
Total 40,746 - 40,746 10,187 1,222 - 11,409
Y/E March 31, 1998:
In March 1997, Government of BC announced its new gaming policy
First 191 slots machines were activated on October 23, 1997 at Great Canadian Casino's Surrey (Newton) location.
During the year 850 Slots were installed by the corporation at six different casino locations.
5 Service providers pay BCLC for certain costs which are subtracted in order to calculate the Total Commission. These costs
include: the equivalent to one per cent of table net win for table game supplies; service provider contribution to BCLC marketing (0.5 to 0.6 per cent of total revenue from any sites with 400 or more slot machines); and other cost adjustments from time to time.

9
1998–1999 (in thousands of dollars)
Casino Name Slot Revenue Total Table
Rev Total Revenue Operator
Commission FDC Earned AFDC Earned Total
Commission6
Billy Barker 7,819 573 8,391 2,184 252
2,436
Grand
17,071 17,073 6,829 512
7,341
Grand Villa 2,183 591 2,774 782 83
865
Holiday Inn
19,325 19,328 7,731 580
8,311
Kamloops 24,968 2,707 27,675 7,325 830
8,155
Kelowna 20,052 3,344 23,396 6,351 702
7,053
Mandarin Centre
10,445 10,447 4,179 313
4,492
Mayfair
5,500 5,501 2,200 165
2,365
Nanaimo 21,846 4,432 26,279 7,235 788
8,023
Newton 1,533 14,562 16,098 6,209 483
6,692
Red Lion
698 699 279 21
300
Renaissance
11,667 11,668 4,667 350
5,017
River Rock
36,502 36,506 14,603 1,095
15,698
Royal Diamond
16,772 16,775 6,710 503
7,213
Royal Towers 40,370 13,891 54,263 15,650 1,628
17,278
Treasure Cove 14,790 1,977 16,767 4,488 503
4,991
Vernon 13,212 1,286 14,498 3,817 435
4,252
Total 146,772 161,344 308,137 101,239 9,244 - 110,483
Y/E March 31, 1999:
In 1998, Government of BC transferred the responsibility for Casino Table gaming to BCLC
By the end of this fiscal year there were 16 community casinos in operation, including eight with slot machines
6 Service providers pay BCLC for certain costs which are subtracted in order to calculate the Total Commission. These costs
include: the equivalent to one per cent of table net win for table game supplies; service provider contribution to BCLC marketing (0.5 to 0.6 per cent of total revenue from any sites with 400 or more slot machines); and other cost adjustments from time to time.

10
1999–2000 (in thousands of dollars)
Casino Name Slot Revenue Total Table
Rev Total Revenue Operator
Commission FDC Earned AFDC Earned Total
Commission7
Billy Barker 8,573 739 9,312 2,439 279
2,718
Grand
19,029 19,029 7,612 571
8,183
Grand Villa 56,080 29,965 86,045 26,006 2,581
28,587
Holiday Inn
23,015 23,015 9,206 690
9,896
Kamloops 24,965 3,016 27,980 7,447 839
8,287
Kelowna 27,384 4,852 32,236 8,787 967
9,754
Mandarin Centre
14,836 14,836 5,934 445
6,379
Mayfair
7,361 7,361 2,944 221
3,165
Nanaimo 36,464 5,956 42,420 11,498 1,273
12,771
Newton - 16,852 16,852 6,741 506
7,246
Renaissance
11,692 11,692 4,677 351
5,028
River Rock
36,453 36,453 14,581 1,094
15,675
Royal Diamond
15,458 15,458 6,183 464
6,647
Royal Towers 28,638 14,394 43,031 12,917 1,291
14,208
Starlight 12,223 6,645 18,868 5,714 566
6,280
Treasure Cove 17,808 2,621 20,429 5,500 613
6,113
Vernon 18,392 1,799 20,191 5,317 606
5,923
Total 230,526 214,681 445,207 143,504 13,356 - 156,860
Y/E March 31, 2000:
Lake City Casino Kelowna relocated May 20, 1999, adding 145 slots (total 300) and 8 tables (20 tables)
Royal City Star Opened October 5, 1999
Slot machines have not been in play at Great Canadian Casino Newton since April 17, 1998
7 Service providers pay BCLC for certain costs which are subtracted in order to calculate the Total Commission. These costs
include: the equivalent to one per cent of table net win for table game supplies; service provider contribution to BCLC marketing (0.5 to 0.6 per cent of total revenue from any sites with 400 or more slot machines); and other cost adjustments from time to time.

11
2000–2001 (in thousands of dollars)
Casino Name Slot Revenue Total Table
Rev Total Revenue Operator
Commission FDC Earned AFDC Earned Total
Commission8
Billy Barker 8,346 615 8,961 2,333 269
2,601
Grand
18,470 18,470 7,388 554
7,942
Grand Villa 68,427 35,214 103,641 31,192 3,109
34,302
Holiday Inn
20,288 20,288 8,115 609
8,724
Kamloops 22,142 2,518 24,660 6,543 740
7,282
Kelowna 24,707 3,972 28,679 7,766 860
8,626
Mandarin Centre
14,933 14,933 5,973 448
6,421
Mayfair
7,958 7,958 3,183 239
3,422
Nanaimo 40,409 6,004 46,414 12,504 1,392
13,896
Newton
18,987 18,987 7,595 570
8,165
Penticton 13,213 1,894 15,106 4,061 453
4,514
Renaissance
9,969 9,969 3,988 299
4,287
River Rock
40,548 40,548 16,219 1,216
17,436
Royal Diamond
12,658 12,658 5,063 190
5,253
Royal Towers 23,711 13,020 36,731 11,136 1,102
12,238
Starlight 31,320 12,171 43,491 12,698 1,305
14,003
Treasure Cove 20,137 2,529 22,666 6,046 680
6,726
Vernon 16,486 1,631 18,117 4,774 544
5,317
Total 268,898 223,380 492,278 156,576 14,579 - 171,155
Y/E March 31, 2001:
Lake City Casino Penticton opened May 15, 2000
8 Service providers pay BCLC for certain costs which are subtracted in order to calculate the Total Commission. These costs
include: the equivalent to one per cent of table net win for table game supplies; service provider contribution to BCLC marketing (0.5 to 0.6 per cent of total revenue from any sites with 400 or more slot machines); and other cost adjustments from time to time.

12
2001–2002 (in thousands of dollars)
Casino Name Slot Revenue Total Table
Rev Total Revenue Operator
Commission FDC Earned AFDC Earned Total
Commission9
Billy Barker 8,671 566 9,237 2,388 277
2,666
Boulevard 26,948 14,435 41,383 12,374 1,242
13,616
Grand
20,224 20,224 7,888 607
8,494
Grand Villa 72,225 40,012 112,237 33,661 3,367
37,028
Holiday Inn
27,880 27,880 10,873 836
11,710
Kamloops 19,386 2,354 21,740 5,765 652
6,417
Kelowna 23,646 3,575 27,220 7,308 817
8,125
Mandarin Centre
16,071 16,071 6,268 482
6,750
Mayfair
6,333 6,333 2,470 190
2,660
Nanaimo 40,097 5,521 45,619 12,186 1,369
13,556
Newton
11,768 11,768 4,589 353
4,942
Penticton 14,649 1,222 15,871 4,149 476
4,626
Renaissance
11,047 11,047 4,308 331
4,640
River Rock
42,286 42,286 16,515 1,270
17,785
Royal Diamond
3,314 3,314 1,308 (0)
1,308
Royal Towers 20,266 13,327 33,593 10,275 1,009
11,284
Starlight 36,908 13,355 50,263 14,577 1,509
16,086
Treasure Cove 20,944 2,776 23,720 6,321 712
7,033
Vernon 15,445 1,327 16,772 4,379 503
4,882
View Royal 12,553 3,254 15,807 4,421 475
4,897
Total 311,739 240,647 552,386 172,023 16,478 - 188,501
Y/E March 31, 2002:
Royal Diamond Casino closed due to a labour disruption July 15, 2001
Great Canadian Casino Surrey closed October 5, 2001
Great Canadian Casino Coquitlam opened October 5, 2001
Great Canadian Casino View Royal opened December 6, 2001
Great Canadian Casino Mayfair closed January 1, 2002
9 Service providers pay BCLC for certain costs which are subtracted in order to calculate the Total Commission. These costs
include: the equivalent to one per cent of table net win for table game supplies; service provider contribution to BCLC marketing (0.5 to 0.6 per cent of total revenue from any sites with 400 or more slot machines); and other cost adjustments from time to time.

13
2002–2003 (in thousands of dollars)
Casino Name Slot Revenue Total Table
Rev Total Revenue Operator
Commission FDC Earned AFDC Earned Total
Commission10
Billy Barker 9,055 563 9,619 2,494 290
2,784
Boulevard 56,896 32,333 89,229 26,833 2,677
29,509
Casino of the Rockies 4,535 576 5,111 1,363 154
1,516
Grand
20,996 20,996 8,186 630
8,815
Grand Villa 64,080 40,258 104,338 31,704 3,129
34,833
Holiday Inn
30,606 30,606 11,936 918
12,855
Jack o' Clubs 303 9 312 81 10
90
Kamloops 23,061 2,665 25,726 6,804 772
7,576
Kelowna 28,945 4,367 33,312 8,934 999
9,933
Mandarin Centre
18,156 18,156 7,081 545
7,626
Nanaimo 34,132 4,907 39,039 10,450 1,171
11,621
Penticton 17,099 1,426 18,525 4,850 556
5,406
Renaissance
11,665 11,665 4,549 350
4,899
River Rock
44,811 44,811 17,404 1,339
18,742
Royal Towers 18,583 14,948 33,531 10,466 1,005
11,471
Starlight 34,578 11,813 46,392 13,364 1,391
14,755
Treasure Cove 21,776 2,663 24,439 6,482 733
7,215
Vernon 18,989 1,342 20,331 5,272 610
5,882
View Royal 41,593 10,393 51,987 14,442 1,559
16,001
Total 373,627 254,497 628,124 192,694 18,837 - 211,531
Y/E March 31, 2003:
Casino of the Rockies opened on September 21, 2002. Lake City Casinos Limited operates the casino behalf of Ktunaxa / Kinbasket Tribal Council Society and 554381 B.C. Ltd.
Jack o' Clubs opened on June 21, 2002 as a seasonal casino open only during the summer months each year
10 Service providers pay BCLC for certain costs which are subtracted in order to calculate the Total Commission. These costs
include: the equivalent to one per cent of table net win for table game supplies; service provider contribution to BCLC marketing (0.5 to 0.6 per cent of total revenue from any sites with 400 or more slot machines); and other cost adjustments from time to time.

14
2003–2004 (in thousands of dollars)
Casino Name Slot Revenue Total Table
Rev Total Revenue Operator
Commission FDC Earned AFDC Earned Total
Commission11
Billy Barker 9,430 443 9,873 2,572 301
2,874
Boulevard 80,979 37,480 118,460 34,888 3,557
38,444
Casino of the Rockies 10,389 993 11,381 3,471 345
3,815
Grand
23,158 23,158 9,018 694
9,711
Grand Villa 87,023 42,828 129,851 38,473 3,897
42,370
Holiday Inn
31,970 31,970 12,468 959
13,427
Jack o' Clubs 245 14 259 68 8
76
Kamloops 27,638 2,491 30,128 7,885 904
8,790
Kelowna 33,621 4,261 37,883 10,064 1,137
11,201
Mandarin Centre
17,937 17,937 6,995 538
7,533
Nanaimo 37,699 4,623 42,322 11,243 1,272
12,514
Penticton 18,797 1,229 20,026 5,206 603
5,809
Renaissance
7,691 7,691 2,999 231
3,230
River Rock
56,279 56,279 21,639 1,665
23,303
Royal Towers 21,770 14,183 35,953 10,978 1,079
12,057
Starlight 37,946 11,232 49,178 13,985 1,476
15,461
Treasure Cove 24,953 2,249 27,201 7,117 816
7,934
Vernon 22,661 1,162 23,824 6,124 715
6,840
View Royal 50,396 9,715 60,111 16,416 1,807
18,223
Total 463,547 269,938 733,486 221,610 22,003 - 243,614
11 Service providers pay BCLC for certain costs which are subtracted in order to calculate the Total Commission. These costs
include: the equivalent to one per cent of table net win for table game supplies; service provider contribution to BCLC marketing (0.5 to 0.6 per cent of total revenue from any sites with 400 or more slot machines); and other cost adjustments from time to time.

15
2004–2005 (in thousands of dollars)
Casino Name Slot Revenue Total Table
Rev Total Revenue Operator
Commission FDC Earned AFDC Earned Total
Commission12
Billy Barker 9,339 414 9,753 2,541 298
2,839
Boulevard 80,085 39,371 119,457 35,418 3,588
39,006
Casino of the Rockies 10,806 965 11,771 3,962 358
4,321
Edgewater 5,780 4,836 10,616 3,502 325
3,827
Fraser Downs 38,037 864 38,901 7,823 1,956
9,779
Grand
12,141 12,141 4,743 366
5,108
Grand Villa 88,361 43,915 132,276 39,574 3,976
43,550
Holiday Inn
26,295 26,295 10,422 789
11,211
Jack o' Clubs 71 - 71 18 2
21
Kamloops 28,998 2,468 31,466 8,236 947
9,182
Kelowna 36,022 4,579 40,601 10,833 1,222
12,055
Mandarin Centre
16,158 16,158 6,303 485
6,788
Nanaimo 41,330 4,780 46,111 12,232 1,386
13,618
Penticton 19,996 1,439 21,434 5,611 647
6,258
Renaissance
1,241 1,241 484 37
521
River Rock 77,574 110,524 188,098 65,114 5,632
70,746
Royal Towers 16,343 12,286 28,629 8,883 860
9,743
Starlight 26,902 8,115 35,016 9,998 1,054
11,051
Treasure Cove 29,818 2,337 32,155 8,385 967
9,352
Vernon 23,462 1,447 24,909 6,456 750
7,206
View Royal 55,662 10,119 65,782 17,902 1,978
19,880
Total 588,587 304,293 892,880 268,440 27,623 - 296,063
Y/E March 31, 2005:
Fraser Downs racetrack & Casino opened April 5, 2004
Casino Hollywood relocated on September 16, 2004 and is now known as Treasure cove Casino.
Richmond Casino within the City of Richmond closed and opened as River Rock Casino , June 24, 2004
Grand Casino (closed November 21, 2004) and Royal Diamond Casino (closed due to labour disruption on July 15, 2001) consolidated and relocated opening as Edgewater Casino on Feb 3, 2005
12 Service providers pay BCLC for certain costs which are subtracted in order to calculate the Total Commission. These costs
include: the equivalent to one per cent of table net win for table game supplies; service provider contribution to BCLC marketing (0.5 to 0.6 per cent of total revenue from any sites with 400 or more slot machines); and other cost adjustments from time to time.

16
2005–2006 (in thousands of dollars)
Casino Name Slot Revenue Total Table
Rev Total Revenue Operator
Commission FDC Earned AFDC Earned Total
Commission13
Billy Barker 9,566 357 9,923 2,560 298
2,859
Boulevard 89,119 40,187 129,306 38,728 3,880
42,609
Cascades 66,226 22,744 88,970 26,792 2,670
29,462
Casino of the Rockies 11,747 1,038 12,785 4,070 384
4,454
Edgewater 37,020 36,125 73,145 24,392 2,196
26,587
Fraser Downs 46,821 - 46,821 9,381 2,342
11,724
Grand Villa 110,575 41,218 151,793 44,095 4,556
48,651
Holiday Inn
24,096 24,096 9,438 723
10,161
Jack o' Clubs 57 - 57 15 2
16
Kamloops 29,670 2,423 32,093 8,397 964
9,361
Kelowna 40,501 4,856 45,357 12,050 1,362
13,411
Mandarin Centre
979 979 381 29
410
Nanaimo 45,398 4,432 49,830 13,126 1,496
14,623
Penticton 21,984 1,542 23,527 6,149 707
6,856
River Rock 100,417 114,763 215,179 73,484 6,454
79,938
Royal Towers 7,309 6,235 13,544 4,259 406
4,665
Starlight 19,880 7,271 27,151 7,899 816
8,715
Treasure Cove 38,248 2,429 40,677 10,556 1,221
11,778
Vernon 23,908 1,526 25,434 6,606 764
7,370
View Royal 64,618 10,062 74,679 20,115 2,241
22,356
Total 763,063 322,282 1,085,346 322,494 33,511 - 356,004
Y/E March 31, 2006:
Mandarin Casino in Vancouver closed April 30, 2005
Royal Towers Casino in New Westminster was relocated as Cascades Casino in Langley and opened May 5, 2005
Coquitlam Casino was redeveloped as Boulevard Casino November 17, 2005
Royal Towers Casino in New Westminster closed November 30, 2005
13 Service providers pay BCLC for certain costs which are subtracted in order to calculate the Total Commission. These costs
include: the equivalent to one per cent of table net win for table game supplies; service provider contribution to BCLC marketing (0.5 to 0.6 per cent of total revenue from any sites with 400 or more slot machines); and other cost adjustments from time to time.

17
2006–2007 (in thousands of dollars)
Casino Name Slot Revenue Total Table
Rev Total Revenue Operator
Commission FDC Earned AFDC Earned Total
Commission14
Billy Barker 9,729 439 10,168 2,671 306
2,977
Boulevard 113,824 44,414 158,237 47,934 4,745
52,679
Cascades 90,622 24,265 114,887 33,230 3,445
36,675
Casino of the Rockies 13,013 1,349 14,362 4,415 432
4,847
Edgewater 47,590 37,440 85,030 27,694 2,548
30,241
Fraser Downs 51,590 273 51,863 10,508 2,594
13,102
Grand Villa 122,437 42,337 164,774 47,434 4,944
52,378
Holiday Inn
26,264 26,264 10,681 788
11,469
Kamloops 32,016 2,413 34,430 8,996 1,034
10,030
Kelowna 43,794 4,607 48,401 12,782 1,453
14,235
Nanaimo 45,763 4,130 49,893 13,057 1,497
14,554
Penticton 25,160 2,036 27,196 7,224 817
8,041
River Rock 108,006 125,061 233,067 79,102 6,984
86,085
Starlight 26,317 9,026 35,343 10,217 1,061
11,276
Treasure Cove 43,688 2,609 46,297 12,101 1,389
13,490
Vernon 27,110 1,431 28,540 7,388 857
8,245
View Royal 69,197 10,942 80,139 21,571 2,404
23,975
Total 869,855 339,036 1,208,891 357,006 37,295 - 394,301
Y/E March 31, 2007:
Jack o' Clubs closed permanently in June 2006.
14 Service providers pay BCLC for certain costs which are subtracted in order to calculate the Total Commission. These costs
include: the equivalent to one per cent of table net win for table game supplies; service provider contribution to BCLC marketing (0.5 to 0.6 per cent of total revenue from any sites with 400 or more slot machines); and other cost adjustments from time to time.

18
2007–2008 (in thousands of dollars)
Casino Name Slot Revenue Total Table
Rev Total Revenue Operator
Commission FDC Earned AFDC Earned Total
Commission15
Billy Barker 10,833 446 11,278 2,944 338
3,282
Boulevard 132,367 46,163 178,530 53,288 5,355 3,566 62,209
Cascades 103,472 23,544 127,016 36,113 3,810
39,923
Casino of the Rockies 15,128 1,501 16,629 4,973 499
5,472
Edgewater 54,764 48,190 102,954 34,509 3,088
37,597
Fraser Downs 61,246 1,354 62,599 13,968 2,664 466 17,099
Grand Villa 133,612 43,081 176,692 50,481 5,302
55,784
Hastings 2,139 - 2,139 536 64 43 644
Holiday Inn - 16,141 16,141 6,492 483
6,975
Kamloops 36,695 2,650 39,344 10,266 1,181
11,447
Kelowna 46,210 4,570 50,780 13,375 1,524
14,899
Nanaimo 45,993 4,061 50,053 13,085 1,502
14,587
Penticton 28,381 2,310 30,691 8,159 1,021
9,180
River Rock 112,409 123,382 235,791 79,161 7,071 1,795 88,027
Starlight 41,620 16,579 58,200 17,250 1,746 656 19,652
Treasure Cove 47,206 2,358 49,564 12,871 1,487
14,358
Vernon 28,906 1,594 30,500 7,898 915
8,813
View Royal 72,929 10,292 83,221 22,248 2,497
24,745
Total 973,908 348,215 1,322,123 387,619 40,548 6,527 434,695
Y/E March 31, 2008:
Starlight casino opened December 10, 2007
Hastings Racetrack Casino opened November 10, 2007
Fraser Downs Racetrack and Casino added tables to the gaming floor on November 22, 2007
Royal City Star Casino closed on December 8, 2007 and relocated as Starlight Casino
Great Canadian Casino Vancouver (Holiday Inn) closed November 17, 2007
15 Service providers pay BCLC for certain costs which are subtracted in order to calculate the Total Commission. These costs
include: the equivalent to one per cent of table net win for table game supplies; service provider contribution to BCLC marketing (0.5 to 0.6 per cent of total revenue from any sites with 400 or more slot machines); and other cost adjustments from time to time.

19
2008–2009 (in thousands of dollars)
Casino Name Slot Revenue Total Table
Rev Total Revenue Operator
Commission FDC Earned AFDC Earned Total
Commission16
Billy Barker 9,723 448 10,170 2,676 306
2,983
Boulevard 129,315 44,681 173,996 51,741 5,234 3,489 60,464
Cascades 95,085 20,110 115,196 32,537 3,467 794 36,798
Casino of the Rockies 14,636 1,389 16,024 4,803 483
5,285
Edgewater 60,458 59,994 120,451 41,105 3,629
44,734
Fraser Downs 49,544 5,197 54,741 14,384 1,649 1,099 17,131
Grand Villa 120,657 52,142 172,798 50,742 5,205 1,653 57,600
Hastings 18,006 - 18,006 4,530 298 616 5,444
Kamloops 32,487 2,830 35,316 9,306 1,063
10,370
Kelowna 40,885 4,848 45,732 12,186 1,376
13,563
Nanaimo 43,485 4,129 47,614 12,514 1,432
13,947
Penticton 27,153 2,270 29,422 7,871 1,477
9,347
River Rock 104,273 128,741 233,014 78,700 7,016 4,678 90,394
Starlight 76,373 39,992 116,365 35,648 3,504 2,336 41,489
Treasure Cove 40,465 2,158 42,623 11,069 1,282 854 13,205
Vernon 28,018 1,458 29,477 7,645 888
8,533
View Royal 70,847 9,445 80,292 21,364 2,417 759 24,540
Total 961,408 379,831 1,341,240 398,823 40,726 16,279 455,828
Y/E March 31, 2009:
Hastings Park temporary facility closed August 11, 2008 and the new facility opened August 14, 2008
Gateway Casino Burnaby closed November 4, 2008 and reopened as Grand Villa casino on November 5, 2008
16 Service providers pay BCLC for certain costs which are subtracted in order to calculate the Total Commission. These costs
include: the equivalent to one per cent of table net win for table game supplies; service provider contribution to BCLC marketing (0.5 to 0.6 per cent of total revenue from any sites with 400 or more slot machines); and other cost adjustments from time to time.
20
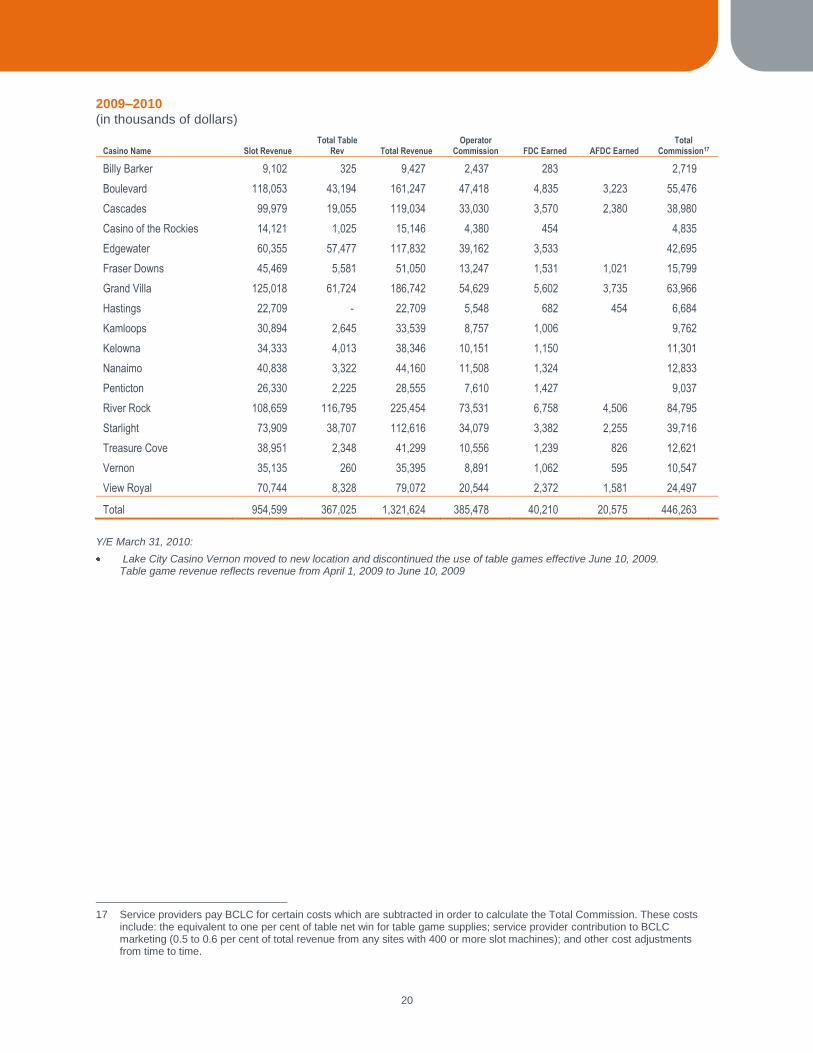
2009–2010 (in thousands of dollars)
Casino Name Slot Revenue Total Table
Rev Total Revenue Operator
Commission FDC Earned AFDC Earned Total
Commission17
Billy Barker 9,102 325 9,427 2,437 283
2,719
Boulevard 118,053 43,194 161,247 47,418 4,835 3,223 55,476
Cascades 99,979 19,055 119,034 33,030 3,570 2,380 38,980
Casino of the Rockies 14,121 1,025 15,146 4,380 454
4,835
Edgewater 60,355 57,477 117,832 39,162 3,533
42,695
Fraser Downs 45,469 5,581 51,050 13,247 1,531 1,021 15,799
Grand Villa 125,018 61,724 186,742 54,629 5,602 3,735 63,966
Hastings 22,709 - 22,709 5,548 682 454 6,684
Kamloops 30,894 2,645 33,539 8,757 1,006
9,762
Kelowna 34,333 4,013 38,346 10,151 1,150
11,301
Nanaimo 40,838 3,322 44,160 11,508 1,324
12,833
Penticton 26,330 2,225 28,555 7,610 1,427
9,037
River Rock 108,659 116,795 225,454 73,531 6,758 4,506 84,795
Starlight 73,909 38,707 112,616 34,079 3,382 2,255 39,716
Treasure Cove 38,951 2,348 41,299 10,556 1,239 826 12,621
Vernon 35,135 260 35,395 8,891 1,062 595 10,547
View Royal 70,744 8,328 79,072 20,544 2,372 1,581 24,497
Total 954,599 367,025 1,321,624 385,478 40,210 20,575 446,263
Y/E March 31, 2010:
Lake City Casino Vernon moved to new location and discontinued the use of table games effective June 10, 2009. Table game revenue reflects revenue from April 1, 2009 to June 10, 2009
17 Service providers pay BCLC for certain costs which are subtracted in order to calculate the Total Commission. These costs
include: the equivalent to one per cent of table net win for table game supplies; service provider contribution to BCLC marketing (0.5 to 0.6 per cent of total revenue from any sites with 400 or more slot machines); and other cost adjustments from time to time.

21
Community Gaming Service Provider Commissions
Community gaming includes commercial bingo halls and community gaming centres (CGC).
BCLC assumed the conduct and manage role of commercial bingo gaming in 2003. Bingo facilities in the province were not well maintained and there was little or no incentive to enhance the facilities. The commission structure recognized the need to incent service providers to enhance or redevelop their facilities. However, because bingo revenues have been in decline year over year since the late 1990s, it has been challenging for bingo hall service providers to take on any extensive upgrades.
BCLC developed the CGC model in 2004, recognizing that a different model was needed to help capture and maintain player interest. CGCs combine bingo and slot gaming with enhanced food & beverage and entertainment options. These enhanced facilities are popular with players and are sized to fit the marketplace.
All community gaming service providers have Operational Service Agreements with BCLC and receive the standard bingo commission, which incorporates an operating component as well as a FDC component. The bingo operating commission structure is:
60% of bingo sales (after prizes are paid) on the first $20,000 per week,
40% of bingo sales (after prizes are paid) on the next $60,000 per week
25% on bingo sales (after prizes are paid) greater than $80,000 per week.
The bingo FDC component is five per cent of bingo sales (after prizes are paid).
CGC service providers receive a slot gaming commission of 28 per cent of net win, which is divided into two parts: 25 per cent operating commission and three per cent FDC.
AFDC is also part of the CGC commission structure and is currently18
:
10% of bingo sales (after prizes) on the first $20,000 per week
8% of bingo sales (after prizes) on the next $60,000 per week
6% of bingo sales (after prizes) on sales greater than $80,000 per week
The process for determining FDC and AFDC qualifying expenditures is similar to the process used for casino service providers. Guidelines are in place for bingo and CGC FDC/AFDC (see Appendix 2).
18 BCLC is transitioning CGC AFDC to 2% of bingo and slot gaming net win in order to align it with the casino commission
structure. Implementation is scheduled to be completed on April 1, 2012.

22
Community Gaming Service Provider Capital Investments and Development Commissions Earned
This chart details investments that have qualified for FDC/AFDC since 2002/03. (in thousands of dollars)
CGC or Bingo Hall Projects Qualified for FDC or AFDC
Total Capital Investment
(qualifying for FDC or AFDC)
Total FDC/AFDC Earned as at
March 31, 2010
Balance of qualified expenditures
remaining as at March 31, 2010
Bingo Bingo Esquimalt Major renovations to enhance player experience
Minor renovations
905 610 295
Boardwalk Gaming Centre - Burnaby Initial build out of facility 2,528 1,580 949
Chances Abbotsford (Abbotsford Bingo) Initial build out of facility 3,877 956 2,922
Chances Boardwalk Mission (Mission Bingo Country)
Initial build out of facility 4,215 1,147 3,067
Chances Boardwalk Squamish Initial build out of facility 8,000 46 7,954
Chances Campbell River (Campbell River Bingo Palace)
Initial build out of facility 8,538 2,153 6,385
Chances Courtenay (Valley Entertainment Palace)
Initial build out of facility 9,908 1,341 8,568
Chances Cowichan (Inkspot Bingo) Initial build out of facility 5,031 1,956 3,076
Chances Dawson Creek (Bear Mountain Bingo)
Renovations to incorporate slot machines
Initial build out of facility
14,133 2,036 12,097
Chances Fort St John (Rainbow Bingo Hall)
Initial build out of facility 16,901 1,677 15,224
Chances Kamloops (Enterprise Entertainment)
Initial build out of facility
Renovations to incorporate slot machines
7,325 3,347 3,978
Chances Kelowna (Bingo Kelowna)
Initial build out of facility
Renovations to incorporate slot machines
9,504 5,191 4,313
Chances Prince Rupert (Prince Rupert Bingo)
Initial build out of facility 7,664 907 6,756
Chances Rim Rock (Dob City) Initial build out of facility 3,217 1,062 2,155
Chances Signal Point Gaming (Lucky’s Bingo Centre)
Initial build out of facility 6,502 2,494 4,009
Chances Terrace (Lucky Dollar Bingo Palace)
Initial build out of facility
Renovations to incorporate slot machines
3,854 1,413 2,441
Chilliwack Bingo Minor renovations to enhance player experience
374 1,539 (1,165)
Fairweather Bingo Minor renovations to enhance player experience
122 655 (534)
Harbour City Bingo Minor renovations to enhance player experience
740 800 (59)
Langley Bingo Palace Initial build out of facility to include slot machines
2,683 2,503 180

23
CGC or Bingo Hall Projects Qualified for FDC or AFDC
Total Capital Investment
(qualifying for FDC or AFDC)
Total FDC/AFDC Earned as at
March 31, 2010
Balance of qualified expenditures
remaining as at March 31, 2010
Maple Ridge CGC (Haney Bingo Plex)
Renovations for temporary slot operation
Initial build out of facility
260 797 (537)
Newton Bingo Country Minor renovations to enhance player experience
2,26619 2,019 247
Penticton Bingo Palace Minor renovations to enhance player experience
497 474 23
Planet Bingo Minor renovations to enhance player experience
1,351 2,093 (742)
Playtime Bingo (Nanaimo)
Minor renovations to enhance player experience
812 732 79
Playtime Gaming (Victoria)
Minor renovations to enhance player experience
642 611 31
Rocky Mountain Bingo Minor renovations to enhance player experience
56 242 (186)
Treasure Cove Bingo Initial build out of facility 8,467 2,404 6,062
Closed sites 3,262 2,306 956
Total 131,537 42,995 88,543
19 If a service provider operates more than one facility, BCLC allows for consolidation of FDC eligible expenditures from all of that
service provider’s facilities. For both Newton Country Bingo and Penticton Bingo, BCLC has transferred eligible expenditures to these sites from other sites owned by those service providers. Totals for these sites include site specific and transferred eligible expenditures.

24
Commissions Earned by Community Gaming Service Providers Annually See Appendix 3 for further details on locations, service providers and former names of existing facilities.
2002–2003 (in thousands of dollars)
CGC or Bingo Hall Slot
Revenue Bingo
Revenue Total
Revenue Operator
Commission FDC AFDC
Total
Commission
711 Bingo Emporium 663 663 151 - 151
Bingo Bingo Esquimalt 3,543 3,543 501 - 501
Bingo City 2,310 2,310 280 - 280
Boardwalk Gaming Centre - Burnaby 7,441 7,441 1,079 30 1,109
Chances Abbotsford 7,490 7,490 983 31 1,014
Chances Boardwalk Mission 809 809 133 - 133
Chances Campbell River 7,229 7,229 1,080 31 1,110
Chances Courtenay 3,768 3,768 593 38 631
Chances Cowichan 4,812 4,812 695 - 695
Chances Dawson Creek 1,601 1,601 245 7 252
Chances Fort St John 3,679 3,679 561 63 624
Chances Kamloops 9,913 9,913 1,287 141 1,428
Chances Kelowna 11,926 11,926 1,476 88 1,564
Chances Prince Rupert 2,546 2,546 383 - 383
Chances Rim Rock 2,918 2,918 431 - 431
Chances Signal Point Gaming 3,914 3,914 609 3 612
Chances Terrace 5,554 5,554 825 64 889
Chilliwack Bingo 12,168 12,168 1,414 58 1,471
Cordial Bingo Hall 541 541 87 - 87
Fairweather Bingo 5,841 5,841 840 30 870
Harbour City Bingo 7,237 7,237 993 70 1,063
Langford Drop-In Bingo 1,864 1,864 351 13 363
Langley Bingo Palace 9,458 9,458 1,291 27 1,318
Maple Ridge CGC 7,870 7,870 1,098 - 1,098
Newton Bingo Country 17,468 17,468 1,992 169 2,161
Nordley's Bingo Hall 1,175 1,175 216 - 216
North Star Bingo Hall 835 835 137 21 158
Pay It Again Bingo 1,680 1,680 211 - 211
Penticton Bingo Palace 4,561 4,561 706 13 719
Planet Bingo 17,148 17,148 1,796 250 2,046
Playtime Bingo (Nanaimo) 4,984 4,984 771 22 793
Playtime Gaming (Victoria) 3,548 3,548 562 25 586
Quesnel Bingo Hall (2 Rivers) 804 804 136 7 143
River City Bingo 1,043 1,043 187 6 193
Rocky Mountain Bingo 3,200 3,200 477 10 486
Treasure Cove Bingo 11,474 11,474 1,331 111 1,442
Tri-City Bingo Palace Ltd. 365 365 107 - 107
Total - - 193,384 193,384 26,012 1,327 -
Y/E March 31, 2003:
Tri-City Bingo Palace closed July 27, 2002
711 Bingo Emporium closed October 2, 2002
Play It Again Bingo closed November 15, 2002
Bingo City closed January 11, 2003

25
2003–2004 (in thousands of dollars)
CGC or Bingo Hall Slot
Revenue Bingo
Revenue Total
Revenue Operator
Commission FDC AFDC Total
Commission
Bingo Bingo Esquimalt 3,317 3,317 703 22 724
Boardwalk Gaming Centre - Burnaby 7,889 7,889 1,494 114 1,608
Chances Abbotsford 8,951 8,951 1,573 28 1,600
Chances Boardwalk Mission 724 724 180 4 184
Chances Campbell River 6,882 6,882 1,369 12 1,381
Chances Courtenay 3,695 3,695 834 6 841
Chance Cowichan 4,410 4,410 905 - 905
Chances Dawson Creek 1,570 1,570 361 30 391
Chances Fort St John 3,620 3,620 804 60 864
Chances Kamloops 10,568 10,568 1,889 210 2,099
Chances Kelowna 13,219 13,219 2,179 268 2,446
Chances Prince Rupert 2,185 2,185 507 5 512
Chances Rim Rock 2,800 2,800 643 6 649
Chances Signal Point Gaming 4,032 4,032 880 66 946
Chances Terrace 5,530 5,530 1,114 113 1,227
Chilliwack Bingo 11,901 11,901 1,941 123 2,064
Cordial Bingo Hall 239 239 55 4 59
Fairweather Bingo 5,625 5,625 1,097 1 1,098
Harbour City Bingo 6,962 6,962 1,239 68 1,307
Langford Drop-In Bingo 1,910 1,910 490 2 492
Langley Bingo Palace 9,603 9,603 1,817 23 1,840
Maple Ridge CGC 8,692 8,692 1,545 28 1,573
Newton Bingo Country 16,312 16,312 2,516 205 2,722
Nordley's Bingo Hall 1,183 1,183 285 - 285
North Star Bingo Hall 1,063 1,063 252 11 264
Penticton Bingo Palace 4,406 4,406 955 2 957
Planet Bingo 17,199 17,199 2,473 174 2,647
Playtime Bingo (Nanaimo) 5,781 5,781 1,190 123 1,313
Playtime Gaming (Victoria) 4,671 4,671 1,002 99 1,101
Quesnel Bingo Hall (2 Rivers) 889 889 209 17 226
River City Bingo 1,031 1,031 252 6 258
Rocky Mountain Bingo 2,624 2,624 621 2 623
Treasure Cove Bingo 14,442 14,442 2,133 209 2,342
Total - 193,926 193,926 35,506 2,039 - 37,546
Y/E March 31, 2004:
Cordial Hall closed January 31, 2004

26
2004–2005 (in thousands of dollars)
CGC or Bingo Hall Slot
Revenue Bingo
Revenue Total
Revenue Operator
Commission FDC AFDC Total
Commission
Bingo Bingo Esquimalt
4,002 4,002 807 75
882
Boardwalk Gaming Centre - Burnaby
7,199 7,199 1,356 142
1,499
Chances Abbotsford
8,149 8,149 1,416 153
1,568
Chances Boardwalk Mission
841 841 187 16
203
Chances Campbell River
6,469 6,469 1,287 133
1,420
Chances Courtenay
3,623 3,623 811 75
885
Chances Cowichan
4,549 4,549 912 4
916
Chances Dawson Creek 1,777 1,366 3,143 623 150
773
Chances Fort St John
3,517 3,517 780 71
851
Chances Kamloops 196 11,891 12,087 2,068 253
2,321
Chances Kelowna 397 12,986 13,383 2,209 289
2,497
Chances Prince Rupert
2,074 2,074 475 37
512
Chances Rim Rock
3,432 3,432 744 66
811
Chances Signal Point Gaming 2,423 3,581 6,004 1,201 239
1,441
Chances Terrace
5,380 5,380 1,082 109
1,191
Chilliwack Bingo
12,595 12,595 1,955 136
2,091
Fairweather Bingo
5,644 5,644 1,095 110
1,205
Harbour City Bingo
5,182 5,182 972 81
1,054
Langford Drop-In Bingo
1,515 1,515 361 25
386
Langley Bingo Palace
9,025 9,025 1,714 187
1,901
Maple Ridge CGC
8,543 8,543 1,486 148
1,635
Newton Bingo Country
15,555 15,555 2,411 319
2,731
Nordley's Bingo Hall
233 233 59 -
59
North Star Bingo Hall
962 962 223 19
242
Penticton Bingo Palace
4,515 4,515 959 88
1,047
Planet Bingo
17,445 17,445 2,463 322
2,786
Playtime Bingo (Nanaimo)
6,767 6,767 1,346 142
1,488
Playtime Gaming (Victoria)
4,442 4,442 959 94
1,053
Quesnel Bingo Hall (2 Rivers)
827 827 191 16
207
River City Bingo
945 945 223 14
237
Rocky Mountain Bingo
2,270 2,270 531 44
575
Treasure Cove Bingo
14,856 14,856 2,155 261
2,417
Total 4,793 190,380 195,173 35,062 3,819 - 38,880
Y/E March 31, 2005:
Mission Bingo Country closed April 14, 2004 and reopened as Boardwalk Gaming Centre - Mission on December 4, 2004
Nordley's closed May 29, 2004
New Community Gaming Centres:
Bear Mountain (Dawson Creek) opened October 1, 2004
Signal Point Gaming (Williams Lake) opened November 5, 2004
Enterprise Entertainment (Kamloops) opened March 5, 2005
Bingo Kelowna opened March 11, 2005

27
2005–2006 (in thousands of dollars)
CGC or Bingo Hall Slot
Revenue Bingo
Revenue Total
Revenue Operator
Commission FDC AFDC Total
Commission
Bingo Bingo Esquimalt
4,541 4,541 923 92
1,015
Bistro Bingo
14 14 3 0
4
Boardwalk Gaming Centre - Burnaby
7,590 7,590 1,450 161
1,611
Chances Abbotsford
6,244 6,244 1,127 115
1,242
Chances Boardwalk Mission
3,211 3,211 685 60
746
Chances Campbell River 706 6,284 6,990 1,438 238
1,676
Chances Courtenay
3,405 3,405 774 71
844
Chances Cowichan
4,707 4,707 924 123
1,047
Chances Dawson Creek 5,637 1,197 6,834 1,797 120
1,917
Chances Fort St John
3,431 3,431 762 69
831
Chances Kamloops 3,203 11,043 14,246 2,743 463
3,205
Chances Kelowna 8,306 11,566 19,872 4,080 616
4,696
Chances Prince Rupert
1,526 1,526 348 29
377
Chances Rim Rock
3,198 3,198 702 62
764
Chances Signal Point Gaming 7,260 3,210 10,470 2,706 240
2,946
Chances Terrace
4,699 4,699 971 95
1,067
Chilliwack Bingo
12,122 12,122 1,954 224
2,179
Fairweather Bingo
5,494 5,494 1,079 109
1,188
Harbour City Bingo
5,439 5,439 1,030 103
1,133
Langford Drop-In Bingo
1,053 1,053 239 20
259
Langley Bingo Palace
7,204 7,204 1,402 1,549
2,951
Maple Ridge CGC
9,194 9,194 1,549 167
1,716
Newton Bingo Country
15,185 15,185 2,337 300
2,637
North Star Bingo Hall
137 137 31 3
34
Penticton Bingo
4,481 4,481 958 94
1,052
Planet Bingo
17,182 17,182 2,478 328
2,806
Playtime Bingo (Nanaimo)
6,225 6,225 1,250 130
1,380
Playtime Gaming (Victoria)
4,211 4,211 915 88
1,003
Quesnel Bingo Hall (2 Rivers)
142 142 33 3
35
River City Bingo
927 927 217 18
235
Rocky Mountain Bingo
2,088 2,088 486 40
526
Treasure Cove Bingo
14,982 14,982 2,166 266
2,432
Total 25,112 181,932 207,044 39,557 5,997 - 45,554
New Community Gaming Centres:
Playtime–Campbell River opened February 4, 2006

28
2006–2007 (in thousands of dollars)
CGC or Bingo Hall Slot
Revenue Bingo
Revenue Total
Revenue Operator
Commission FDC AFDC Total
Commission
Bingo Bingo Esquimalt
4,954 4,954 1,009 102
1,111
Bistro Bingo
4 4 1 0
1
Boardwalk Gaming Centre - Burnaby
7,849 7,849 1,507 170 86 1,763
Chances Abbotsford
5,772 5,772 1,133 116
1,249
Chances Boardwalk Mission
3,156 3,156 680 60
740
Chances Campbell River 7,076 3,998 11,074 2,641 267 99 3,007
Chances Courtenay
3,324 3,324 760 69
829
Chances Cowichan 865 4,537 5,402 1,115 112 17 1,244
Chances Dawson Creek 11,734 1,200 12,934 3,198 78 328 3,604
Chances Fort St John
3,201 3,201 736 66
802
Chances Kamloops 3,585 10,201 13,786 2,706 174 466 3,345
Chances Kelowna 10,337 10,872 21,208 4,500 178 700 5,378
Chances Prince Rupert
1,364 1,364 311 26
337
Chances Rim Rock
3,482 3,482 759 67
826
Chances Signal Point Gaming 8,087 3,725 11,812 2,833 (70) 525 3,289
Chances Terrace
4,664 4,664 958 94 24 1,075
Chilliwack Bingo
13,094 13,094 2,209 266
2,475
Fairweather Bingo
5,945 5,945 1,173 119
1,293
Harbour City Bingo
6,408 6,408 1,196 121
1,317
Langford Drop-In Bingo
809 809 183 15
198
Langley Bingo Palace
7,022 7,022 1,378 145
1,523
Maple Ridge CGC
9,022 9,022 1,540 165
1,705
Newton Bingo Country
13,886 13,886 2,182 287
2,469
Penticton Bingo Palace
4,074 4,074 869 83
952
Planet Bingo
17,016 17,016 2,440 321
2,761
Playtime Bingo (Nanaimo)
5,416 5,416 1,104 112
1,216
Playtime Gaming (Victoria)
4,148 4,148 909 88
997
River City Bingo
810 810 190 16
206
Rocky Mountain Bingo
2,330 2,330 544 45
589
Treasure Cove Bingo
14,191 14,191 2,094 252
2,346
Total 41,684 176,473 218,156 42,859 3,543 2,246 48,647
Y/E March 31, 2007:
Bistro Bingo closed December 18, 2006
Langford drop-in Bingo closed February 2, 2007
Prince Rupert Bingo closed February 27, 2007
River City Bingo closed march 31, 2007
Lucky Dollar Bingo Palace opened February 15, 2007
New Community Gaming Centres:
Chances Dawson Creek opened July 5, 2006
Boardwalk Gaming Centre (Burnaby) opened December 1, 2006
Chances Cowichan opened March 1, 2007

29
2007–2008 (in thousands of dollars)
CGC or Bingo Hall Slot
Revenue Bingo
Revenue Total
Revenue Operator
Commission FDC AFDC Total
Commission
Bingo Bingo Esquimalt
5,361 5,361 1,091 113 - 1,205
Boardwalk Gaming Centre - Burnaby
7,073 7,073 1,348 155 215 1,718
Chances Abbotsford
3,930 3,930 865 82 - 947
Chances Boardwalk Mission 4,296 2,600 6,896 1,642 177 56 1,875
Chances Campbell River 11,256 3,437 14,692 3,595 412 92 4,099
Chances Courtenay 933 3,167 4,100 987 95 11 1,092
Chances Cowichan 10,375 4,720 15,095 3,557 410 156 4,123
Chances Dawson Creek 14,091 1,219 15,310 3,811 446 45 4,301
Chances Fort St John 7,365 2,243 9,608 2,398 241 37 2,676
Chances Kamloops 4,994 10,377 15,371 3,099 356 339 3,793
Chances Kelowna 15,756 11,196 26,953 5,830 680 344 6,853
Chances Prince Rupert 3,166 832 3,998 984 112 30 1,126
Chances Rim Rock 3,872 2,464 6,336 1,533 163 42 1,738
Chances Signal Point Gaming 10,488 4,221 14,709 3,524 399 155 4,078
Chances Terrace
5,184 5,184 1,086 113 176 1,375
Chilliwack Bingo
14,193 14,193 2,346 287 - 2,633
Fairweather Bingo
6,003 6,003 1,205 122 - 1,327
Harbour City Bingo
7,481 7,481 1,362 140 - 1,501
Langley Bingo Palace
8,106 8,106 1,612 170 - 1,781
Maple Ridge CGC
9,069 9,069 1,596 31 - 1,627
Newton Bingo Country
13,181 13,181 2,189 323 - 2,512
Penticton Bingo Palace
4,189 4,189 907 86 - 993
Planet Bingo
16,633 16,633 2,434 315 - 2,750
Playtime Bingo (Nanaimo)
4,916 4,916 1,022 102 - 1,124
Playtime Gaming (Victoria)
3,785 3,785 852 80 - 933
Rocky Mountain Bingo
2,191 2,191 517 43
560
Treasure Cove Bingo 125 14,939 15,064 2,264 268 - 2,532
Total 86,717 172,709 259,426 53,657 5,921 1,697 61,247
Y/E March 31, 2008:
Playtime Gaming Campbell River closed June 30, 2007 and reopened as Chances Campbell River on July 5, 2007
Dob City - Port Alberni closed August 25, 2007 and reopened as Chances Rim Rock on September 14, 2007
Rainbow Bingo Hall - Fort St John closed Sept 15, 2007 and reopened as Chances Fort St John on Sept 21, 2007
Valley Entertainment Palace - Courtenay closed Feb 19, 2007 and reopened as Chances Courtenay on Feb 28, 2007
Good Time Bingo Hall (presently Treasure Cove Bingo) - Prince George closed March 22, 2008 and reopened as Chances Good Time Prince George on March 27, 2008
New Community Gaming Centres:
Chances Boardwalk Mission opened August 24, 2007
Chances Prince Rupert opened October 11, 2007

30
2008–2009 (in thousands of dollars)
CGC or Bingo Hall Slot
Revenue Bingo
Revenue Total
Revenue Operator
Commission FDC AFDC Total
Commission
Bingo Bingo Esquimalt
5,242 5,242 1,044 112
1,156
Boardwalk Gaming Centre - Burnaby
5,139 5,139 988 105 156 1,250
Chances Abbotsford
1,411 1,411 331 30
361
Chances Boardwalk Mission 9,813 1,849 11,662 2,858 330 65 3,253
Chances Campbell River 10,708 2,053 12,761 3,173 364 77 3,613
Chances Courtenay 11,397 2,315 13,712 3,431 390 93 3,914
Chances Cowichan 12,409 3,415 15,824 3,845 442 118 4,405
Chances Dawson Creek 12,265 795 13,060 3,246 383 29 3,658
Chances Fort St John 14,262 969 15,231 3,810 580 39 4,429
Chances Kamloops 6,277 6,180 12,457 2,701 304 201 3,207
Chances Kelowna 16,777 9,069 25,846 5,706 668 276 6,650
Chances Prince Rupert 8,607 1,474 10,080 2,492 288 53 2,833
Chances Rim Rock 7,290 2,172 9,462 2,314 261 79 2,655
Chances Signal Point Gaming 10,167 3,293 13,460 3,266 370 122 3,758
Chances Terrace 1,353 4,138 5,490 1,239 133 142 1,514
Chilliwack Bingo
11,305 11,305 1,924 225 - 2,149
Fairweather Bingo
4,298 4,298 904 86 - 990
Harbour City Bingo
5,870 5,870 1,136 116 - 1,252
Langley Bingo Palace 802 6,649 7,450 1,509 162 112 1,783
Maple Ridge CGC
6,989 6,989 1,255 138 - 1,393
Newton Bingo Country
10,383 10,383 1,772 238 - 2,010
Penticton Bingo Palace
3,213 3,213 706 62 - 768
Planet Bingo
11,416 11,416 1,862 210 - 2,071
Playtime Bingo (Nanaimo)
2,863 2,863 652 56 - 708
Playtime Gaming (Victoria)
3,595 3,595 816 76 - 892
Rocky Mountain Bingo
1,459 1,459 346 30 - 376
Treasure Cove Bingo 3,872 10,518 14,390 2,715 306 316 3,337
Total 125,997 128,072 254,069 56,042 6,465 1,880 64,387
Y/E March 31, 2009:
Lucky Dollar Bingo palace closed Jan 28, 2009 and reopened as Chances Terrace on Jan 29, 2009
New Community Gaming Centres:
Langley Bingo Palace opened October 14, 2008

31
2009–2010 (in thousands of dollars)
CGC or Bingo Hall Slot
Revenue Bingo
Revenue Total
Revenue Operator
Commission FDC AFDC Total
Commission
Bingo Bingo Esquimalt
4,793 4,793 1,072 95 - 1,167
Boardwalk Gaming Centre - Burnaby
4,931 4,931 1,103 98 146 1,347
Chances Abbotsford 10,762 1,388 12,150 2,951 341 61 3,353
Chances Boardwalk Mission 9,792 1,438 11,230 2,773 318 62 3,153
Chances Boardwalk Squamish 830 93 923 225 26 20 271
Chances Campbell River 10,336 1,837 12,173 3,041 344 83 3,469
Chances Courtenay 11,971 2,039 14,010 3,503 396 97 3,996
Chances Cowichan 13,039 2,820 15,859 3,907 447 126 4,481
Chances Dawson Creek 11,667 871 12,538 3,128 366 54 3,548
Chances Fort St John 12,896 693 13,589 3,401 400 51 3,852
Chances Kamloops 6,366 4,774 11,140 2,629 277 165 3,070
Chances Kelowna 22,994 8,058 31,052 7,248 819 268 8,335
Chances Prince Rupert 7,055 1,582 8,637 2,267 240 86 2,594
Chances Rim Rock 7,008 1,689 8,697 2,174 242 73 2,489
Chances Signal Point Gaming 8,905 2,979 11,884 2,968 322 122 3,412
Chances Terrace 7,656 2,146 9,802 2,407 268 82 2,757
Chilliwack Bingo
11,133 11,133 2,233 220 - 2,453
Fairweather Bingo
4,221 4,221 972 78 - 1,050
Harbour City Bingo
5,483 5,483 1,212 101 - 1,312
Langley Bingo Palace 1,984 5,918 7,902 1,758 (69) 198 1,887
Maple Ridge CGC
6,529 6,529 1,349 120 - 1,468
Newton Bingo Country
9,276 9,276 1,878 178 - 2,056
Penticton Bingo Palace
2,571 2,571 647 46 - 693
Planet Bingo
10,115 10,115 1,946 174 - 2,119
Playtime Bingo (Nanaimo)
2,551 2,551 633 45 - 679
Playtime Gaming (Victoria)
3,291 3,291 814 61 - 876
Rocky Mountain Bingo
1,394 1,394 353 28 - 381
Treasure Cove Bingo 698 8,644 9,342 1,868 167 248 2,282
Total 143,959 113,257 257,216 60,462 6,148 1,941 68,551
Y/E March 31, 2010:
Abbotsford Bingo closed Sept 13, 2008 and reopened as Chances Abbotsford on June 18, 2009
Chances Good Time Prince George closed June 6, 2009. Effective June 18, 2009, the site's bingo operations (Treasure Cove Bingo) moved to Treasure Cove Casino.
New Community Gaming Centres:
Chances Boardwalk Squamish opened in February 2010

32
Appendix 1: Facility Development Commission Guidelines for BCLC Casino Service Providers
Objective: to provide a guide to access the Facilities Development Commission (FDC).
The FDC is a facility development commission which is subject to the operator providing and adhering to an annual Business Plan and/or Capital Budget. This commission allows the Service Provider (SP) to recover the initial capital investment on casino facilities and subsequent capital replacements and enhancements of the casino facility.
The FDC is accumulated by the SP by depositing a percentage (outlined in their individual Casino Operational Services Agreement (COSA) of Net Win into a trust account.
20 Withdrawals from the FDC
account are dependent upon the SP obtaining approval from British Columbia Lottery Corporation (BCLC). In order to process requests for withdrawals from the FDC account, BCLC requires:
1. An annual Business Plan and/or Capital Budget for review prior to the commencement of the capital project.
2. Details of the actual payments made with a comparison to the original plan and explanations of variances.
When the Business Plan/Capital Budget is submitted to BCLC by the SP, BCLC will respond with confirmation as to the eligible project expenditures which meet the terms of the FDC program. Written authorization for the SP to withdraw funds from the FDC trust account may take place, only after BCLC has reviewed and approved the actual expenditures (with budget variance explanations).
Eligible Expenditures will be considered under the following general headings:
Pre-Development Costs,
Construction Costs,
Furnishing and Equipment, and
Opening Costs:
1. Pre-Development Costs
Soft Costs associated with the design and construction of a facility subsequent to BCLC approving a detailed Facility Development Business Plan:
Costs related to retaining building/construction professionals such as architects, engineers, for the preparation of documents or blue prints used in the physical development of the facility.
Costs of satisfying municipal requirements such as development cost charges, permit/development fees, market studies/reports.
Cost of developing a project execution plan with a supplier approved by BCLC (Arm’s Length Transaction).
Costs associated with the purchase of property - limited to legal fees, land transfer taxes, and construction period property taxes up to the point of substantial completion of the facility.
20 In the event that the SP has approved expenditures in excess of earned amounts, the SP may draw the earned amount directly
from the operating account, requiring no deposit to the trust account.

33
Financing or interest costs associated with loans or other financing arrangements for new capital construction or improvements during the construction phase up to the point of substantial completion of the project. On-going financing costs are not eligible for FDC compensation.
Utility costs during the course of construction up to the point of substantial completion of the facility.
Costs associated with varying the organizational structure to facilitate a project may be eligible at the discretion of BCLC.
For example, Staff wages may be eligible if an internal staff member is participating in a role where the job description would be a normal construction function.
2. Construction Costs
The normal costs of construction in relation to the approved Facility Development Business Plan.
The land purchase will be eligible only after construction of the land improvements have commenced.
Land and building leases may be eligible. Payments under a capital lease may be eligible based on the lower of net present value or the original cost. Interest or financing costs related to leases are not eligible for FDC.
Convention centers, theatres, pubs and bar, restaurants and racetrack facilities—all additional amenities constructed to make the complex more appealing to visitors may be eligible for FDC (at the discretion of BCLC).
Common areas of eligible and non-eligible structures will be approved based on reasonable allocation.
Interior and exterior construction (or improvements) to meet BCLC standards for surveillance and security or facility design, parking, ambience, or operational efficiency.
Infrastructure improvements to washrooms, HVAC, plumbing, heating, electrical, generator systems (in case of power failure) and landscaping and sprinkler systems.
Health and safety improvements relating to the Gaming Operation.
3. Furnishings and Equipment
Start-up equipment and décor for the casino operation, including all of the amenity areas: convention centers, theatres, pubs and bars, restaurants and racetrack facilities where these facilities have been approved by BCLC.
Initial and ongoing improvements to maintain the quality of experience for the gaming public, including ambient lighting, signage, carpet, millwork, seating, suites for group bookings, etc.
Capital (equipment) leases may be eligible. Payments under a capital lease may be eligible based on the lower of net present value or the original cost. Interest or financing costs related to leases are not eligible for FDC.
Repairs and maintenance of furnishings and equipment will not be eligible unless the life of the capital asset is extended.

34
Back of house equipment required by BCLC such as ticket redemption machines, counting machines.
4. Opening Costs
Grand opening or grand re-opening celebrations (at the discretion of BCLC) may be eligible.
Staff certification costs for liquor requirement – Serving It Right.
The following list of expenditures will not be FDC eligible:
Improvements of which SP is the primary beneficiary such as executive office space or retail space.
All costs deemed to be staff training in nature.
Costs deemed to be marketing in nature (sponsorships, mail-outs, lure pieces, website development).
Costs of exceeding BCLC facility standards for normal workplace requirements (employee gyms, lounges, etc).
Some workplace equipment, technology, or supplies used by the SP (computer equipment, telephones, headphones, and some radio equipment).
Supplies considered disposable, such as but not limited to; videotapes, table felts, hand-held counterfeit detectors and food and beverage supplies.
GST.
Financing costs (except as mentioned above under eligible expenditures).
Items that are paid for by BCLC.
Repairs and maintenance to the building, equipment and furnishings.
Costs associated with option extensions on the purchase of land or building.
Operating leases such as but not limited to slot and table game leases.
Costs related to staff training except where noted.

35
When submitting requests for approval and subsequent withdrawal from the FDC Fund, please provide the information using the template provided by BCLC:
1. Schedules listing the expenditures with a reconciliation to the Business Plan/Capital Budget. Explanations of large variances between actual costs and the Business Plan/Capital Budget must be submitted. Variances which exceed the original budget, where reasonable, may be considered.
2. For mortgage or loan payments, provide details to separate the principal repayments from the interest or financing costs. An amortization schedule should also be provided.
3. FDC submissions must be submitted to BCLC electronically. If electronic submission is not feasible, submissions can be faxed and/or mailed.
Email: [email protected] Fax: 1-800-637-0746 Address: 74 West Seymour Street
Kamloops, BC V2C 1E2
In all cases, submissions for eligible expenditures must be net of GST.
BCLC will provide to the SP, reconciliation between items being claimed and those approved as eligible expenditures.
BCLC will provide a monthly FDC schedule to SPs. The schedule will include:
A percentage of Net Win (based on COSA), accumulated by BCLC fiscal periods
Total expenditures that have been claimed for reimbursement from the FDC Fund and have been approved by BCLC.
The current balance.
The current balance will be a debit if accumulated FDC funds are greater than approved expenditures. From time-to-time, BCLC will request SPs provide confirmation of the balance in the trust account.
The balance will be a credit if the total qualifying expenditures approved by BCLC are more than the total accumulated FDC funds. In this case, we will confirm with you the balance of qualifying expenditures that remain unfunded.
The maximum that may be withdrawn from the fund is the lesser of the net accumulated FDC balance and the balance of previously unfunded approved expenditures.
When BCLC reports the balance in the FDC Fund, please return confirmation of this figure. Confirmations can be sent by email or fax. In the event of discrepancies, contact Casino Finance to identify and clear up any differences as soon as possible.
CONSOLIDATION
Where a SP operates more than one casino in British Columbia, FDC may at BCLC’s discretion, be allowed to be consolidated. That is, FDC earned by all casinos in the SP corporate group and FDC expenditures approved by BCLC, for those casinos in the SP corporate group may be consolidated at a global level by the SP.

36
Appendix 2: Facility Development Commission Guidelines for BCLC Bingo and Community Gaming Service Providers
1. Objective: To provide a guide to access the Facility Development Commission (FDC) Program
The purpose of FDC is to provide additional compensation to Bingo Service Providers (BSP) for the component of the operation of the gaming facility that relates to the provision of the facility. The additional compensation related to the operation of the gaming facility is derived from the Bingo net of prizes and Slot net win, provided the BSP utilizes these funds to improve the gaming facility. Bingo FDC, Slot FDC and additional CGC FDC percentages are laid out in accordance with Schedule A of the Bingo Operational Services Agreement (BOSA).
BCLC will be required to approve the improvements prior to commencing on the proposed project. The types of improvements that BCLC will approve include initial capital investment of the facility as well enhancements to a gaming facility (see section below for examples of eligible and ineligible projects).
Before a BSP can start to earn this additional compensation, BCLC must approve a detailed Facility Plan and a Business Plan. Once both detailed plans are received, BCLC will allow the additional compensation to accumulate prior to completion of the project (see accumulation of FDC for major projects). The plans will be reviewed in detail and the BSP will be advised, in writing, of any shortcomings or deficiencies that need to be addressed. Arrangements will be made to discuss what is expected and to establish mutually agreeable timelines to resolve the issues so as not to interrupt the FDC accumulation.
The BSP will be required to substantiate that the improvements have been completed.
If the BOSA is cancelled prior to the BSP earning the entire approved amount of FDC, any outstanding amounts for facility improvements will not be paid by BCLC.
If the BOSA is assigned to a new BSP by BCLC, that new BSP can earn the outstanding FDC compensation under the BOSA based on the improvements that have been made to the facility pursuant to the Facility Business Plan previously approved by BCLC.

37
2. Prior to Commencing a Project:
For Major Projects (requiring designs and/or structural changes), BCLC requires:
1. A detailed Facility Plan and Business Plan (refer to template), including details of the size and layout of the facility and renderings including the enhancements, themes, and ambiance elements, estimated sales and profit projection, capital budget plan and a construction/project execution plan for review and approval prior to the commencement of the capital project.
2. Completed FDC Request Form. Available from Business Development Manager (BDM).
For Minor Projects BCLC requires:
1. Brief written description of proposed capital project for review.
2. Completed FDC Request Form (available from BDM).
3. Process:
The BSP must provide the BDM with a detailed Facility Plan and Business Plan as described above (for Major Projects) or written description (for Minor Projects) and a completed FDC Request Form. The BDM will submit the request to the Manager, Facilities Gaming, who will review the request within 30 working days and either approve or recommend changes.
Major Projects – once the detailed Facility Plan and Business plan has been received and eligibility for FDC is determined by the Manager, Facilities Gaming, a letter will be sent to the BSP acknowledging receipt and advising of the start date for accumulation. Written approval or recommended changes and approved budgets will follow within 30 working days. Arrangements will be made to discuss what is expected and to establish mutually agreeable timelines to resolve the issues so as not to interrupt the FDC accumulation.
Minor projects – once approved and eligibility for FDC is determined by the BDM, a letter will be sent to the BSP approving the project and budget as being eligible to trigger additional compensation through FDC when the minor project is completed.
Projects can commence once the written approval is received by the BSP for both Major and Minor Projects.
4. Accumulation of FDC for Major Projects:
Major Projects may accumulate FDC upon BCLC receiving the detailed Facility Plan and Business Plan up to an amount equivalent to the cost of the approved project as set out in the Facility Plan. The effective date for accumulation will be identified in the letter sent to the BSP advising of the start date and will coincide with the weekly accounting cycle for FDC. A signed final approval to proceed or make recommended changes along with an approved budget for a Major Project will be issued by BCLC to the BSP within 30 working days. Construction/renovations must commence as set out in the construction schedule in the approved Facility Plan. Any and all delays must be immediately reported to BCLC. Failure to adhere to all Facility Plan schedules may result, at BCLC’s discretion, in an interruption of FDC accumulating for that facility until the project is back on schedule. BCLC may in its sole and absolute discretion continue accumulation during the delay. The BSP must inform BCLC in writing immediately if at any time during the course of the construction the completion costs will exceed 10% or more of the pre-approved budget. Failure to do so may result in BCLC only allowing the pre-approved budget as the eligible expenditure.
Where a facility is being relocated, FDC will start accumulating on the date BCLC formally advises the BSP of receiving the Facility Business Plan for the relocated facility.
1. Where an existing facility is already receiving the FDC, accumulation relating to an approved relocation project cannot commence until the FDC compensation related to the existing facility has been fully earned pursuant to the BOSA.

38
2. If a facility with FDC owing ceases to operate, no further FDC compensation is payable in respect of that facility and is not transferable to the new relocated facility.
3. If a facility is sold by the BSP and there is approved FDC compensation which has not been earned, no further FDC compensation is due to the seller. Any approved FDC compensation which still may be earned will transfer with the BOSA.
4. If a facility is already receiving FDC compensation, previously approved projects must be fully completed and fully paid by FDC compensation equivalent to the eligible approved expenditure. An approved Facility Plan and Business Plan must be in place before accumulation can commence for any subsequent improvement.
5. Where a BSP has more than one facility, all being 100% owned by the BSP, FDC will accumulate individually for each of the facilities in the group with a Facility Plan and Business Plan. The first FDC payment will commence when the project is complete and will include all accumulated FDC compensation for that facility.
If a facility is maintained to BCLC standard and there are no approved FDC compensation amounts which have not been earned as well as no other approved projects for FDC, FDC compensation for that facility may in BCLC’s sole discretion accumulate on account of one of the other facilities in the group that has an approved Facility Business Plan.
If a facility is eligible to receive FDC on account of another facility, then FDC compensation paid will be based on the first instance of an approved and completed project. (First in, first to get compensation paid out basis).

39
5. Payment of FDC:
Minor Projects:
When the minor project is complete as determined by the BDM, the BSP must submit the signed FDC Approved Form with satisfactory evidence of the project being completed and explanation on any variances from the original plan to BCLC Bingo Finance.
In order to incorporate the FDC compensation for Minor Projects on the weekly invoice, the FDC Approved Form must be faxed to Bingo Finance by Friday at 10:00AM for the next sweep date (the following Thursday).
Major Projects:
At the time construction commences or when a lease has been signed securing a new building, the BSP may send a letter to BCLC requesting the release of the accumulated FDC to cover the expenditures paid on pre-development costs and land. The letter should provide a list of the pre-development costs and include proof of purchase on the land if applicable. If the expenditures are in excess of the accumulated FDC, the BSP will continue to receive weekly FDC. The BSP will only receive FDC equivalent to the approved expenditures at which time accumulation will restart and continue until the project is substantially complete.
When the major project is substantially complete as determined by the Manager, Bingo Facilities Gaming, any remaining accumulated FDC will be released to the BSP on the coinciding weekly invoice. The BSP will have 120 days to submit the FDC Approved Form with satisfactory evidence of the project being complete and any variance from the original plan to BCLC Bingo Finance. The package shall include all copies of paid invoices for the total project including any pre-development costs that were approved for release at the time construction commenced. Failure to submit the FDC Approved Form and satisfactory evidence within 120 days may result in BCLC ceasing the FDC accumulation until sufficient documentation is received.
Email: [email protected] Phone: 1-250-828-5500 Fax: 1-250-828-5607 Address: 74 West Seymour Street, Kamloops, BC V2C 1E2
As set forth in the current BOSA, FDC compensation will be paid to the BSP on a weekly basis and reflected in the BSP bank account. For Major Projects, the first FDC payment will include all accumulated FDC compensation for that facility. Subsequent payments will flow from the FDC earned each accounting cycle. No FDC payment will be made until the major project is substantially complete.
BCLC Bingo Finance will provide an FDC Hall History Report which details:
projects that have been approved for FDC compensation,
weekly FDC compensation paid, and
current balance outstanding.
Information regarding the process can be obtained from the BDM or, Manager, Facilities Gaming.
Expenditures are incurred solely on behalf of the BSP and will not be reimbursed by BCLC. The responsibility of paying all expenditures rests solely with the BSP. FDC is available to encourage investment in the facility but there is no guarantee that earned FDC compensation will cover the cost of the improvements.

40
Set forth below are some of the guidelines used by BCLC in considering FDC projects; however, BCLC reviews each FDC project on its own merits. Decisions regarding approvals of FDC will be in the sole and absolute discretion of BCLC. There are circumstances whereby BCLC may determine that only a portion of a project may meet eligibility requirements, or only a portion may actually be related to the bingo gaming aspect of the facility. In this case, BCLC may, in its sole and absolute discretion, assess a proportional amount of the project as eligible for FDC compensation.
In the event the Facility or Land are not used as originally approved by BCLC per the Facility Development Plan, the amount of the FDC expenditure that was originally approved will be re-assessed by BCLC.
6. Eligible Projects may include:
1. Development Costs
At the discretion of BCLC, land and improvements to land and building, may be considered as eligible FDC compensation, or any portion thereof.
Soft Costs associated with the design and construction of a facility after BCLC has approved a detailed Facility Business Plan:
Related to hiring building/construction professionals such as architects, engineers for the preparation of documents or blue prints that will be part of the physical development.
Costs of satisfying municipal requirements such as development cost charges and permit fees.
Cost of developing a project execution plan with a supplier approved by BCLC.
Costs associated with the purchase of property - limited to legal fees, land transfer taxes and construction period property taxes up to the point of substantial completion of the facility.
Utility costs during the course of construction up to the point of substantial completion of the facility.
Interior and exterior construction to meet BCLC standards for surveillance and security or facility design, ambience, or operational efficiency.
Infrastructure improvements to washrooms, HVAC, plumbing, heating, electrical, generator systems (in case of power failure).
Health and safety improvements relating to the Gaming Operation.
Approved facility relocation costs.
Gaming facility construction costs.
Landscaping and sprinkler systems.
2. Furnishing and Cosmetic Décor
Ongoing improvements to maintain quality of experience for the gaming public, including ambient lighting, signage, carpet, millwork, seating, playing surfaces, suites for group bookings, etc.
Costs associated with design to improve the overall player experience.

41
3. Capital leases may be eligible. Payments under a capital lease may be eligible based on the lower of net present value or the original cost. Interest or financing costs related to leases are not eligible for FDC.
4. Financing or interest costs associated with loans or other financing arrangements for new capital construction or improvements will be eligible for FDC during the construction phase until the time of substantial completion of the project. Once the construction of the capital project is substantially complete and the accumulated FDC is released and FDC commences on a weekly basis, on-going financing costs are not eligible for FDC compensation.
7. Examples of Projects not eligible for FDC:
1. Improvements of which BSP is the primary beneficiary such as executive office space or retail space.
2. All costs incurred preparing a Business Plan or Marketing Plan.
3. Costs associated with organizational structure including varying the organizational structure to facilitate a project.
4. Costs of exceeding BCLC facility standards for staff rooms, workplace requirements (that is, employee gyms, lounges, etc).
5. Workplace equipment, technology, or supplies used by the BSP (except for those needed on the gaming floor), e.g. computer equipment, telephones, headphones.
6. GST.
7. Financing Costs (except as mentioned above under Eligible expenditures #6.4).
8. Supplies considered disposable, such as, videotapes, hand-held counterfeit detectors and Food and Beverage supplies..
9. Items that are paid for and owned by BCLC.
10. Marketing initiatives or expenses such as a development of a web page or web site.
11. Penalty and fines incurred by contractors performing improvements.
12. Minor repairs and maintenance to the building and furnishings.
13. Costs associated with option extensions on the purchase of land or building.

42
Appendix 3: BCLC Casino and Community Gaming Facilities and Service Providers
CASINO SERVICE PROVIDERS
Facility Service Provider Municipality
Billy Barker 585 Holdings Ltd. Quesnel
Boulevard (formerly Coquitlam) Great Canadian Casinos Inc. Coquitlam
Cascades (formerly Royal Towers) Gateway Casinos Limited Langley
Casino of the Rockies SEM Resort Limited Partnership Cranbrook
Edgewater
(formerly Grand & Royal Diamond) Edgewater Casino ULC Vancouver
Fraser Downs Orangeville Raceway Ltd Surrey
Grand Villa (formerly Burnaby) Gateway Casinos Limited Burnaby
Hastings Hastings Entertainment Inc. Vancouver
Holiday Inn Great Canadian Casinos Inc. Vancouver
Jack o' Clubs Jack o' Clubs Gaming Hall Ltd. Wells
Kamloops Lake City Casinos Ltd. Kamloops
Kelowna Lake City Casinos Ltd. Kelowna
Mandarin Centre Gateway Casinos Limited Vancouver
Nanaimo Great Canadian Casinos Inc. Nanaimo
Newton Great Canadian Casinos Inc. Surrey
Penticton Lake City Casinos Ltd. Penticton
Red Lion Great Canadian Casinos Inc. Victoria
Renaissance Great Canadian Casinos Inc. Vancouver
River Rock (formerly Richmond) Great Canadian Casinos Inc. Richmond
Starlight (formerly Royal City Star) Gateway Casinos Limited New Westminster
Treasure Cove (formerly Hollywood) Treasure Cove Casino Inc. Prince George
Vernon Lake City Casinos Ltd. Vernon
View Royal (formerly Mayfair, Victoria) Great Canadian Casinos Inc. View Royal

43
COMMUNITY GAMING SERVICE PROVIDERS
CGC or Bingo Hall Service Provider Municipality
711 Bingo Emporium City Bingo Association Victoria
Bingo Bingo Esquimalt 319968 BC Ltd.
(DBA Bingo Bingo Esquimalt)
Victoria
Bingo City Bingo City Games Inc. Prince George
Bistro Bingo Mount Pleasant Starship Community Charitable Association
Vancouver
Boardwalk Gaming Centre - Burnaby 427967 BC Ltd. (DBA Bingo Country) Burnaby
Chances Abbotsford (formerly Abbotsford Bingo)
Playtime Peardonville Ventures Ltd. Abbotsford
Chances Boardwalk Mission (formerly Mission Bingo)
Boardwalk Gaming Mission Inc. Mission
Chances Boardwalk Squamish Boardwalk Gaming Squamish Inc. Squamish
Chances Campbell River (formerly Campbell River Bingo Palace)
Playtime Community Gaming Centres Inc.
Campbell River
Chances Courtenay (formerly Valley Entertainment Palace)
Playtime Community Gaming Centres Inc.
Courtenay
Chances Cowichan (formerly Inkspot Bingo)
Duncan Dabber Bingo Society Cowichan
Chances Dawson Creek (formerly Bear Mountain Bingo)
Great Canadian Entertainment Centres Ltd.
Dawson Creek
Chances Fort St John (formerly Rainbow Bingo Hall)
1222192 Alberta Ltd. Fort St John
Chances Kamloops (formerly Enterprise Entertainment)
Enterprise Entertainment Ltd. Kamloops
Chances Kelowna (formerly Bingo Kelowna)
Goldwing Investments (Saskatoon) Ltd. Kelowna
Chances Prince Rupert (formerly Totem Bingo Hall)
0733244 BC Ltd. Prince Rupert
Chances Rim Rock (formerly Dob City)
Alberni Valley Gaming Association Port Alberni
Chances Signal Point Gaming (formerly Lucky's the Bingo Centre)
Lucky's Ventures Ltd. Williams Lake
Chances Terrace (formerly Lucky Dollar Bingo Palace)
Lucky Dollar Bingo Management Ltd. Terrace
Chilliwack Bingo Chilliwack Bingo Association Chilliwack
Cordial Bingo Hall Cordial Bingo Association Vancouver
Fairweather Bingo Terrim Properties Ltd. Vernon
Harbour City Bingo Harbour City Bingo Society Nanaimo
Langford Drop-In Bingo Pacific Fundraising Ltd Victoria
Langley Bingo Palace Playtime Community Gaming Centres Inc.
Langley
Maple Ridge CGC (formerly Haney Bingo Plex)
Great Canadian Entertainment Centres Ltd.
Maple Ridge

44
CGC or Bingo Hall Service Provider Municipality
Newton Bingo Country 427967 BC Ltd. (DBA Bingo Country) Surrey
Nordley's Bingo Hall Bute Street Bingo Association Port Alberni
North Star Bingo Hall Astel Canada Holdings Ltd. Fort Nelson
Pay It Again Bingo Yarwood Enterprises Ltd Kamloops
Penticton Bingo Palace Playtime Community Gaming Centres Inc.
Penticton
Planet Bingo Community Gaming Management Association
Vancouver
Playtime Bingo (Nanaimo) Playtime Community Gaming Centres Inc.
Nanaimo
Playtime Gaming (Victoria) Playtime Community Gaming Centres Inc.
Victoria
Quesnel Bingo Hall (2 Rivers) Astel Canada Holdings Ltd. Quesnel
River City Bingo River City Bingo Association Powell River
Rocky Mountain Bingo Terrim Properties Ltd. Cranbrook
Treasure Cove Bingo (formerly Chances Good Time, Good Time Bingo)
Treasure Cove Casino Inc. Prince George
Tri-City Bingo Palace Ltd. Pacific Fundraising Ltd Port Moody
Victoria Bingo Palace Pacific Fundraising Ltd Victoria