Battery Energy Storagecapabilities.itron.com/efg/2017/18_William_new.pdfBATTERY ENERGY STORAGE Grid...
40
Implications for Load Shapes and Forecasting April 28, 2017 Battery Energy Storage
Transcript of Battery Energy Storagecapabilities.itron.com/efg/2017/18_William_new.pdfBATTERY ENERGY STORAGE Grid...

Implications for Load Shapes and Forecasting
April 28, 2017
Battery Energy Storage

2
TOPICS
» What is Energy Storage
» Storage Market, Costs, Regulatory Background
» Behind the Meter (BTM) Battery Storage
• Where is it used?
• How is it used?
• Real world examples (California research)
» How to analyze storage?
• Simulations vs. Data
» Where is the market going?

3
WHAT IS ENERGY STORAGE?
» The capture of energy produced at one time for use at
a later time.
Pumped Hydro Compressed Air Batteries

4
BATTERY ENERGY STORAGEDominating technologies
» Dominated by Lithium Ion Batteries followed by flow
batteries

5
BATTERY ENERGY STORAGESize categories
» Transmission connected
» Distribution Connected
» Behind the Meter
Source: Rocky Mountain Institute

6
WHY STORAGE NOW?
Falling Costs
• Tesla Gigafactory
Rising Demand Charges
• Now make up 50% or more of commercial bills
More Intermittent Renewables
• Balance variability
• Offer the ability to line up peaks
Reliability
• Power Outages
• Hurricane Sandy

7
BATTERY ENERGY STORAGEGrid Scale
» Catastrophic leak Oct. 2015 at Aliso Canyon natural gas storage
facility threatened to cause power outages across Southern CA
» 70 MW of energy storage deployed in 6 months
Source: Greentech Media
8
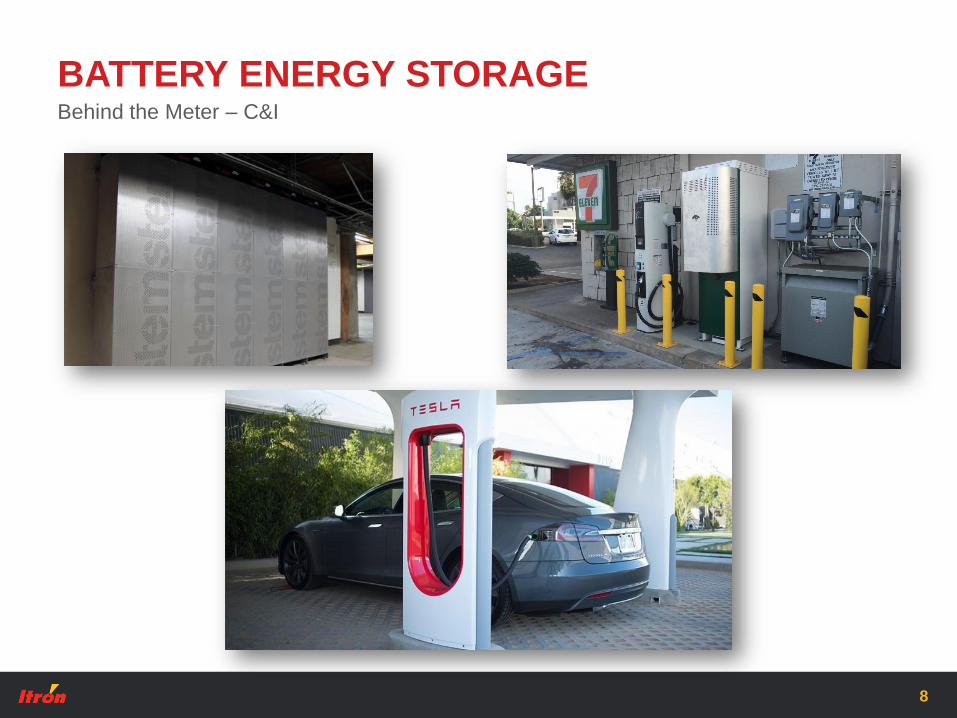
BATTERY ENERGY STORAGEBehind the Meter – C&I

9
BATTERY ENERGY STORAGEBehind the Meter – Residential

10
U.S. ANNUAL DEPLOYMENT FORECASTAdvanced Energy Storage, 2012-2021 (MW)
Source: Greentech Media

11
CAPITAL COSTS
» Tesla data point remains unproven -claims to be ~½ price of prior
versions…
Lithium Ion BTM
Source: Itron DG Cost Effectiveness Model

12
BTM STORAGE REGULATORY DECISIONSRegulatory Background
» California Self-Generation Incentive Program modified to
included standalone storage in 2011
• Most recently program funding doubled to $166 million per
year (85% storage allocation)
» California Public Utilities Commission (CPUC) mandated 1,325
Megawatts of storage by 2024
» Hawaii and Australia reformed tariffs to encourage self-
consumption
» New York, Massachusetts, and New Jersey provide incentives for
energy storage

CALIFORNIA BTM RESEARCHSelf-Generation Incentive Program

14
HOW IS BTM STORAGE BEING USED IN CA?
» Backup Power
» PV Self-Consumption
» Demand Charge
Reduction
» TOU Bill Management
» Aggregated Demand
Response
What we know so far

15
WHERE IS BTM STORAGE BEING DEPLOYED?What we know so far
Note: SGIP is ~18% of estimated U.S. annual deployment at 2016

16
WHERE IS BTM STORAGE BEING DEPLOYED?What we know so far
Non-Res

SGIP DATA ANALYSIS
» Collected interval performance data from storage systems,
merged with AMI data
• Aggregated results: 2015
• Individual case studies: 2016
» Focused on customer energy and peak demand
• Coincident and non-coincident demand
» Residential and Non-Residential
• PBI = Large C&I
During 2015
17

NON-RESIDENTIAL (C&I) STORAGE
PROJECTS

19
ENERGY IMPACTDistribution of 15-Minute kWh Charge/Discharge
15-Min Charge / Discharge kWh
• Most (+80%) of the time systems are idle
• Charge/Discharge patterns are fairly “symmetrical”, so annual energy impact is
negligible

20
METRICS: ROUND-TRIP EFFICIENCY
RTE = total kWh of discharge from the storage project
total kWh of charge
Non-residential AES projects, 2014 - 2015
Program
Requirement:
63.5% annual RTE

21
CASE STUDY 1 – CITY GOV. BUILDING2016 Data, “Narrow” Peak
Calculated Load
AMI Load
Storage Discharge (+) /
Charge (-)

22
CASE STUDY 2 – CITY GOV. BUILDING2016 Data, “Wide” Peak
Calculated Load
AMI Load
Storage Discharge (+) /
Charge (-)

23
CASE STUDY 3 – CITY GOV. BUILDING2016 Data, DR Example
Calculated Load
AMI Load
Storage Discharge (+) /
Charge (-)

24
CASE STUDY 4 – CITY GOV. BUILDING2016 Data, Another DR Example
Calculated Load
AMI Load
Storage Discharge (+) /
Charge (-)

25
CASE STUDY 5 – GROCERY STORE / EV CHG.2016 Data, Idle
Calculated Load
AMI Load
Storage Discharge (+) /
Charge (-)

26
SMALL C&I PROJECTS (NON-PBI)
1 2 3 4 5 6 7 8 9 10 11 12
0 -0.12 -0.10 -0.11 -0.07 -0.12 -0.14 -0.12 -0.18 -0.10 -0.09 -0.08 -0.08
1 -0.18 -0.09 -0.14 -0.10 -0.08 -0.08 -0.06 -0.12 -0.07 -0.07 -0.12 -0.15
2 -0.06 -0.12 -0.10 -0.09 -0.11 -0.05 -0.04 -0.13 -0.06 -0.10 -0.13 -0.18
3 -0.13 -0.13 -0.10 -0.12 -0.16 -0.03 -0.06 -0.10 -0.05 -0.07 -0.09 -0.14
4 -0.19 -0.23 -0.05 -0.15 -0.16 0.00 -0.04 -0.05 -0.05 -0.06 -0.09 -0.13
5 -0.27 -0.15 -0.07 -0.13 -0.10 -0.13 -0.16 -0.20 -0.08 -0.09 -0.12 -0.16
6 -0.30 -0.04 -0.09 -0.05 -0.12 -0.08 -0.09 -0.14 -0.07 -0.04 -0.10 -0.09
7 -0.19 -0.06 -0.12 -0.13 -0.15 -0.11 -0.10 -0.15 -0.09 -0.05 -0.12 -0.13
8 -0.32 -0.18 -0.21 -0.23 -0.25 -0.28 -0.25 -0.23 -0.14 -0.11 -0.11 -0.17
9 -0.23 -0.28 -0.18 -0.22 -0.19 -0.31 -0.27 -0.24 -0.12 -0.11 -0.14 -0.12
10 -0.19 -0.23 -0.29 -0.32 -0.23 -0.31 -0.23 -0.31 -0.17 -0.15 -0.06 -0.04
11 -0.26 -0.17 -0.35 -0.32 -0.37 -0.32 -0.31 -0.36 -0.21 -0.22 -0.04 0.00
12 -0.21 -0.01 -0.14 -0.07 -0.12 -0.24 -0.20 -0.16 -0.07 -0.02 -0.03 -0.05
13 -0.33 -0.32 -0.29 -0.29 -0.21 -0.35 -0.26 -0.15 -0.11 -0.06 -0.15 -0.13
14 -0.20 -0.08 -0.15 -0.06 -0.11 -0.13 -0.12 -0.34 -0.29 -0.30 -0.13 -0.14
15 -0.22 -0.31 -0.29 -0.27 -0.25 -0.29 -0.28 -0.33 -0.25 -0.28 -0.25 -0.25
16 -0.16 -0.20 -0.22 -0.24 -0.25 -0.24 -0.19 -0.28 -0.23 -0.26 -0.22 -0.28
17 -0.10 -0.02 -0.11 -0.11 -0.16 -0.14 -0.11 -0.20 -0.14 -0.18 -0.17 -0.20
18 -0.17 -0.12 -0.16 -0.17 -0.18 -0.18 -0.19 -0.20 -0.15 -0.18 -0.16 -0.15
19 -0.18 -0.23 -0.19 -0.24 -0.18 -0.20 -0.17 -0.16 -0.13 -0.16 -0.15 -0.13
20 -0.15 -0.11 -0.12 -0.16 -0.14 -0.14 -0.15 -0.12 -0.12 -0.13 -0.11 -0.11
21 -0.15 -0.10 -0.12 -0.14 -0.14 -0.14 -0.12 -0.20 -0.12 -0.12 -0.11 -0.11
22 -0.15 -0.09 -0.12 -0.12 -0.12 -0.12 -0.12 -0.23 -0.11 -0.11 -0.10 -0.09
23 -0.15 -0.11 -0.10 -0.11 -0.14 -0.13 -0.13 -0.16 -0.10 -0.08 -0.05 -0.03
Month
H
o
u
r
Total kWh of Discharge (Charge) per kW Rebated Capacity, Non-PBI Projects 2015
Charging not coordinated

27
LARGE C&I PROJECTS (PBI)
1 2 3 4 5 6 7 8 9 10 11 12
0 -0.05 -0.29 -0.39 -0.54 -0.94 -1.35 -1.43 -1.65 -1.63 -1.49 -1.18 -1.07
1 -0.04 -0.27 -0.31 -0.40 -0.56 -0.91 -0.73 -1.15 -1.14 -1.23 -1.55 -1.18
2 -0.04 -0.26 -0.28 -0.33 -0.19 -0.39 -0.18 -0.66 -0.56 -0.77 -1.27 -1.07
3 -0.04 -0.22 -0.22 -0.30 -0.07 -0.15 -0.11 -0.43 -0.31 -0.57 -0.79 -0.76
4 -0.04 -0.14 -0.19 -0.23 -0.05 -0.09 -0.06 -0.26 -0.16 -0.37 -0.59 -0.56
5 -0.03 -0.08 -0.18 -0.16 -0.03 -0.05 -0.04 -0.18 -0.11 -0.37 -0.45 -0.47
6 -0.02 -0.03 -0.13 -0.11 -0.02 -0.03 -0.02 -0.12 -0.07 -0.27 -0.39 -0.39
7 -0.01 0.00 -0.04 0.01 -0.02 0.00 -0.01 -0.01 -0.03 -0.17 -0.28 -0.31
8 -0.01 0.05 -0.01 0.12 -0.01 0.03 0.00 0.07 0.03 -0.02 -0.12 -0.16
9 0.01 0.07 -0.01 0.03 0.00 0.03 -0.05 -0.01 -0.02 0.08 0.02 -0.01
10 0.00 0.07 -0.01 0.03 0.02 0.06 -0.01 0.07 0.04 -0.02 0.06 0.00
11 -0.01 0.08 0.06 0.09 0.13 0.22 0.03 0.21 0.18 0.16 0.24 0.15
12 -0.01 0.07 0.11 0.09 0.12 0.37 0.08 0.29 0.20 0.23 0.28 0.27
13 0.02 0.07 0.10 0.09 0.14 0.44 0.11 0.26 0.24 0.20 0.28 0.16
14 -0.01 0.09 0.12 0.20 0.36 0.52 0.25 0.39 0.31 -0.17 -0.08 -0.22
15 -0.02 0.10 0.14 0.27 0.62 0.65 0.68 0.82 0.48 -0.17 -0.06 0.07
16 0.04 0.16 0.16 0.23 0.60 0.46 0.63 1.12 0.39 -0.10 0.01 -0.09
17 0.02 0.21 0.24 0.21 0.20 0.12 0.14 0.54 0.17 0.11 0.02 -0.03
18 0.00 0.18 0.24 0.21 0.18 0.17 0.26 0.53 0.88 1.23 0.44 0.28
19 0.01 0.14 0.17 0.12 0.19 0.26 0.48 0.68 1.06 1.51 1.58 1.34
20 -0.01 0.03 0.08 0.03 0.13 0.23 0.38 0.56 0.75 1.42 1.68 1.50
21 -0.01 -0.12 -0.11 -0.16 -0.57 -0.65 -0.72 -1.13 -0.97 -0.64 0.99 1.26
22 -0.05 -0.31 -0.20 -0.17 -0.45 -0.31 -0.08 -0.40 -0.49 -0.10 -0.71 -0.59
23 -0.05 -0.29 -0.30 -0.38 -0.94 -1.01 -0.98 -1.62 -1.31 -1.06 -0.11 -0.20
H
o
u
r
Total kWh of Discharge (Charge) per kW Rebated Capacity, PBI Projects 2015
• Charging overnight, when energy is cheap, discharging in evening, when demand
is highest and energy most expensive
Large C&I (PBI) Projects Charge Overnight, Discharge in Evening

28
LARGE C&I (PBI) PEAK DEMAND REDUCTION
• Significant increase in non-coincident peak load reduction during summer
months, compared to the rest of the year
• PBI projects saved an average of ~$0.8 per kW rebated storage capacity in
demand charges
Average Non-Coincident Peak Load Reduction by Month, per Customer (PG&E)

29
2015 COINCIDENT PEAK IMPACTSOnly Large C&I (PBI) Project Contributed to Coincident Peak Demand Reduction

30
NON-RESIDENTIAL AES CO2 IMPACTS
» Generally
discharging during
higher marginal
emission hours
Alignment of grid emissions with charge/discharge
Large
C&I
Small
C&I
» With low efficiency,
net charging in all
hours
Marginal Emissions Compared to Aggregate Discharge (Charge), PBI Projects, 2015
0
0.2
0.4
0.6
0.8
-60-40-20
0204060
1 3 5 7 9 11 13 15 17 19 21 23Net
Dis
char
ge (
MW
h)
Hour of Day
Summer
Net Discharge Marginal Emissions
0
0.2
0.4
0.6
0.8
-60-40-20
0204060
1 3 5 7 9 11 13 15 17 19 21 23 Ton
s C
O2
per
MW
h
Hour of Day
Winter
Net Discharge Marginal Emissions
-0.1
0.1
0.3
0.5
0.7
-2
-1.5
-1
-0.5
0
1 3 5 7 9 11 13 15 17 19 21 23
Net
Dis
char
ge (
MW
h)
Hour of Day
Summer
Net Discharge Marginal Emissions
-0.1
0.1
0.3
0.5
0.7
-2
-1.5
-1
-0.5
0
1 3 5 7 9 11 13 15 17 19 21 23
Ton
s C
O2
per
MW
h
Hour of Day
Winter
Net Discharge Marginal Emissions
Marginal Emissions Compared to Aggregate Discharge (Charge), No-residential, Non-PBI Projects, 2015
31
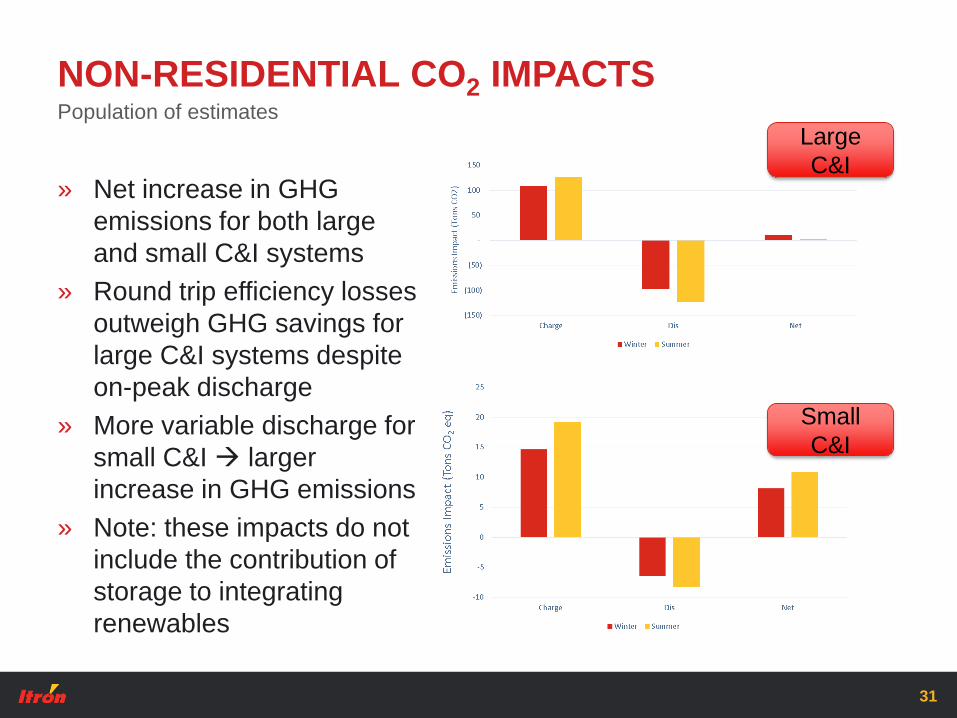
NON-RESIDENTIAL CO2 IMPACTS
» Net increase in GHG
emissions for both large
and small C&I systems
» Round trip efficiency losses
outweigh GHG savings for
large C&I systems despite
on-peak discharge
» More variable discharge for
small C&I larger
increase in GHG emissions
» Note: these impacts do not
include the contribution of
storage to integrating
renewables
Population of estimates
Large
C&I
Small
C&I

RESIDENTIAL STORAGE PROJECTS

33
RESIDENTIAL PROJECTS
1 2 3 4 5 6 7 8 9 10 11 12
0 -0.28 -0.25 -0.28 -0.25 -0.26 -0.26 -0.28 -0.29 -0.29 -0.29 -0.24 -0.26
1 -0.28 -0.25 -0.28 -0.25 -0.26 -0.26 -0.29 -0.29 -0.29 -0.29 -0.24 -0.26
2 -0.28 -0.27 -0.28 -0.25 -0.26 -0.26 -0.29 -0.29 -0.29 -0.29 -0.25 -0.26
3 -0.28 -0.25 -0.28 -0.25 -0.26 -0.26 -0.29 -0.30 -0.29 -0.29 -0.25 -0.27
4 -0.29 -0.25 -0.28 -0.25 -0.26 -0.26 -0.29 -0.30 -0.29 -0.29 -0.26 -0.27
5 -0.28 -0.25 -0.28 -0.25 -0.27 -0.27 -0.29 -0.30 -0.29 -0.29 -0.26 -0.27
6 -0.28 -0.25 -0.28 -0.32 -0.50 -0.54 -0.48 -0.37 -0.30 -0.29 -0.26 -0.28
7 -0.28 -0.26 -0.44 -0.78 -1.10 -0.94 -0.97 -0.79 -0.61 -0.44 -0.30 -0.28
8 -0.31 -0.62 -1.47 -2.25 -2.59 -2.20 -2.19 -2.05 -2.00 -1.84 -1.12 -0.50
9 -1.50 -2.17 -3.65 -3.30 -2.73 -3.06 -3.77 -3.91 -3.87 -4.08 -3.42 -1.89
10 -2.90 -2.85 -1.71 -0.64 -0.47 -2.05 -2.95 -2.88 -3.16 -3.47 -5.18 -3.07
11 -1.60 -0.46 -0.31 -0.45 -0.31 -2.14 -3.58 -3.29 -3.42 -2.92 -6.04 -2.36
12 -1.05 -0.33 -0.29 -0.44 -0.35 -2.05 -4.01 -3.53 -3.76 -2.30 -5.95 -2.04
13 -0.72 -0.67 -0.36 -0.24 -0.37 -1.65 -3.81 -3.32 -3.24 -1.10 -3.23 -1.31
14 -0.82 -0.45 -0.56 -0.74 -0.83 -0.88 -1.63 -1.12 -1.22 -0.17 -0.56 -0.89
15 -0.42 -0.44 -0.72 -0.50 -0.40 -0.61 -1.18 -0.56 -0.68 0.17 1.08 -0.55
16 -0.63 -0.55 -0.33 -0.36 -0.50 1.39 4.19 3.46 4.28 1.41 1.80 -0.07
17 -0.47 -0.52 -0.56 -0.55 -0.62 2.01 4.44 3.81 3.78 1.53 2.93 0.25
18 -0.22 -0.30 -0.48 -0.43 -0.50 2.79 4.54 3.56 3.25 1.62 3.30 0.26
19 -0.22 -0.21 -0.27 -0.31 -0.39 -0.47 -0.53 -0.42 -0.19 0.55 2.89 0.24
20 -0.24 -0.23 -0.27 -0.25 -0.26 -0.23 -0.25 -0.25 -0.24 -0.29 2.27 0.24
21 -0.27 -0.25 -0.27 -0.25 -0.26 -0.23 -0.25 -0.27 -0.27 -0.29 -0.23 -0.23
22 -0.28 -0.25 -0.27 -0.25 -0.26 -0.24 -0.27 -0.28 -0.27 -0.29 -0.24 -0.24
23 -0.28 -0.25 -0.27 -0.25 -0.26 -0.25 -0.28 -0.29 -0.28 -0.29 -0.24 -0.25
Month
H
o
u
r
Total kWh of Discharge (Charge) per kW
Rebated Capacity, Residential Projects, 2015
• All residential projects in our sample are paired with solar
1 2 3 4 5 6 7 8 9 10 11 12
0 0.00 0.00 0.00 0.00 0.00 0.00 0.00 0.00 0.00 0.00 0.00 0.00
1 0.00 0.00 0.00 0.00 0.00 0.00 0.00 0.00 0.00 0.00 0.00 0.00
2 0.00 0.00 0.00 0.00 0.00 0.00 0.00 0.00 0.00 0.00 0.00 0.00
3 0.00 0.00 0.00 0.00 0.00 0.00 0.00 0.00 0.00 0.00 0.00 0.00
4 0.00 0.00 0.00 0.00 0.00 0.00 0.00 0.00 0.00 0.00 0.00 0.00
5 0.00 0.00 0.00 0.04 1.37 5.22 1.24 0.04 0.00 0.00 0.00 0.00
6 0.00 0.00 0.72 33.84 132.22 160.17 117.25 45.73 6.02 0.56 0.01 0.00
7 0.43 3.61 89.60 302.35 492.07 402.76 412.66 305.38 198.64 89.79 13.29 1.20
8 70.69 240.20 738.17 1209.20 1426.98 1221.52 1205.92 1113.81 1065.01 960.35 516.22 120.95
9 751.56 1175.95 2077.80 1920.67 1643.83 1847.94 2238.92 2284.08 2249.48 2366.15 1940.27 1003.33
10 1681.15 1725.66 1089.06 502.17 435.73 1317.05 1854.55 1778.56 1934.10 2156.00 3044.13 1750.61
11 1211.06 585.37 431.15 494.85 436.46 1423.47 2274.63 2061.77 2124.16 1936.95 3624.31 1389.51
12 1054.19 545.29 499.39 554.83 508.31 1406.07 2567.07 2226.06 2360.23 1648.94 3687.04 1304.05
13 977.38 704.08 544.40 563.56 604.52 1257.41 2527.71 2148.21 2112.89 1082.45 2411.80 976.69
14 1031.63 629.47 716.49 832.44 918.46 895.37 1362.99 981.09 1061.76 774.02 1316.87 789.36
15 664.60 582.05 780.99 706.62 680.45 740.71 1084.70 643.98 748.22 786.27 736.53 613.50
16 526.38 519.67 478.07 511.51 633.21 795.12 448.78 433.37 374.86 594.82 412.73 351.38
17 247.94 341.06 416.54 451.67 548.50 458.04 405.89 341.22 354.30 356.38 150.26 97.80
18 13.75 111.18 238.62 266.92 336.40 310.78 331.93 285.48 217.36 60.59 0.91 0.25
19 0.00 0.19 18.75 98.44 180.85 246.09 279.27 177.88 23.03 0.02 0.00 0.00
20 0.00 0.00 0.00 0.11 7.08 35.61 30.37 2.88 0.00 0.00 0.00 0.00
21 0.00 0.00 0.00 0.00 0.00 0.00 0.00 0.00 0.00 0.00 0.00 0.00
22 0.00 0.00 0.00 0.00 0.00 0.00 0.00 0.00 0.00 0.00 0.00 0.00
23 0.00 0.00 0.00 0.00 0.00 0.00 0.00 0.00 0.00 0.00 0.00 0.00
Month
H
o
u
r
Total kWh of Solar Output,
Residential Projects, 2015
Box shows hours that correspond
with utility’s higher TOU rate
Appear to be charging from solar and responding to rates

WHAT’S NEXT?
» Storage prices will continue to drop, seeing a shift towards longer
duration storage (4hr vs 2hr)
» If utilities continue phasing out NEM tariffs, solar + storage value
proposition will increase
• Hawaii, Australia, Arizona, Nevada, California…
• In CA, SGIP will now prioritize projects paired with PV
» Increased demand charges -> increased storage
» Increased ability for utilities to control load
Rates, etc.
34
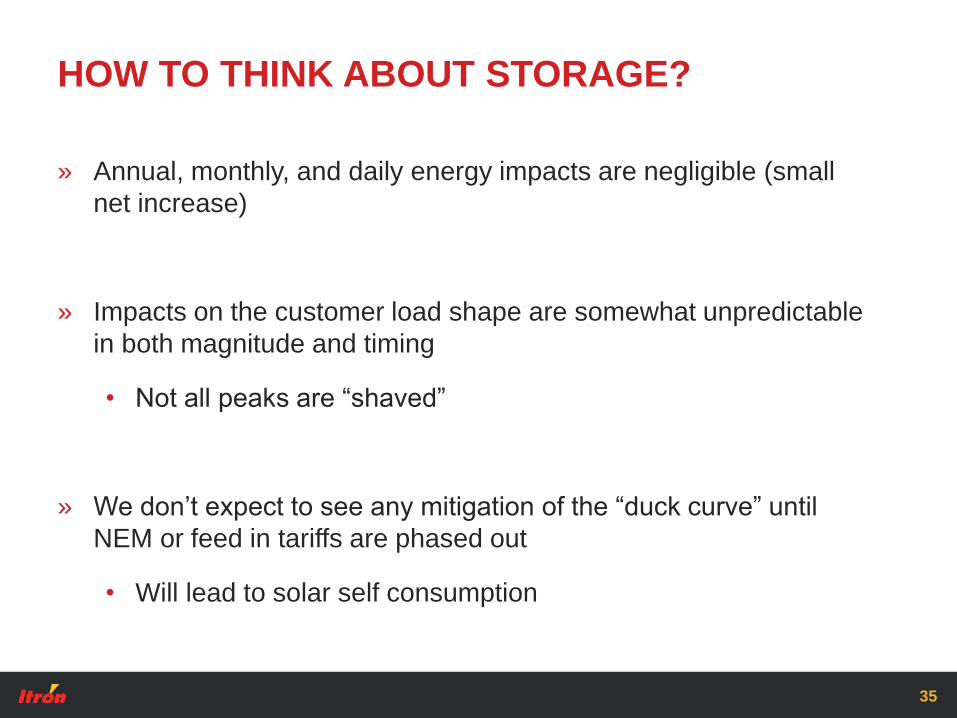
HOW TO THINK ABOUT STORAGE?
» Annual, monthly, and daily energy impacts are negligible (small
net increase)
» Impacts on the customer load shape are somewhat unpredictable
in both magnitude and timing
• Not all peaks are “shaved”
» We don’t expect to see any mitigation of the “duck curve” until
NEM or feed in tariffs are phased out
• Will lead to solar self consumption
35

HOW TO MODEL STORAGE?
» Dispatch models (AMI data + PV data + tariff + storage info)
• Typically assume perfect optimization based on load,
customer generation, and rates
• Not representative of current storage technologies
• Not representative of current
» Sub-metering
• Can be costly, not always actionable
36
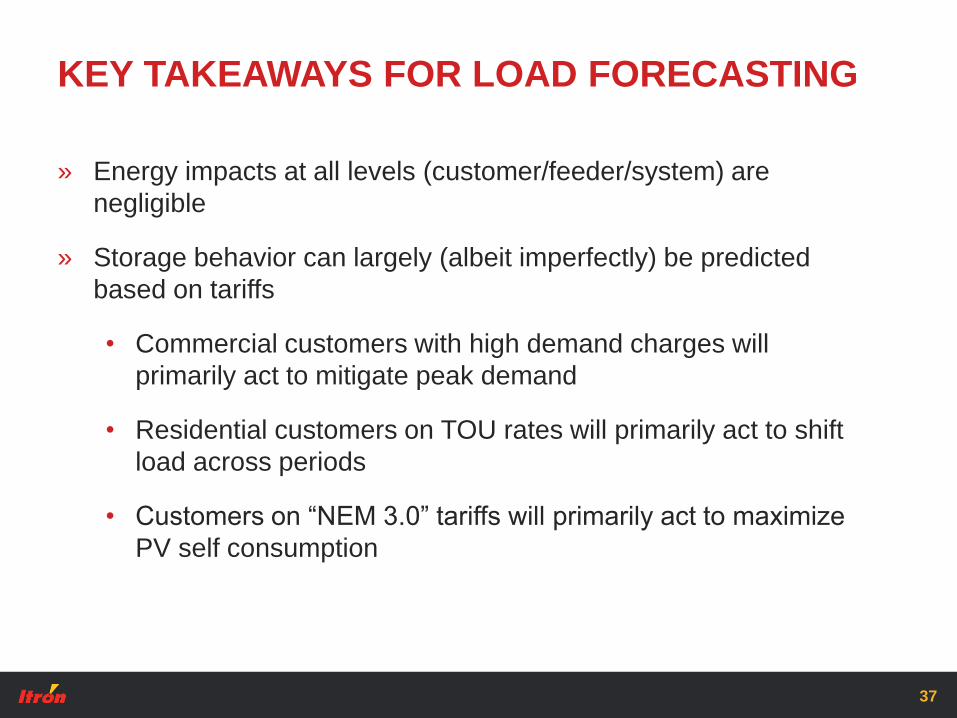
KEY TAKEAWAYS FOR LOAD FORECASTING
» Energy impacts at all levels (customer/feeder/system) are
negligible
» Storage behavior can largely (albeit imperfectly) be predicted
based on tariffs
• Commercial customers with high demand charges will
primarily act to mitigate peak demand
• Residential customers on TOU rates will primarily act to shift
load across periods
• Customers on “NEM 3.0” tariffs will primarily act to maximize
PV self consumption
37

THANK YOU
www.itron.com

BACKUP

METRICS: STORAGE UTILIZATION
Storage discharge “capacity factor” defined as:
𝒌𝑾𝒉 𝑫𝒊𝒔𝒄𝒉𝒂𝒓𝒈𝒆
𝑯𝒐𝒖𝒓𝒔 𝒐𝒇 𝑫𝒂𝒕𝒂 ×𝑫𝒊𝒔𝒄𝒉𝒂𝒓𝒈𝒆 𝑪𝒂𝒑𝒂𝒄𝒊𝒕𝒚×𝟔𝟎%∗
Non-Residential 2014 and 2015
*60% represents the
SGIP Handbook
assumption of 5,200
discharge hours per yr
(5,200 / 8,760 = 60%)
40
0%
10%
20%
30%
40%
50%
60%
70%
1 3 5 7 9 11 13 15 17 19 21 23
Dis
char
ge C
apac
ity
Fact
or
Months of Data Available
PBI Non-PBI
• 18 of 21 (86%) PBI projects had capacity factors of at least 10% (required to
receive full PBI payment)