ALISO CANYON GAS LEAK Community Assessment for … · ALISO CANYON GAS LEAK Community Assessment...
49
ALISO CANYON GAS LEAK Community Assessment for Public Health Emergency Response (CASPER) May 13, 2016
Transcript of ALISO CANYON GAS LEAK Community Assessment for … · ALISO CANYON GAS LEAK Community Assessment...

ALISO CANYON GAS LEAK
Community Assessment for
Public Health Emergency Response
(CASPER)
May 13, 2016

PAGE I OF 49
Los Angeles County Department of Public Health
http://publichealth.lacounty.gov
Acknowledgements
We would like to thank the following persons for their contributions, without which this endeavor would not have been possible. Los Angeles County Department of Public Health Carrie Tayour, PhD, MPH
Katie Butler, MPH Mandi Bane, PhD Tamara Nichols, MPH Ramon E. Guevara, PhD, MPH
California Department of Public Health, Division of Environmental and Occupational Disease Control
Kathleen Attfield, ScD Tracy Barreau, REHS Svetlana Smorodinsky, MPH Jason Wilken, PhD
Los Angeles County Department of Public Health Support Staff
Incident Command System Team: Incident Manager, Public Information Officer, Liaison, Board Liaison, Operations Section, Planning Section and Logistics Section Aida Angelescu, MS Marvin Leiva Ryan Murphy, PhD Josue Rosas
We would like to thank Alice Aragonez from Human Resources and the following departments and programs for providing interviewers to conduct household surveys: Children and Family Services
Children’s Medical Services Chronic Disease and Injury Prevention
Division of HIV and STD Programs Emergency Preparedness and Response Environmental Health Health Assessment Human Resources Office of Women’s Health Organizational Development and Training Public Health Nursing
We thank Evenor Masis, James Tang and Robert Vasquez for providing the safety briefing to the volunteers and serving as our Safety Officers. We thank Joӫlle DuMont, Donald “Jay” Gravink, Shelly Hsu, Justine Kennedy, Eugene Loi, Sona Oksuzyan, Deena Pourshaban, Elizabeth Rubin and Lisa Smith for their epidemiological support. We also thank the Los Angeles Unified School District for providing our local headquarters location. We especially want to thank the interviewers and survey respondents.

PAGE II OF 49
Los Angeles County Department of Public Health
http://publichealth.lacounty.gov
Table of Contents
Acknowledgements ....................................................................................................................................... i
SECTION I. Background .................................................................................................................... 1
SECTION II: Materials and Methods .................................................................................................. 2
Sampling .............................................................................................................................................. 2
Interviews ............................................................................................................................................ 2
Household Survey ................................................................................................................................ 3
Statistical Methods .............................................................................................................................. 3
SECTION III. Results ......................................................................................................................... 4
SECTION IV. Discussion ..................................................................................................................... 9
SECTION V: Recommendations ....................................................................................................... 14
Tables and Figures ......................................................................................................................... 15
Figure 1. Sampling frame for household survey conducted in response to the Aliso Canyon gas leak,
Porter Ranch and Granada Hills, CA, March 2016. .............................................................16
Table 1. Questionnaire response rates for the household survey conducted in response to the Aliso
Canyon gas leak, Porter Ranch and Granada Hills, CA, March 2016. ..................................17
Table 2. Demographics, housing type and relocation status of households interviewed for survey
conducted in response to the Aliso Canyon gas leak, Porter Ranch and Granada Hills, CA,
March 2016. ........................................................................................................................18
Table 3. Households reporting that any member of the household experienced any of the following
health symptoms believed to be related to the gas leak weighted to the entire sampling
frame, Porter Ranch and Granada Hills, CA, March 2016. ..................................................19
Table 4. Proportion of sampled households that reported that symptoms got better when away
from home or away from the area, Porter Ranch or Granada Hills, CA, March 2016. .......20
Table 5. Households reporting that any member of the household had experienced any of the
following health symptoms believed to be related to the gas leak by distance to the well,
Porter Ranch and Granada Hills, CA, March 2016. .............................................................22
Table 6. Medical care sought by households reporting symptoms in the past month believed to be
related to the gas leak weighted to the entire sampling frame, Porter Ranch and Granada
Hills, CA, March 2016. .........................................................................................................23
Table 7. Odors and oily residue weighted to the entire sampling frame, Porter Ranch and Granada
Hills, CA, March 2016. .........................................................................................................24
Table 8. Proportion of sampled households during the past month reporting any of the following
health symptoms believed to be related to the gas leak by whether they smelled odors,
Porter Ranch and Granada Hills, CA, March 2016. .............................................................25

PAGE III OF 49
Los Angeles County Department of Public Health
http://publichealth.lacounty.gov
Table 9. Odors and oily residue by distance to the well, Porter Ranch and Granada Hills, CA, March
2016.....................................................................................................................................26
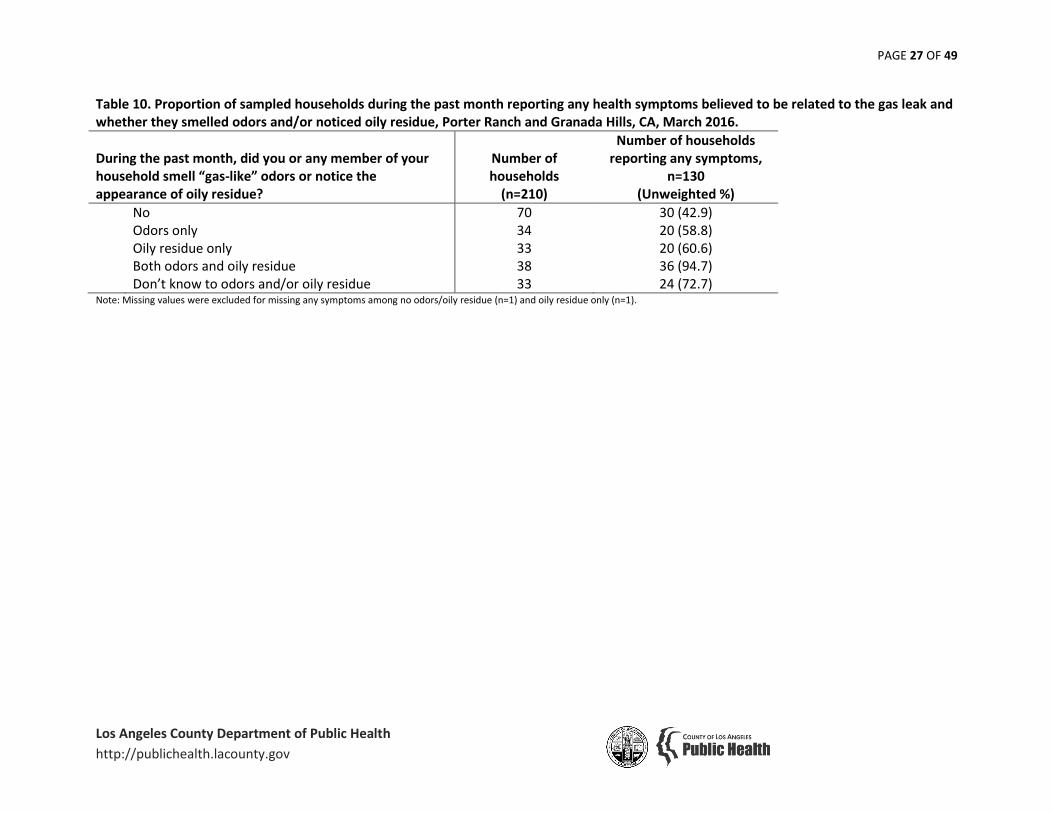
Table 10. Proportion of sampled households during the past month reporting any health symptoms
believed to be related to the gas leak and whether they smelled odors and/or noticed oily
residue, Porter Ranch and Granada Hills, CA, March 2016. ...............................................27
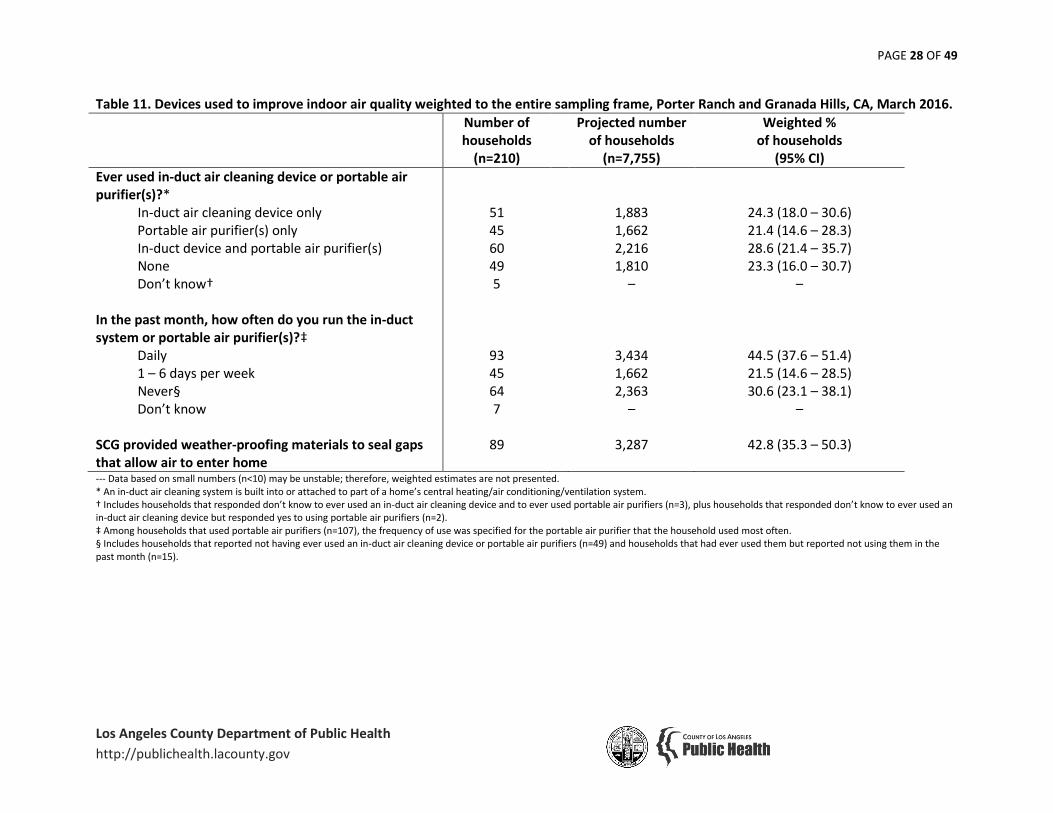
Table 11. Devices used to improve indoor air quality weighted to the entire sampling frame, Porter
Ranch and Granada Hills, CA, March 2016..........................................................................28
Table 12. Activities of relocated households as they prepare to moving back home or after
returning home weighted to the entire sampling frame, Porter Ranch and Granada Hills,
CA, March 2016. ..................................................................................................................29
Table 13. Households’ greatest need weighted to the entire sampling frame, Porter Ranch and
Granada Hills, CA, March 2016. ..........................................................................................30
Appendix A .................................................................................................................................... 33
Consent Script ....................................................................................................................................34
Aliso Canyon Gas Leak Resources ......................................................................................................35
Confidential Referral Form ................................................................................................................36
Appendix B .................................................................................................................................... 37
Questionnaire ...................................................................................................................................41

PAGE 1 OF 49
Los Angeles County Department of Public Health
http://publichealth.lacounty.gov
SECTION I. Background
The massive release of natural gas from Well SS-25 at the Aliso Canyon Natural Gas storage facility began on October 23, 2015. On February 11, 2016 Southern California Gas (SCG) reported that the flow of gas from the Well SS-25 had been stopped, and on February 18, 2016 the California Department of Oil, Gas, and Geothermal Resources (DOGGR) confirmed that the well was permanently sealed. The Los Angeles County Department of Public Health (DPH) has been actively monitoring and assessing the environmental and health issues related to this incident, including a multi-agency comprehensive air monitoring program for methane, sulfur compounds, benzene, and numerous other chemicals. Throughout the leak, methane levels in the community were elevated, but below those presenting a risk to health and safety.1 Measured benzene levels in the community fluctuated somewhat, with a maximum short-term reading of 5.6 parts per billion (ppb); however, average outdoor air levels were consistently less than 1 ppb, established by the Office of Environmental and Health Hazard Assessment (OEHHA) as the outdoor air threshold for long-term exposure in the state of California.2 Sulfur odorants, which are added to natural gas, were consistently below the instrument detection limits of field instruments, but were presumed to be the cause of symptoms experienced by some residents in the community due to their low odor threshold. Symptoms of odorant exposure include nausea, abdominal discomfort, headaches, dizziness, light-headedness, eye discomfort and other mucus membrane irritation, and shortness of breath.3 During the 16-week period from October 28, 2015 to February 18, 2016, DPH received approximately 700 complaints of symptoms associated with odors from the gas leak. On November 19, 2015, DPH issued a directive to SCG to provide temporary relocation assistance to any resident affected by odors from the Aliso Canyon site. The purpose of this directive was to provide area residents with a mode of relief from odors and symptoms experienced in their homes. After Well SS-25 was sealed, DPH continued to monitor outdoor air contaminant levels for several weeks to ensure that they returned to expected background levels. DPH also enlisted volunteers within the community to report on the continued presence of odors in the outdoor environment. During this time, many residents attempted to return to their homes, as air quality returned to typical conditions for the area and reports of odors diminished. Health symptoms thought to be caused by outdoor air contaminants or odors were expected to diminish. However, from February 18 to March 20, DPH received 240 additional reports from residents reporting symptoms in one or more members of the household sometimes in the absence of odors, including recurrence of symptoms upon temporary or permanent re-occupation of their homes. Reported symptoms during this period were similar to those that prompted relocation of families before the leak was sealed. Some residents reported the onset of symptoms upon returning to their homes, with subsequent relief of symptoms upon leaving their homes and the area to go to work, school, or a temporary relocation destination. DPH collaborated with the California Department of Public Health (CDPH) to develop a Community Assessment for Public Health Emergency Response (CASPER) to further investigate the nature of the health complaints within the communities closest to the Aliso Canyon facility. CASPER is an epidemiologic tool developed by the Centers for Disease Control and Prevention (CDC) to obtain rapid household-based information about health status, basic needs, and other relevant information about a particular community after a disaster to enable public health and other authorities to make informed decisions regarding response efforts.4 On March 10-12, 2016, DPH conducted a CASPER in order to address the following objectives: 1) to assess the frequency and types of reported health symptoms from residents during the active gas leak and after the leaking well was sealed, 2) to determine the scope of reported odors and the appearance of oily residues on surfaces in the community, and 3) to develop recommendations to guide public health response.

PAGE 2 OF 49
Los Angeles County Department of Public Health
http://publichealth.lacounty.gov
SECTION II: Materials and Methods
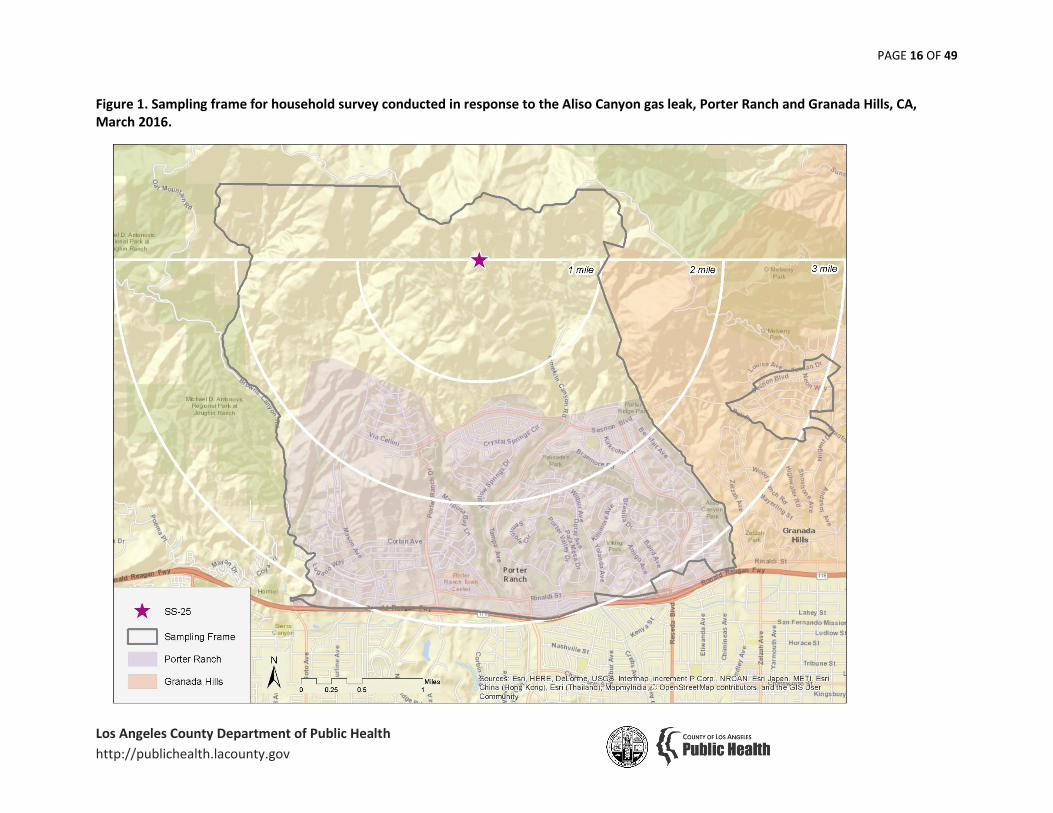
Sampling The sampling frame is a predetermined area of interest that captures the entire population from which a CASPER sample is drawn and to which the results would be generalized. The sampling frame for the CASPER encompassed the communities closest to the Aliso Canyon facility which reported the most frequent number of health complaints to DPH. This consisted of the census blocks within a 3-mile radius south of Well SS-25, including the Porter Ranch community north of California State Route 118 and a group of highly populated census blocks of the Granada Hills community (Figure 1). A two-stage cluster design was used to randomly select a representative sample of 210 households to be interviewed from a total of 7,755 housing units (2010 census) in the sampling frame.5 Stage 1: In the first stage, 30 census blocks were randomly selected as clusters from the sampling frame using a custom toolbox for Arc Geographic Information Systems (ArcGIS),6 with the probability of selection proportional to the number of housing units in each census block; this resulted in higher density census blocks having a higher probability of being selected.
Stage 2: In the second stage of sampling, trained interviewers used systematic random sampling methods to select seven households within each of the 30 census blocks. The interviewers randomly selected a housing unit as the starting point then used a detailed map of the census block to systematically select every nth housing unit, with nth being the total number of housing units in a particular cluster divided by 7. For example, if there were 70 housing units in the census block, the interviewers would visit every tenth housing unit to survey until they had completed 7 interviews. Interviews DPH and CDPH provided interviewers with a five-hour training on March 10, 2016 on the purpose for the CASPER, household selection and tracking methods, administration of the survey, and safety and referral information. Interviewers were comprised of DPH staff, primarily public health nurses and health educators, paired in teams of two. Interviewers attempted to conduct seven interviews in each of the 30 selected census blocks, with instructions to make three attempts at each selected household before replacement. At each of the selected households, interviewers obtained verbal consent and respondents were eligible to participate if they were at least 18 years of age and resided in the selected household (Appendix A). The English-language based questionnaire and verbal consent were translated into Spanish, Korean and Mandarin and an interviewer fluent in the appropriate language conducted the interview upon request. Interviews were conducted over two and a half days from March 10–12, 2016. Additionally, interviewers provided households with a resource list of state and local agencies as well as contact information for SCG services (e.g. cleaning of oily residue) and used confidential referral forms if they encountered urgent physical or mental health needs and forwarded them to DPH for immediate follow up (Appendix A).
PAGE 3 OF 49
Los Angeles County Department of Public Health
http://publichealth.lacounty.gov
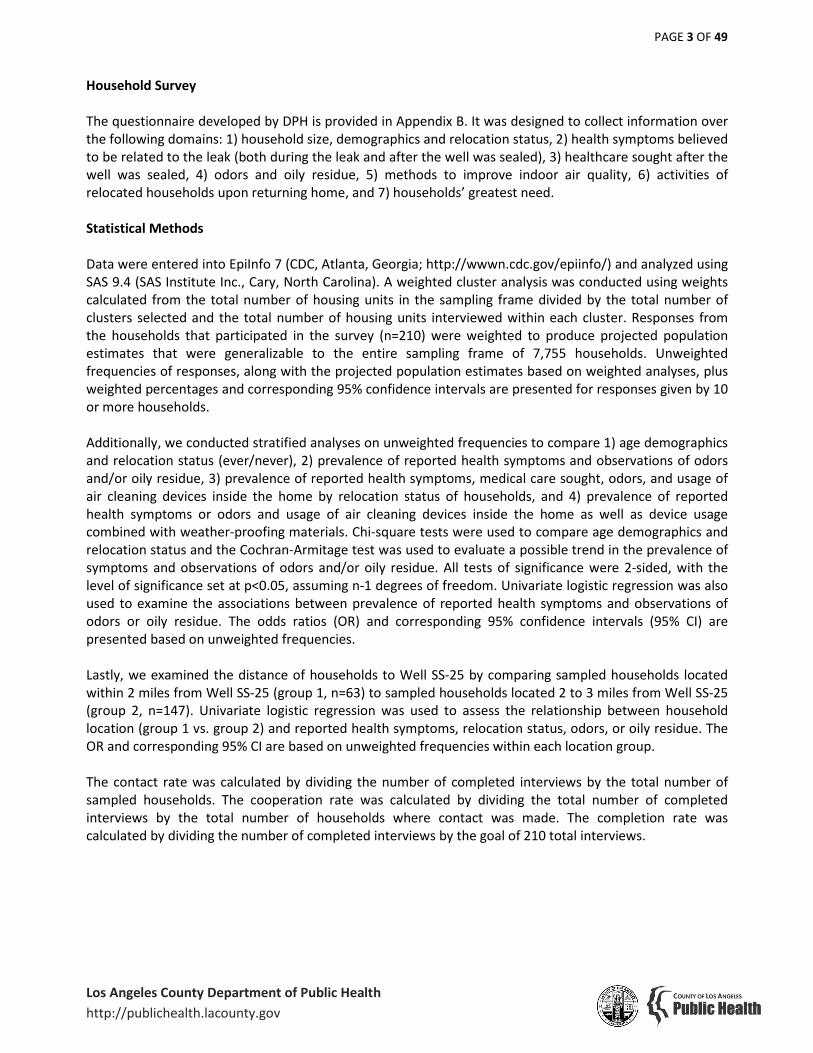
Household Survey The questionnaire developed by DPH is provided in Appendix B. It was designed to collect information over the following domains: 1) household size, demographics and relocation status, 2) health symptoms believed to be related to the leak (both during the leak and after the well was sealed), 3) healthcare sought after the well was sealed, 4) odors and oily residue, 5) methods to improve indoor air quality, 6) activities of relocated households upon returning home, and 7) households’ greatest need. Statistical Methods Data were entered into EpiInfo 7 (CDC, Atlanta, Georgia; http://wwwn.cdc.gov/epiinfo/) and analyzed using SAS 9.4 (SAS Institute Inc., Cary, North Carolina). A weighted cluster analysis was conducted using weights calculated from the total number of housing units in the sampling frame divided by the total number of clusters selected and the total number of housing units interviewed within each cluster. Responses from the households that participated in the survey (n=210) were weighted to produce projected population estimates that were generalizable to the entire sampling frame of 7,755 households. Unweighted frequencies of responses, along with the projected population estimates based on weighted analyses, plus weighted percentages and corresponding 95% confidence intervals are presented for responses given by 10 or more households. Additionally, we conducted stratified analyses on unweighted frequencies to compare 1) age demographics and relocation status (ever/never), 2) prevalence of reported health symptoms and observations of odors and/or oily residue, 3) prevalence of reported health symptoms, medical care sought, odors, and usage of air cleaning devices inside the home by relocation status of households, and 4) prevalence of reported health symptoms or odors and usage of air cleaning devices inside the home as well as device usage combined with weather-proofing materials. Chi-square tests were used to compare age demographics and relocation status and the Cochran-Armitage test was used to evaluate a possible trend in the prevalence of symptoms and observations of odors and/or oily residue. All tests of significance were 2-sided, with the level of significance set at p<0.05, assuming n-1 degrees of freedom. Univariate logistic regression was also used to examine the associations between prevalence of reported health symptoms and observations of odors or oily residue. The odds ratios (OR) and corresponding 95% confidence intervals (95% CI) are presented based on unweighted frequencies. Lastly, we examined the distance of households to Well SS-25 by comparing sampled households located within 2 miles from Well SS-25 (group 1, n=63) to sampled households located 2 to 3 miles from Well SS-25 (group 2, n=147). Univariate logistic regression was used to assess the relationship between household location (group 1 vs. group 2) and reported health symptoms, relocation status, odors, or oily residue. The OR and corresponding 95% CI are based on unweighted frequencies within each location group. The contact rate was calculated by dividing the number of completed interviews by the total number of sampled households. The cooperation rate was calculated by dividing the total number of completed interviews by the total number of households where contact was made. The completion rate was calculated by dividing the number of completed interviews by the goal of 210 total interviews.

PAGE 4 OF 49
Los Angeles County Department of Public Health
http://publichealth.lacounty.gov
SECTION III. Results
Interview teams were successful at conducting 7 interviews in each sampled census block and completed a total of 210 interviews, yielding a 100.0% completion rate (Table 1). Interviews were completed in 45.6% of the 461 households that were approached and in 73.4% of households with an eligible participant answering the door. Nearly all interviews were conducted in English (98.6%), with two interviews conducted in Korean and another conducted in Mandarin. Household Size, Demographics and Relocation Status The sizes of households interviewed ranged from one to eight with the majority (54.8%) having two to three persons (Table 2). The proportion of households having at least one member under 5 years old was 11.0% and 45.2% of households had at least one member 65 years or older. Most households (83.3%) resided in single family detached homes. Nearly half (45.7%) of the responding households had at least one member who had chosen to be temporarily relocated in response to the gas leak. Among households that had been relocated, 53.2% reported that every member of the household had returned back home by the time of interview. Another 14.9% of relocated households reported that some, but not all members of the household had returned back home by the time of the interview and 31.9% reported that no member of the household had returned back home by the time of the interview. “Returned back home” was defined as living in the home and excluded those that routinely visited their homes without staying for an extended period of time. Comparing age demographics of households that had been relocated to those that had not relocated, a significantly higher proportion of relocated households had at least one member under 5 years old (p=0.047), 18 to 39 years old (p=0.002), and/or 40 to 64 years old (p=0.002), and a significantly lower proportion of relocated households had at least one member 65 years or older (p=0.019) (data not shown). Health Symptoms During the active gas leak, 81.3% of sampled households reported having at least one member of the household experience any health symptoms that were believed to be related to the gas leak; over half of households reported eye/nose/throat irritation, headache/migraine, respiratory complaint (includes shortness of breath/difficulty breathing, chest tightness/ heaviness, cough, wheezing, and worsening of asthma or chronic obstructive pulmonary disease), stress, dizziness/light headiness, and nausea/vomiting (Table 3). In the month after the gas leak was sealed, 62.5% of sampled households reported having at least one member of the household experience any health symptoms believed to be related to the gas leak; over half of households reported eye/nose/throat irritation, headache/migraine, and respiratory complaint although the frequencies were lower than during the active gas leak. Households that reported having at least one member who experienced health symptoms believed to be related to the gas leak were also asked if those specific symptoms improved when they were away from home or away from the local area (e.g. at work, school, or relocated housing). Over three-quarters of sampled households reported that symptoms of eye, nose or throat irritation, headache/migraine, respiratory complaint, dizziness/light headedness, nausea/vomiting, nosebleeds, and fever got better when they were away from home or the local area both during the gas leak and after the leak was sealed (Table 4). Fewer households reported that stress related to the gas leak was reduced or got better when they were away (70.1% during gas leak and 63.5% after well was sealed), and participants often commented during interviews that the situation itself or factors relating to relocation were stressful.

PAGE 5 OF 49
Los Angeles County Department of Public Health
http://publichealth.lacounty.gov
More relocated households reported experiencing health symptoms believed to be related to the gas leak than households that had not relocated both during the leak and after the well was sealed. During the gas leak, nearly all relocated households reported experiencing health symptoms (99.0%) compared to 65.8% of households that had not relocated (data not shown). After the well was sealed, 79.2% of relocated households reported health symptoms while 47.4% of households that had not relocated reported health symptoms. Households closer to Well SS-25 reported greater frequencies of any health symptoms as well as specific health symptoms both during the gas leak and after the well was sealed (Table 5). During the active gas leak, sampled households less than 2 miles from the well were 2.7 times more likely to report having at least one member of the household experience health symptoms believed to be related to the gas leak compared to households 2 to 3 miles from the well (OR = 2.7, 95% CI: 1.1, 6.8). In the month after the gas leak was sealed, sampled households less than 2 miles from the well were 1.4 times more likely to report health symptoms than households 2 to 3 miles from the well, but this was not statistically significant (OR = 1.4, 95% CI: 0.7, 2.6). We considered the possibility that households closer to the well may be more likely to have relocated and not returned home compared to households further away; and we evaluated whether this resulted in a difference in symptoms reported after the well was sealed. More households less than 2 miles from the well had relocated compared to households 2 to 3 miles from the well (58.7% and 40.1%, respectively), yet a similar proportion of households had not returned home from each distance group (32.4% and 31.0%, respectively, data not shown). Nearly all households that had relocated and not returned home (n=30) reported experiencing symptoms after the well was sealed regardless of distance to the well (data not shown). Healthcare Sought After the Well Was Sealed Among surveyed households that reported symptoms experienced in the past month related to the gas leak (n=130), 60.8% of households sought medical care for their symptoms (Table 6). Households that sought care were most likely to do so at their family doctor or urgent care center (89.9%), followed by a specialist or other type of care (29.1%), and emergency room or hospital (17.7%). Among households that did not seek care for their symptoms experienced in the past month (n=48), the most common reason indicated by 52.1% of households was that their symptoms were “not bad enough” (data not shown). Although more relocated households reported experiencing symptoms after the well was sealed compared to households that had not relocated, a similar proportion of households sought medical care for the symptoms experienced regardless of relocation status (61.8% and 59.3%, respectively, data not shown). Odors and Oily Residue During the month after the well was sealed, 40.5% of sampled households reported smelling “gas-like” odors: 25.9% inside their home, 43.5% outside their home or in the neighborhood, and 30.6% both inside and outside (Table 7). Households that reported smelling “gas-like” odors specified all times of day when they recalled smelling odors in the past month; no specific time of day received greater frequency to be noteworthy and this was true for odors smelled inside homes as well as outside (data not shown). More than three-quarters of households (78.8%) that reported smelling “gas-like” odors in the past month experienced health symptoms compared to 50.0% of households that did not smell odors, and this difference was statistically significant (Table 8). Households that reported smelling “gas-like” odors in the past month were 3.7 times more likely to report experiencing symptoms during the same time frame

PAGE 6 OF 49
Los Angeles County Department of Public Health
http://publichealth.lacounty.gov
compared to households that did not smell odors (OR = 3.7, 95% CI: 2.0, 7.1). Compared to households that did not smell odors, more households that smelled odors in the past month also reported every kind of symptom. Households closest to the well (less than 2 miles) were no more likely to report smelling “gas-like” odors than households further away from the well (2 to 3 miles) (OR = 0.9, 95% CI: 0.7, 1.2) (Table 9). A similar proportion of households reported smelling odors both inside and outside among homes closer and further away (30.4% and 30.6%, respectively). Fewer households less than 2 miles from the well reported smelling odors outside than households 2 to 3 miles from the well (34.8% and 46.8%, respectively). Compared to households less than 2 miles from the well, households 2 to 3 miles from the well were more likely to report smelling odors both outside their homes (26.5% and 20.6%, respectively) and outside in the neighborhood (21.1% and 14.3%, respectively, data not shown). We considered the possibility that households closer to the well may be more likely to have relocated and not returned home compared to households further away; and we evaluated whether this resulted in a difference in odors reported after the well was sealed. Among households that had relocated and had not returned home (n=30), a similar proportion of households reported smelling odors regardless of distance to the well (data not shown). One-third of households (34.8%) reported ever noticing the appearance of oily residue on surfaces outdoors at their home or in the neighborhood during the active gas leak or after the well was sealed, while another 12.4% reported that they didn’t know if they ever noticed the appearance of oily residue (Table 7). Households closer to the well (less than 2 miles) were 1.9 times more likely to notice oily residue than households further away (2 to 3 miles from the well) and this was statistically significant (OR = 1.9, 95% CI: 1.4, 2.7) (Table 9). Households that noticed oily residue were 9.2 times more likely to report health symptoms during the gas leak (OR = 9.2, 95% CI: 2.7, 31.3) and 3.9 times more likely to report health symptoms after the well was sealed (OR = 3.9, 95% CI: 2.0, 7.8), and these findings were statistically significant (data not shown). In the month after the well was sealed, the percentage of households that reported symptoms believed to be related to the leak was 42.9% among households reporting no odors or oily residue, 58.8% among households reporting odors only, 60.6% among households reporting oily residue only, and 94.7% among households reporting both odors and oily residue (Table 10). Excluding households that did not know if they observed odors and/or oily residue, a statistically significant trend was found between odors/oily residue and increased reporting of symptoms (ptrend<0.001). Methods to Improve Indoor Air Quality Households were asked whether they ever used an in-duct air cleaning device that is built into or attached to their home’s central heating/ventilation/air conditioning system or portable air purifiers to try to improve the indoor air quality of their homes. One quarter of sampled households (24.3%) used in-duct air cleaning devices, another fifth of households (21.4%) used portable air purifiers, another quarter (28.6%) used both kinds of devices, and the remainder did not use either kind of device (23.3%) (Table 11). The majority of households (97.3%) that used in-duct air cleaning devices had them newly installed by SCG. Those that used portable air purifiers had on average two purifiers per household (range: one to five), with the majority (89.4%) receiving at least one from SCG. Another 31.7% of households newly purchased at least one portable air purifier since the gas leak began and 19.0% owned at least one portable air purifier prior to the gas leak (data not shown).

PAGE 7 OF 49
Los Angeles County Department of Public Health
http://publichealth.lacounty.gov
The majority of households (66.0%) reported regular use of either in-duct air cleaning devices or portable air purifiers in the month after the well was sealed: 44.5% of households used them daily and 21.5% of households used them 1 to 6 days per week (Table 11). Only 30.6% of households did not use the devices or did not have them. We considered the possibility that relocated households that had not returned home (n=30) may differ from occupied homes in terms of having in-duct air cleaning devices installed or using portable air purifiers; but only three households that had not returned home reported that they did not use either kind of device (data not shown). During the month after the well was sealed, 73.6% of households that used air cleaning devices daily reported health symptoms, 62.2% of households that used air cleaning devices 1 to 6 days per week reported symptoms, and 45.3% of households that did not use air cleaning devices reported symptoms. Use of air cleaning devices did not appear to affect the proportion of households smelling any “gas-like” odors or any “gas-like” odors inside the home (data not shown). In addition, individually examining the use of either in-duct air cleaning devices or portable air purifiers did not change the proportions of households experiencing any symptoms or reporting any odors presented for both devices assessed together (data not shown). Although regular use of air cleaning devices may not have affected the reporting of any odors, use of these devices may have reduced the frequency of smelling odors inside the home. Among households that reported smelling “gas-like” odors inside their home and reporting that they used methods to air out their home (such as running the central air conditioning system, opening windows and doors, using portable air purifiers, or using fans), two-thirds (68.4%) reported that those methods helped to reduce the odors while the remaining third (31.6%) reported that using those methods did not reduce the odors or they did not know if they reduced the odors (Table 7). SCG provided weather-proofing materials to 42.8% of households to seal gaps that allow air to enter the home. Having weather-proofing materials provided by SCG in addition to use of either air cleaning device did not affect the percentages of households experiencing symptoms or reporting odors in the month after the well was sealed (data not shown). Activities of Relocated Households Upon Returning Home Households that temporarily relocated in response to the gas leak (n=96) were asked whether they aired out their home for at least two hours or cleaned their homes in preparation to moving back or after returning home from relocation (Table 12). Half of relocated households (48.9%) had both aired out and cleaned their home, while another 14.9% had only aired out their home and another 13.8% had only cleaned their home. Almost one fifth of relocated households (18.1%) had not aired out or cleaned their home, but the majority (64.7%) of these seventeen relocated households reported that no one had returned home yet. Among households that had their home cleaned in preparation to moving back or after returning home (n=59), the majority (62.7%) did not have any member experience any health symptoms; however, one fifth of households (22.0%) reported that at least one member of the household experienced health symptoms while their home was being cleaned or later that same day and another 9 households did not know if anyone had experienced symptoms. In preparation to moving back or after returning home, more than one third of relocated households (36.6%) reported running all of their faucets in their home for at least 60 seconds and two-thirds (66.7%) reported flushing all of their toilets in their home at least once.

PAGE 8 OF 49
Los Angeles County Department of Public Health
http://publichealth.lacounty.gov
Households’ Greatest Need When asked about the household’s greatest current need, 25.7% indicated no need, but others reported home and property cleaning (13.3%), solutions to the decline in property values (11.0%), assurance that the gas leak and similar incidents will not happen again (9.5%), testing for pollutants inside homes (9.0%), follow-up for health risk in the future (7.6%), recovery from current health symptoms (6.2%), air purifiers or weather stripping from Southern California Gas Company (5.7%), honest information about the gas leak (4.8%), clean air (4.3%), reimbursement for relocation expenses (3.8%), the return to “normal life” after relocation, particular for local schools (3.3%), and safe water in swimming pools and for drinking (2.9%) (Table 13).

PAGE 9 OF 49
Los Angeles County Department of Public Health
http://publichealth.lacounty.gov
SECTION IV. Discussion
Key Findings
1. Symptom reporting:
Before leak was sealed: 81%
After leak was sealed: 63%
2. The majority of households (61%) sought medical care for symptoms experienced after the well was sealed, primarily from family doctors and urgent care centers.
3. Residents commonly report alleviation of symptoms upon leaving their homes, both before and after the leak was sealed.
4. After the leak was sealed, 41% of households reported smelling “gas-like” odors.
5. Among households that reported both odors and oily residue, 95% experienced symptoms after
the leak was sealed.
6. 64% of relocated households reported airing out their home upon returning home. Only half of relocated households (49%) reported both airing out and cleaning their home upon returning home.
Household Size, Demographics and Relocation Status Interview teams successfully completed the goal of 210 interviews in the sampling area. The household sizes and the ages of residing persons were similar to the 2010 Census demographic data for the Porter Ranch community (zip code 91326) and part of the Granada Hills community (zip code 91344).7 Only three CASPER interviews were conducted in Asian languages and may underrepresent this demographic group, assuming that the number of households speaking Asian languages at home and speaking English “less than very well” were similar to the Census Bureau’s 2014 American Community Survey data (8.6% in Porter Ranch and 4.6% in part of Granada Hills).8 According to the Southern California Gas Company, 4,547 households in Porter Ranch and 149 households in Granada Hills (all located in zip code 91344) were relocated as a result of the gas leak, representing 55.0% of the population within 3 miles of Well SS-25. Although 45.7% of households interviewed for the CASPER had been relocated as a result of the gas leak and interviews were able to be completed for 30 households where no one had yet returned home from relocation, the findings presented here slightly underrepresent the relocated population. More relocated households had at least one member under 5 years old compared to households that had not relocated, while more households that had not relocated had at least one member 65 years or older.

PAGE 10 OF 49
Los Angeles County Department of Public Health
http://publichealth.lacounty.gov
Health Symptoms and Healthcare Sought After the Well Was Sealed Several weeks after sealing Well SS-25, the majority (62.5%) of households in the communities closest to the well had at least one household member experiencing health symptoms, representing an estimated 4,801 households in the entire sampling frame. These findings indicate only a modest improvement from 81.3% of sampled households reporting any symptoms during the 16-week-long gas leak. The proportion of each reported symptom declined somewhat after the well was sealed, as compared to during the active gas leak; however, a large proportion still experienced symptoms after outdoor air levels for methane and other chemicals returned to background.9 The majority of households (60.8%) sought medical care for symptoms experienced after the well was sealed. This represents an estimated 2,917 households in the sampling frame seeking medical care, primarily from family doctors and urgent care centers. The actual number of households experiencing symptoms may be greater than what is estimated in this report since relocated households were more likely to experience symptoms than households that did not relocate (79.2% and 47.4%, respectively) but were less likely to be at home to be interviewed. Although the relocated households were more likely to experience symptoms, it is uncertain whether their symptoms were more severe than households that did not relocate, as they had a similar proportion that sought medical care. Continued symptoms after Well SS-25 was sealed may have several origins. Some residents may have ongoing exposures to pollutants from the oil field; some residents may have symptoms originating from or amplified by stress and/or social influences; some residents may have symptoms unrelated to exposure to pollutants; and some residents may exhibit a combination of any or all of these possibilities. This investigation could not be designed to determine the relative contribution of each of these possible etiologies. Although the leak from Well SS-25 was sealed, there may be other smaller, less detectable emissions from other areas of the field or from the soil surrounding the oil leak. Thus, there may be fugitive emissions or other as yet unidentified pollutants representing ongoing exposures from the gas field that require further study. Many of the symptoms reported by community members were non-specific and can be prevalent among the general population; therefore, they are challenging to interpret. The frequencies of reported symptoms seem to be higher than what would be expected in the general population. For example, headache was the most common symptom reported both during and after the gas leak. Headache is also the most prevalent neurological symptom and among the most frequent symptom seen in general medical practice, with an overall prevalence of 38% during any given year.10 Although there are limitations to this comparison because we asked households (not individuals) specifically about symptoms that were believed to be related to the gas leak in the time frame of one month after the well was sealed, the proportion of interviewed households reporting headache in the past month (51.9%) appears higher than what would be found in the general population. There were similar proportions of symptoms reported during the Aliso Canyon gas leak and another household-based investigation conducted in response to a storage tank leak of tert-butyl mercaptan near a community in Alabama. In both investigations, headache was the most commonly reported symptom.11 Nearly all of the symptoms were reported at similar frequencies, with a few notable exceptions; households near Aliso Canyon were much more likely to report dizziness, eye irritation, and nausea/vomiting than households in the Alabama community. The percentages were greater even though the Aliso Canyon investigation included households further from the source (up to 3 miles compared to less than 2 miles) and specifically asked about symptoms believed to be related to the gas leak as opposed to those linked to

PAGE 11 OF 49
Los Angeles County Department of Public Health
http://publichealth.lacounty.gov
any other known cause. Households near Aliso Canyon continued to report symptoms after the well was sealed and the reported mercaptan odors had very greatly decreased (see odor discussion, below), supporting the need to further investigate the ongoing symptoms and indoor environments. Higher prevalence of symptom reporting is expected in a community that has experienced environmental exposure because of increased stress, recall bias and heightened environmental worry. Households may be more likely to recall symptoms and exposure details due to this highly publicized gas-leak incident, leading to overestimation of symptoms and exposures to odors or oily residue. Both during and after the gas leak, 16.0% and 12.9% of households, respectively, attributed a fever to the gas leak, even though fever is not known to be related to such an exposure. It is also possible, however, that there could be continued exposure to materials emitted during the gas leak or other emissions from the facility. Anecdotal evidence from symptom reporting to DPH suggests that many households are reporting symptom onset after spending time inside their homes after the gas leak. In contrast, during the gas leak it was reported that symptoms were worse while outdoors. This supports the need for indoor environmental testing to determine if there is exposure related to the gas leak happening inside homes and to address the widespread concerns about such exposures. Odors and Oily Residue Although the gas leak has stopped, residual natural gas will continue to off gas from the ground in the weeks and months following the permanent sealing of Well SS-25.9 “Gas-like” odors were reported by 40.5% of sampled households during the month after the well was sealed and 30.6% of those households reported smelling odors both inside their home and outside their home or in the neighborhood. The reported odor findings are supported by complaints to the South Coast Air Quality Management District (SCAQMD), including 20 odor complaints from Porter Ranch residents and 6 reports from Granada Hills (zip code 91344) in the two weeks after the gas leak was sealed. No particular times of day for reported odors were noteworthy, and temporal correlations would not be expected if the potential sources of these odors were “flights” of off gassing as opposed to specific activities at the field occurring at cyclical times. In addition, it may be difficult for the interviewed member of the household to recall specific times of day without having kept odor diaries, nor to be able to report odor observations for all members of the household. Households less than 2 miles from the well were no more likely to report “gas-like” odors than households 2 to 3 miles from the well; however, all sampled households were within 3 miles from the well where there were the highest density of odor complaints to the SCAQMD.12 The prevailing wind direction is northeast for the Aliso Canyon area. The suspected source of these “gas-like” odors are mercaptans which are heavier than air and travel close to the ground from the source.3 Compared to households that did not smell odors, households that reported odors in the past month were 3.7 times more likely to report symptoms during the same time frame. Households closer to the well (less than 2 miles) were 1.9 times more likely to notice oily residue than households further away (2 to 3 miles from the well). Compared to households that did not notice oily residue, households that noticed oily residue were 3.9 times more likely to report symptoms after the well was sealed. While this assessment was not designed to evaluate a causal relationship between health effects and exposure to odors or oily residue, nearly all of the households that reported both odors and oily residue (94.7%) reported experiencing symptoms after the well was sealed. A statistically significant trend exists that suggests that smelling odors and observing oily residue increases the reporting of symptoms (ptrend<0.001).

PAGE 12 OF 49
Los Angeles County Department of Public Health
http://publichealth.lacounty.gov
Methods to Improve Indoor Air Quality The majority of households (66.0%) reported regular use of either in-duct air cleaning devices or portable air purifiers in the month after the well was sealed: 21.5% of households used them 1 to 6 days per week and 44.5% of households used them daily. During the month after the well was sealed, more households that regularly used devices to improve the indoor air quality in their homes reported experiencing symptoms (62.2 and 73.6%, respectively) compared to households that did not use any air cleaning devices (45.3%). Although this assessment could not determine whether households reporting symptoms were more likely to use air cleaning devices or whether the air cleaning devices themselves increased the reporting of symptoms, residents should be encouraged to check the filters and air cleaners at least monthly and to follow air cleaner manufacturer’s maintenance instructions per the California Air Resources Board’s recommendation.13 Regardless of whether in-duct air cleaning devices or portable air purifiers were used during the month after the well was sealed, regular use of these devices did not appear to affect whether any “gas-like” odors were reported nor did having additional weather-proofing materials provided by SCG. Although this assessment did not determine whether using air cleaning devices or weather proofing materials affected the frequency of symptoms or “gas-like” odors reported, the majority of households (68.4%) reported that using methods such as air cleaning devices to air out their home did help to reduce “gas-like” odors smelled inside their home. Further study is needed to evaluate whether airing out homes also reduces household symptom reporting. Activities of Relocated Households Upon Returning Home DPH has been advising residents who are returning home after relocation to air out the inside of their homes if they smell gas odors inside by opening doors and windows or using fans.14 Only 63.8% of relocated households reported airing out their home, reflecting a need for improved communication to residents. Many community members have expressed concerns and fears regarding opening windows and doors and it is important to address these concerns with very clear guidelines for airing out homes as more relocated households prepare to return home. Among relocated households that had cleaned in preparation to moving back or after returning home, one-fifth (22.0%) reported that at least one member of the household experienced health symptoms while their home was being cleaned or later that same day. Recommendations for relocated households should also include specific guidelines for cleaning upon returning home such as using high efficiency particulate air (HEPA) filter vacuum cleaners and providing good ventilation while cleaning. A low percentage of relocated households reported running all faucets (36.6%) and only 66.7% reported flushing all toilets in preparation to moving back or after returning home. Infrequent use of household plumbing when a home is vacant for a while may allow plumbing traps to dry up and sewer gas to enter the home.15 Since sewer gas can cause symptoms of headache, nausea, and eye, nose and throat irritation,16 advice to relocated households should include instructions to run all household plumbing upon returning home. Comments from the Field Several interview staff reported experiencing health symptoms during the CASPER, including throat irritation and wheezing among interviewers at households closest to the well, and exacerbation of asthma symptoms. Headaches and irritation-type symptoms were also reported among interviewers conducting interviews inside the homes of residents who had not returned home from relocation and had not

PAGE 13 OF 49
Los Angeles County Department of Public Health
http://publichealth.lacounty.gov
ventilated their homes; these symptoms improved shortly after the field teams left the sampled homes. One confidential referral was made to the Los Angeles County Department of Mental Health during recruitment for interviews.
PAGE 14 OF 49
Los Angeles County Department of Public Health
http://publichealth.lacounty.gov
SECTION V: Recommendations
On the basis of the CASPER findings, the following actions are recommended in addition to ongoing air monitoring of emissions from the natural gas storage facility and efforts to ensure the safety of workers and those living in the surrounding communities.
1. Conduct indoor testing of residential homes to determine if materials emitted during the gas leak are present in the home environment. DPH enlisted the assistance of the United States Environmental Protection Agency Indoor Air Quality program to develop an indoor environmental assessment protocol.
2. Study the nature of resurgent symptoms in the communities with the highest number of reported symptoms. DPH interviewed residents at households participating in the indoor environmental testing in order to further investigate the nature of these symptoms.
3. Prepare specific and detailed recommendations for airing out and cleaning homes, as well as any other necessary remediation steps such as changing of air filters based on the results of the indoor environmental study. Include additional advice for relocated households to flush all plumbing pipes upon returning home.
4. Ensure that communication and outreach strategies are culturally and linguistically appropriate for all members of the community. Specific outreach to the Korean speaking community is needed.
5. Encourage community members to report any symptoms experienced after ventilation and any recommended remediation in order to track any new or continued problems that develop.

PAGE 15 OF 49
Los Angeles County Department of Public Health
http://publichealth.lacounty.gov
Tables and Figures
PAGE 16 OF 49
Los Angeles County Department of Public Health
http://publichealth.lacounty.gov
Figure 1. Sampling frame for household survey conducted in response to the Aliso Canyon gas leak, Porter Ranch and Granada Hills, CA, March 2016.

PAGE 17 OF 49
Los Angeles County Department of Public Health
http://publichealth.lacounty.gov
Table 1. Questionnaire response rates for the household survey conducted in response to the Aliso Canyon gas leak, Porter Ranch and Granada Hills, CA, March 2016.
Questionnaire response Rates Percent
Completion* 210/210 100.0 Contact† 210/461 45.6 Cooperation‡ 210/286 73.4 * Percent of interviews completed in relation to the goal of 210 † Percent of interviews completed in relation to all households where contact was attempted ‡ Percent of interviews completed in relation to all households where an eligible participant answered the door

PAGE 18 OF 49
Los Angeles County Department of Public Health
http://publichealth.lacounty.gov
Table 2. Demographics, housing type and relocation status of households interviewed for survey conducted in response to the Aliso Canyon gas leak, Porter Ranch and Granada Hills, CA, March 2016.
Number of households
(n=210)
Projected number of households
(n=7,755)
Weighted % of households
(95% CI)
Household size 1 person 24 886 11.4 (5.9 – 16.9) 2 – 3 persons 115 4,247 54.8 (48.2 – 61.3) 4 or more persons 71 2,622 33.8 (26.6 – 41.0) Ages of persons in household 0 – 5 years 23 849 11.0 (7.6 – 14.3) 6 – 17 years 54 1,994 25.7 (19.1 – 32.2) 18 – 39 years 85 3,139 40.5 (34.2 – 46.8) 40 – 64 years 127 4,690 60.5 (52.5 – 68.5) 65 years and older 95 3,508 45.2 (36.8 – 53.7) Type of housing Single family detached home 175 6,463 83.3 (6.1 – 70.8) Attached home 12 443 5.7 (0.0 – 12.8) Multi-unit apartment or condo 23 849 11.0 (0.3 – 21.6) At least one household member relocated in response to the gas leak
96 3,545 45.7 (37.3 – 54.2)
Among those that relocated, has everyone returned back home?*
Yes, everyone 50 1,846 53.2 (40.9 – 65.5) Yes, some 14 517 14.9 (5.5 – 24.3) No, no one 30 1,108 31.9 (20.9 – 43.0) *Among households that chose to be relocated (n=96), excluding those that refused to answer whether anyone or everyone had returned back home (n=2).

PAGE 19 OF 49
Los Angeles County Department of Public Health
http://publichealth.lacounty.gov
Table 3. Households reporting that any member of the household experienced any of the following health symptoms believed to be related to the gas leak weighted to the entire sampling frame, Porter Ranch and Granada Hills, CA, March 2016.
During active gas leak After well was sealed
Number of households
(n=210)
Projected number of households (n=7,755)
Weighted % of households
(95% CI)
Number of households
(n=210)
Projected number of households (n=7,755)
Weighted % of households
(95% CI)
Any symptom(s) 170 6,278 81.3 (75.5 – 87.2) 130 4,801 62.5 (56.3 – 68.7) Eye, nose and/or throat irritation 153 5,650 73.9 (67.2 – 80.6) 123 4,542 59.1 (52.6 – 65.7) Headache/migraine 148 5,465 71.8 (65.3 – 78.4) 108 3,988 51.9 (45.0 – 58.9) Respiratory complaint* 138 5,096 67.0 (60.6 – 73.3) 105 3,878 50.7 (44.1 – 57.4) Stress 123 4,542 60.0 (52.4 – 67.6) 88 3,250 42.9 (36.1 – 49.8) Dizziness/light headedness 121 4,468 59.9 (53.1 – 66.7) 81 2,991 39.9 (33.5 – 46.3) Nausea/vomiting 112 4,136 54.4 (48.2 – 60.5) 83 3,065 40.7 (34.3 – 47.0) Nosebleed(s) 97 3,582 46.9 (40.2 – 53.6) 64 2,363 30.9 (24.4 – 37.4) Skin rash/irritated skin 95 3,508 46.1 (38.6 – 53.6) 76 2,807 37.3 (31.0 – 43.5) Diarrhea 55 2,031 27.0 (21.1 – 32.8) 44 1,625 21.7 (15.5 – 27.8) Fever 32 1,182 16.0 (10.7 – 21.3) 26 960 12.9 (8.7 – 17.1) Note: Excluded missing during gas leak: any symptom (n=1); eye, nose and/or throat irritation (n=1); headache/migraine (n=1); respiratory (n=1); stress (n=1); dizziness (n=2); nausea/vomiting (n=2); nosebleeds (n=1); diarrhea (n=2); fever (n=3) and don’t know: eye, nose and/or throat irritation (n=2); headache/migraine (n=3); respiratory (n=3); stress (n=4); dizziness (n=6); nausea/vomiting (n=2); nosebleeds (n=2); skin (n=3); diarrhea (n=4); fever (n=7). Excluded missing after leak: nausea/vomiting (n=1); and don’t know: any symptom (n=2); eye, nose and/or throat irritation (n=2); headache/migraine (n=2); respiratory (n=3); stress (n=5); dizziness (n=7); nausea/vomiting (n=5); nosebleeds (n=3); skin (n=6); diarrhea (n=8); fever (n=8). * Includes symptoms such as shortness of breath/difficulty breathing, chest tightness or heaviness, cough, wheezing, worsening of asthma or worsening of emphysema/chronic obstructive pulmonary disease (known as COPD).

PAGE 20 OF 49
Los Angeles County Department of Public Health
http://publichealth.lacounty.gov
Table 4. Proportion of sampled households that reported that symptoms got better when away from home or away from the area, Porter Ranch or Granada Hills, CA, March 2016.
During active gas leak After well was sealed
Among households with any of the following symptoms, did the symptom get better when away from home or away from the area?*
Number of households
(Unweighted %)
Number of households
(Unweighted %)
Eye, nose and/or throat irritation n=153 n=123 Yes 130 (87.2) 100 (83.3) No 10 (6.7) 6 (5.0) Don’t know 9 (6.0) 14 (11.7)
Headache/migraine n=148 n=108 Yes 126 (88.7) 93 (87.7) No 8 (5.6) 4 (3.8) Don’t know 8 (5.6) 9 (8.5)
Respiratory complaint† n=138 n=105 Yes 116 (87.2) 87 (84.5) No 10 (7.5) 7 (6.8) Don’t know 7 (5.3) 9 (8.7)
Stress n=123 n=88 Yes 82 (70.1) 54 (63.5) No 25 (21.4) 21 (24.7) Don’t know 10 (8.5) 10 (11.8)
Dizziness/light headedness n=121 n=81 Yes 99 (86.1) 67 (84.8) No 6 (5.2) 5 (6.3) Don’t know 10 (8.7) 7 (8.9)
Nausea/vomiting n=112 n=83 Yes 94 (85.5) 62 (77.5) No 7 (6.4) 6 (7.5) Don’t know 9 (8.2) 12 (15.0)

PAGE 21 OF 49
Los Angeles County Department of Public Health
http://publichealth.lacounty.gov
Table 4 Continued. Proportion of sampled households that reported that symptoms got better when away from home or away from the area, Porter Ranch or Granada Hills, CA, March 2016.
During active gas leak After well was sealed
Among households with any of the following symptoms, did the symptom get better when away from home or away from the area?*
Number of households*
(Unweighted %)
Number of households*
(Unweighted %)
Nosebleed(s) n=97 n=64 Yes 85 (90.4) 48 (80.0) No 7 (7.4) 6 (10.0) Don’t know 2 (2.1) 6 (10.0)
Skin rash/irritated skin n=95 n=76 Yes 70 (76.1) 51 (68.0) No 14 (15.2) 8 (10.7) Don’t know 8 (8.7) 16 (21.3)
Diarrhea n=55 n=44 Yes 42 (77.8) 31 (73.8) No 4 (7.4) 5 (5.1) Don’t know 8 (14.8) 6 (5.5)
Fever n=32 n=26 Yes 24 (77.4) 20 (83.3) No 3 (9.7) 0 (0.0) Don’t know 4 (12.9) 4 (16.7) Note: Missing information regarding whether the symptom got better was excluded; therefore, the sum of these numbers may not equal the total number of households that reporting the symptom (eye, nose and/or throat irritation (n=4 during gas leak, n=3 after); headache/migraine (n=6 during; n=2 after); respiratory complaint (n=1 during; n=2 after); stress (n=6 during; n=3 after); dizziness/light headedness (n=6 during; n=2 after); nausea/vomiting (n=2 during; n=3 after); nosebleeds (n=3 during; n=4 after); skin rash/irritated skin (n=3 during; n=1 after); diarrhea (n=1 during; n=2 after); fever (n=1 during; n=2 after). * Away from home (e.g. at work, school, or relocated housing) or away from their local residential area (e.g. Porter Ranch or Granada Hills) † Includes symptoms such as shortness of breath/difficulty breathing, chest tightness or heaviness, cough, wheezing, worsening of asthma or worsening of emphysema/chronic obstructive pulmonary disease (known as COPD).

PAGE 22 OF 49
Los Angeles County Department of Public Health
http://publichealth.lacounty.gov
Table 5. Households reporting that any member of the household had experienced any of the following health symptoms believed to be related to the gas leak by distance to the well, Porter Ranch and Granada Hills, CA, March 2016.
During active gas leak After well was sealed
< 2 Miles
(n=63) 2 – 3 Miles
(n=147) < 2 Miles
(n=63) 2 – 3 Miles
(n=147)
Number of households
(Unweighted %)
Number of households
(Unweighted %)
Number of households
(Unweighted %)
Number of households
(Unweighted %)
Any symptom(s) 56 (90.3) 114 (77.6) 42 (67.7) 88 (60.3) Eye, nose and/or throat irritation 49 (80.3) 104 (71.2) 41 (66.1) 82 (56.2) Headache/migraine 53 (86.9) 95 (65.5) 36 (58.1) 72 (49.3) Respiratory complaint* 48 (80.0) 90 (61.6) 40 (64.5) 65 (44.8) Stress 43 (70.5) 80 (55.6) 30 (48.4) 58 (40.6) Dizziness/light headedness 43 (72.9) 78 (54.5) 25 (41.7) 56 (39.2) Nausea/vomiting 41 (67.2) 71 (49.0) 26 (43.3) 57 (39.6) Nosebleed(s) 33 (55.0) 64 (43.5) 21 (33.9) 43 (29.7) Skin rash/irritated skin 35 (58.3) 60 (41.1) 29 (48.3) 47 (32.6) Diarrhea 18 (30.0) 37 (25.7) 11 (18.3) 33 (23.1) Fever 12 (21.1) 20 (14.0) 10 (17.2) 16 (11.1) Note: Excluded missing during gas leak: any symptom (n=1); eye, nose and/or throat irritation (n=1); headache/migraine (n=1); respiratory (n=1); stress (n=1); dizziness (n=2); nausea/vomiting (n=2); nosebleeds (n=1); diarrhea (n=2); fever (n=3) and don’t know: eye, nose and/or throat irritation (n=2); headache/migraine (n=3); respiratory (n=3); stress (n=4); dizziness (n=6); nausea/vomiting (n=2); nosebleeds (n=2); skin (n=3); diarrhea (n=4); fever (n=7). Excluded missing after leak: nausea/vomiting (n=1); and don’t know: any symptom (n=2); eye, nose and/or throat irritation (n=2); headache/migraine (n=2); respiratory (n=3); stress (n=5); dizziness (n=7); nausea/vomiting (n=5); nosebleeds (n=3); skin (n=6); diarrhea (n=8); fever (n=8). * Includes symptoms such as shortness of breath/difficulty breathing, chest tightness or heaviness, cough, wheezing, worsening of asthma or worsening of emphysema/chronic obstructive pulmonary disease (known as COPD).

PAGE 23 OF 49
Los Angeles County Department of Public Health
http://publichealth.lacounty.gov
Table 6. Medical care sought by households reporting symptoms in the past month believed to be related to the gas leak weighted to the entire sampling frame, Porter Ranch and Granada Hills, CA, March 2016.
Number of households
(n=130)
Projected number of households
(n=4,801)
Weighted % of households
(95% CI)
In the past month, did you or any member of your household seek medical care for symptoms related to the gas leak?*
Yes 79 2,917 60.8 (53.1 – 68.5) No 48 1,773 36.9 (28.7 – 45.1) Don’t know 3 – – If yes, where did you seek care?† Emergency room or hospital 14 517 17.7 (7.2 – 28.3) Family doctor or urgent care 71 2,622 89.9 (82.7 – 97.1) Specialist or other type of care 23 849 29.1 (19.4 – 38.8) --- Data based on small numbers (n<10) may be unstable; therefore, weighted estimates are not presented. * Among households that reported any household member experienced any symptoms in the past month thought to be caused by or related to the gas leak (n=130) † Households could report seeking care at more than one place; therefore, the sum of these numbers exceed the total number of households that sought medical care (n=79).

PAGE 24 OF 49
Los Angeles County Department of Public Health
http://publichealth.lacounty.gov
Table 7. Odors and oily residue weighted to the entire sampling frame, Porter Ranch and Granada Hills, CA, March 2016.
Number of households
(n=210)
Projected number of households
(n=7,755)
Weighted % of households
(95% CI)
During the past month, did you or any member of your household smell “gas-like” odors?
Yes 85 3,139 40.5 (34.2 – 46.8) No 116 4,284 55.2 (49.3 – 61.1) Don’t know 9 – – If yes, where did you smell “gas-like” odors?* Inside home only 22 812 25.9 (15.6 – 36.2) Outside (home or in neighborhood) only 37 1,366 43.5 (33.7 – 53.4) Both inside and outside 26 960 30.6 (21.5 – 39.7) For “gas-like” odors smelled
inside, did airing out the home help to reduce the odors?†
Yes 26 960 68.4 (50.6 – 86.3) No 4 – – Don’t know 8 – – Did you or any member of your household notice the appearance of oily residue?
Yes 73 2,696 34.8 (26.6 – 42.9) No 111 4,099 52.9 (43.9 – 61.8) Don’t know 26 960 12.4 (8.0 – 16.8) --- Data based on small numbers (n<10) may be unstable; therefore, weighted estimates are not presented. * Among households that reported smelling odors (n=85). † Among households that reported smelling odors inside their home (n=48) and reported using methods such as running the central air conditioning system, opening windows and doors, using portable air purifiers, or using fans to try to reduce the odors inside the home (n=38). Households missing information about whether they used any methods to air out the home were excluded (n=10).

PAGE 25 OF 49
Los Angeles County Department of Public Health
http://publichealth.lacounty.gov
Table 8. Proportion of sampled households during the past month reporting any of the following health symptoms believed to be related to the gas leak by whether they smelled odors, Porter Ranch and Granada Hills, CA, March 2016.
During the past month, did you or any member of your household smell “gas-like”
odors?
Yes
(n=85) No
(n=114)
Number of households
(Unweighted %)
Number of households
(Unweighted %)
Any symptom(s) 67 (78.8) 57 (50.0) Eye, nose and/or throat irritation 64 (75.3) 53 (46.5) Headache/migraine 60 (70.6) 42 (36.8) Respiratory complaint* 57 (67.9) 42 (36.8) Stress 46 (54.8) 36 (32.1) Dizziness/light headedness 49 (57.6) 27 (24.5) Nausea/vomiting 44 (51.8) 33 (30.0) Nosebleed(s) 40 (47.1) 20 (17.7) Skin rash/irritated skin 41 (50.0) 30 (26.5) Diarrhea 29 (35.4) 12 (10.7) Fever 13 (15.5) 10 (9.2) Note: Missing values were excluded for nausea/vomiting (n=1); diarrhea (n=1). Reports of don’t know were excluded for any symptom (n=2), plus respiratory (n=1); stress (n=3); dizziness (n=5); nausea/vomiting (n=3); nosebleeds (n=1); skin (n=4); diarrhea (n=4); fever (n=6); and smelling odors (n=9). * Includes symptoms such as shortness of breath/difficulty breathing, chest tightness or heaviness, cough, wheezing, worsening of asthma or worsening of emphysema/chronic obstructive pulmonary disease (known as COPD).

PAGE 26 OF 49
Los Angeles County Department of Public Health
http://publichealth.lacounty.gov
Table 9. Odors and oily residue by distance to the well, Porter Ranch and Granada Hills, CA, March 2016.
< 2 Miles (n=63)
2 – 3 Miles (n=147)
Number of households
(Unweighted %)
Number of households
(Unweighted %)
During the past month, did you or any member of your household smell “gas-like” odors?
Yes 23 (36.5) 62 (42.2) No 36 (57.1) 80 (54.4) Don’t know 4 (6.3) 5 (3.4) If yes, where did you smell “gas-like” odors?* Inside home only 8 (34.8) 14 (22.6) Outside (home or in neighborhood) only 8 (34.8) 29 (46.8) Both inside and outside 7 (30.4) 19 (30.6) Appearance of oily residue noticed during or after gas leak
Yes 34 (54.0) 39 (26.5) No 21 (33.3) 90 (61.2) Don’t know 8 (12.7) 18 (12.2) * Among households that reported smelling odors: < 2 miles (n=23); 2-3 miles (n=62).
PAGE 27 OF 49
Los Angeles County Department of Public Health
http://publichealth.lacounty.gov
Table 10. Proportion of sampled households during the past month reporting any health symptoms believed to be related to the gas leak and whether they smelled odors and/or noticed oily residue, Porter Ranch and Granada Hills, CA, March 2016.
During the past month, did you or any member of your household smell “gas-like” odors or notice the appearance of oily residue?
Number of households
(n=210)
Number of households reporting any symptoms,
n=130 (Unweighted %)
No 70 30 (42.9) Odors only 34 20 (58.8) Oily residue only 33 20 (60.6) Both odors and oily residue 38 36 (94.7) Don’t know to odors and/or oily residue 33 24 (72.7) Note: Missing values were excluded for missing any symptoms among no odors/oily residue (n=1) and oily residue only (n=1).
PAGE 28 OF 49
Los Angeles County Department of Public Health
http://publichealth.lacounty.gov
Table 11. Devices used to improve indoor air quality weighted to the entire sampling frame, Porter Ranch and Granada Hills, CA, March 2016.
Number of households
(n=210)
Projected number of households
(n=7,755)
Weighted % of households
(95% CI)
Ever used in-duct air cleaning device or portable air purifier(s)?*
In-duct air cleaning device only 51 1,883 24.3 (18.0 – 30.6) Portable air purifier(s) only 45 1,662 21.4 (14.6 – 28.3) In-duct device and portable air purifier(s) 60 2,216 28.6 (21.4 – 35.7) None 49 1,810 23.3 (16.0 – 30.7) Don’t know† 5 – – In the past month, how often do you run the in-duct system or portable air purifier(s)?‡
Daily 93 3,434 44.5 (37.6 – 51.4) 1 – 6 days per week 45 1,662 21.5 (14.6 – 28.5) Never§ 64 2,363 30.6 (23.1 – 38.1) Don’t know 7 – – SCG provided weather-proofing materials to seal gaps that allow air to enter home
89 3,287 42.8 (35.3 – 50.3)
--- Data based on small numbers (n<10) may be unstable; therefore, weighted estimates are not presented. * An in-duct air cleaning system is built into or attached to part of a home’s central heating/air conditioning/ventilation system. † Includes households that responded don’t know to ever used an in-duct air cleaning device and to ever used portable air purifiers (n=3), plus households that responded don’t know to ever used an in-duct air cleaning device but responded yes to using portable air purifiers (n=2). ‡ Among households that used portable air purifiers (n=107), the frequency of use was specified for the portable air purifier that the household used most often. § Includes households that reported not having ever used an in-duct air cleaning device or portable air purifiers (n=49) and households that had ever used them but reported not using them in the past month (n=15).

PAGE 29 OF 49
Los Angeles County Department of Public Health
http://publichealth.lacounty.gov
Table 12. Activities of relocated households* as they prepare to moving back home or after returning home weighted to the entire sampling frame, Porter Ranch and Granada Hills, CA, March 2016.
In preparation to moving back home or after returning home…
Number of households
(n=96)
Projected number of households
(n=4,201)
Weighted % of households
(95% CI)
Was your home aired out for at least 2 hours or cleaned?† Aired out only 14 517 14.9 (8.4 – 21.4) Cleaned only 13 480 13.8 (6.0 – 21.7) Aired out and cleaned 46 1,699 48.9 (41.4 – 56.4) None 17 628 18.1 (10.4 – 25.8) Don’t know 4 – –
Among those that had their home cleaned, did anyone experience symptoms while home was being cleaned or later that same day?‡
Yes 13 480 22.0 (12.7 – 31.4) No 37 1,366 62.7 (52.6 – 72.8) Don’t know 9 – –
Have faucets in the home been run for at least 60 seconds?§ Yes, all 34 1,256 36.6 (26.0 – 47.1) Yes, some 37 1,366 39.8 (26.5 – 53.1) No 19 702 20.4 (12.4 – 28.5) Don’t know 3 – –
Have toilets in the home been flushed at least once? Yes, all 62 2,290 66.7 (56.7 – 76.6) Yes, some 20 739 21.5 (12.8 – 30.2) No 10 369 10.8 (3.4 – 18.1) Don’t know 1 – – --- Data based on small numbers (n<10) may be unstable; therefore, weighted estimates are not presented. * Among households that ever relocated temporarily in response to the gas leak (n=96). † Households missing information about whether they aired out or cleaned their homes were excluded (n=2). ‡ Among households that reported that their homes had been cleaned (n=59). § Households missing information about whether faucets were run were excluded (n=3). £ Households missing information about whether toilets were flushed were excluded (n=3).

PAGE 30 OF 49
Los Angeles County Department of Public Health
http://publichealth.lacounty.gov
Table 13. Households’ greatest need weighted to the entire sampling frame, Porter Ranch and Granada Hills, CA, March 2016.
Number of households
(n=210)*
Projected number of households
(n=7,755)
Weighted % of households
(95% CI)
Nothing 54 1,994 25.7 (19.5 – 31.9) To have home and property cleaned, including oily residue 28 1,034 13.3 (7.1 – 19.6) Solutions to the decline in property values 23 849 11.0 (6.4 – 15.5) Assurance that the gas leak and similar incidents will not happen again
20 739 9.5 (5.0 – 14.0)
Testing for pollutants inside homes and to ensure that homes are safe
19 702 9.0 (4.7 – 13.4)
Follow-up for health risks in the future 16 591 7.6 (3.5 – 11.8) Recovery from current health symptoms 13 480 6.2 (3.2 – 9.2) Air purifiers or weather stripping from SCG 12 443 5.7 (1.9 – 9.6) Honest information about the gas leak 10 369 4.8 (1.5 – 8.0) Clean air 9 – – Reimbursement for relocation expenses 8 – – Return to “normal life” after relocation, particularly for local schools
7 – –
Safe water in swimming pools and for drinking 6 – – --- Data based on small numbers (n<10) may be unstable; therefore, weighted number of households are not presented. * Households could report more than one greatest need; therefore, the sum of these numbers exceed the total number of households interviewed (n=210).

PAGE 31 OF 49
Los Angeles County Department of Public Health
http://publichealth.lacounty.gov
References
1. South Coast Air Quality Management District. Fact Sheet: Aliso Canyon Gas Leak Health Impacts.
Revised January 29, 2016. http://www.aqmd.gov/docs/default-source/compliance/aliso-cyn/fact-sheet-aliso-canyon-health-impacts.pdf?sfvrsn=4
2. California Environmental Protection Agency. Office of Environmental Health Hazard Assessment. http://oehha.ca.gov/public_info/emergency/alisocanyon.html. Last updated January 28, 2016. Accessed March 4, 2016.
3. Agency for Toxic Substances and Disease Control. Methyl Mercaptan (CH3SH) CAS 74-93; UN 1064. http://www.atsdr.cdc.gov/MHMI/mmg139.pdf.
4. Community Assessment for Public Health Emergency Response. Centers for Disease Control and Prevention. http://www.cdc.gov/nceh/hsb/disaster/casper. Last updated February 17, 2016. Accessed March 14, 2016.
5. Centers for Disease Control and Prevention. Community Assessment for Public Health Emergency
Response (CASPER) Toolkit: Second edition. Atlanta, GA: CDC; 2012. http://emergency.cdc.gov/disasters/surveillance/pdf/casper_toolkit_version_2_0_508_ compliant. pdf.
6. Tool developed by Centers for Disease Control (CDC) and Geospatial Research, Analysis and Services
Program at the Agency for Toxic Substances and Disease Registry and provided by CDC/National Center for Environmental Health staff, personal communication to California Department of Public Health, September 2012.
7. U.S. Census Bureau. 2010 Census Demographic Profile Data. Profile of General Population and
Housing Characteristics: 2010. Geography: Zip Code Tabulation Areas 91326 and 91344. http://factfinder.census.gov/faces/nav/jsf/pages/community_ facts.xhtml. Accessed April 28, 2016.
8. U.S. Census Bureau. 2010-2014 American Community Survey 5-Year Estimates. Selected Social
Characteristics in the United States. Geography: Zip Code Tabulation Areas 91326 and 91344. http://factfinder.census.gov/faces/nav/jsf/pages/community_ facts.xhtml. Accessed April 28, 2016.
9. California Environmental Protection Agency. California Air Resources Board. Aliso Canyon Natural
Gas Leak Preliminary Estimate of Greenhouse Gas Emissions (As of March 08, 2016). http://www.arb.ca.gov/research/aliso_canyon/aliso_canyon_natural_gas_leak_ updates-sa_flights_thru_March_8_2016.pdf.
10. Schwartz BS, et al. Epidemiology of tension-type headache. JAMA, 1998; 279(5):381-383.
PAGE 32 OF 49
Los Angeles County Department of Public Health
http://publichealth.lacounty.gov
11. Behbod B, Parker EM, Jones EA et al. Community Health Assessment Following Mercaptan Spill,
Eight Mile, Mobile County, Alabama. 2012. Alabama Department of Public Health.
http://www.adph.org/tox/assets/Eight_Mile_Mercaptan.pdf
12. South Coast Air Quality Management District. Aliso Canyon Sampling Locations and Complaint Distribution. http://www.aqmd.gov/docs/default-source/compliance/aliso-cyn/porterranch complaints_02_17_16.pdf?sfvrsn=2. Last updated February 17, 2016. Accessed March 1, 2016.
13. California Environmental Protection Agency. California Air Resources Board. Air Cleaners for
Removal of Odorous Compounds Associated with the Aliso Canyon Natural Gas Leak, http://www.arb.ca.gov/research/indoor/aircleaners/air_cleaners_gas_leak.htm. Last updated April 13, 2016. Accessed April 30, 2016.
14. Los Angeles County Department of Public Health. Returning Home After the Aliso Canyon Gas Leak. http://www.publichealth.lacounty.gov/media/docs/AlisoReturning.pdf. February 5, 2016.
15. Centers for Disease Control and Prevention, U.S. Department of Housing and Urban Development.
Healthy Housing Reference Manual. Atlanta: U.S. Department of Health and Human Services; 2006. http://www.cdc.gov/nceh/publications/books/housing/housing_ref_manual _2012.pdf.
16. Agency for Toxic Substances and Disease Registry. Toxic Substances Portal – Hydrogen Sulfide. CAS#
7783-060-4; UN 1053. http://www.atsdr.cdc.gov/mmg/mmg.asp?id=385&tid=67. Last updated October 21, 2014. Accessed March 5, 2016.

PAGE 33 OF 49
Los Angeles County Department of Public Health
http://publichealth.lacounty.gov
Appendix A (Verbal Consent, Resource List and Referral Forms)

PAGE 34 OF 49
Los Angeles County Department of Public Health
http://publichealth.lacounty.gov
Consent Script
Community Assessment for Public Health Emergency Response
Good morning/afternoon sir/madam, my name is ______________ and this is _____________. We are
with the _______ County Public Health and the California Department of Public Health. We are talking
to randomly selected households about their experiences regarding the Aliso Canyon gas leak incident.
We are talking to residents about how the Aliso Canyon gas leak incident has affected them and
how they are doing now that the well has been permanently sealed.
We want to get an idea of how the county can better serve residents that have been affected by
the gas leak incident.
Your house is one of 210 that has been randomly chosen to be in this survey.
If you agree to participate, we will not ask you any personal questions such as those about your
job, education, or place of birth. All the questions are about your entire household.
The survey should take approximately 25 minutes to complete. Your answers will be kept
private, and you can refuse to take part in the survey or refuse to answer any of the questions.
Nothing will happen to you or your household if you choose not to take part in the survey.
We also have some information we would like to leave with you from the County that may be of
interest to you and your household.
If you have any questions about this survey you can ask anyone here right now. If you would like to
confirm that we were sent by the Los Angeles County Department of Public Health, you can call 213-
738-3220.
[SURVEYOR: WAIT FOR RESPONDENT TO CLEARLY ANSWER YES OR NO after each
question below]
1. Would you like to participate in this survey?
2. Do you live in this home?
If “NO” Is there someone else who lives in this home that we can speak to?
3. Are you at least 18 years or older? s
If “NO” Is there someone else who lives in this home that we can speak to?
[CONDUCT INTERVIEW IF RESPONDENT ANSWERED YES TO ALL THREE
QUESTIONS]
[IF NOT, tell them: Thank you very much for your time.]
PAGE 35 OF 49
Los Angeles County Department of Public Health
http://publichealth.lacounty.gov
Aliso Canyon Gas Leak Resources
Department of Public Health: Report Health Symptoms, Health Information, Assessment Activities
www.publichealth.lacounty.gov/media/gasleak/
213-738-3220
Public Health Vet
http://publichealth.lacounty.gov/vet/Aliso_leak.htm
213-989-7060
Local Assistance Center: Department of Public Health is staffing this center:
Location: Mason Recreation Center, Youth Center Building - 10520 Mason Avenue, Chatsworth 91311
Thursday & Friday Hours: Open from 10 a.m. to 8 p.m.
Saturday Hours: Open from 10 a.m. to 3 p.m.
Closed Sunday through Wednesday
Air Quality Management District: Report Odors, Air Monitoring Data and Criteria, Infrared Imaging
www.aqmd.gov/home/regulations/compliance/aliso-canyon-update
1-800-CUT-SMOG
California Air Resources Board: Air Monitoring Data and Criteria, Infrared Imaging of Well
www.arb.ca.gov/research/aliso_canyon_natural_gas_leak.htm
1-800-242-4450
Office of Environmental Health and Hazard Assessment: Evaluation of Health Concerns,
Independent Scientific Expert Panel, Evaluation of Air Quality Criteria for Aliso Canyon
www.oehha.ca.gov/public_info/emergency/alisocanyon.html
California Public Utilities Commission: Regulatory activities, investigation and inquiries to determine
cause of the leak
www.cpuc.ca.gov/aliso/
Division of Oil, Gas and geothermal Resources: Regulatory activities
www.conservation.ca.gov/dog/Pages/AlisoCanyon.aspx
Southern California Gas Company
www.alisoupdates.com
Aliso Hotline: 818-435-7707
Expense Reimbursement: 213-244-5151
Oily Residue Cleaning: 818-435-7707, [email protected]

PAGE 36 OF 49
Los Angeles County Department of Public Health
http://publichealth.lacounty.gov
Community Assessment for Public Health Emergency Response
Confidential Referral Form
Date:___/___/___ Time:___:___
Cluster No: ________
Interviewer’s Initials: ________
Name: _____________________________________
Address: ___________________________________
Contact information:
Home telephone: ____-____-______
Cell phone: ____-____-______
Email:_______________________________
Summary of Need:
____________________________________________________________________________________
____________________________________________________________________________________
____________________________________________________________________________________
____________________________________________________________________________________
____________________________________________________________________________________
____________________________________________________________________________________
____________________________________________________________________________________
Referral Made: Yes No
Referral to: ________________________________________

PAGE 37 OF 49
Los Angeles County Department of Public Health
http://publichealth.lacounty.gov
Appendix B (Questionnaire)
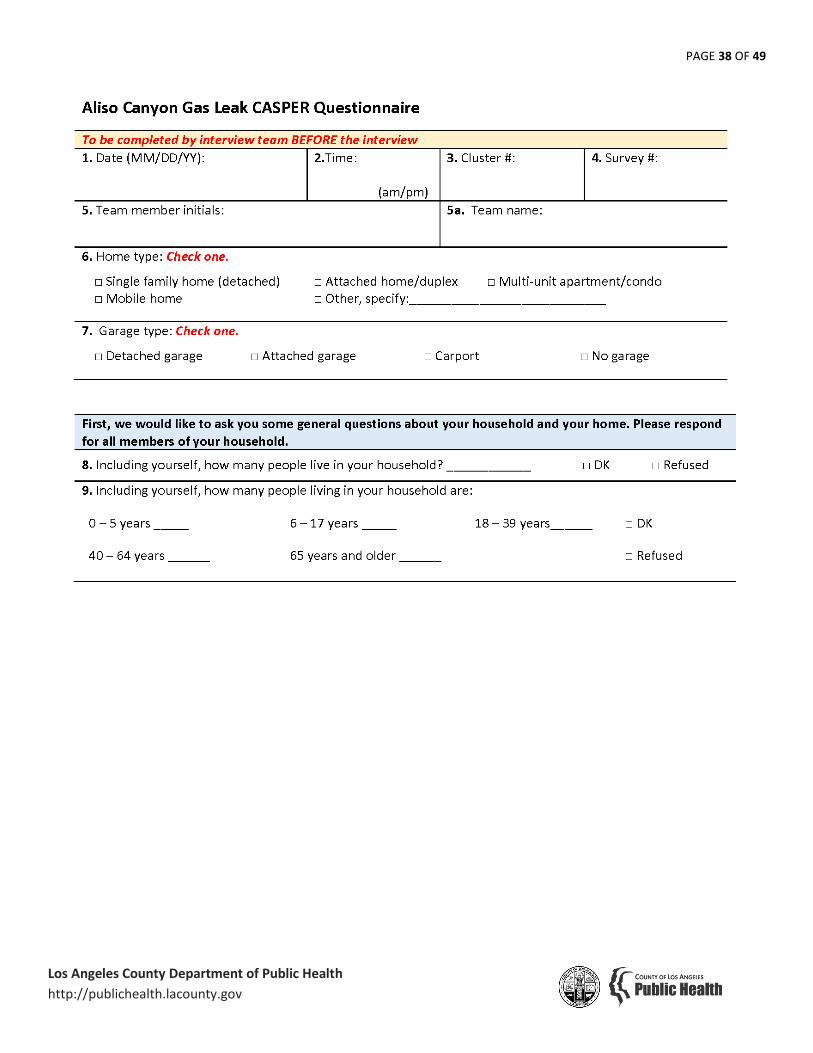
PAGE 38 OF 49
Los Angeles County Department of Public Health
http://publichealth.lacounty.gov

PAGE 39 OF 49
Los Angeles County Department of Public Health
http://publichealth.lacounty.gov

PAGE 40 OF 49
Los Angeles County Department of Public Health
http://publichealth.lacounty.gov

PAGE 41 OF 49
Los Angeles County Department of Public Health
http://publichealth.lacounty.gov

PAGE 42 OF 49
Los Angeles County Department of Public Health
http://publichealth.lacounty.gov

PAGE 43 OF 49
Los Angeles County Department of Public Health
http://publichealth.lacounty.gov

PAGE 44 OF 49
Los Angeles County Department of Public Health
http://publichealth.lacounty.gov

PAGE 45 OF 49
Los Angeles County Department of Public Health
http://publichealth.lacounty.gov