Baseline Public Opinion Research November 2008. Figure 1 Overwhelming Support for Poverty Reduction...
18
Baseline Public Opinion Research November 2008
-
Upload
sheena-hampton -
Category
Documents
-
view
213 -
download
0
Transcript of Baseline Public Opinion Research November 2008. Figure 1 Overwhelming Support for Poverty Reduction...

Baseline Public Opinion ResearchNovember 2008

Figure 2
13 11
76
0
20
40
60
80
Overwhelming Support for Poverty Reduction Goal
No Significant Difference Between Split Samples
Half in Ten Baseline Survey – November 2008
Support
Would you support or oppose the next President and Congress setting a national goal to cut poverty in the United States in half within ten years (and strengthen the middle class)?
Oppose Don’t know/Refused

Figure 3
59
2128
14 13
64
0
25
50
75
100
Majority Remain Supportive Despite Challenges on Cost to Businesses, Tax &
Spend
Half in Ten Baseline Survey – November 2008
Would you still support a national goal to cut poverty in the United States in half within ten years (and strengthen the
middle class) if it required businesses to pay their workers higher wages or contribute more
for benefits like health care?
Would you still support a national goal to cut poverty in the United States in half within ten years and (strengthen the
middle class) if it required higher taxes for the wealthy and new
government spending?
Support Oppose Don’t know/Refused
Support Oppose Don’t know/Refused
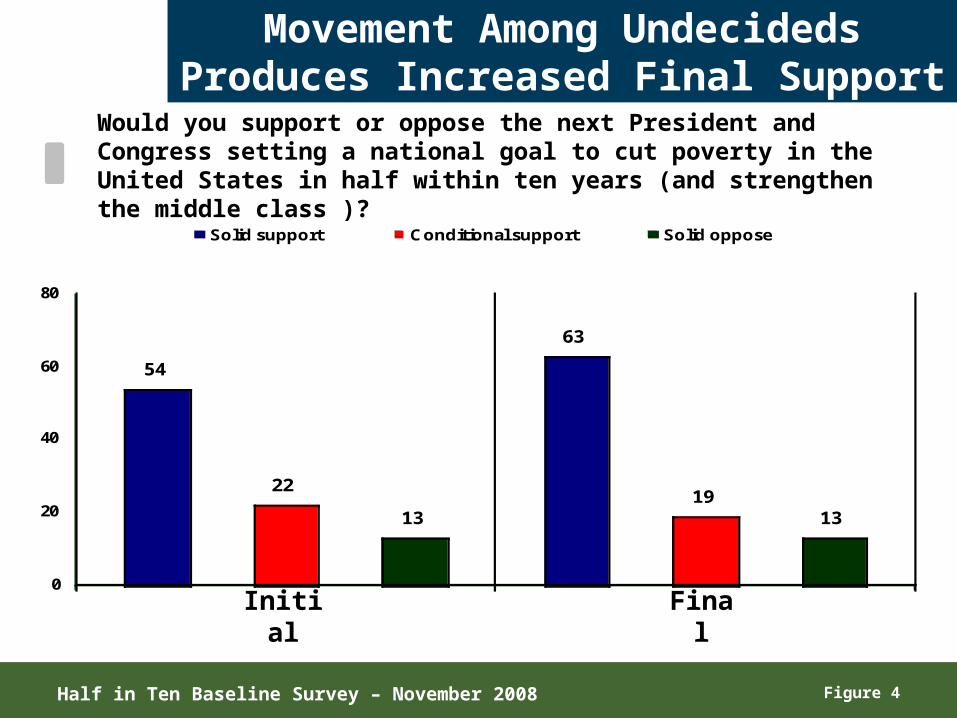
Figure 4
63
2219
13 13
54
0
20
40
60
80
Solid support Conditional support Solid oppose
Movement Among Undecideds Produces Increased Final
Support
Half in Ten Baseline Survey – November 2008
Initial Final
Would you support or oppose the next President and Congress setting a national goal to cut poverty in the United States in half within ten years (and strengthen the middle class )?

Figure 5
7
22117
0
25
50
75
100
Excellent Good Poor Just fair
Declining Ratings of Personal Finances*
42
How would you rate your financial situation today?
57
50 49
Half in Ten Baseline Survey – November 2008
*Findings from 2001 NPR/Kaiser/Kennedy School Poll, conducted January 4-February 27, 2001 of 1,952 randomly selected respondents
2008 2001*
-15 +1

Figure 6
23
28
33
32
40
32
37
40
40
48
0 20 40 60
Having too little money tobuy enough food
Falling behind in your rentor mortgage payments
Falling behind in your gas,electric or phone bills
Being unable to get medicalcare because of the cost
Having trouble paying thecredit card balance
Yes: 2008
Yes: 2001*
Financial diffLittle Support for Connor…Financial Difficulties Growing
Significant Increase in Every Measure Tested
In the past year, have you or someone in your family had a SERIOUS problem with any of the following?
Half in Ten Baseline Survey – November 2008
*Findings from 2001 NPR/Kaiser/Kennedy School Poll, conducted January 4-February 27, 2001 of 1,952 randomly selected respondents

Figure 7
Growing Personal Connectionto Poverty
Thinking about your own family – both your immediate family living here and your other close relatives like aunts, uncles, cousins, and so on – as far as you know, is anyone in your family poor?
Half in Ten Baseline Survey – November 2008
*Findings from 2001 NPR/Kaiser/Kennedy School Poll, conducted January 4-February 27, 2001 of 1,952 randomly selected respondents
2001*2008
+5 -27

Figure 8
19
14
9
11
5
9
8
9
6
0 5 10 15 20 25
<7%
8-15%
16-20%
21-25%
26-30%
31-35%
36-40%
41-50%
>51%
Percent poor Little Support for Connor…Percentage Poor in America
Public Believes Poverty Rate Much Higher Than Official Count
Mean: 29%
Half in Ten Baseline Survey – November 2008

Figure 9
Poverty Touches the Middle Class
Half in Ten Baseline Survey – November 2008
Much more
Total
The negative consequences of poverty affect all of us. 51 77
OR
The negative consequences of poverty affect mostly those living in poor neighborhoods.
10 19
Poor families share a lot of economic needs and priorities with middle class families.
24 59
OR
Poor families have different economic needs and priorities than middle class families.
19 36
Policies that help poor families also help to make middle class families more secure.
23 49
ORPolicies that help poor families don't do much to help middle class families.
21 42

Figure 10
29 23 1830 25 2222
1222 26
1420
0
25
50
75
100
1st Statement much more 1st Statement somewhat more
2nd Statement much more 2nd Statement somewhat more
Broad Partisan / Ideological Agreement on Shared Economic
Needs
37
Democrat
57 62
37
Half in Ten Baseline Survey – November 2008
58
3339
58
40
29
6258
Poor families share a lot of economic needs and priorities with middle class families. ORPoor families have different economic needs and priorities than middle class families.
Independent Republican Liberal Moderate Conservative
+21 +33 +17 +19 +29 +22

Figure 11
37
189
41
231314
25 2715
21 25
0
25
50
75
100
1st Statement much more 1st Statement somewhat more
2nd Statement much more 2nd Statement somewhat more
Sharp Partisan and Ideological Divides When Focus Shifts to
Policies
27
Democrat
56
68
52
Half in Ten Baseline Survey – November 2008
384249
2634
4941
66
Policies that help poor families also help to make middle class families more secure. ORPolicies that help poor families don't do much to help middle class families.
Independent Republican Liberal Moderate Conservative
+39 -8 -22 +42 +7 -14

Figure 12

Figure 13
1
8 8
47
25
15
84
12
71
17
58
21
60
20
14
49
23
12
44
2522
58
23
10
52
23
14
52
2116
0
25
50
75
100
Solid support Conditional support Solid oppose
Poverty Reduction - Key Demographics
Age, Race are critical factors
White Black HispanicYoung women
Young men
Older women
Older men
H.S. or less
Some college
College grad
Half in Ten Baseline Survey – November 2008

Figure 14
17
24
8
78
15
3
48
22
2831
77
16
3
61
22
37
25 24
0
25
50
75
100Solid support Conditional support Solid oppose
Poverty Reduction - Partisan/Ideology
Democrat RepublicanIndependent Liberal ConservativeModerate
Half in Ten Baseline Survey – November 2008
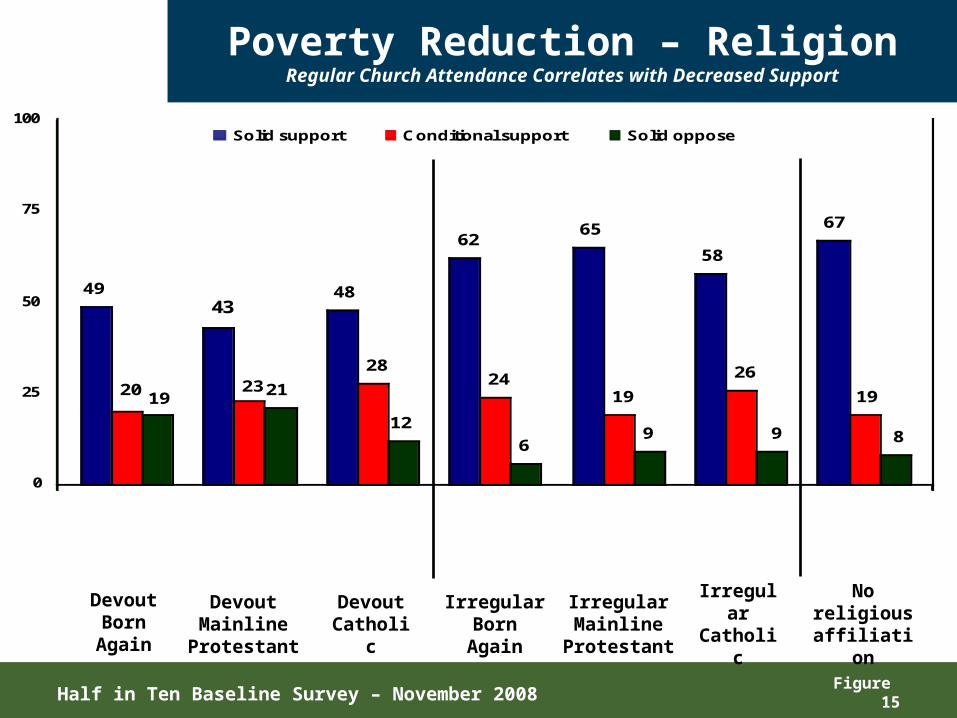
Figure 15
21
129
49
20 19
43
23
48
28
62
24
6
65
19
58
26
9
67
19
8
0
25
50
75
100Solid support Conditional support Solid oppose
Poverty Reduction – ReligionRegular Church Attendance Correlates with Decreased Support
Devout Born Again
Devout Mainline
Protestant
Devout Catholic
Irregular Born Again
Irregular Mainline
Protestant
Irregular Catholic
No religious affiliation
Half in Ten Baseline Survey – November 2008

Figure 16
External Social and Economic Factors
Are Root Causes of Poverty
Half in Ten Baseline Survey – November 2008
Much more
Total
Most people who live in poverty are poor because their jobs don't pay enough, they lack good health care and education, and things cost too much for them to save and move ahead.
39 57
ORMost people who live in poverty are poor because they make bad decisions or act irresponsibly in their own lives
12 25
Most people who live in poverty are poor because economic conditions outside of their control cause them to be poor.
26 47
OR
Most people who live in poverty are poor because they are not doing enough to help themselves out of poverty.
22 38
Now I'm going to read you some pairs of statements about poverty and the economy. After I read each pair, please tell me whether you agree more with the first statement or agree more with the second statement.

Figure 17
Current Financial Crisis Not Reason to Delay Action on Poverty
Much more
Total
Even with the costs of fixing the financial crisis, the government cannot ignore the economic needs of poor families.
41 72
OR
Given all the money we are spending to fix the financial crisis, the government should not plan any new spending to help the poor.
10 21
The recent financial crisis was primarily a result of government deregulation and reckless behavior by Wall Street banks and CEOs.
40 53
OR
The recent financial crisis was primarily a result of low-income and minority homebuyers getting in over their head with mortgages they could not afford.
14 22
Half in Ten Baseline Survey – November 2008

Figure 18
Government and Politics FrameMost Effective Against Conservative Frame
Half in Ten Baseline Survey – November 2008
8-
1010 Mean
Poverty is primarily a failure of government policy-something is wrong with our political system when the wealthy get huge tax breaks while millions of workers can't earn enough to stay out of poverty. To cut poverty, we must end the "trickle-down" and "on your own" mentality of the last eight years by paying workers a living wage; making corporations and the rich contribute their fair share; investing in infrastructure and jobs; providing affordable health care; and creating better schools and job opportunities for young people.
55 32 7.1
Poverty is primarily a failure of personal responsibility-any one in this country can make it into the middle class if they work hard enough and make the right decisions in life. To cut poverty, we need to ensure that poor people take responsibility for their own choices, reduce their dependency on welfare and government handouts, and pursue policies that promote work and strong two-parent families
35 18 5.8
I'd like you to please rate the argument on a scale of 0 to 10, with 0 meaning that argument is not at all convincing to you as a way to reduce poverty and 10 meaning the argument is very convincing to you as a way to reduce poverty.