SnapLogic Best Practices: Sub Pipelines and Guaranteed Delivery

Barriers to Infrastructure
Service Delivery in Sub-
Saharan Africa and
South Asia
Castalia Strategic Advisors
August 2014

This report has been produced by Castalia Strategic Advisors for Evidence on Demand with the assistance of the UK Department for International Development (DFID) contracted through the Climate, Environment, Infrastructure and Livelihoods Professional Evidence and Applied Knowledge Services (CEIL PEAKS) programme, jointly managed by DAI (which incorporates HTSPE Limited) and IMC Worldwide Limited. The views expressed in the report are entirely those of the author and do not necessarily represent DFID’s own views or policies, or those of Evidence on Demand. Comments and discussion on items related to content and opinion should be addressed to the author, via [email protected] Your feedback helps us ensure the quality and usefulness of all knowledge products. Please email [email protected] and let us know whether or not you have found this material useful; in what ways it has helped build your knowledge base and informed your work; or how it could be improved.
DOI:http://dx.doi.org/10.12774/eod_cr.august2014.castalia
First published August 2014 © CROWN COPYRIGHT

i
Contents
Executive Summary ........................................................................................................ iii
SECTION 1 ..................................................................................................................... 1
Introduction ..................................................................................................................... 1
SECTION 2 ..................................................................................................................... 4
Evolution of the Infrastructure Development Literature ................................................... 4
SECTION 3 ..................................................................................................................... 7
Gaps in Infrastructure Service Delivery ........................................................................... 7
3.1 Sub-Saharan Africa ................................................................................................... 7
3.2 South Asia ............................................................................................................... 10
SECTION 4 ................................................................................................................... 12
Inadequate Resources and Excessive Costs are Key Barriers to Infrastructure Service Delivery ......................................................................................................................... 12
4.1 Capital costs and allocation of resources ................................................................ 12
4.2 Revenue and Funding ............................................................................................. 14
SECTION 5 ................................................................................................................... 16
Limited Availability of Upfront Financing ........................................................................ 16
5.1 Governments—the Largest Source of Finance—are Constrained .......................... 16
5.2 Private Finance is Limited by Risk and Market Imperfections ................................. 17
5.3 Barriers to private investment .................................................................................. 20
5.4 Limits on particular sources of private investment ................................................... 22
SECTION 6 ................................................................................................................... 24
Political Economy .......................................................................................................... 24
6.1 Governance Barriers ............................................................................................... 25
SECTION 7 ................................................................................................................... 27
Serving the Poor ........................................................................................................... 27
SECTION 8 ................................................................................................................... 29
Regional Infrastructure .................................................................................................. 29
SECTION 9 ................................................................................................................... 30
Conflict-Affected States ................................................................................................. 30
Bibliography .................................................................................................................. 31
ii
List of Figures
Figure 1 Barriers to Scaling Up Provision of Infrastructure Services ............................... iv
Figure 2 Barriers to Infrastructure Services ..................................................................... 2
Figure 3 Evolution of Infrastructure Development Literature ........................................... 5
Figure 4 The Long Route of Accountability ................................................................... 24
List of Tables
Table 1 Funding Gap for Sub-Saharan African Infrastructure 2006-2015 (Annual) ......... 8
Table 2 Regional Infrastructure Spending Need in Africa, 2006-2015 (Annual) .............. 9
Table 3 Infrastructure Access and Gaps in Sub-Saharan Africa ................................... 10
Table 4 Annual infrastructure financing gap in India, 2012-2017 (12th Five-Year Plan) 10
Table 5 Infrastructure Access and Gaps in South Asia ................................................. 11
Table 6 Private, Club, and Public Goods, and Common Property ................................. 18
Table 7 Potential for Private Participation across Selected Sectors .............................. 19
Table 8 Access to Basic Infrastructure Services (2000-2004, latest observations available) ....................................................................................................................... 27
Table A.1: Annual Infrastructure Investment Need in Sub-Saharan Africa (Detailed) ... 43
Table A.2: Annual Infrastructure Investment Need in South Asia (Detailed) ................. 47
Table B.3: Regional Infrastructure Spending Need in Africa, 2006-2015 (Annual, $ billion, 2005 dollars) ...................................................................................................... 49
Table C.4: Potential for Private Participation across Sectors (Complete)...................... 51
List of Appendices
Appendix A Details of Infrastructure Investment Gaps .................................................. 41
Appendix B Regional Infrastructure Spending Need in Africa ....................................... 48
Appendix C Potential for Private Participation Across Sectors ...................................... 50
Appendix D Glossary ..................................................................................................... 52

iii
Executive Summary
In Africa, spending on infrastructure falls $30 to $48 billion short of estimates of the spending needed for sustained inclusive economic growth. This spending shortfall is manifest in poor access to services. For example, about two-thirds of Africans lack access to electricity. A similar proportion lacks access to improved sanitation. In Asia, service coverage is far from universal, but there are no reliable estimates of the gap in financing for infrastructure for the region as a whole. In India, the estimated gap between investments needed to reach targets for growth and access, and identified financing sources is $26 billion a year. For example, a quarter of the population of South Asia lacks electricity. Nearly a billion people lack improved sanitation. What are the barriers to scaling up infrastructure? A review of the literature identifies many interlinked causes (Figure 1). Among these, the gap between the funds available and the funds required is the most important immediate cause, while challenges in the political economy are often root causes. Governments still provide most capital for infrastructure, but are generally unable to scale up due to weak fiscal regimes (especially in Sub-Saharan Africa). Donors contributed 5 to 10 percent of total financing for infrastructure during the 1990s, and will not be able to fill the financial gap either. Private finance accounted for roughly 20 to 25 percent of total investment in infrastructure in developing countries during the 1990s. However, most of this was in East Asia and Latin America, and in telecommunications projects. More recently, in 2012, private investment in Sub-Saharan African infrastructure increased to $12.8 billion—a 13 percent increase over 2011. Private investment in South Asian infrastructure amounted to $181.4 billion in 2012—a four percent increase over 2011. Investment was concentrated in telecommunications, followed by energy, with relatively little in the water sector. Significant amounts of private finance are potentially available for African and South Asian infrastructure, but regulatory, macroeconomic, and political risks deter investors. The literature devotes considerable attention to these risks and ways to address them. These risks are real, but investors perceive the lack of a pipeline of ‘investment-ready’ projects as a significant barrier. Investment-ready projects are those with manageable risks, clear legal documentation, and funding (from user charges or government payments) that, over time, covers the total cost of a service (including a reasonable risk-adjusted return on capital). More fundamental than the lack of finance is the lack of cost recovery. Most infrastructure providers are government entities that are unable to recover their costs. In part, this is because capital costs are higher than they need to be. Maintenance is inadequate, meaning capital stock needs premature replacement. Inefficiencies mean that significant potential revenue is lost—in Africa, inefficiencies result in estimated total losses of around $17 billion a year. User charges generally do not cover the full cost of services in developing countries, and these indirect subsidies mostly benefit the better off. Subsidies may only help those who already have a connection to existing utilities, rather than expanding access to those without connections.
iv
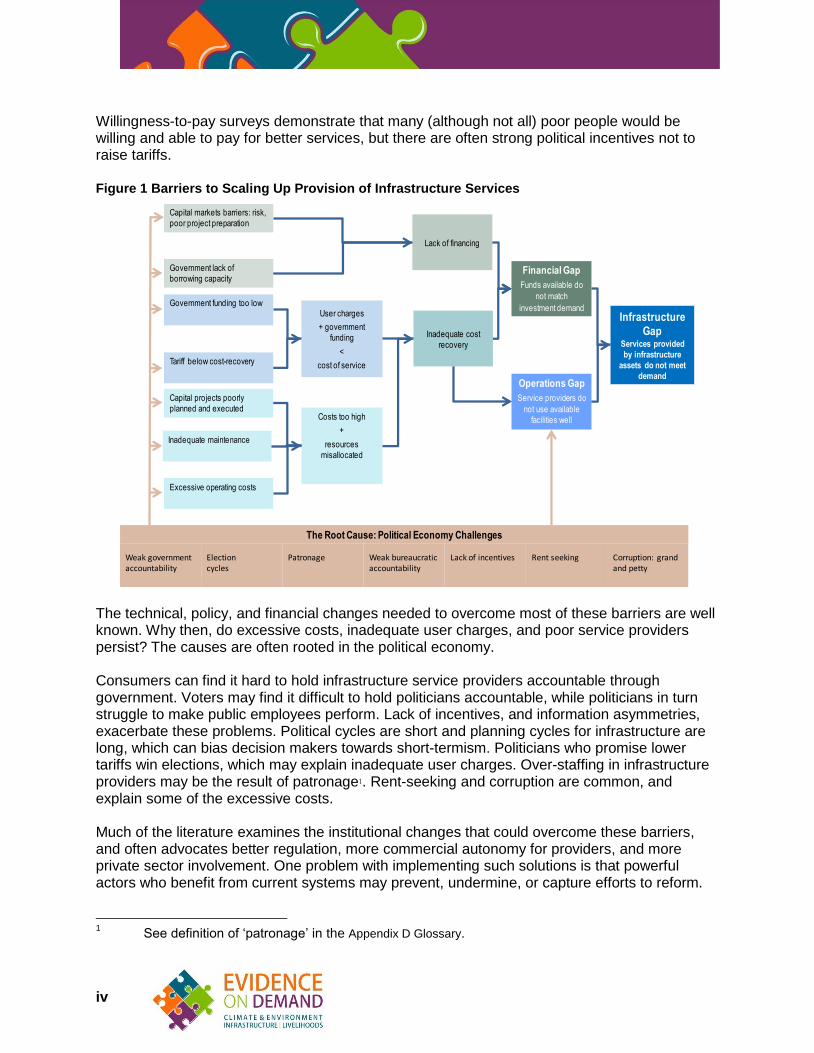
Willingness-to-pay surveys demonstrate that many (although not all) poor people would be willing and able to pay for better services, but there are often strong political incentives not to raise tariffs. Figure 1 Barriers to Scaling Up Provision of Infrastructure Services
The technical, policy, and financial changes needed to overcome most of these barriers are well known. Why then, do excessive costs, inadequate user charges, and poor service providers persist? The causes are often rooted in the political economy. Consumers can find it hard to hold infrastructure service providers accountable through government. Voters may find it difficult to hold politicians accountable, while politicians in turn struggle to make public employees perform. Lack of incentives, and information asymmetries, exacerbate these problems. Political cycles are short and planning cycles for infrastructure are long, which can bias decision makers towards short-termism. Politicians who promise lower tariffs win elections, which may explain inadequate user charges. Over-staffing in infrastructure providers may be the result of patronage1. Rent-seeking and corruption are common, and explain some of the excessive costs. Much of the literature examines the institutional changes that could overcome these barriers, and often advocates better regulation, more commercial autonomy for providers, and more private sector involvement. One problem with implementing such solutions is that powerful actors who benefit from current systems may prevent, undermine, or capture efforts to reform.
1 See definition of ‘patronage’ in the Appendix D Glossary.
Financial Gap
Funds available do
not match
investment demandInfrastructure
GapServices provided
by infrastructure
assets do not meet
demand
Lack of financing
Government lack of
borrowing capacity
Capital markets barriers: risk,
poor project preparation
Inadequate cost
recovery
Costs too high
+
resources
misallocated
User charges
+ government
funding
<
cost of service
Capital projects poorly
planned and executed
Inadequate maintenance
Excessive operating costs
Tariff below cost-recovery
Government funding too low
Operations Gap
Service providers do
not use available
facilities well
Weak government accountability
Election cycles
Patronage Weak bureaucratic accountability
Lack of incentives Rent seeking Corruption: grand and petty
The Root Cause: Political Economy Challenges
1
SECTION 1 Introduction
This review summarizes selected literature on gaps in infrastructure services in Sub-Saharan Africa and South Asia, and on the barriers that stand in the way of scaling up infrastructure. Castalia prepared the review as an input to the Department for International Development’s (DFID’s) Infrastructure Policy Framework. The key documents reviewed were high profile publications from the World Bank, Asian Development Bank, other international organizations, and some private firms. Castalia also reviewed working papers and other analytical publications from such agencies. Searches of databases of peer-reviewed academic literature yielded only a few relevant papers. Most data on service coverage and service gaps is from the World Development Indicators database, which is widely cited in the literature. In selecting material, preference was given to points supported by empirical evidence and soundly reasoned, as well documents that had been thoroughly reviewed, recommended, or cited by others. Overall, the literature reviewed is analytically sound, although the underlying data on infrastructure in developing countries is often patchy and unreliable. The authors took into account the comments of an academic peer reviewer on an early draft. After a brief overview of how the literature has evolved (section 2), the report follows the structure illustrated in Figure 2. section 3 summarizes the size of the infrastructure gaps, both in terms of service levels and in financial terms.

2
Figure 2 Barriers to Infrastructure Services
The numbers in parentheses indicate sections in this report.
In the first instance, the infrastructure gap appears to be the result of a lack of financial resources for capital facilities, combined with inadequate operation of facilities that do exist. Financial resources are inadequate because user charges and government funding do not cover the cost of providing services. Private finance is available, but is only forthcoming where user charges plus government funding is sufficient to cover full costs, and there is a risk-adjusted return on capital, which is seldom the case. section 4 examines the reasons for the lack of cost recovery: user charges that are too low; government funding that does not fill the gap; and capital and operating costs that are too high. Generally, infrastructure facilities have high upfront costs. Finance from governments, or from private financiers, needs to cover these costs. section 5 reviews the barriers to both kinds of financing. The economics of infrastructure leads to market failures, and a strong rationale for government involvement. Government involvement, in turn, brings a complex web of political challenges, from inadequate accountability to outright corruption. The infrastructure sector provides opportunities for corruption because contracts often are very large, which can make corruption lucrative, and there are many transaction layers, which increase the difficulty of achieving transparency and accountability. The literature suggests that many of the barriers to infrastructure have their roots in these political challenges, as section 6 describes.
Financial Gap
Funds available do
not match
investment demand
(3) Infrastructure
GapServices provided
by infrastructure
assets do not meet
demand (3)
Lack of financing (5)
Government lack of
borrowing capacity (5.1)
Capital markets barriers: risk,
poor project preparation (5.2)
Inadequate cost
recovery (4)
Costs too high
+
resources
misallocated
(4.1)
User charges
+ government
funding
<
cost of service
(4.2)
Capital projects poorly
planned and executed (4.1.1)
Inadequate maintenance
(4.1.2)
Excessive operating costs
(4.1.3)
Tariffs below cost-recovery
(4.2.1)
Government funding too low
(4.2.2)
Operations Gap
Service providers do
not use available
facilities well (3)
Weak government accountability
Election cycles
Patronage Weak bureaucratic accountability
Lack of incentives Rent seeking Corruption: grand and petty
The Root Cause: Political Economy Challenges (6)
3
The remainder of the report focuses on specific topics of particular relevance to DFID: serving the poor (section 7), providing regional infrastructure (section 8), and providing infrastructure in conflict-affected states (section 9). This is followed by a Bibliography. Appendices provide detail on infrastructure gaps and a Appendix D Glossary of terms.

4
SECTION 2 Evolution of the Infrastructure Development
Literature
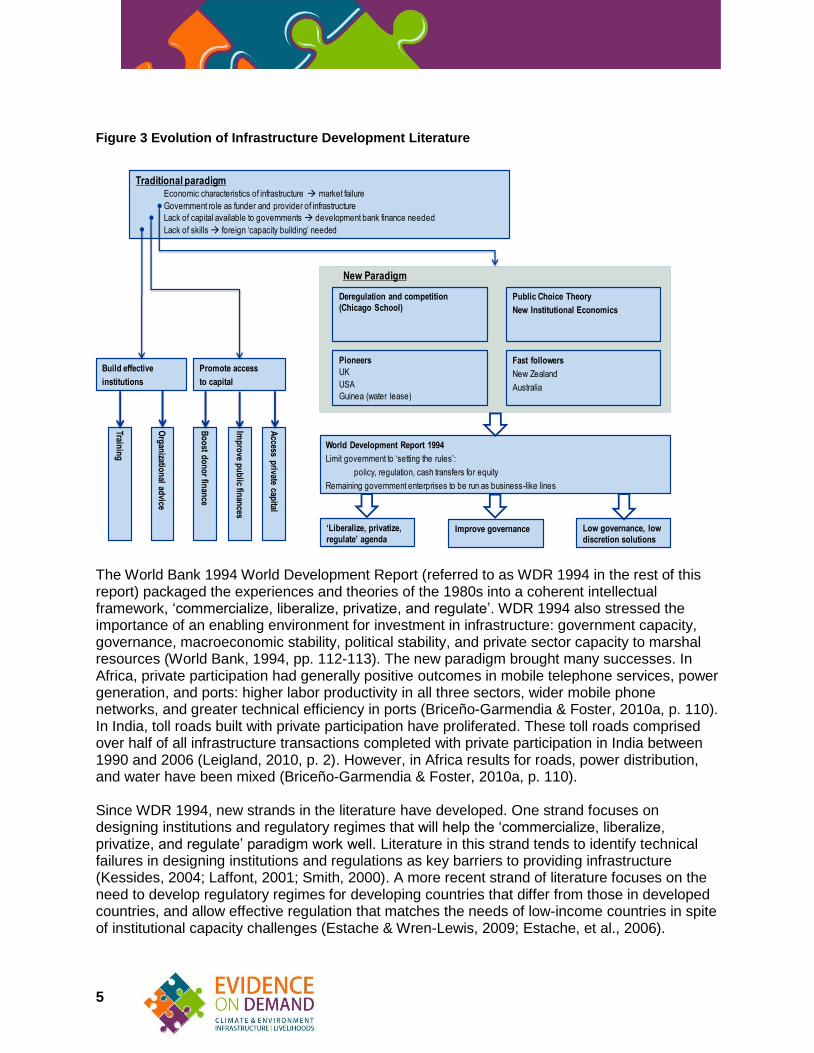
Infrastructure development policy from the 1950s to the 1970s assumed that governments should finance, own, and operate most of a country’s infrastructure. Governments’ role was to provide public goods, coordinate sectors, promote equitable service provision, and achieve economies of scale, while preventing monopolies from abusing their power. Figure 3 shows how the literature has evolved since then. By the 1980s, policies had started to change. Britain privatized state-owned telecommunications, electricity, gas, transport, and water services. Where possible, the government introduced competition and regulated monopolies (Holder, 1998). In the United States, reform of transport and electricity regulations encouraged competition between private providers (Slack, 2014). Chile adopted similar reforms (Pollitt, 2004). In Guinea, the World Bank worked with the government to reintroduce the French model of private operation of water services (Brook & Locussol, 2001; Triche, 1990). New Zealand, Australia, and many other countries followed the British and American lead. Developments in economic theory underpinned these policy innovations. The Chicago School reemphasized the role of markets in solving economic problems (Reder, 2008). The Public Choice School argued that government is not necessarily a benevolent agent acting in the public interest, but is composed of individuals who respond to incentives that are not always aligned with the public good (Tullock, 2008). New Institutional Economics offered tools for designing new economic institutions, such as market structures and regulations (Rutherford, 2001).
5
Figure 3 Evolution of Infrastructure Development Literature
The World Bank 1994 World Development Report (referred to as WDR 1994 in the rest of this report) packaged the experiences and theories of the 1980s into a coherent intellectual framework, ‘commercialize, liberalize, privatize, and regulate’. WDR 1994 also stressed the importance of an enabling environment for investment in infrastructure: government capacity, governance, macroeconomic stability, political stability, and private sector capacity to marshal resources (World Bank, 1994, pp. 112-113). The new paradigm brought many successes. In Africa, private participation had generally positive outcomes in mobile telephone services, power generation, and ports: higher labor productivity in all three sectors, wider mobile phone networks, and greater technical efficiency in ports (Briceño-Garmendia & Foster, 2010a, p. 110). In India, toll roads built with private participation have proliferated. These toll roads comprised over half of all infrastructure transactions completed with private participation in India between 1990 and 2006 (Leigland, 2010, p. 2). However, in Africa results for roads, power distribution, and water have been mixed (Briceño-Garmendia & Foster, 2010a, p. 110). Since WDR 1994, new strands in the literature have developed. One strand focuses on designing institutions and regulatory regimes that will help the ‘commercialize, liberalize, privatize, and regulate’ paradigm work well. Literature in this strand tends to identify technical failures in designing institutions and regulations as key barriers to providing infrastructure (Kessides, 2004; Laffont, 2001; Smith, 2000). A more recent strand of literature focuses on the need to develop regulatory regimes for developing countries that differ from those in developed countries, and allow effective regulation that matches the needs of low-income countries in spite of institutional capacity challenges (Estache & Wren-Lewis, 2009; Estache, et al., 2006).
Traditional paradigmEconomic characteristics of infrastructure market failure
Government role as funder and provider of infrastructure
Lack of capital available to governments development bank finance needed
Lack of skills foreign ‘capacity building’ needed
Deregulation and competition
(Chicago School)
Public Choice Theory
New Institutional Economics
Fast followers
New Zealand
Australia
Pioneers
UK
USA
Guinea (water lease)
World Development Report 1994
Limit government to ‘setting the rules’:
policy, regulation, cash transfers for equity
Remaining government enterprises to be run as business-like lines
‘Liberalize, privatize,
regulate’ agendaImprove governance Low governance, low
discretion solutions
Build effective
institutions
Promote access
to capital
Bo
ost d
on
or fin
ance
Imp
rove p
ub
lic finan
ces
Access p
rivate capital
New Paradigm
Trainin
g
Org
anizatio
nal ad
vice

6
Another ‘governance’ strand in the literature digs deeper into problems highlighted in WDR 1994 (Campos & Pradhan, 2007).2 The paradox in the WDR 1994 paradigm is that the political dynamics that make governments poor providers of infrastructure can also make them reluctant reformers and poor regulators. The core problem, according to the literature in this strand, is a political economy dynamic that favors preserving dysfunctional infrastructure. A series of Good Governance and Anti-corruption Sourcebooks, published by the World Bank in 2008 and 2009, summarized much of this literature (World Bank, 2009a; World Bank, 2009b; Halpern, et al., 2008). Finally, a minor strand in the literature looks at ‘low governance’ and ‘low discretion’ solutions (Kariuki & Schwartz, 2005; Mehta, et al., 2007). This strand takes the view that, where political economic dynamics are poor, the best approach is to allow individuals, community groups, and firms to provide infrastructure services with minimum intervention from government. This strand may be particularly relevant to countries with weak governance, including many fragile and conflict-affected states. On the left-hand side of Figure 3 , is a strand of the literature that focuses on ‘building effective institutions’. While this strand uses the terms of the WDR 1994 paradigm, it also references earlier work on ‘capacity building’. However, the literature has been mostly concerned with where the capital for infrastructure development is to come from. After WDR 1994, much of the literature focused on how governments could attract private capital (World Bank, 2014a; Collier & Mayer, 2014; Gómez-Ibáñez, 2008). The literature on public financing tended to examine fiscal constraints that prevent governments from financing the infrastructure needed for development (Calderon & Chong, 2004; Easterly & Servén, 2003).
2 In Campos & Pradhan, 2007, chapters 4,5,7, and 9 are relevant to infrastructure.

7
SECTION 3 Gaps in Infrastructure Service Delivery
The sections below summarize available information on financing gaps, investment needs, and lack of basic services in Africa and South Asia. Most of the literature addresses access levels and investment needs. There are few estimates of financing gaps (the difference between the investment needed and current investment). A 2006 survey concluded that “the data gaps are so large that they impede [an] effective monitoring of the evolution of performance in terms of access, efficiency, equity or fiscal costs for most sub-sectors” (Estache, 2006, abstract). The literature avoids recommending how best to prioritize investment in improving access to infrastructure services and investment in economic growth. One well-researched report stated that the choice between large economic development projects and smaller projects to improve access was a false dichotomy: “The right combination, as well as the level at which design and implementation take place, is highly dependent on country level institutions, the policy makers’ objectives, and the economic characteristics of the infrastructures under consideration” (Andrés, et al., 2013, p. 15).
3.1 Sub-Saharan Africa
Africa’s infrastructure financing gap is estimated at around $48 billion a year. In Sub-Saharan Africa the gap between current spending and what is needed for sustained inclusive growth is around $48 billion a year (Briceño-Garmendia & Foster, 2010a, p. 12). This is more than current spending, which estimates put at just $45 billion. Estimates indicate that to bridge the infrastructure financing gap, fragile states would have to spend 37 percent of gross domestic product (GDP) a year on infrastructure, while non-fragile low-income countries would have to spend 23 percent, and middle-income countries would have to spend 10 percent (Briceño-Garmendia & Foster, 2010a, p. 8). Improving efficiency and the allocation of resources could close the gap by as much as $17 billion. However, additional resources of $30 billion a year would still be needed. (Note that these figures are for total spending, including operations and maintenance, as well as capital investment.) Table 1 shows the estimated gaps in more detail.3
3 These estimates (from the Africa Infrastructure Country Diagnostic) are based on a number of
assumptions about unit costs, technology choices, geographical coverage targets, and other variables. More detail can be found in Briceño-Garmendia & Foster, 2010, p. 34-36.

8
$US billion (2005)
Electricity ICT Irrigation Transport Water and sanitation services (WSS)
Cross-sector gain
Total
Infrastructure spending needed
-40.8 -9.0 -3.4 -18.2 -21.9 - -93.3
Investment -26.7 -7.0 -2.9 -8.8 -14.9 - -60.3
Operations and management (O&M)
-14.1 -2.0 -0.6 -9.3 -7.0 - -33.0
Existing spending
11.6 9.0 0.9 16.2 7.6 - 45.3
Efficiency gain 6.0 1.3 0.1 3.8 2.9 3.3 17.4
Funding gap -23.2 1.3 -2.4 1.8 -11.4 3.3 -30.6
Source: Briceño-Garmendia & Foster, 2010, p. 12 Note: Negative numbers denote gaps. The efficiency gain includes money that could be gained
from raising capital execution (disbursing a larger share of allocated funds from public budgets), eliminating operational inefficiencies, cost-recovery tariffs, and ‘cross-sector gains’ from reallocating money between sectors.
Table 1 Funding Gap for Sub-Saharan African Infrastructure 2006-2015 (Annual)
Estimates of investment needs vary. Briceño-Garmendia & Foster (2010, A) found that Sub-Saharan Africa needs an annual investment of $60 billion to meet policy targets and sustain economic growth. In contrast, a 2003 study estimated the annual investment needed at just $12 billion (Fay & Yepes, 2003). A 2012 study that examined the investment needed to sustain economic growth and lower carbon emissions estimated the need for annual spending on infrastructure at $90 billion to $345 billion (Bhattacharya, et al., 2012, p. 11). Given insufficient data on current service levels, and the inherent difficulties in estimating future needs, all estimates are broad approximations. Nevertheless, the Briceño-Garmendia & Foster estimates are useful for policy purposes, since they consider countries’ service improvement targets, as well as their need for economic growth. In contrast, the 2003 Fay & Yepes estimate was based on econometric projections and forecasts of economic growth. (0 gives more detail on estimates of investment needs, and what the estimates include.). The 2012 Bhattacharya estimate also relies on assumed economic growth rates, but claims to be a ‘conservative’ estimate of what is needed to reduce carbon emissions. (0 provides more detail on estimates of regional investment needs.) Regional infrastructure may cost $6.9 billion a year over a decade. As shown in Table 2 , the estimate of the cost of regional infrastructure encompasses power, telecommunications, and transport. Water is not included. Spending needs are highest for power, which accounts for 76 percent of total spending. However, the spending need for power may be even higher because the costs for operations and maintenance (O&M) may be understated. The sources did not have

9
information for most countries on O&M needs in the power sector (0 indicates the information that is available). This lack of information may also mean that the estimates of costs across all sectors are too low.
Sector $ million a year (2005 dollars)
Power 5,258
Of which investment 4,746
Of which O&M 512
Telecommunications 31.35
Of which investment 31
Of which O&M 0.35
Transport 1,612
Of which investment 756
Of which O&M 856
All sectors 6,901
Of which investment 5,533
Of which O&M 1,368
Sources: Ranganathan & Foster, 2011a; 2011b; 2011c; 2011d; 2011e Note: 0 provides country-by-country data and indicates where data is missing.
Table 2 Regional Infrastructure Spending Need in Africa, 2006-2015 (Annual)
Only around one-third of Africans have access to electricity or improved sanitation. Information on gaps in access to services largely derives from The World Development Indicators dataset compiled by the World Bank. Table 3 presents the latest data, along with other available information on access levels. The information, compiled from national sources of varying reliability, does not take into account service quality.
Year People with access People lacking access
(millions)
Improved sanitation facilities (% of population with access)
2012 30% 640
Improved water source (% of population with access)
2012 64% 320
Electricity (% of population with access) 2011 35% 600
Telephone lines (per 100 people)
2012 1 per 100 -
Mobile telephone subscriptions (per 100 people)
2012 59 per 100 -
Internet users (per 100 people)
2012 15 per 100 -
All-weather road (% of rural population with access)*
1994-2004 31% -

10
Source: All data, except for road access, is from the World Bank World Development Indicators, accessed June 2014. Road data is from ‘Rural Access Index’ by Roberts, Shyam, and Rastogi.
Note: *A person who lives within two kilometers of an all-weather road is considered to have access. The road data is based on surveys conducted in various countries between 1994 and 2004. Not all countries were surveyed regularly, so the underlying data used to estimate access to roads is from different times.
Table 3 Infrastructure Access and Gaps in Sub-Saharan Africa
3.2 South Asia
India’s annual financing gap for infrastructure is estimated at $26 billion (Deloitte India, 2013, p. 18). The $26 billion gap in financing for infrastructure to meet the target of 9 percent annual GDP growth in the Twelfth Five-Year Plan is based on an estimated capital expenditure of $220 billion a year. Table 4 gives details of anticipated financing and the gap in financing. (The source does not provide a breakdown by sector.) An earlier estimate of the financing gap for South Asia as a whole was $60 billion a year for 2006 to 2010 (Chatterton & Puerto, 2006, p. i). However, this figure does not seem useful for policy purposes, as the estimate of investment needed is much lower than estimates in other more recent studies, and the estimates of existing investment levels are ‘guesstimates’. The review of the literature did not find any other estimates of financing gaps in South Asia.
$ billion a year (2011 dollars)
Total investment required 220.5
Budgetary support (government) 117.6
Domestic commercial banks (lending) 31.9
Domestic equity and foreign direct investment 19.9
Non-bank financial companies (lending) 16.5
Domestic insurance and pension funds (lending) 6.3
External commercial borrowing 2.6
Financing gap 26.1
Source: Deloitte India, 2013. Based on data from the High Level Committee of the India Planning Commission. Note, the numbers in the Deloitte report do not sum exactly.
Table 4 Annual infrastructure financing gap in India, 2012-2017 (12th
Five-Year Plan)
Investment needed in South Asian infrastructure is estimated at between $98 billion and $237 billion—the top end of the range is more likely. Bhattacharyay (2010), using econometric relationships and forecasts of economic growth, estimated that South Asia needs an investment in infrastructure of $237 billion a year. Andrés et al. (2013) estimated the need for between $152 billion and $229 billion a year to meet government policy targets. An earlier study by Chatterton and Puerto (2006) put the need at $98 billion annually. The range of estimates shows the difficulties in estimating needs and, hence, financing gaps. However, in view of Deloitte’s recent estimates of an investment need of $220 billion a year for India alone, it is safe

11
to say that the need for South Asia as a whole is at the top end of the range in the literature. (0 gives more detail on the estimates of regional investment needs.) A 2012 study estimated that the investment needed to sustain economic growth and lower carbon emissions in South Asia would be $360 billion to $575 billion a year (Bhattacharya, et al., 2012, p. 11). The authors indicate that these estimates are ‘conservative.’ Regional infrastructure investment needs over a decade exceed US$336 million. Bhattacharyay (2010) added up forecast spending on regional projects likely to come about between 2010 and 2020. This estimate of regional infrastructure needs amounted to US$336 million over the ten years. Since the estimate is based on known, forecast projects, and excludes Pakistan, it may be considered as the minimum investment in regional infrastructure needed. Unfortunately, there are no estimates of current levels of investment in regional infrastructure, and so no estimates of funding gaps. Nearly a billion people in South Asia lack improved sanitation, and a quarter of the population lacks electricity. The World Development Indicators are the most comprehensive dataset on access to infrastructure services in South Asia. Table 5 presents this data and data on access to all-weather roads. Data are compiled from national sources and do not take into account service quality.
Year People with access
People lacking access
(millions)
Improved sanitation facilities (% of population with access)
2012 40% 990
Improved water source (% of population with access)
2012 91% 150
Electricity (% of population with access) 2011 73% 440
Telephone lines (per 100 people) 2012 3 per 100 -
Mobile cellular subscriptions (per 100 people)
2012 69 per 100 -
Internet users (per 100 people) 2012 12 per 100 -
All-weather road (% of rural population with access)*
1994-2004 58% -
Source: All data, except for road access, is from the World Bank World Development Indicators, accessed June 2014. Road data is from ‘Rural Access Index’ by Roberts, Shyam, and Rastogi.
Note: *A person who lives within two kilometers of an all-weather road is considered to have access .The road data is based on surveys conducted in various countries between 1994 and 2004. Not all countries were surveyed regularly, so the underlying data used to estimate access to roads is from different periods.
Table 5 Infrastructure Access and Gaps in South Asia
12
SECTION 4 Inadequate Resources and Excessive Costs are
Key Barriers to Infrastructure Service Delivery
Few infrastructure service providers in South Asia and Sub-Saharan Africa recover their costs. To sustain and expand services, the total resources available—the sum of user charges and government contributions—must equal or exceed the total cost of providing a service—including operating, maintenance, and capital costs. However, in many cases, costs are high, user charges are low, and government contributions are insufficient to close the gap. The lack of cost recovery is one of the main barriers to scaling up provision of infrastructure services.
4.1 Capital costs and allocation of resources
Capital projects cost more to deliver than they should, operations are inefficient, and poor maintenance leads to excessive spending on replacing assets. High costs and misallocated resources are two sides of the same coin - the money spent is often spent on the wrong things.
4.1.1 Planning and execution of capital projects
In Sub-Saharan Africa, “Stronger sector planning is needed in infrastructure line ministries to ensure that the construction of critical new assets begins early enough to come on stream when needed” (Briceño-Garmendia & Foster, 2010a, p. 8). Failures in planning drive up costs. In many countries in Sub-Saharan Africa, governments lease emergency generators to deal with power shortages (Briceño-Garmendia & Foster, 2010a, p. 5). Governments then sell this emergency power, which costs more to produce, at normal prices. Subsidizing emergency power by selling it at normal prices consumes fiscal resources that could otherwise go towards providing better solutions. Poor planning can also result in overbuilding. Overbuilding diverts money from maintenance, which drives up costs in the future (World Bank, 2009b, p. 60). Annual budget cycles can make a long-term approach to project planning and delivery more difficult (Briceño-Garmendia & Foster, 2010a, p. 8). Corruption or political favoritism can also result in poor selection of projects (World Bank, 2009b, p. 56). Closely related to poor planning is the failure to select projects with the best returns. The most important driver of economic growth is not the level of investment, but choosing the right things to invest in at the right cost (Klein, 2012, p. 5). One reason for selecting poor projects is omitting to do a cost-benefit analysis (Klein, 2012, p. 6). In Sub-Saharan Africa, ad hoc political priorities rather than cost-benefit analyses often determine budgetary choices (Briceño-Garmendia & Foster, 2010a, p. 8). In Nepal, government engineering entities focus on construction costs and progress, which emphasizes building assets rather than delivering results and service (World Bank, forthcoming (b), p. 5). Some have argued that multilateral development institutions have largely abandoned cost-benefit analyses and the allocation of resources based on economic rates of return. This may contribute to misallocation of capital resources (Estache, 2006 p.17).

13
Once projects have been selected, contractors are procured to build them. Weak procurement practices mean construction costs are higher than they need to be (Construction Sector Transparency Initiative, 2010, pp. 17-19). For example, in South Asia, contractor cartels bidding on water projects can inflate costs by 15 percent. Contractors may also bribe officials and inflate invoices to cover the cost of bribes (Davis, 2003, p. 57). Construction contractors are often poorly supervised (lowering build quality), and construction contracts are often poorly managed (allowing cost overruns) (Construction Sector Transparency Initiative, 2010, pp. 23, 30). In India, contractors on water projects often substitute materials that are cheaper and of lower quality than those specified (Davis, 2003, p. 59). In Nepal, 10 to 20 percent of rural water supply schemes experience problems during their first or second year of operation because of poor construction (World Bank, forthcoming (b)). Weak contract management by government entities provides opportunities for contractors to increase their charges and profit at the expense of the public (Halpern, et al., 2008, pp. 56-57).
4.1.2 Maintenance
Infrastructure authorities in developing countries often under-maintain existing assets. Insufficient maintenance can lead to costly repairs in the future, as well as poor quality service (Andrés, et al., 2013, p. 17). As the World Development Report of 1994 pointed out:
Timely maintenance expenditures of $12 billion would have saved road reconstruction costs of $45 billion in Africa in the past decade. On average, inadequate maintenance means that power systems in developing countries have only 60 percent of their generating capacity available at a given time, whereas best practice would achieve levels over 80 percent. And it means that water supply systems deliver an average of 70 percent of their output to users, compared with best-practice delivery rates of 85 percent (World Bank, 1994, p. 4).
The overall picture has not changed much since 1994. Between 25 and 40 percent of water still leaks from supply systems, or is unaccounted for (G20, 2011a, p. 4). In Sub-Saharan Africa, an estimated $1.9 billion in capital expenses for rehabilitating roads could have been avoided with sound maintenance (Briceño-Garmendia & Foster, 2010a, p. 10). Reducing leaks rather than building new water systems would often improve water supplies at much lower financial and environmental cost (Kingdom, et al., 2006, p. v). If water utilities in developing countries reduced non-revenue water (water that has been produced and is ‘lost’ before it reaches the customer) by half, cash flow would improve by an estimated $2.9 billion, and services to customers would improve (Kingdom, et al., 2006, p. 5). Macroeconomic studies confirm that productivity gains from better maintenance exceed the cost of improving maintenance (Rioja, 2003, p. 135). Donors typically prefer to fund capital projects or consultancy services rather than recurrent expenditure. They justify this on the grounds that maintenance is better funded from government budgets (Briceño-Garmendia & Foster, 2010a, p. 16). Some have argued that this exacerbates the bias against maintenance and favors new build projects (World Bank, 1994, p. 4).
4.1.3 Operating costs
In 1994, the World Bank estimated that technical inefficiencies in infrastructure in developing countries wasted $55 billion a year—equivalent to 1 percent of all developing countries' GDP

14
(World Bank, 1994, p. 4). Recent studies put losses due to various inefficiencies in Sub-Saharan Africa as high as $17 billion a year (Briceño-Garmendia & Foster, 2010a, p. 9). Utility and other service providers in Sub-Saharan Africa waste an estimated $6 billion a year on over-staffing, weak revenue collection, and network losses (Briceño-Garmendia & Foster, 2010a, p. 15). Low labor productivity is a common cause of excessive costs. At various times, two out of three railway laborers in Tanzania and Zaire have been surplus to needs (World Bank, 1994, p. 27). Estimates put the cost of employing more workers than necessary in infrastructure in Sub-Saharan Africa at $1.5 billion annually. Sub-Saharan telecommunications utilities average 94 connections per employee, whereas developed countries average 420 connections per employee (Briceño-Garmendia & Foster, 2010a, p. 72). Poor revenue collection practices reduce the resources available for infrastructure. In Sub-Saharan Africa, an estimated $2.9 billion per year is lost from unpaid bills (Briceño-Garmendia & Foster, 2010a).
4.2 Revenue and Funding
Users in Sub-Saharan Africa and South Asia generally pay for services, but the charges do not meet the full costs (Estache, 2010, p. 76). Governments contribute, but seldom enough to fill the gap between costs and revenues.
4.2.1 Tariffs
In the developing world, utility tariffs often do not recover full costs (Estache, 2010, p. 76). In South Asia and Sub-Saharan Africa, very few countries attempt to recover even part of the capital costs (Estache, 2010, p. 76). Governments often set low tariffs that do not cover costs so that poor people can afford essential services (Komives, et al., 2005, p. 36), sometimes with good reason. Even the most affluent households in Sub-Saharan Africa may spend half their monthly budget on food. It is common for households to spend 50 percent of the remaining non-food budget on utilities and, in some cases, 80 percent. Between one- and two-thirds of urban customers in Sub-Saharan Africa would face difficulties in paying full cost-recovery rates for infrastructure services (Banerjee, et al., 2008, p. ix). Tariffs in developing countries are generally lower than required for full cost recovery, but these hidden subsidies mostly benefit the better off (World Bank, 1994, p. 31). Subsidies for an existing utility may only help those who already have service connections, rather than giving more people access to services (Klein, 2012, p. 29). In Sub-Saharan Africa, recovering full costs from those able to pay would provide an estimated $4 billion a year in subsidies to redirect to, for example, improving access for lower income people (Briceño-Garmendia & Foster, 2010a, p. 10). At the same time, many poor people who would be prepared to pay the full cost for infrastructure services are denied the opportunity. Instead, they pay higher prices for poor quality alternatives (often provided by small-scale private providers acting independently), or are unable to access services at all. Poor people often pay more than wealthier people for water (United Nations Development Program, 2006, p. 52). For example, in Dhaka, Bangladesh, water purchased from vendors—which the poor are more likely to use—can be 14 times more costly than water from the public utility (United Nations Development Program, 2006, p. 52).

15
4.2.2 Government funding
When user charges do not cover costs, governments have to use tax revenues to sustain and expand services. Yet, in Sub-Saharan Africa, government- subsidies to service providers to allow them to expand services are generally insufficient (Banerjee, et al., 2008, p. 5). In Pakistan, user charges for water and sanitation generally cover no more than the cost of operation and maintenance, so the sector depends entirely on government funding to expand capital assets. To meet service targets would require investment of about 0.5 percent of GDP in the sector each year, but current government contributions are less than a third of this (World Bank, forthcoming (b), p. 24).

16
SECTION 5 Limited Availability of Upfront Financing
The distinction between ‘funding’ and ‘financing’ is important. Funding means providing resources to cover the cost of services. Funding can cover either recurrent costs or upfront capital costs—but, in both cases, no repayment is expected. Financing, in contrast, is providing money now with the expectation that it will be returned (usually with interest or profits),4 which is only possible if funding is secure.5 (Infrastructure Finance Working Group, 2012, pp. 3,11).
5.1 Governments—the Largest Source of Finance—are Constrained
During the 1990s, governments or public utilities found 70 percent of total infrastructure spending from their own resources. Official development assistance (ODA) financed around 5 to 10 percent. The private sector contributed roughly 20 to 25 percent of investment in public utilities (Briceño-Garmendia, et al., 2004, p. 17). In the 1990s, low-income countries spent around 4 percent of GDP on infrastructure, and middle-income countries spent around 2 percent. This was up to 3 percent of GDP less than estimated investment needs. Public investment in infrastructure generally declined in the 1990s for three reasons: (i) an unmet hope that the private sector would provide major financing for infrastructure, (ii) fiscal adjustment programs, and (iii) decentralization resulting in mismatches between resources and needs (Briceño-Garmendia, et al., 2004, p. 17).
The public sector and private financing tie as the largest providers of capital resources in Africa for water, power, and transport; each contributed 38 percent6 between 2001 and 2006 (Briceño-Garmendia & Foster, 2010a, p. 9). In India, the public sector is expected to pay for around 53 percent of the investment needed for infrastructure to meet the government’s Five-Year Plan ending in 2017, and private finance the rest (Deloitte India, 2013, p. 18). Public sector financing can unintentionally become funding when infrastructure providers cannot repay government loans. In these cases, government funds cover losses, rather than financing new assets. For example, in Malawi, implicit subsidies for the publicly owned power utility amount to about 3.4 percent of GDP (G20, 2011b, p. 10).
4 This is similar to the ‘grants versus loans’ distinction. However, ‘funding’ includes user charges
as well as grants, while financing includes equity investment as well as debt. To see more on grants versus loans from the IMF: https://www.imf.org/external/pubs/ft/fandd/2004/09/pdf/clements.pdf
5 This paper adopts the use of ‘funding’ and ‘finance’ as used by the Infrastructure Finance
Working Group. 6 However, if operations and maintenance are included, then public sector provides 66 percent of
total infrastructure spending (Briceño-Garmendia & Foster, 2010a, p. 8).

17
An underlying difficulty in expanding public finance for infrastructure is the limited ability of developing country governments to raise tax revenues because of low incomes and a narrow tax base (G20, 2011a, p. 7). This is especially true in Sub-Saharan Africa. At around 23 percent, domestic revenue collection in Sub-Saharan Africa is lower than averages for other developing countries (Briceño-Garmendia & Foster, 2010a, p. 76). In low-income African states, public finance typically absorbs 5 to 6 percent of GDP, but this still only amounts to $20 to $30 per capita per year (Briceño-Garmendia & Foster, 2010a, p. 9). Increasing government expenditure would be challenging, since many African countries have ratios of debt service to GDP higher than 6 percent (Briceño-Garmendia & Foster, 2010a, p. 77). Related to this, some have argued that fiscal stabilization programs developed by the International Monetary Fund (IMF) and others may excessively compress investment, and operations and maintenance expenditure in infrastructure, damaging future growth prospects (Calderon & Chong, 2004). Donor finance and concessional finance from multilateral development banks cannot necessarily solve these problems, since these kinds of finance are limited by the fiscal constraints of donor countries (G20, 2011a, p. i). Multilateral development banks also have limits on exposure to individual countries in their hard lending activities, as well as limits on their ability to borrow money in the capital markets. Multilateral development bank and donor financing also faces constraints similar to those faced by commercial financiers—a lack of well-prepared and financeable projects, and limits to the resources they can responsibly invest in preparing projects themselves (G20, 2011a, p. 15).
5.2 Private Finance is Limited by Risk and Market Imperfections
The World Development Report 1994 highlighted the potential of private finance for infrastructure in developing countries. This became a policy focus. Private investment in developing countries grew, averaging about $67 billion annually through the 1990s. However, private investment only amounted to 20 to 22 percent of realized investment, and much of it went to telecommunications and energy in Latin America, East Asia, and Eastern Europe (Briceño-Garmendia, et al., 2004, pp. 20-21). Another estimate suggests that the private sector contributed around 25 percent of total infrastructure investment in developing countries between 1990 and 2005, but less than 10 percent of the investment in Africa (Estache, 2006, p. 2). Private investment in infrastructure declined sharply from 1997 to 1999, after the financial crisis in East Asia (Estache, 2010, p. 73). More recently, private investment commitments in Sub-Saharan African infrastructure increased to $12.8 billion in 2012—a 13 percent increase over 2011 (van Eerd, 2012, p. 1). Telecommunications accounts for most private investment and, in recent years, energy takes second place, followed by transport (van Eerd, 2012, p. 1). Water and sewerage account for a relatively insignificant amount of private investment (van Eerd, 2012, p. 1). Private investment commitments in South Asian infrastructure totaled $181.4 billion in 2012—a 4 percent increase over 2011. Overall, commitments have increased significantly since the mid-1990s. Throughout this period, investment favored energy and telecommunications (Andrés, et al., 2013, p. 14). Water and sewerage again accounted for a relatively insignificant amount of private investment (Verink, 2012, p. 1).

18
Different infrastructure sectors vary in their potential for private participation according to whether a sector provides a private good, club good, public good or common property. These terms define whether sectors are rival or non-rival, and excludable or non-excludable, as shown in Table 6.
Excludable Non-excludable
Rival Private goods Common property
Non-rival Club goods Public goods
Source: World Bank, 1994, p. 25 Note: Non-rival means that “the additional resource cost of another person consuming the good
is zero.” Non-excludable means that to “prevent anyone from consuming the good is either very expensive or impossible.” Both definitions are from Rosen & Gayer, 2014, p. 54.
Table 6 Private, Club, and Public Goods, and Common Property
WDR 1994 classified different sectors according to their low, medium, or high potential for private participation, as shown in Table 7. The following is a truncated version of the table in WDR 1994—the full version is in Appendix C Potential for Private Participation Across Sectors.

19
Potential for competition
Characteristics of good or
service
Potential for cost recovery from user charges
Public service obligation
(equity concerns)
Environmental externalities
Marketability index
Electricity
Thermal generation High (3) Private (3) High (3) Few (3) High (1) 2.6
Distribution Medium (2) Private (3) High (3) Many (1) Low (3) 2.4
Transport
Rural roads Low (1) Public (1) Low (1) Many (1) High (1) 1.0
Water
Urban piped network Medium (2) Private (3) High (3) Many (1) High (1) 2.0
Non-piped systems High (3) Private (3) High (3) Medium (2) High (1) 2.4
Sanitation
Piped sewerage and treatment
Low (1) Club (2) Medium (2) Few (3) High (1) 1.8
On-site disposal High (3) Private (3) High (3) Medium (2) High (1) 2.4
Note: Scores range from 1 (least marketable) to 3 (most marketable). The rightmost column (Marketability index) reflects the overall marketability (potential for private sector engagement), and is an average of the numbers in the other columns. The source does not specify how the scores were assigned.
Source: World Bank, 1994, p. 115
Table 7 Potential for Private Participation across Selected Sectors
Some sectors, such as thermal power generation, port and airport facilities, and non-piped water systems, have a high potential for private participation. Other sectors, such as rural roads, and piped sewerage and treatment, have a low potential for private participation.
20
5.3 Barriers to private investment
Flows of private finance are constrained by a variety of risks and by a lack of investable projects. Regulatory, legal, and political risks Risks for international investors include changes in policies, poor rule of law, civil unrest, and nationalization of assets (Bhattacharya, et al., 2012, p. 13). For example, governments have confiscated, diverted, or expropriated returns from infrastructure investments. Such risks may deter investors in Organisation for Economic Co-operation and Development (OECD) countries from investing in Africa (Collier & Mayer, 2014, p. 4). Because private investors consider political attempts to control tariffs and service standards as a significant risk, there is a substantial literature on the desirability of establishing independent regulation (OECD, 2006, p. 209; Pargal, 2003, p. 4). Yet, to date, no clear causal relationship between the introduction of independent regulators in developing countries, and improvements in infrastructure service delivery, has been identified (Estache, 2006). Regulators themselves can introduce risks, as they may be captured by special interests and impose unbalanced tariffs that harm investors (Gómez-Ibáñez, 2008, p. 25). Investors seek predictability in tariffs, service standards, and other key economic parameters affecting their investment. However, independent regulation is not always required. Long-term contracts without independent regulators, for example, can provide the certainty investors need (Groom, et al., 2006, p. 25). Telecommunications is a good example of a successful infrastructure sector in developing countries that operates with private participation and minimal regulation. It is successful largely because it is not a natural monopoly (Gómez-Ibáñez, 2008, p. 28). Furthermore, telecommunications is a private good, has a high potential for cost recovery from user charges, and has few environmental externalities (World Bank, 1994, p. 115). Other sectors that do not have these characteristics require different approaches. Capital market and macroeconomic risks Economic uncertainty in developing countries can deter investment in infrastructure. Inflation and exchange rates may affect returns to international investors (Bhattacharya, et al., 2012, p. 15). Exchange rates can affect investors’ loan repayments. This can be particularly challenging where a revenue stream is in local currency, as is the case for utilities. Exchange rate fluctuations can also raise the cost of imported inputs (Gray & Irwin, 2003, p. 2). For example, thermal power generation projects that import fuel are especially vulnerable to currency fluctuations (Matsukawa, et al., 2003). Weak local capital markets in Africa seldom provide long-term currency hedges at reasonable rates, making it difficult for investors to protect themselves against currency risks (Collier & Mayer, 2014, p. 8). Global financial markets also influence the flow of private capital to emerging markets. After the 2008 financial crisis, investment flowed to a few large emerging economies in a ‘flight to quality’ (G20, 2011b, p. 12). In addition, weak markets and tighter regulation restricted bank lending (historically the main source of private sector infrastructure financing). Infrastructure investments generally require long repayment periods but pervasive economic uncertainty led to a shortening of available maturities (World Bank, 2014b, p. 2). Refinancing short- and medium-term debt also became more difficult (Briceño-Garmendia & Foster, 2010a, p. 80).

21
The Basel II and Basel III banking rules may also pose barriers to infrastructure investment. The Basel II banking rules of 2004 increased the maximum risk weight for project finance, and thus may increase the cost of capital for project finance. Under Basel I, project finance had a risk weight of 100 percent but, under Basel II, the risk weight can range from 70 percent to 250 percent (Goldman Sachs & Mayer, Brown, Rowe & Maw LLP, 2005). A higher risk weighting means that a bank has to hold more capital against the asset, thus potentially raising the cost of capital, or reducing the amount of the loan (Baker & Wurgler, 2013; Reserve Bank of New Zealand, 2007). The Basel III rules of 2009 may further reduce long-term lending (including to infrastructure) by requiring banks to hold more liquid assets. Some estimate that this could increase the cost of project finance by around 10 basis points (Sheng, 2013; UK Parliament, 2011; Härle, et al., 2010). Few investable projects due to inadequate project development and cost recovery Another set of barriers prevent projects that could be commercially viable—even in low-risk environments—from attracting private finance. There is a lack of potentially viable projects that have been prepared to the ‘investment-ready’ or ‘bankable’ stage (World Bank, 2014a, p. 5; G20, 2011b, p. I; Klein, 2012, p. 9; Inderst & Stewart, 2014, p. 14). An investable project has clear and enforceable legal terms, defined and reasonable risks, and a secure funding source (whether user charges or government payments) that will provide a reasonable risk-adjusted rate of return over the project’s life. As an example, for many years, investors declined to finance power generation facilities in many Indian states. State electricity boards were not financially viable, so payment for power was not assured and, thus, income for investors could not be assured either (Jones, 2006, p. 16). There are at least three barriers to developing investable projects. The first is the lack of government capacity to develop projects (G20, 2011a, pp. 11-12); the second is the difficulty governments have in dealing with projects proposed by private investors (Public-Private Infrastructure Advisory Facility, 2009, p. 81); and the third is the high cost of preparing projects. In low-income countries, the cost of preparing a project can be 10 percent of total project costs, compared to between 0.5 to 1 percent in more developed countries, or in countries with more experience of infrastructure investment. Several facilities support project preparation in Sub-Saharan Africa and South Asia, but recent research has found that fragmentation and lack of economies of scale hamper their effectiveness (G20, 2011a, p. 5). Furthermore, there are insufficient resources for preparing individual projects (G20, 2011a, p. i). Lack of resources or incentives for private developers can be a barrier to developing projects. Some private developers have insufficient capacity to undertake projects in Africa, or lack the financial resources to cover development costs (Infrastructure Consortium for Africa, 2012, p. 49). Developers have to recover the costs of project development from project customers through fees, or from governments or donors (Infrastructure Consortium for Africa, 2012, p. 37). If developers doubt that they will be able to recover costs they have no incentive to develop projects. And, as discussed elsewhere in this report, there are many potential barriers to cost recovery (see Section 4.2 Revenue and Funding for why revenue and funding can be too low, and the rest of this section for risks faced by private investors). Cost of private finance compared to public finance International investors require a premium to compensate for the risks of investing in infrastructure in developing countries. Estimates of the premium vary. One study suggests a

22
premium of between 2 and 6 percent (World Bank, 2014b, p. 5); another proposes that returns on investment in infrastructure in the poorest countries need to be more than double the returns on investment in infrastructure in developed countries (Estache, 2006, p. 4; Estache & Pinglo, 2005). As a result, tariffs for basic services in the poorest countries may need to be higher than in developed countries. The difficulty of making and accepting this argument is, in itself, a barrier to private investment in poorer countries (Gómez-Ibáñez, 2008; Estache, 2006, p. 4).
5.4 Limits on particular sources of private investment
International investors became less willing to invest in infrastructure following the Asian financial crisis in 1997, and the Argentinean and Brazilian currency crises in 2001 to 2002 (Matsukawa, et al., 2003, p. 1). Following these crises, researchers started to examine other possible providers of finance. One strand of investigation looks at institutional investors, such as pension funds, life insurance companies, endowments, and sovereign wealth funds.7 Institutional investors typically seek stable, long-term returns, and diversify their portfolios. Therefore, they seem the type of investor that might finance infrastructure (World Bank, 2014b, p. 2). Another strand of investigation looks at the potential of domestic private investors. Domestic investors may be able to manage certain risks better than international investors (G20, 2011a, p. i). Institutional investors Infrastructure projects could, in theory, attract institutional investors because they provide returns in a low-interest rate environment, steady long-term cash flows, and perform differently to other investments (low correlation with other classes of investment) (World Bank, 2014b, p. 2). However, OECD institutional investors currently have less than 1 percent of their assets invested in emerging market infrastructure (compared to around 10 percent of their assets invested in infrastructure in their own countries) (Inderst & Stewart, 2014, p. 4). Developed economies and emerging markets pose similar obstacles for institutional investors, including political risk, regulatory restrictions, and a lack of investable projects (Inderst & Stewart, 2014, p. 4). However, investors in emerging market infrastructure face greater regulatory and political risks, including expropriation and violent conflict (Inderst & Stewart, 2014, p. 5). While international institutional investors face many of the same macroeconomic risks as other international private investors (see Section 5.3 Barriers to private investment), they also face their own unique set of barriers. Many OECD pension funds are legally required to hold highly rated assets (at least A-). Few infrastructure projects in low-income countries (or fragile middle-income countries) are highly rated. Rating agencies have a rule that says that African projects cannot be rated more highly than the sovereign debt of the country where the project is located. This rule is not applicable to OECD countries and disadvantages potentially promising African projects (Collier & Mayer, 2014, p. 11). Sovereign wealth funds may be discouraged from investing in developing country infrastructure because of risk and liquidity concerns (G20, 2011a, p. 13). Domestic institutional investors may have advantages over foreign institutional investors, such as lower exposure to fluctuations in exchange rates. Domestic institutional investors could contribute to broader development objectives by stimulating local capital markets (Inderst & Stewart, 2014, p. 2). The assets under management by domestic institutional investors are expected to rise from the current $2.5 trillion to $17.4 trillion by 2050 (Inderst & Stewart, 2014,
7 Inderst & Stewart, 2014 lists those as examples of institutional investors.

23
p. 3). Several resource-rich countries in Sub-Saharan Africa, such as Angola, Nigeria, and Chad, have recently set up sovereign wealth funds to invest in infrastructure (World Bank, 2014b, p. 3). To date, however, there are only a few examples of pension funds in Asia or Africa that invest in infrastructure (World Bank, 2014b, p. 3). Domestic investors Local private investment in infrastructure has the potential to overcome some of the barriers that international finance faces (G20, 2011a, p. i). In particular, local investors may be in a better position to assess and manage political and regulatory risks than foreign investors, and may be less affected by exchange rates (G20, 2011a, p. i). There have been notable developments in private financing for infrastructure. In India, the public-private partnership (PPP) highway programme, and in Nigeria, privatization of electricity, are excellent examples (PwC, 2012, p. 11; PwC, 2013, p. 3). However, capital markets in many poor countries lack the depth or liquidity needed for major investments in infrastructure (G20, 2011a, p. i). In Sub-Saharan Africa, bank deposits and other liabilities are generally short term (Briceño-Garmendia & Foster, 2010a, p. 81). Moreover, domestic investors and lenders face political and economic risks (World Bank, 2014b, p. 3), including from fluctuations in foreign exchange rates if they receive capital from abroad, or if projects require significant imports (Estache & Fay, 2007).

24
SECTION 6 Political Economy
The literature strongly suggests that governments have a vital role to play in investment in infrastructure. A country’s political economy (that is to say, how public policy is created and implemented) can be a barrier to effectively providing infrastructure services. Political Economy and Governance The literature on political economy challenges examines incentive structures. Such systems can motivate individuals involved in making decisions to act in ways that are detrimental, rather than beneficial, to overall social welfare (World Bank, 2009a; World Bank, 2009b; Halpern, et al., 2008). In cases where monopolies provide services, it is difficult to ensure that the monopolies are accountable and that services respond to the needs of consumers. This applies to both natural monopolies (such as water and electricity distribution, and local roads where it is most efficient for one supplier to provide services) and legal monopolies (where only a designated entity—usually government-owned—is allowed to provide certain services, such as urban transport or electricity generation). Monopolies supply many infrastructure services and are not held accountable to consumers through the market. Consumers cannot threaten to switch to another provider. Instead, the government has to hold providers accountable to customers. Figure 4 shows this ‘long route of accountability’. Figure 4 The Long Route of Accountability
Source: Halpern, et al., 2008, p. 111. Adapted from the World Development Report 2004
The ‘long route of accountability’ means that on the one hand citizens cannot easily hold politicians accountable for providing services, and that on the other hand politicians cannot easily hold bureaucrats accountable for providing services (Halpern, et al., 2008, p. 9). Widespread information asymmetries make it hard to define reasonable levels of services or
25
costs and, thus, reduce accountability. Moreover, it is difficult to provide government employees with strong performance incentives (World Bank, 1997, p. 86). The mismatch between political and infrastructure-planning cycles further reduces the political incentive to ‘do the right thing’ (Briceño-Garmendia & Foster, 2010a, p. 8). Even quite modest improvements, such as reducing water leakage, or building a new highway or power plant, can take ten years or more to go through all the steps from planning to results (planning, site acquisition, permissions, procurement, and construction). Politicians, however, are accountable in much shorter timeframes—typically, elections take place every four or five years—creating a bias towards short-termism (World Bank, 1997, p. 81). Ineffective political and bureaucratic accountability for performance can lead to rent-seeking by politicians, government employees, and private suppliers. The results of rent-seeking are operating inefficiencies, patronage, and corruption (Halpern, et al., 2008; World Bank, 1994; Construction Sector Transparency Initiative, 2010).8 Initiatives to enact reforms or increase private investment may be resisted because infrastructure service providers controlled by government offer opportunities for rent-seeking—for example, by providing key officials with kickbacks (Halpern, et al., 2008, p. 135). Incumbent commercial utilities may resist regulatory reform to defend vested interests (Brown, et al., 2006). Political economy issues underlie the widespread failure to set tariffs at levels that cover costs (Section 4.2.1 Tariffs discusses cost recovery). In developing countries, a key challenge is that, because raising tariffs can prove politically unpopular, the efforts of service providers to raise tariffs to adequate levels are often thwarted (Groom, et al., 2006, p. 2). In India, for example, political parties that cut electricity subsidies for farmers tend to lose elections to parties that promise to restore subsidies (Nataraj, 2007, p. 5). Political pressure may also be a major reason why utility tariffs in Africa are too low to recover costs (Grey-Johnson, 2006).
6.1 Governance Barriers
A typical definition of corruption is “the abuse of public funds and/or office for private or political gain” (Halpern, et al., 2008, p. 4). Corruption increases the costs of infrastructure in many ways. One study estimated that if African water utilities operated in corruption-free environments, costs could be reduced by 64 percent9 (Halpern, et al., 2008, p. 14). Corruption in awarding construction contracts is rife. A survey of a few bidders for World Bank projects in 2005 found that most experienced bidders expected to have to pay bribes to win projects. Around 40 percent of construction firms expect to give gifts in order to receive a construction permit in Niger, as do nearly 70 percent in India (Kenny, 2007, p. 34). Academic studies of corruption resulting from self-interest of government actors (Shleifer & Vishny, 1993; Boycko, et al., 2006) led to recommending an increase in private provision of infrastructure as a way to reduce corruption (Estache 2006 p.19). Nevertheless, contracting with, and regulating, private firms does not eliminate corruption (Halpern, et al., 2008, chapter 7; World Bank, 2009b, chapters 7-9; Bayliss & Hall, 2000). Reliable empirical data on corruption is
8 See definitions of ‘corruption’, ‘patronage’, and ‘rent-seeking’ in 0.
9 Data originally comes from “Sector Organization, Governance, and the Inefficiency of African
Water Utilities” by Estache and Kouassi, 2002.

26
difficult to find. The evidence available is suggests that there is more corruption under public ownership than under well-regulated private ownership (Clarke & Xu, 2004; Kirkpatrick & Parker, 2004; Estache & Kouassi, 2002; Gulati & Rao, 2007). However, an appropriate regulatory regime—which could include shareholder contracts, commercialization, and corporatization—could focus government-owned utilities on sound commercial management while working towards social objectives (Eberhard, 2007).

27
SECTION 7 Serving the Poor
Poorer people generally have less access to infrastructure services than those who are wealthier (Table 1 ), and rural people generally have less access than urban dwellers.
Electricity (% of quintile with
access)
Water (% of quintile with
access)
Sanitation (% of quintile with
access)
Telephone (% of quintile with
access)
Country Income Poorest 20%
Richest 20%
Poorest 20%
Richest 20%
Poorest 20%
Richest 20%
Poorest 20%
Richest 20%
Low-Income 9.7 68.7 41.1 78.5 27.2 68.8 3.2 24.5
Lower-Middle-Income
79.5 99.3 64.5 86.6 48.2 78.7 21.2 66.1
Upper-Middle-Income
81.4 99.5 76.7 95 73.4 96.4 32 73.1
Source: Estache, 2006, p. 6. Original data from the 2006 Global Monitoring Report.
Table 8 Access to Basic Infrastructure Services (2000-2004, latest observations available)
In low-income countries, nearly 70 percent of the richest quintile of the population and less than 10 percent of the poorest quintile have access to electricity. In Accra, Ghana (a lower middle income country), more than 66 percent of the poorest families share sanitation facilities with over 10 other families (Estache & Fay, 2007, p. 29). Extreme poverty (defined as living on less than $1.25 per day) is prevalent in rural areas in Sub-Saharan Africa and South Asia—in both regions, more than three-quarters of the extremely poor live in rural areas (International Fund for Agricultural Development, 2011). Providing infrastructure in rural areas is particularly challenging as lower population densities raise costs significantly compared to urban areas (Hull, 2013). In Africa, providing infrastructure services in some rural areas can cost ten times as much as providing services in urban areas (Foster & Briceño-Garmendia, 2010b, p. 5). Although the costs of providing services in urban areas are lower than the costs of providing services in rural areas, utility providers are often unable or unwilling to expand services into informal settlements where many of the urban poorest live. The barriers in these circumstances may be a lack of formal land tenure, government reluctance to condone informal settlements, and physical challenges, such as haphazard layout, lack of road access, and overcrowding (Water Utility Partnership for Capacity Building, 2003). The poorest people in developing countries often simply cannot afford to pay full cost-recovery tariffs (Komives, et al., 2005, pp. 37-39). Tariffs in developing countries are generally below the

28
level required to recoup costs and are implicit subsidies. However, the benefits of unrealistic tariffs accrue mostly to the better off (World Bank, 1994, p. 31). Subsidizing an existing utility may help poorer consumers who already have service connections but may not lead to expansion of services to those who do not have connections (Klein, 2012, p. 29). In Sub-Saharan Africa, one study suggested that targeting utility subsidies is so ineffective that simply allocating subsidies randomly would be three times more effective for reaching the poor (Briceño-Garmendia & Foster, 2010a, p. 11). On the other hand, another 2006 survey suggested that targeted subsidies and cross-subsidies have the potential to be effective in helping the poor (Estache 2006 p. 11). Lack of finance is a barrier to access for poorer consumers. Without financing, the costs of connecting to network services can be prohibitively high for the poor (Komives, et al., 2005, p. 162). The very poor may even need financing for relatively inexpensive non-networked solutions, such as solar lanterns (International Finance Corporation, 2012, p. 58). Poor people are seldom consulted about their needs, meaning that policy makers may make decisions based on incomplete information. Appropriate services for the poor are often lacking when decisions on investment and services are driven by assumptions about a ‘needs gap’ rather than by an assessment of effective demand. In the Makete District, in Tanzania, a survey of households’ transport needs identified low-cost improvements that made a project more effective and inclusive (World Bank, 1994, p. 31). Similarly, in Nigeria, community participation has delivered improved outcomes (World Bank, 2014a). Conversely, a review of attempts to improve infrastructure programs through community participation and empowerment found that in some cases these efforts are ineffective or backfire as elites capture the benefits (Ghazala & Rao, 2004; Cornwall, 2003).

29
SECTION 8 Regional Infrastructure
The benefits of regional infrastructure projects can be significant. For example, estimates indicate that trading power regionally in Africa could reduce overall costs by approximately 5 percent, because hydropower could replace more costly thermal power generation (Briceño-Garmendia & Foster, 2010a, p. 149). However, regional infrastructure projects face particular challenges, in addition to those faced by all infrastructure projects. The difficulties of coordinating policies and regulations across countries are a significant barrier for regional infrastructure projects (G20, 2011a, p. 6). For example, South Asia lacks a regional coordinating body (Bhattarcharyay, 2010, p. 14). In Sub-Saharan Africa, there are many regional institutions. But the proliferation of regional institutions can add to complexity, confuse responsibilities, and hinder financing (Briceño-Garmendia & Foster, 2010a, p. 155). Regional projects have high preparation costs. World Bank regional projects cost on average 70 percent more to prepare than non-regional ones. High costs make sourcing funding for preparing projects challenging. Regional projects also take longer to prepare (G20, 2011a, p. 18) and regional loans are rare (Ferroni, 2001). Unnecessary complexity and lack of standardization of contracts across countries or regions may also increase costs (Collier & Mayer, 2014, p. 7). In addition to costs, the size of regional projects may also be a barrier (G20, 2011a, p. ii). The need for coordination between development banks may hinder investment in regional infrastructure (G20, 2011a, p. 16). That said, large regional infrastructure projects, such as the Ruzizi hydropower project in East Africa, have been financed (EU-Africa Infrastructure Trust Fund, 2014).

30
SECTION 9 Conflict-Affected States
States recently affected by conflict, or with on-going conflict, often badly need basic infrastructure, but lack the resources to provide it. In Sub-Saharan Africa, estimates indicate that, to meet developmental goals, fragile, low-income countries require spending on infrastructure (capital and current expenditure) of around 37 percent of GDP. This compares with to 23 percent of GDP for non-fragile low-income countries, and 10 percent for middle-income countries (Briceño-Garmendia & Foster, 2010a, p. 8). The challenges of working in conflict-affected environments discourage both donors and private financiers. In 2008, fragile states received only 11 percent of OECD countries’ official development aid for African infrastructure, and only 15 percent of investment from outside the OECD for African infrastructure (Briceño-Garmendia & Foster, 2010a, p. 67). The public sector in conflict-affected states—especially in the immediate aftermath of conflict—often has little capacity to manage aid (Schwartz, et al., 2004, p. 4). Capacity in administrative, accounting, and procurement systems may be weak. Frail institutions create procurement challenges for donors (Jones & Howarth, 2012, p. iii). Conflict-affected states lacking local capacity to operate or maintain infrastructure may not attract foreign experts who could help build capacity, or help operate or maintain systems (Jones & Howarth, 2012, p. 47). Generally, investors hesitate to invest in long-term assets (such as power, water, and transport infrastructure) after a conflict because of the risks (Schwartz, et al., 2004, p. 16). Small, unregulated private providers often meet a significant part of the demand for services in conflict-affected states, especially for electricity and water (Schwartz, et al., 2004, p. 7). These providers can play a valuable role, but in some cases, government regulations hinder their operations, for example regulations on tariffs or licensing requirements (Schwartz, et al., 2004, p. 23). Flexible regulations can allow small providers to offer services where large providers will not (Baker, 2009, p. 3).

31
Bibliography
Andrés, L., Biller, D. & Herrera Dappe, M. (2013) Reducing Poverty by Closing South Asia's Infrastructure Gap, Washington, D. C.: World Bank.
Baker, J. (2009) Opportunities and Challenges for Small Scale Private Service Providers in Electricity and Water Supply. Washington, DC: World Bank.
Baker, M. & Wurgler, J. (2013) Do Strict Capital Requirements Raise the Cost of Capital? Cambridge: National Bureau of Economic Research.
Banerjee, S. et al. (2008) Access, Affordability, and Alternatives: Modern Infrastructure Services in Africa. Washington, D. C.: World Bank.
Bayliss, K. & Hall, D. (2000) Independent Power Producers: A Review of the Issues. Greenwich, UK: University of Greenwich.
Bhattacharya, A., Romani, M. & Stern, N. (2012) Infrastructure for Development: Meeting the Challenge. London: London Shool of Economics and the G-24.
Bhattarcharyay, B. (2010) Institutions for Asian Connectivity. Tokyo: Asian Development Bank Institute.
Boycko, M., Shleifer, A. & Vishny, R. (2006) 'A Theory of Privatization', The Economic Journal, Issue 106, p309-319.
Briceño-Garmendia, C. & Foster, V. (2010a). Africa’s Infrastructure: A Time for Transformation. Washington, D. C.: World Bank.
Briceño-Garmendia, C. & Foster, V. (2010b). Agritrade.org- Africa's Infrastructure: A Time for Transformation [accessed 26th July 1014]. Available at: http://www.agritrade.org/events/documents/Foster_Infrastructure.pdf
Briceño-Garmendia, C., Estache, A. & Shafik, N. (2004) Infrastructure Services in Developing Countries: Access, Quality, Costs and Policy Reform. Washington, D. C.: World Bank.
Brook, P. & Locussol, A. (2001) 'Easing Tariff Increases: Financing the Transition to Cost-Covering Water Tariffs in Guinea', in Brook, P. & Smith, S. (eds.) (2001) Contracting for Public Services: Output-Based Aid and Its Applications. Washington, D. C.: World Bank, pp. 31-37.
Brown, A., Stern, J., Tenenbaum, B. & Gencer, D. (2006) Handbook for Evaluating Infrastructure Regulatory Systems. Washington, D. C.: The World Bank.
Calderon, C. & Chong, A. (2004) 'Volume and Quality of Infrastructure and the Distribution of Income: An Empirical Investigation', Review of Income and Wealth, 50(1), p87-106.
Campos, J. & Pradhan, S. (2007) The Many Faces of Corruption: Tracking Vulnerabilities at the Sector Level. Washington, D. C.: World Bank.

32
Chatterton, I. & Puerto, O. (2006) Estimation of Infrastructure Investment Needs in the South Asia Region. Washington, D. C.: World Bank.
Clarke, G. & Xu, L. (2004) 'Privatization, Competition and Corruption: How Characteristics of Bribe Takers and Payers Affect Bribes to Utilities', Journal of Public Economics, Volume 9-10, p2067-2097.
Collier, P. & Mayer, C. (2014) Unlocking Private Finance for African Infrastructure. Oxford University.
Construction Sector Transparency Initiative. (2010) Poor Governance in Public Construction Projects. CoST.
Cornwall, A. (2003) 'Whose Voices? Whose Choices? Reflections on Gender and Participatory Development', World Development, 31(8), p1325-1342.
Davis, J. (2003) 'Corruption in Public Service Delivery: Experience from South Asia’s Water and Sanitation Sector', World Development, 32(1), p53-71.
Deloitte India. (2013) Funding the Infrastructure Investment Gap. India: Deloitte India.
Easterly, W. & Servén, L. (2003) The Limits of Stabilization: Infrastructure, Public Deficits, and Growth in Latin America. Washington, D. C.: World Bank.
Eberhard, A. (2007) Infrastructure Regulation in Developing Countries: An Exploration of Hybrid and Transitional Models. Washington, D. C.: Public-Private Infrasructure Advisory Facility.
van Eerd, R. (2012) 2012 Africa PPI Data Update. Washington, D. C.: Public-Private Infrastructure Advisory Facility.
Estache, A. (2010) Infrastructure Finance in Developing Countries. Kiel: Leibniz Information Center for Economics.
Estache, A. (2006) Infrastructure: A Survey of Recent and Upcoming Issues. Washington, D. C.: World Bank.
Estache, A. & Fay, M. (2007) Current Debates on Infrastructure Policy. Washington, D. C.: World Bank.
Estache, A. & Kouassi, E. (2002) Sector Organization, Governance, and the Inefficiency of African Water Utilities. Washington, D. C.: World Bank.
Estache, A., Laffont, J-J. & Zhang, X. (2006) 'Universal Service Obligations in LDCS: The Effect of Uniform Pricing on Infrastructure Access', Journal of Public Economics, Volume 90, p1155-1179.
Estache, A. & Pinglo, M. (2005) 'Are Returns to Private Infrastructure in Developing Countries Consistent with Risks Since the Asian Crisis?', Journal of Network Industries, 6(1), p47-71.
Estache, A. & Wren-Lewis, L. (2009) 'Toward a Theory of Regulation for Developing Countries: Following Jean-Jacques Laffont's Lead', American Economic Association, 47(3), p729-770.

33
EU-Africa Infrastructure Trust Fund. (2014) Ruzizi Hydropower [accessed 14th August 2014]. Available at: http://www.eu-africa-infrastructure-tf.net/activities/grants/ruzizi.htm
Fay, M. & Yepes, T. (2003) Investing in Infrastructure: What is Needed from 2000 to 2010? Washington, D. C.: World Bank.
Ferroni, M. (2001) Regional Public Goods in Official Development Assistance. Washington, D. C.: Inter-American Development Bank.
G20. (2011a) Supporting Infrastructure Development in Low-Income Countries. G20.
G20. (2011b) Infrastructure Needs Assessment. G20.
Ghazala, M. & Rao, V. (2004) 'Community-Based and -Driven Development', World Bank Research Observer, 19(1), p1-40.
Goldman Sachs & Mayer, Brown, Rowe & Maw LLP. (2005) The Basel II Capital [accessed 13th August 2014]. Available at: http://www.securitization.net/publications/article.asp?id=175&aid=4648
Gómez-Ibáñez, J. (2008) Private Infrastructure in Developing Countries: Lessons from Recent Experience. Washington, D. C.: World Bank.
Gray, P. & Irwin, T. (2003) Exchange Rate Risk. Washington, DC: World Bank.
Grey-Johnson, S. (2006) Regulation of Public Utilities in Africa: AFUR a Platform That Advocates for Strong Institutional Governance and Accountability in Africa [accessed 27th August 2014]. Available at: http://sustainabledevelopment.un.org/content/documents/3228afur.pdf
Groom, E., Halpern, J. & Ehrhardt, D. (2006) Explanatory Notes on Key Topics in the Regulation of Water and Sanitation Services. Washington, D. C.: World Bank.
Gulati, M. & Rao, M. (2007) 'Corruption in the Electricity Sector: A Pervasive Scourge', in Edgardo Campos, J. & Pradhan, S. (2007) The Many Faces of Corruption. Washington, D. C.: World Bank, p115-158.
Halpern, J. et al. (2008) Deterring Corruption and Improving Governance in the Urban Water Supply & Sanitation Sector. Washington, D. C.: World Bank.
Härle, P. et al. (2010) Basel III and European Banking: Its Impact, How Banks Might Respond, and the Challenges of Implementation. New York: McKinsey & Company.
Henderson, D. (2008) Rent Seeking [accessed 10th July 2014]. Available at: http://econlib.org/library/Enc/RentSeeking.html
Holder, S. (1998) Privatisation and Competition: the Evidence from Utility and Infrastructure Privatisation in the United Kingdom. Helsinki: Organization for Economic Cooperation and Development.
Hull, M. (2013) Basic Network Utility Economics. London: Professional Economics.

34
Inderst, G. & Stewart, F. (2014) Institutional Investment in Infrastructure in Developing Countries. Washington, D. C.: World Bank.
Infrastructure Consortium for Africa. (2012) Assessment of Project Preparation Facilities for Africa Volume A: Diagnostic and Recommendations. Tunis: African Development Bank.
Infrastructure Finance Working Group. (2012) Infrastructure Finance and Funding Reform. Canberra: Infrastructure Australia.
International Finance Corporation. (2012) From Gap to Opportunity: Business Models for Scaling Up Energy Access. Washington, D. C.: World Bank.
International Fund for Agricultural Development. (2011) Rural Poverty Report 2011 Facts & Figures. Rome: International Fund for Agricultural Development.
Jones, S. (2006) Infrastructure Challenges in East and South Asia. London: Institute of Development Studies/Overseas Development Institute.
Jones, S. & Howarth, S. (2012) Supporting Infrastructure Development in Fragile and Conflict-Affected States: Learning from Experience. London: DFID.
Kariuki, M. & Schwartz, J. (2005) Small-Scale Private Service Providers of Water Supply and Electricity. Washington, D. C.: World Bank.
Kenny, C. (2007) Construction, Corruption, and Developing Countries. Washington, D. C.: World Bank.
Kessides, I. (2004) Reforming Infrastructure: Privatization, Regulation, and Competition. Washington, D. C.: World Bank.
Kingdom, W., Liemberger, R. & Marin, P. (2006) The Challenge of Reducing Non-Revenue Water (NRW) in Developing Countries. Washington, D. C.: World Bank.
Kirkpatrick, C. & Parker, D. (2004) Infrastructure Regulation: Models for Developing Asia. Tokyo: Asian Development Bank Institute.
Klein, M. (2012) Infrastruture Policy. Washington, D. C.: World Bank.
Komives, K., Foster, V., Halpern, J. & Wodon, Q. (2005) Water, Electricity, and the Poor. Washington, D. C.: World Bank.
Laffont, J. (2001) Enforcement, Regulation and Development. Nairobi: African Economic Research Consortium.
Leigland, J. (2010) PPI in Poor Countries. Washington, D. C.: Public-Private Infrastructure Advisory Facility.
Matsukawa, T., Sheppard, R. & Wright, J. (2003) Foreign Exchange Risk Mitigation for Power and Water Projects in Developing Countries. Washington, D. C.: World Bank.

35
Mehta, M., Virjee, K. & Njoroge, S. (2007) Helping a New Breed of Private Water Operators Access Infrastructure Finance. Washington, D. C.: Public-Private Infrastructure Advisory Facility.
Nataraj, G. (2007) Inrastructure Challenges in South Asia: The Role of public-rivate Partnerships. Tokyo: Asian Development Bank Institute.
OECD. (2006) Policy Framework for Investment: A Review of Good Practices. Paris: Organisation for Economic Co-operation and Development.
Pargal, S. (2003) Regulation and Private Sector Investment in Infrastructure: Evidence from Latin America. Washington, D. C.: World Bank.
Pollitt, M. (2004) Electricity Reform in Chile: Lessons for Developing Countries. Cambridge: Center for Energy and Environmental Policy Research.
Public-Private Infrastructure Advisory Facility. (2009) PPIAF Toolkit for PPP in Roads and Highways: Module 5. Washington, D. C.: Public-Private Infrastructure Advisory Facility.
PwC. (2012) The Road Ahead: Highways PPP In India. London: PwC.
PwC. (2013). Privatization in the Power Sector: Navigating the Transition. London: PwC.
Ranganathan, R. & Foster, V. (2011a) COMESA’s Infrastructure:A Continental Perspective. Washington, D. C.: World Bank.
Ranganathan, R. & Foster, V. (2011b) East Africa’s Infrastructure: A Regional Perspective. Washington, D. C.: World Bank.
Ranganathan, R. & Foster, V. (2011c) ECCAS’s Infrastructure: A Regional Perspective. Washington, D. C.: World Bank.
Ranganathan, R. & Foster, V. (2011d) ECOWAS’s Infrastructure:A Regional Perspective. Washington , D. C.: World Bank.
Ranganathan, R. & Foster, V. (2011e) The SADC’s Infrastructure: A Regional Perspective. Washington, D. C.: World Bank.
Reder, M. (2008) 'Chicago School', in Durlauf, S. & Blume, L. (eds.) The New Palgrave Dictionary of Economics. Basingstoke: Palgrave Macmillan.
Reserve Bank of New Zealand. (2007) Capital Adequacy Ratios for Banks- Simplified Explanation and Example of Calculation [accessed 13th August 2014]. Available at: http://people.stern.nyu.edu/igiddy/articles/capital_adequacy_calculation.pdf
Rioja, F. (2003) 'The Penalties of Inefficient Infrastructure', Review of Development Economics, 7(1), p127-137.
Rosen, H. & Gayer, T. (2014) Public Finance. New York: McGraw Hill.

36
Rutherford, M. (2001) 'Institutional Economics: Then and Now', Journal of Economic Perspectives, 15(3), p85-90.
Schwartz, J., Hahn, S. & Bannon, I. (2004) The Private Sector's Role in the Provision of Infrastructure in Post-Conflict Countries. Washington, D. C.: Public-Private Infrastructure Advisory Facility.
Sheng, A. (2013) Asian Banking: Moving Beyond Basel III. Hong Kong: Fung Global Institute.
Shleifer, A. & Vishny, R. (1993) 'Corruption', Quarterly Journal of Economics, Issue 109, p995-1025.
Slack, B. (2014) Rail Deregulation in the United States [accessed 12th July 2014]. Available at: https://people.hofstra.edu/geotrans/eng/ch9en/appl9en/ch9a1en.html
Smith, W. (2000) Regulating Infrastructure for the Poor. London.
Triche, T. (1990) Private Participation in the Delivery of Guinea's Water Supply Services. Washington, D. C.: World Bank.
Tullock, G. (2008) 'Public Choice', in: Durlauf, S. & Blume, L. (eds.) (2008) The New Palgrave Dictionary of Economics. London: Palgrave Macmillan.
UK Parliament. (2011) DfID's Role in Building Infrastructure in Developing Countries [accessed 14th August 2014]. Available at: http://www.publications.parliament.uk/pa/cm201012/cmselect/cmintdev/848/848vw05.htm
United Nations Development Programme. (2006) Human Development Report 2006. New York: United Nations Development Programme.
Verink, B. (2012) 2012 South Asia PPI Data Update. Washington, D. C.: Public-Private Infrastructure Advisory Facility.
Water Utility Partnership for Capacity Building. (2003) Better Water and Sanitation for the Urban Poor. Kenya: European Community and Water Utility Parternship for Capacity Building.
World Bank. (forthcoming (b)) South Asia Water: Overview Chapter. Washington, D. C.: World Bank.
World Bank. (2014a) Nigeria Community Based Poverty Reduction Project [accessed 12th July 2014]. Available at: http://go.worldbank.org/Z7TXRA3UR0
World Bank. (2014b) Practical Solutions and Models for Addressing Obstacles to Institutional Investment in Infrastructure in Developing Countries. Washington, D. C.: World Bank.
World Bank. (2009a) Deterring Corruption and Improving Governance in Road Construction and Maintenance. Washington, D. C: World Bank.
World Bank. (2009b) Deterring Corruption and Improving Governance in the Electricity Sector, Washington, D. C.: World Bank.

37
World Bank. (1997) World Development Report 1997. Washington, D. C.: World Bank.
World Bank. (1994) World Development Report 1994. Washington, D. C.: The World Bank.
World Development Indicators. (2014) World Bank Data, Washington, D. C.: World Bank.

38
Suggested Further Reading
Agarwal, M., Alexander, I. & Tenenbaum, B. (2003) The Delhi Electricity Discom Privatizations: Some Observations and Recommendations For Future Privatizations in India and Elsewhere. Washington, D. C.: World Bank.
Arrow, K. (1963) Social Choice and Individual Values. New York: Wiley.
Castalia. (2009) Measuring, Understanding, and Stopping Corruption in Construction. Washington, D. C.: Castalia.
Choe, K., Varley, R. & Bijlani, H. (1996) Coping with Intermittent Water Supply: Problems and Prospects. Washington, D. C.: US Agency for International Development.
Construction Sector Transparency Initiative. (2014) Construction Sector Transparency Initiative [accessed 13th July 2014]. Available at: http://www.constructiontransparency.org/home
Crawford, I. (1997) Marketing Research and Information Systems. Rome: United Nations Food and Agriculture Organization.
Department for International Development. (2014) Sharpening Incentives to Perform: DFID's Strategy for Payment by Results. London: Department for International Development.
Department of Infrastructure and Transport. (2013) National Public Private Partnership Guidelines Volume 5: Discount Rate Methodology Guidance. Canberra: Department of Infrastructure and Transport.
Eberhard, A. et al. (2008) Underpowered: The State of the Power Sector in Sub-Saharan Africa. Washington, D. C.: World Bank.
Estache, A. & Iimi, A. (2011) 'Quality or Price? Evidence from ODA-Financed Public Procurement', Public Finance Review, 40(435), p435-469.
Estache, A. & Wren-Lewis, L. (2012) Supranational Infrastructure Regulation: Institutional Opportunities and Challenges. Brussels: European Center for Advanced Research in Economics and Statistics.
Gassner, K., Popov, A. & Pushak, N. (2007) An Empirical Assessment of Private Sector Participation in Electricity and Water Distribution in Developing and Transition Countries. Washington, DC: World Bank.
Global Partnership for Output-Based Aid. (2014) What is OBA? [accessed 17th July 2014]. Available at: https://www.gpoba.org/what-is-oba [Accessed 17 July 2014].
Gunatilake, H., Maddipati, N. & Patail, S. (2012) Willingness to Pay for Good Quality, Uninterrupted Power Supply in Madhya Pradesh, India. Manila: ADB.
Izaguirre, A. & Kulkarni, P. (2011) Indentifying Main Sources of Funding for Infrastructure Projects with Private Parcticipation in Developing Countries: A Pilot Study. Washington, D. C.: Public-Private Infrastructure Advisory Facility.
39
Jenkins, M. et al. (2011) Household Participation, Satisfaction, Usage and Investment in an OBA Sanitation Program to Increase Uptake of Hygienic Facilities Among the Rural Poor in Central Vietnam [accessed 24th July 2014]. Available at: http://www.watershedasia.org/wp-content/watershed_resources/Research_and_TA_Docs/EMW_OBA_San_Poster_UNC-2011.pdf
Kenny, C. (2006) Measuring and Reducing the Impact of Corruption in Infrastructure. Washington, D. C.: World Bank.
Kimberley, M. (2012) Independent Evaluation of Water and Sanitation Hibah- Management Response. Barton, Australia: Department of Foreign Affairs and Trade.
Lovei, L. & McKechnie, A. (2000) 'The Costs of Corruption for the Poor', in ESMAP. (2000) Energy Services for the World's Poor. Washington, D. C.: World Bank, p68-74.
Niskanen, W. (1971) Bureaucracy and Representative Government. Chicago: Aldine Atherton.
Pearson, M. (2010) Results-Based Aid and Results-Based Financing: What Are They? Have They Delivered Results? London: HLSP Institute.
Plummer, J. (2006) Making Anti-Corruption Approaches Work for the Poor: Issues for Consideration in the Development of Pro-poor Anti-Corruption Strategies in Water Services and Irrigation. Stockholm: Swedish Water House.
Ringskog, K., Hammond, M. & Locussol, A. (2006) Using Management and Lease-Affermage Contracts for Water Supply. Washington, D. C.: Public-Private Infrastructure Advisory Facility.
Schumpeter, J. (1961) The Theory of Economic Development. Oxford: Oxford University Press.
Schumpeter, J. (1947) Capitalism, Socialism, and Democracy. New York: Harper & Brothers.
Shughart, W. (2008) Concise Encyclopedia of Economics. Indianapolis: Library of Economics and Liberty.
Smith, A. (2004) The Wealth of Nations. New York: Bantam Classics.
Stigler, G. (1971) 'The Theory of Economic Regulation', The Bell Journal of Economics and Management, 2(1), p3-21.
Sundet, G. (2004) Public Expenditure and Service Delivery Monitoring in Tanzania. Washington, D. C.: United States Agency for International Development.
Transparency International. (2002) Corruption in South Asia: Insights & Benchmarks from Citizen Feedback Surveys in Five Countries. Berlin: Transparency International.
UK Treasury. (2011) The Green Book: Appraisal and Evaluation in Central Government. London: UK Treasury.
United Nations Children's Fund. (2014) Community Takes Lead in Making Gadri Open Defecation Free [accessed 20th July 2014]. Available at: http://www.unicef.org/india/reallives_8712.htm
40
Varian, H. (2010) Intermediate Microeconomics: A Modern Approach. 8th ed. New York: W.W. Norton & Company.
WASH Cluster Philippines. (2014) Bohol Earthquake—WASH Cluster Response Bulletin, March April 2014 [accessed 28th July 2014]. Available at: http://reliefweb.int/sites/reliefweb.int/files/resources/WASH%20Cluster%20Bohol%20Bulletin%20%233.pdf
Water and Sanitation Program. (1999) Water for India's Poor. Washington, D. C.: World Bank.
World Bank. (forthcoming (a)). Nepal Rural Water Supply and Sanitation Sector Study. Washington, D. C.: World Bank.
World Bank Institute & Public-Private Infrastructure Advisory Facility, 2012. Public-Private Partnerships Reference Guide, Washington, D. C.: World Bank.
World Bank and the International Finance Corporation. (2014) Enterprise Surveys [accessed 12th July 2014]. Available at: http://www.enterprisesurveys.org

41
Appendix A Details of Infrastructure Investment Gaps
This Appendix contains a detailed breakdown of the investment in infrastructure needed in Sub-Saharan Africa (Table A.1) and South Asia (Table A.2). The tables give estimated sums. A checkmark means that while the amount of investment for an item was not clear in the report in which it originally appeared, that item is still included in the estimate. A dash means that an item was not included in the estimate. If a cell is blank, then it was not clear whether an estimate included the item or not.
Source: Battarchaya, et al., 2012 Briceño-Garmendia &
Foster, 2010 Fay and Yepes, 2003
Period: 2013-2020 2006-2015 2005-2010
Number of years: 7 9 5
Units: $US billion, 2008 $US billion, 2005 $US billion (based on average GDP deflator
2005-2010)
Low High
Electricity 26.7 3.3
Of which new capacity
Of which renewal
Generation
Of which new capacity
Of which renewal
Transmission
Of which new capacity
Of which renewal
Distribution
Of which new capacity
Of which renewal
Transportation 8.8 4.2
Of which new capacity
Of which renewal
Airports

42
Source: Battarchaya, et al., 2012 Briceño-Garmendia &
Foster, 2010 Fay and Yepes, 2003
Period: 2013-2020 2006-2015 2005-2010
Number of years: 7 9 5
Units: $US billion, 2008 $US billion, 2005 $US billion (based on average GDP deflator
2005-2010)
Low High
Of which new capacity
Of which renewal
Ports
Of which new capacity
Of which renewal
Rails 0.10
Of which new capacity
Of which renewal
Roads 4.1
Of which new capacity
Of which renewal
Telecommunications 7.0 3.8
Of which new capacity
Of which renewal
Landlines 0.54
Of which new capacity
Of which renewal
Mobiles 3.3
Of which new capacity
Of which renewal
Broadband -
Of which new capacity -
Of which renewal -

43
Source: Battarchaya, et al., 2012 Briceño-Garmendia &
Foster, 2010 Fay and Yepes, 2003
Period: 2013-2020 2006-2015 2005-2010
Number of years: 7 9 5
Units: $US billion, 2008 $US billion, 2005 $US billion (based on average GDP deflator
2005-2010)
Low High
Water and Sanitation 14.9 2.0
Of which new capacity
Of which renewal
Water 0.7
Of which new capacity
Of which renewal
Sanitation 1.3
Of which new capacity
Of which renewal
Solid Waste - -
Irrigation 2.9 -
Total 90 345 60.3 13.3
Of which new capacity
Of which renewal
Table A.1: Annual Infrastructure Investment Need in Sub-Saharan Africa (Detailed)
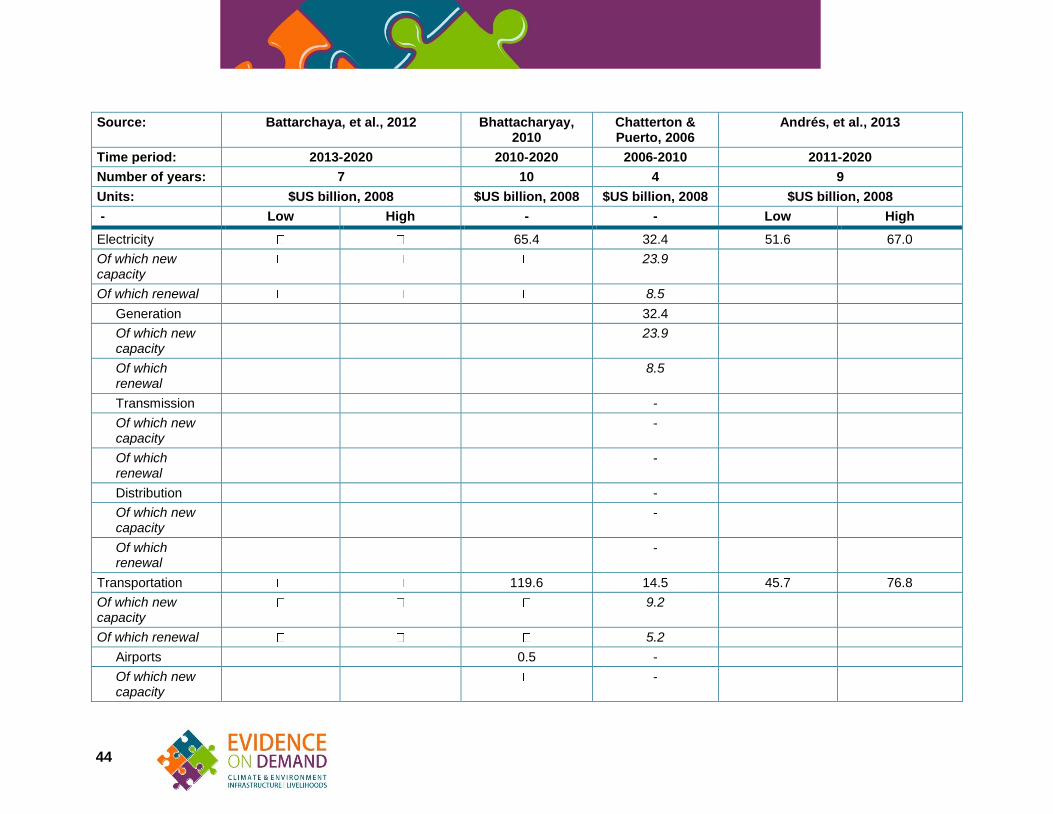
44
Source: Battarchaya, et al., 2012 Bhattacharyay, 2010
Chatterton & Puerto, 2006
Andrés, et al., 2013
Time period: 2013-2020 2010-2020 2006-2010 2011-2020
Number of years: 7 10 4 9
Units: $US billion, 2008 $US billion, 2008 $US billion, 2008 $US billion, 2008
- Low High - - Low High
Electricity 65.4 32.4 51.6 67.0
Of which new capacity
23.9
Of which renewal 8.5
Generation 32.4
Of which new capacity
23.9
Of which renewal
8.5
Transmission -
Of which new capacity
-
Of which renewal
-
Distribution -
Of which new capacity
-
Of which renewal
-
Transportation 119.6 14.5 45.7 76.8
Of which new capacity
9.2
Of which renewal 5.2
Airports 0.5 -
Of which new capacity
-

45
Source: Battarchaya, et al., 2012 Bhattacharyay, 2010
Chatterton & Puerto, 2006
Andrés, et al., 2013
Time period: 2013-2020 2010-2020 2006-2010 2011-2020
Number of years: 7 10 4 9
Units: $US billion, 2008 $US billion, 2008 $US billion, 2008 $US billion, 2008
- Low High - - Low High
Of which renewal
-
Ports 3.6 -
Of which new capacity
-
Of which renewal
-
Rails 1.3 8.5
Of which new capacity
5.9
Of which renewal
2.6
Roads (only paved for Chatterton)
114.2 6.0
Of which new capacity
3.3
Of which renewal
2.7
Telecommunications
43.6 34.8 19.0 27.6
Of which new capacity
27.8
Of which renewal 7.0
Landlines 0.7 32.5
Of which new capacity
26.5
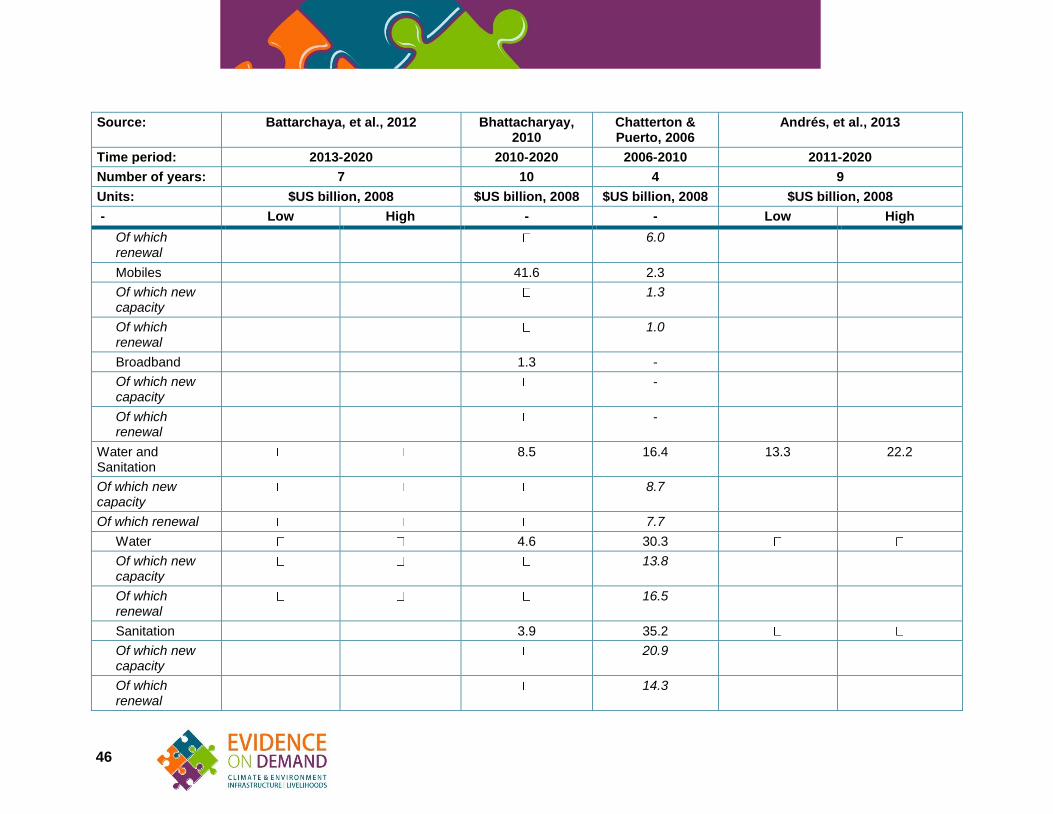
46
Source: Battarchaya, et al., 2012 Bhattacharyay, 2010
Chatterton & Puerto, 2006
Andrés, et al., 2013
Time period: 2013-2020 2010-2020 2006-2010 2011-2020
Number of years: 7 10 4 9
Units: $US billion, 2008 $US billion, 2008 $US billion, 2008 $US billion, 2008
- Low High - - Low High
Of which renewal
6.0
Mobiles 41.6 2.3
Of which new capacity
1.3
Of which renewal
1.0
Broadband 1.3 -
Of which new capacity
-
Of which renewal
-
Water and Sanitation
8.5 16.4 13.3 22.2
Of which new capacity
8.7
Of which renewal 7.7
Water 4.6 30.3
Of which new capacity
13.8
Of which renewal
16.5
Sanitation 3.9 35.2
Of which new capacity
20.9
Of which renewal
14.3

47
Source: Battarchaya, et al., 2012 Bhattacharyay, 2010
Chatterton & Puerto, 2006
Andrés, et al., 2013
Time period: 2013-2020 2010-2020 2006-2010 2011-2020
Number of years: 7 10 4 9
Units: $US billion, 2008 $US billion, 2008 $US billion, 2008 $US billion, 2008
- Low High - - Low High
Solid Waste - - 4.3 8.7
Of which new capacity
Of which renewal
Irrigation - - 18.1 27.1
Of which new capacity
Of which renewal
Total 360 575 237.1 98.1 152.0 229.3
Of which new capacity
69.7
Of which renewal 28.4
Table A.2: Annual Infrastructure Investment Need in South Asia (Detailed)

48
Appendix B Regional Infrastructure Spending Need in Africa
This Appendix contains country-by-country breakdowns of the investment needed for regional infrastructure in Africa, as shown in Table B.3. The amounts in the table are estimated. A blank box means that the sources lacked information on that item.
Transport Telecommunication Power All Sectors
Investment O&M Investment O&M Investment O&M Investment O&M Total
Africa 756 856 30.99 0.35 4746 512 5532.99 1368.4 6901
Angola 34 36 2 0 88 124 36 160
Benin 2 8 2 8 10
Botswana 12 23 9 21 23 44
Burkina Faso 3 15 0.59 0.03 4 15.03 19
Burundi 1 3 0 0 1 2 3 5
Cameroon 34 27 268 25 302 52 354
Central African Republic
44 18 1 0 45 18 63
Chad 74 22 74 22 96
Congo, Dem. Rep 139 69 5 0 748 892 69 961
Congo, Rep. 13 13 1 0 15 29 13 42
Cote d'Ivoire 3 18 0.25 0.01 27 31 18 49
Equatorial Guinea 0 0 1 1 0 1
Ethiopia 23 34 1 0 1,008 98 1,032 132 1,164
Gabon 12 8 2 4 0 18 8 26
Gambia, The 1 1 7 1 8 9
Ghana 9 20 0.31 0.02 5 14 20.02 34
Guinea 28 24 0.78 0.04 786 80 815 104.04 919
Guinea-Bissau 2 5 0.55 0.03 5 8 5.03 13
Kenya 17 27 2 0 3 22 27 49
Lesotho 0 0 0 0 0 0 0
Liberia 10 6 1.03 0.05 2 13 6.05 19
Madagascar 15 23 2 0 17 23 40

49
Transport Telecommunication Power All Sectors
Investment O&M Investment O&M Investment O&M Investment O&M Total
Malawi 2 11 1 0 1 5 11 16
Mali 24 16 26 50 16 66
Mauritania 14 5 1 15 5 20
Mauritius 0 0 0 0 0 0 0 0
Mozambique 14 36 0 0 216 229 36 265
Namibia 37 34 30 67 34 101
Niger 9 18 2.36 0.12 1 12 18.12 30
Nigeria 21 72 0.24 0.01 2 137 23 209.01 232
Rwanda 1 2 1 0 59 61 2 63
Senegal 8 19 3 11 19 30
Seychelles 0 0 0
Sierra Leone 7 5 0.88 0.04 8 5.04 13
South Africa 11 79 0 0 2 14 79 93
Sudan 65 42 2 0 1,032 52 1,099 94 1,193
Swaziland 11 26 0 0 0 11 26 37
Tanzania 28 32 3 0 44 104 75 136 211
Togo 0 2 0 2 2
Uganda 14 16 0 0 145 9 159 25 184
Zambia 10 34 141 151 34 185
Zimbabwe 4 7 1 0 73 78 7 85
Source: Ranganathan & Foster, 2011a; 2011b; 2011c; 2011d; 2011e
Table B.3: Regional Infrastructure Spending Need in Africa, 2006-2015 (Annual, $ billion, 2005 dollars)

50
Appendix C Potential for Private Participation Across Sectors
Potential for competition
Characteristics of good or service
Potential for cost recovery
from user charges
Public service obligation
(equity concerns)
Environmental externalities
Marketability index
Telecommunication
Local services Medium (2) Private (3) High (3) Medium (2) Low (3) 2.6
Long distance and value-added
High (3) Private (3) High (3) Few (3) Low (3) 3.0
Electricity and gas
Thermal generation High (3) Private (3) High (3) Few (3) High (1) 2.6
Transmission Low (1) Club (2) High (3) Few (3) Low (3) 2.4
Distribution Medium (2) Private (3) High (3) Many (1) Low (3) 2.4
Gas production, transmission
High (3) Private (3) High (3) Few (3) Low (3) 3.0
Transport
Rail bed and stations Low (1) Club (2) High (3) Medium (2) Medium (2) 2.0
Rail freight and passenger services
High (3) Private (3) High (3) Medium (2) Medium (2) 2.6
Urban bus High (3) Private (3) High (3) Many (1) Medium (2) 2.4
Urban rail High (3) Private (3) Medium (2) Medium (2) Medium (2) 2.4
Rural roads Low (1) Public (1) Low (1) Many (1) High (1) 1.0
Primary and secondary roads
Medium (2) Club (2) Medium (2) Few (3) Low (3) 2.4
Urban roads Low (1) Common property (2) Medium (2) Few (1) High (l) 1.8
Port and airport facilities
Low (1) Club (2) High (3) Few (3) High (1) 2.0
Port and airport services
High (3) Private (3) High (3) Few (3) High (1) 2.6
Water
Urban piped network Medium (2) Private (3) High (3) Many (1) High (1) 2.0

51
Potential for competition
Characteristics of good or service
Potential for cost recovery
from user charges
Public service obligation
(equity concerns)
Environmental externalities
Marketability index
Non-piped systems High (3) Private (3) High (3) Medium (2) High (1) 2.4
Sanitation
Piped sewerage and treatment
Low (1) Club (2) Medium (2) Few (3) High (1) 1.8
Condominial sewerage
Medium (2) Club (2) High (3) Medium (2) High (1) 2.0
On-site disposal High (3) Private (3) High (3) Medium (2) High (1) 2.4
Waste
Collection High (3) Private (3) Medium (2) Few (3) Low (3) 2.8
Sanitary disposal Medium (2) Common property (2) Medium (2) Few (3) High (1) 2.0
Irrigation
Primary and secondary networks
Low (1) Club (2) Low (1) Medium (2) High (1) 1.4
Tertiary (on-farm) Medium (2) Private (3) High (3) Medium (2) Medium (2) 2.4
Note: Scores range from 1 (least marketable) to 3 (most marketable). The rightmost column (Marketability index) reflects the overall marketability (potential for private sector engagement), and is an average of the numbers in the other columns. The source does not specify how the scores were assigned.
Source: World Bank, 1994, p. 115
Table C.4: Potential for Private Participation across Sectors (Complete)

52
Appendix D Glossary
Explanations of some key terms in this report follow.
Access Gap means the percent of the population or the number of people who do not have access to an infrastructure service. For example, 30 percent of the population of Sub-Saharan Africa (60 million people) does not have access to improved sanitation (Section 3.1 Sub-Saharan Africa).
Corruption, according to the World Bank, means “the abuse of public funds and/or office for private or political gain.” Abuse means breaking written or unwritten rules in the conduct of public office. Interest group politics that stays within the rules is not corruption (Halpern, et al., 2008, p. 4).
Cost-Recovery Tariffs mean fees for utility services that cover all costs, including both capital costs, and operations and maintenance (O&M) costs.
Financial Gap means the difference between Investment Need (see below) and the Financing (see below) likely to be available. The Financial Gap indicates financing that it is unlikely to be available under a business-as-usual scenario.
Financing6 means providing money now in the expectation that it will be returned in the future (usually with interest or profits). Financing is generally used to build new assets. The Infrastructure Finance Working Group stresses that “…financing [which] refers to the way in which debt and/or equity is raised for the delivery and operation of an infrastructure project” (Infrastructure Finance Working Group, 2012, p. 3).
Funding10 means providing money to cover the costs of providing a service. Money can come from tariffs or government revenues. Governments do not expect funding to be repaid. The Infrastructure Finance Working Group stresses that “It is important to differentiate between financing and funding. The term funding, as used in this report, refers to how infrastructure is paid for. Ultimately, there are only two sources of funding for infrastructure, government investment or direct user charges. This is opposed to financing which refers to the way in which debt and/or equity is raised for the delivery and operation of an infrastructure project” (Infrastructure Finance Working Group, 2012, p. 3).
Investment Need is the amount of capital expenditure needed to meet a goal. This is the total capital expenditure needed, irrespective of the availability of financing (see above).
Patronage is support from an influential guardian. Often that support takes the form of jobs or work contracts. Patronage is not based on merit or competition (Halpern, et al., 2008, p. 157).
Rent-seeking means pursuing economic gains through politics. Rent-seeking is a loss to the economy as a whole, because expenditures on influencing political actors (such as lobbying campaigns) are a cost that reduce the value generated by the economic activity that the lobbying was related to (Henderson, 2008).
South Asia includes: Afghanistan, Bangladesh, Bhutan, India, Maldives, Nepal, Pakistan, and Sri Lanka.
10
Professor Jean-Paul Rodrigue of Hofstra University has a website with a useful discussion of funding and financing: https://people.hofstra.edu/geotrans/eng/ch7en/appl7en/ch7a2en.html

53
Sub-Saharan Africa includes: Angola, Benin, Botswana, Burkina Faso, Burundi, Cameroon, Cabo Verde, Central African Republic, Chad, Comoros, Congo, Democratic Republic of the Congo, Republic of the Congo, Côte d'Ivoire, Eritrea, Ethiopia, Gabon, The Gambia, Ghana, Guinea, Guinea-Bissau, Kenya, Lesotho, Liberia, Madagascar, Malawi, Mali, Mauritania, Mauritius, Mozambique, Namibia, Niger, Nigeria, Rwanda, Sao Tome and Principe, Senegal, Seychelles, Sierra Leone, Somalia, South Africa, South Sudan, Sudan, Swaziland, Tanzania, Togo, Uganda, Zambia, and Zimbabwe