Banks in Tax Havens: First Evidence based on Country-by ... · PDF filelow tax rates are not...
60
EUROPEAN ECONOMY Economic and Financial Affairs ISSN 2443-8022 (online) Vincent Bouvatier, Gunther Capelle- Blancard and Anne-Laure Delatte DISCUSSION PAPER 055 | JULY 2017 Banks in Tax Havens: First Evidence based on Country-by-Country Reporting EUROPEAN ECONOMY FELLOWSHIP INITIATIVE “Challenges to Integrated Markets”
Transcript of Banks in Tax Havens: First Evidence based on Country-by ... · PDF filelow tax rates are not...

EUROPEAN ECONOMY
Economic and Financial Affairs
ISSN 2443-8022 (online)
Vincent Bouvatier Gunther Capelle-Blancard and Anne-Laure Delatte
DISCUSSION PAPER 055 | JULY 2017
Banks in Tax Havens First Evidence based on Country-by-Country Reporting
EUROPEAN ECONOMY
FELLOWSHIP INITIATIVE ldquoChallenges to Integrated Marketsrdquo
2017 Fellowship Initiative Papers are written by external experts commissioned to write research papers retaining complete academic independence contributing to the discussion on economic policy and stimulating debate
The views expressed in this document are therefore solely those of the author(s) and do not necessarily represent the official views of the European Commission
Authorised for publication by Mary Veronica Tovšak Pleterski Director for Investment Growth and Structural Reforms
DG ECFINs Fellowship Initiative 2016-2017 Challenges to integrated markets culminates and comes to a successful conclusion with the publication of the fellows contributed papers in our Discussion paper series Against the background of increasing strains to economic integration at both the global and the European level the Initiative has brought together a group of outstanding scholars to re-examine integration challenges at the current juncture and to explore the policy options to address these challenges in a discursive interaction process between the group of fellows and Commission services The research themes of the fellows have spanned a broad area including topics in the political economy of globalisation and integration issues of macroeconomic policy making at the zero lower interest rate bound and market integration challenges not least in view of deepening EMU
LEGAL NOTICE Neither the European Commission nor any person acting on its behalf may be held responsible for the use which may be made of the information contained in this publication or for any errors which despite careful preparation and checking may appear This paper exists in English only and can be downloaded from httpseceuropaeuinfopublicationseconomic-and-financial-affairs-publications_en
Europe Direct is a service to help you find answers to your questions about the European Union
Freephone number ()
00 800 6 7 8 9 10 11 () The information given is free as are most calls (though some operators phone boxes or hotels may charge you)
More information on the European Union is available on httpeuropaeu
Luxembourg Publications Office of the European Union 2017
KC-BD-17-055-EN-N (online) KC-BD-17-055-EN-C (print) ISBN 978-92-79-64901-1 (online) ISBN 978-92-79-64902-8 (print) doi1027650070 (online) doi102765958164 (print)
copy European Union 2017 Reproduction is authorised provided the source is acknowledged For any use or reproduction of photos or other material that is not under the EU copyright permission must be sought directly from the copyright holders
European Commission Directorate-General for Economic and Financial Affairs
Banks in Tax Havens First Evidence based on Country-by-Country Reporting Vincent Bouvatier Gunther Capelle-Blancard and Anne-Laure Delatte Abstract Since the Great Financial Crisis several scandals have exposed a pervasive light on banks presence in tax havens Taking advantage of a new database this paper provides a quantitative assessment of the importance of tax havens in international banking activity Using comprehensive individual country-by-country reporting from the largest banks in the European Union we provide several new insights 1) Tax havens attract large extra banking activity beyond the standard factors based on gravity equations 2) For EU banks the main tax havens are located within Europe Luxembourg Isle of Man and Guernsey rank at the top of the foreign affiliates 3) Attractive low tax rates are not sufficient to drive extra activity 4) High quality of governance is not a driver but banks avoid countries with weakest governance 5) Banks also avoid the most opaque countries 6) The tax savings for EU banks is estimated between EUR 1 billion and EUR 36 billion JEL Classification F3 G3 G21 H22 H3 L8 Keywords Tax Havens Banks Commercial Presence Gravity models Country-by-Country Reporting Acknowledgements The authors thank Dhammika Dharmapala Jezabel Couppey-Soubeyran Shyam Sunder Michael Troege Farid Toubal Gabriel Zucman and the seminar participants of Princeton University EU seminar CEPII EU Policy Network University of Buenos Aires as well as Manon Aubry and Thomas Dauphin from Oxfam for helpful discussions They also gratefully acknowledge Mona Barake and Pranav Garg for excellent research assistance This research has benefited from the support of Research fellowships 2016-2017 with reference 2016 ECFIN 013B Contact Vincent Bouvatier University Paris Nanterre La Deacutefense (EconomiX) 200 Avenue de la Reacutepublique 92001 Nanterre France vbouvatieru-paris10fr Gunther Capelle-Blancard University Paris 1 Pantheacuteon-Sorbonne (Centre dEacuteconomie de la Sorbonne) Labex ReFi (Financial Regulation Lab) amp Paris School of Business 106-112 Bd de lHocircpital 75647 Paris Cedex 13 France gunthercapelle-blancarduniv-paris1fr Anne-Laure Delatte CNRS CEPR corresponding author annelauredelattecepiifr
EUROPEAN ECONOMY Discussion Paper 055
Increased transparency regarding the activities of institutions and in particular regard-
ing prots made taxes paid and subsidies received is essential for regaining the trust
of citizens of the Union in the nancial sector Mandatory reporting in that area can
therefore be seen as an important element of the corporate responsibility of institutions
towards stakeholders and society Recital (52) to CRD IV
1 Introduction
In the aftermath of the Great Financial Crisis several scandals have exposed a pervasive light on
the presence of banks in tax havens (UBS 2008 Oshore leaks 2013 Luxleaks 2014 Swissleaks
2015 Panama Papers 2016) The leaks documented global banks intermediation role in setting
up shell companies foundations and trusts to ease tax avoidance for their clients While the topic
made headlines there is little academic evidence about banks in tax havens It can be very dicult
to document and quantify banking activity in tax havens mostly due to the obvious lack of data
In addition there is also a methodological issue to assess how much these banks activity in tax
havens are merely due to tax evasion and other related perks For example Luxembourg which
is included in most tax havens lists ranks rst in GDP per capita worldwide is located in the
core of the European Union and benets from very large and sophisticated nancial infrastructures
Attributing the whole presence of banks in Luxembourg to tax havens related motives is misleading
In order to gauge the role played by banks in facilitating tax and transparency avoidance we need
to disentangle standard from tax havens related factors This is the main objective of this paper
At stake is whether a more stringent regulation of banks activity in tax havens can reduce tax
evasion and money laundering or if it risks the seizure of international nancial transactions
So far measuring the size of oshore banking in tax havens was impeded by a lack of information
exchange by several jurisdictions The attention of G-20 leaders in 2012 the OECD and the
3
European Union ongoing eorts and NGO initiatives have successfully reversed the trend and pushed
the transparency agenda Since 1 January 2015 all European banks regarded as global systemically
important institutions are required to publicly disclose country-by-country data as stipulated by
the Capital Requirements Directive (CRD) IV of the EU1 This paper precisely exploits newly
published data to assess the role of tax havens in international banking
This new data are individual regulatory and comprehensive a fact that allows us to address
certain limitations of previous research So far papers based on rm-level data only consider non-
nancial multinational enterprises (MNEs) often focus one country and with some commercial
less reliable sources2 For aggregate data the only available source so far is a restricted dataset
from the BIS to which total of 40 jurisdictions report banking statistics For certain reporting
countries however the breakdown of liabilities on counterpart countries is known by the BIS but
remains condential it implies that deposits cannot be constructed for these destination countries
(Bahamas Bermuda Cayman Islands to mention a few) In contrast the CRD IV requires all the
largest banks to report activity in every single jurisdiction where they have a commercial presence
In other words for the rst time we work on a dataset covering the location choices of banks at
the individual level without missing data
We combine two dierent strands of the international nance literature First to isolate the
specic weight of tax havens we need to control for structural factors of international bank activ-
ity To do so we draw from the gravity literature applied to nancial transactions This literature
emphasizes the in13uence of bilateral dierences of information and bilateral institutional linkages
on international banking activity (Portes et al (2001) Portes and Rey (2005) Martin and Rey
1In particular in 2013 the OECD has adopted the Base Erosion and Prot Shifting (BEPS) Action Plan as partof larger eorts to promote transparency This plan has been endorsed by the G20 Finance Ministers in October2015 and several countries are moving forward including the UK Australia Spain In 2016 the EU AccountingDirective (Chapter 10) also proposed a public CbCR for large MNEs which are EU-parented or have EU subsidiariesOther initiatives are currently under discussions for rms in the extractive sector (eg Dodd Frank Act Section1504 the Extractive Industries Transparency Initiative) For now the most fully developed CbCR applies to theEuropean banks
2A popular source is Amadeus database compiled by the Bureau van Dijk
4
(2004) and Okawa and van Wincoop (2012)) We use the well-documented result that bilateral
transactions rise proportionately with the economic size of both countries (mass) and are neg-
atively correlated with frictions (resistance) to quantify the amount of foreign aliates activity
predicted by standard factors Second we draw from the literature on tax-motivated activity of
MNEs to include tax havens in the analysis of oshore banking Which countries are tax havens
What is the most appropriate measure of tax rate faced by MNEs Are investors sensible to other
legal economic and political conditions beyond tax dierences across jurisdictions The seminal
works of Hines and Rice (1994) and more recent works by Bartelsman and Beetsma (2003) and
Dharmapala and Hines (2009) among others guide our empirical investigation
Our data include the reported information for the 36 largest EU banks (in terms of total assets)
including 13 Global systemically international institutions (SII) and 23 domestic SIIs3 Information
disclosed on a country-by-country level are turnover number of employees prot or loss before
tax tax on prot or loss and public subsidies received In this paper we focus on activity through
the information on turnover The data set is cross-sectional and concerns 2015 the rst year the
reports were available Banks headquarters are located in 10 EU countries their foreign aliates
have activity in 138 countries in total including about thirty tax havens jurisdictions Tax havens
represent 08 of our sample in terms of population 2 in terms of GDP but EU banks record
18 of their foreign turnover and 29 of their foreign prot in these countries
The absence of activity in a country jurisdiction is an insightful information that we want to
account for Therefore we extend the total sample to 228 countries the maximum of countries
for which controls are available the presence of zeros in the vector of the dependent variable
poses a methodological challenge To address it and estimate a gravity model we use the Poisson
3We extend a sample collected from nancial statements in annual reports We are grateful to Oxfam stawho kindly shared with us the database initially put together by the Dutch Center for Research on MultinationalCorporations In their study they consider the twenty largest EU banks and provide some interesting albeitpreliminary stylized facts on the location of banks in tax havens We extend their data from the 20 to 36 largestbanks in terms of assets (source Relbanks) A meticulous look at the initial data indicated that missing informationin the original annual report had been misreported as zero Therefore we have corrected the misreportings
5
pseudo maximum likelihood (PPML) which has the advantage to avoid a log transformation of the
specication It allows us to properly account for zeros in the endogenous variable the second
advantage is that coecients are unbiased (Silva and Tenreyro (2006)) We estimate the model
within the alternative Negative Binomial Quasi-Generalised Pseudo-Maximum Likelihood estimator
(NB QGPML) and OLS estimator for robustness check A second methodological issue is to keep
a stable size of the sample while we add the dierent measures of tax haven attributes In fact
while a dummy controlling for whether a jurisdiction is a tax haven or not can be created for the
whole sample data availability can drastically decrease when it comes to eective tax rates or
institutions governance quality Yet keeping a stable size sample is necessary to avoid any sample
bias We run our estimate on two sample sizes one including the 138 countries in which EU banks
declare operating and a large sample of 228 countries Our results are consistent across alternative
specications on both samples a fact that suggests statistical robustness
A few authors have previously examined the eects of tax and transparency on international
nancial positions Grilli (1989) provides preliminary evidence that taxes on interest and bank
secrecy in13uence location choices of cross-border deposits Hemmelgarn and Nicodeme (2009) and
Johannesen (2014) take advantage of the enforcement of European Savings Directive in 2005 and
nds that cross-border deposits are motivated by tax evasion Johannesen and Zucman (2014)
exploit information on new bilateral treaties for exchange of bank information Zucman (2014)
combines data from the Swiss National Bank and IMF to assess the amount of unrecorded wealth
in international portfolio statistics and concludes that accounting for them would turn rich countries
in net creditors Two papers estimate gravity equations as we do First Alworth and Andresen
(1992) estimate a cross-sectional gravity model on bilateral deposit 13ows from the BIS in 1990
and nd that tax dierential between countries and bank secrecy are key determinants Huizinga
and Nicodeme (2004) estimate a panel gravity equation on BIS data and show that international
depositing is driven by interest income taxation and reporting practices
6
The main contribution of this paper is to explore the geography of banking and consists in 6 new
ndings 1) Ignoring tax havens implies misspecication in a standard gravity model tax havens
attract signicant extra banking activity beyond the standard gravity factors 2) For EU banks the
main tax havens are located within Europe Luxembourg Isle of Man and Guernsey rank at the
top of the foreign aliates presence not explained by standard factors in particular the presence
of foreign banks aliates in Luxembourg is 85 times higher than predictions based on a standard
gravity model 3) Attractive low tax rates are not sucient to drive extra activity 4) High quality of
governance is not a driver but banks avoid the countries with weakest governance 5) Similarly high
level of transparency is not a driver of extra activity but banks avoid the most opaque countries
6) The tax savings for EU banks is estimated around e1 billion Section 2 presents an overview
of the previous academic literature on tax havens Section 3 describes our database and provides
some stylized facts Section 4 explains the dierent specications and the PML estimator Section
5 presents the results Section 6 provides estimates of the tax saving for the EU banks and the
scal losses due to tax havens Section 7 concludes
2 Tax havens in the literature
There is very little academic research on tax havens this topic accounts for less than 04 of the
academic literature on taxation (see more details in Appendix)4 The reason is probably related to
the scarcity of data on tax havens A related and somehow more documented topic is international
tax competition and prot shifting by multinational enterprises (MNEs)5 In the following we
review empirical research distinguishing works on country-level versus rm-level data and non-
4Most of the academic articles about tax havens are published in Accounting (21) and Public eco-nomicsPolitical economy (18) Surprisingly few articles have been published in international economics (8)development economics (6) or nancial economics (7)
5Comprehensive and stimulating academic surveys on international tax competition prot shifting by multina-tional enterprises (MNEs) and tax havens are provided by Devereux (2007) Hines (1999) Hines (2007) Hines(2010) Dharmapala (2008) Dharmapala (2014) and Zucman (2015)
7
nancial versus nancial sectors
21 Country-level data
A rst part of the literature is based on macroeconomic (aggregated) data and examines the charac-
teristics of the countries or jurisdictions considered as tax havens Some works on oshore nancial
centers (OFCs) address somewhat independently similar issues In their seminal paper Hines and
Rice (1994) are among the rst to document the importance of tax havens6 They identify a list of
41 tax havens and they estimate that US MNEs reported nearly a third of their foreign prots in
such countries in the early 1980s As shown by Hampton and Christensen (2002) oshore nancial
activities have been very protable for hosting countries in terms of employment growth and gov-
ernment revenues7 Hines (2005) indicates that between 1982 and 1999 the annual per capita real
economic growth was 33 in average for tax haven compared to 14 for the rest of the world8
Dharmapala and Hines (2009) examine the features of tax havens and nd that better-governed
countries (measured by the World Banks indicators for voice and accountability political stability
government eectiveness rule of law and control of corruption) are much more likely than others
to become tax havens Masciandaro (2006) who examined OFC rather than specically tax haven
similarly highlights the importance of a high political stability a low crime level and a Common
Law juridical system combined with a low resources endowment Rose and Spiegel (2007) discuss
the causes and consequences of OFCs In particular they argue that while they may increase tax
evasion OFCs may also have unintended positive consequences such as providing competition for
the domestic banking sector9
6To our knowledge Johns (1983) produced the earliest academic study on the economics of tax havens7In Jersey for instance 90 of the government revenues come from oshore activities which directly employs up
to 20 of the local labor force Hampton and Christensen (2002)8More recently the growth discrepancy has narrowed as Hines (2010) shows that from 1992 to 2006 this growth
was 285 for tax havens compared to 226 for OECD countries9For a theoretical approach see Desai et al (2006b) Slemrod and Wilson (2006) Johannesen (2010) Overall
these models suggest that tax havens may have an ambiguous impact on welfare
8
22 Country-level data with a focus on nancial positions
A second stream of papers relies on aggregated data with a focus on cross-border deposits and capital
13ows Some works attempt to quantify nancial positions in tax havens and or OFCs According to
various sources gathered by Hampton and Christensen (2002) the total amount of bank deposits in
OFCs was estimated to $11 billion in 1968 $385 billion in 1978 $1000 billion in the early 1990s and
$6000 billion in the late 1990s (from 05 of world GDP in 1968 to 5 in the 1980s and 20 in the
1990s) Lane and Milesi-Ferretti (2011) provide rough estimates of the foreign asset and liability
positions in OFCs They consider a group of 32 small OFCs and purposely exclude important
nancial centers such as Hong Kong Ireland Luxembourg and Singapore While these countries
represent a very small part of the world population and GDP they account for 85 of the world
cross-border investment positions larger than France Germany or Japan Zucman (2013 2015)
uses a restricted dataset on cross-border banking from the BIS combined with a public survey from
the Swiss National Bank and documents that 10 of the nancial wealth of European households
is held oshore which represents a tax revenue loss of $75 billion Zucman (2015) estimate that
the global nancial wealth of households held in tax havens in 2013 is about $76 trillion10 Last
Zucman (2014) evaluates that about 20 of all US corporate prots are held in the main tax
havens in 2013 which is a tenfold increase since the 1980s11 Some works explore the drivers of
nancial positions in tax haven and or OFC Grilli (1989) provides preliminary evidence showing
that bank secrecy in13uence location choices of cross-border deposits Alworth and Andresen (1992)
estimate a gravity model and nd that tax dierential between countries are a key determinant of
bilateral deposit 13ows Huizinga and Nicodeme (2004) also suggest that the location of deposits
is likely to be driven by tax evasion concerns and nd that information exchange agreements do
10Henry (2012) on behalf of the NGO Tax Justice Network reports that between $21 and $32 trillion ofunreported nancial assets was owned via tax havens in 2010 which represents more than 30 of the world GDP
11The list of tax havens considered in Zucman (2014) is restricted to Netherlands Ireland Switzerland SingaporeLuxembourg Bermuda and other Caribbean havens
9
not foster cross-border deposits12 Using the restricted dataset on cross-border banking from the
BIS mentioned above Johannesen (2014) take advantage of the enforcement of European Savings
Directive in 2005 to assess to which extent cross-border deposits are motivated by tax evasion He
nds that deposits owned by EU residents in Swiss banks dropped by 30-40 when the new rule was
introduced Andersen et al (2016) use the same data and show that an increase in the petroleum
rents cause a signicant increase in deposits in tax haven held by petroleum-rich countries with
very weak political institutions (autocratic rulers) Masciandaro (2005) and Masciandaro et al
(2016) examine both theoretically and empirically the impact for a country or a territory of being
blacklisted as a non-cooperative jurisdiction Contrary to the name and shame intended eect
blacklisting attracts international banking activities Similarly Johannesen (2014) examine how
bilateral treaties for exchange of bank information impact the amount of bank deposits They
nd that when some tax havens commit to exchange information this does not materialize in a
repatriation of deposits instead the deposits shift to other tax havens not covered by a treaty
23 Firm-level data
There is a sizable literature on international prot shifting using rm level data13 A few papers
specically focus on tax havens For example Dyreng et al (2013) focus on the Delaware as a
domestic tax haven They nd that US rms with subsidiaries in Delaware reduce their tax burden
by between 15 and 24 Desai et al (2006a) adopt a broader approach and examine which
rms do establish tax haven operations Especially it appears that among rms the larger the
more productive ones and the ones with sizable foreign operations and a high RampD intensity are
12Buch (2005) does not consider specically tax haven but investigates the location of international assets andliabilities of commercial banks from ve countries (France Germany Italy the UK and the US) She uses aggregateddata from the locational banking statistics of the BIS and her sample of host countries is limited to 50 host countriesmissing most of the tax havens As expected she nds that banks hold signicantly lower assets in distant marketsand that the importance of distance has not declined over the period 1983-1999
13See for instance Clausing (2003) and Huizinga and Laeven (2008) For European evidence see also Dischingerand Riedel (2011) and Vicard (2015)
10
the most prone to have tax haven aliates Hebous and Lipatov (2014) show additionally that
rms investment in corrupt countries is positively related to having aliates in tax havens14
Last Demirgc-Kunt and Huizinga (2001) specically examine the banking sector without however
focusing on tax havens Using bank level data for the period 1988-1995 they examine the taxation
of domestic and foreign-owned banks in 80 countries including several notorious tax havens (Hong
Kong Luxembourg Panama etc) Most of all they nd evidence that foreign banks are engaged
in extensive prot shifting In total cross-country studies on tax havens use incomplete datasets
there is no paper which focuses on nancial or banking sector at the microeconomic level using
individual data Our present paper attempts to ll this gap
3 Data
As the basis of the usual recommendations to preclude aggressive tax planning and prot shifting
country-by-country reporting (CbCR) requires the largest rms to provide detailed information
regarding the allocation of their income prot and taxes From 2015 according to the Capital
Requirements Directive IV of the EU (Article 89) all European banking groups with a consoli-
dated turnover above e750 million are required to publicly disclose the activity of all their aliates
(subsidiaries and branches)15 More precisely the public CbCR imposes banks to disclose informa-
tion on a country-by-country basis together with their nancial statements on the following items
turnover (net banking income) number of employees (on a full time equivalent basis) prot or loss
before tax tax on prot or loss and public subsidies received
14Dierences in international corporate taxation do not impact only the location of foreign direct investment butalso transfer pricing capital structure dividend and royalty payments or RampD Other empirical works on MNEsand tax haven based on rm-level data include Gumpert et al (2016) Johannesen et al (2016) and Johannesen andLarsen (2016) Harris et al (1993) Hines (1997) Grubert and Slemrod (1998) and Grubert and Slemrod (1998)
15This directive has followed the French initiative adopted in 2013 as part of the Loi de separation des activites
bancaires
11
31 The Sample
The information from the CbCR has been operated rst by the NGO Oxfam In order to put
together our dataset we have extended their database to the 36 largest EU banks in terms of
assets All these banks are large with a leverage ratio exposure measure above e200 billion and
therefore are considered as either Global- or Local-Systemically Important Institutions (SIIs) by
the European Banking Authority16 The dataset is therefore cross-sectional and concerns year 2015
The 36 banks are located in 10 EU countries Austria (1) Belgium (1) Denmark (1) France (5)
Germany (7) Italy (3) Netherlands (3) Spain (4) Sweden (4) and the United Kingdom (6)
32 Lists of tax havens
As much as Bermuda or the Cayman Islands are notable and uncontroversial examples of tax havens
there is not one single ocial list of tax havens Governments international institutions NGO and
scholars identify tax havens along dierent criteria While the European commission identied 30
jurisdictions in 2015 (European Commission 2015 see Oxfam for references) Hines and Rice (1994)
listed 41 major tax havens while the list computed by the Tax Justice Network in 2009 included 60
jurisdictions In total Palan et al (2013) mention 11 lists of tax havens (FSI OECD UNCTAD
EP EC GAO FTSE IMF BIS EU Investigations TJN) In our estimates we consider the list
of tax havens popularized by Hines and Rice (1994) For the sake of robustness we alternatively
consider how frequently a country is considered as a tax haven and whether this country is included
in the Oxfam Top 15 ranking It is important to point a potential sample bias due to the exclusive
presence of EU banks
16ABN Amro Banca Monte Dei Paschi di Siena Banque Postale Bayern LB BBVA BFA BNPP BPCE CreditAgricole Commerzbank Credit Mutuel Deutsche Bank Danske Group DZ Bank Este Group HandelsbankenHelaba HSBC ING Intesa Saopaolo KBC La Caixa LBBW Lloyds Nationwide Nordea Nordlb RabobankRBS Santander Seb SG Standard Chartered Swedbank Unicredit KfW included in the Oxfam study has beenexcluded because this banks is not considered to be a SIFIs
12
33 Descriptive statistics and stylized facts
The 36 banks employ 23 million people in 138 partner countries and record a total turnover of
EUR 575 billion Figure 2 plots the turnover disclosed by banks broken down by location (foreign
versus domestic) HSBC records the largest turnover of the sample (EUR 58 billion) and Helaba
the smallest (EUR 2 billion) Table 8 in Appendix displays descriptive statistics at the bank level
On average foreign turnover represents 48 of the total turnover The total number of locations
(bank country) is 845 Banks have foreign aliates in 1 to 68 countries For instance Lloyds
declares activity in 7 partner countries while Societe Generale declares activity in 68 dierent
partner countries On average each bank reports activity in 35 partner countries with a large
heterogeneity some banks operate more abroad than in their own countries (eg BBVA in Mexico
Santander in Brazil) The 36 banks of our sample are located in 25 tax havens As Hines-Rice
list includes 41 countries it means that the EU banks are absent from certain tax havens For
instance the data report no commercial presence in Samoa St Kitts amp Nevis or Barbados while
these countries are frequently recorded as tax haven (they are registered in more than 8 lists) In
turn several banks have a commercial presence in Bahamas Panama and Cayman Islands (which
are recorded in 9 lists) in Bermuda (recorded in 8 lists) or in Isle of Man Jersey Guernsey or
Monaco (7 lists) In particular 9 banks have aliates in Jersey 8 in Monaco and 7 in Guernsey or
Mauritius17 It conrms a sample bias due to the inclusion of only European banks in the sample
Table 1 displays country summary statistics It is worth reminding that we extend the number of
destination countries to 228 in order to account for the absence of activity The small tax havens
correspond to counties of less than 2 million people The small tax havens represent 01 of our
sample in terms of population and 03 in terms of GDP while big tax havens represent 07 of the
17Multiple British banks have dierent reporting standards regarding Jersey and Guernsey (together referred to asthe Channel Islands) and Isle of Man Some report on the Channel Islands as one jurisdiction Others also includethe Isle of Man in this small group This limits the way in which this research can draw conclusions regarding JerseyGuernsey and the Isle of Man as three separate jurisdictions In order to minimize these limitations and avoid doublecounting for these three islands we input the average by jurisdiction
13
population sample and 17 of the GDP As stated by Dharmapala and Hines (2009) tax havens
experienced high level of income per capita (more than twice higher than the rest of the world)
Unsurprisingly the eective tax rate is much lower in tax havens (17 versus 5) and the nancial
infrastructures are more developed (measured by the GFSI Index described in the next Section
) Last it is worth observing that the level of regulation is similar a stylized fact suggestion that
regulation dierences is not a driver
Table 1 Countries summary statistics
Non Small Bighavens havens havens
Nb countries 185 35 8
GDP (PPP EUR bn) Total 112000 308 1880Av 605 9 235Percent 981 03 16
Pop (thousand) Total 7260000 6942 48500Av 39300 198 6064Percent 992 01 07
GDPcapita (EUR) Total 15427 44369 38763Av 17786 36643 38763
Eective Tax Rate 17 5 5GFSI Index 54 67 68Regulation Index 24 23 25
Source CbCR (2015) Sample The 36 largest European banks
Table 2 displays the turnover number of employees prots and tax on prots of foreign aliates
reported by the EU banks included in our sample The activity is broken down into non tax
havens small and big tax havens EU banks in our sample employ about 12 million people
abroad and a little more than 100000 people in tax havens While tax havens represent 9 of the
workforce abroad they account for 18 of the turnover and 29 of the prots recorded abroad
More specically small tax havens represent 5 of the turnover recorded abroad only 2 of the
employment 10 of the prots and 5 of the taxes Figure 3 compares business ratios across
14
Table 2 Bank activities in foreign countries
Non Small Big Tax Totalhavens havens havens havens Foreign(112) (18) (7) (25) (137)
Turnover 229216 13639 34959 48598 277814In of foreign 83 5 13 18 100
Employees 1108140 22649 83460 106109 1214249In of foreign 91 2 7 9 100
Prots 53983 7656 14492 22147 76130In of foreign 71 10 19 29 100
Tax on prots 15018 827 1695 2521 17539In of foreign 86 5 10 15 100
TurnoverGDP 02 49 19 22 03TurnoverEmployees 21 60 42 46 23ProtTurnover 24 56 41 46 27ProtEmployees 5 34 17 21 6TaxProt 28 11 12 11 23
Note Source CbCR (2015) Sample The 36 largest European banks The sample
includes only countries where European banks declare subsidiaries
jurisdictions Turnover as a ratio of GDP is 95 times higher in big tax havens and 245 times
higher in small tax havens Productivity calculated as the turnover per employee is twice higher in
big tax havens than in non tax havens and 3 times higher in small tax havens The prot rate is
17 higher in big tax havens and 25 higher in small tax havens (ProtTurnover) Last the implicit
tax rate in tax havens is 25 times lower than in non tax havens (TaxProt) In total raw statistics
indicate that banks record signicantly higher activity and prot per employee in tax havens than
non haven countries In the subsequent econometric exercise we follow two objectives i) quantify
the extend of extra activity merely due to tax havens attributes ii) get a better understanding of
the drivers
15
4 Specication and estimator
We analyze the determinants of banks commercial presence abroad within a standard gravity
framework and we rely on a Poisson pseudo-maximum likelihood to account for zeros
41 The baseline specication the gravity model
The baseline turnover model is given by
Turnoverkij = exp(k + 1 log(GDPpercapj ) + 2 log(Popj) + 3 log(distij) + 4Contigij
+5Lij + 6Colonyij + 7RTAij + 8Territoryij ++9GFCDumj
+10GFCRatingj ) + kij
where the subscripts refer to the foreign aliate of bank k with headquarter in country i that
declares turnover in partner country j The GDP per capita (GDP percapj ) and the population in
country j (Popj) are used as economic mass variables in the gravity specication The corresponding
variables in country i are not included because of the inclusion of headquarter xed eects (see
below) These data are collected from the World Factbook database provided by the Central
Intelligence Agency (CIA)18 The standard gravity variables also include a set of bilateral country
variables that proxy frictions In the baseline specication we include the geographical distance
(distij) and dummy variables indicating the presence of a common border (Contigij) a common
language (Lij) a colonial relationship (Colonyij) the signature of a regional trade agreement
(RTAij) and that the partner country (j) is a dependent territory of country i (Territoryij)
These variables except RTAij and Territoryij come from the CEPII distance database Variable
18The World Factbook database is cross-sectional but covers a larger number of countries (ie sovereign statesand dependent territories) than other databases as the one provided by the United Nations Statistics Division
16
RTAij comes from de Sousa (2012) and variable Territoryij is computed by the authors19 In the
gravity specication the distance is considered to be the main friction so coecient 3 is expected to
be negative However the eect of distance can be overestimated for neighboring countries because
countries sharing a common border have generally more relationships Coecient 4 associated with
the contiguity dummy variable is therefore expected to be positive Furthermore the variables Lij
Colonyij Territoryij and RTAij are expected to positively aect the turnover Indeed the same
ocial language makes the commercial presence easier as well as a relationship of former colony and
the dependency from the controlling state In addition RTAs are meant to promote trade in goods
and services activities including nancial services20 In addition GFCDumj and GFCRating
j account
for agglomeration economies due to nancial infrastructures We rely on the Global Financial
Centres Index (GFCI) computed by the ZYen Group that provides proles ratings and rankings
for nancial centres21 The variable GFCdumj is a dummy variable equal to 1 if country j has a
city classied among the global nancial centres and 0 otherwise This rst control draws from
Park (1982) who distinguished primary o shore centers (OFC) such as London or New York which
serve worldwide clientele and act as international nancial intermediaries from secondary OFC
such as Cayman Islands Bahamas Panama which are booking collecting and funding centers
Furthermore the global nancial centres can record quite dierent ratings For instance New York
and London have higher ratings than Paris Therefore we also control for the rating recorded by
the the global nancial centres The variable GFCRatingj normalizes the ratings provided by the
19The RTA database used by de Sousa (2012) has been updated by the author(httpjdesousaunivfreefrdatahtm) The database covers 199 countries over the time period 1958-2015In this paper we can consider up to 228 partner countries while banks headquarters are located in European Union(EU) Therefore we rely on the RTA database provided by the World Trade Organization (WTO) to cover all theRTA between EU and the 228 partner countries considered in this paper
20See the RTA database provided by the WTO (httprtaiswtoorgUIPublicMaintainRTAHomeaspx) to haveinformation on agreements that have been notied to the WTO
21More precisely we identify countries that have a nancial centre classied as global in the GFCI 17 and 18(march and sept 2015) These global nancial centres can be broad amp deep relatively broad or relativelydeep 16 countries have a global nancial centre Belgium Canada China Hong Kong France Germany IrelandJapan Luxembourg Netherlands Republic of Korea Singapore Switzerland United Arab Emirates the UnitedKingdom and the United States of America
17
GFCI in 2015 to range between 0 and 122 Last the model specication includes a headquarter
xed eect (k) to control for unobserved heterogeneity at the bank level
42 The augmented specications accounting for tax havens
In order to account for the specicity of tax havens we alternatively test THHinesj a dummy
variable equal to 1 if country j is classied as tax haven by Hines and Rice (1994) and 0 otherwise
THCountj a count variable equal to the number lists of tax havens on which country j is recorded
THTop15j a dummy variable equal to 1 if country j is ranked in the top 15 of tax havens dened by
Oxfam and 0 otherwise
In a second step we investigate the drivers emphasized in the literature ie a favorable tax
rate and nancial secrecy We will test whether the eect associated with the tax haven dummy
is driven by these dimensions In addition Dharmapala and Hines (2009) have documented that
tax havens are better-governed than comparable nonhaven Low tax rates might not attract MNEs
as only better-governed countries can credibly commit not to expropriate foreign investors ()
or mismanage the economy To build on this important nding we control for the quality of
governance We follow Dharmapala and Hines (2009) and use the Worldwide Governance Indicators
(WGI) compiled by Kaufmann et al (2005) In the following we brie13y describe the variables and
refer the reader to a more detailed Appendix
Tax considerations We rst introduce the statutory corporate tax rates which are the most
22There is a usual confusion between tax havens and oshore nancial centers ie nancial places providingnancial services to non-residents (OFC) For example Switzerland is considered a tax haven (3 lists) and is rankedas 7th largest nancial center ranked by banks external assets (BIS 2008) A lot of tax havens are indeed largeOFC by nature Similarly the Netherlands is regarded a tax haven and it is one of the most prominent OFCs bydierent measures of capital 13ows The Netherlands is similar to Luxembourg and Ireland all can be considereda conduit center with large ingoing and outgoing capital 13ows related to activities of MNCs However not all taxhavens are OFC for example Lebanon appears on 5 lists of tax havens but is not in the top 50 nancial centers Inturn some major OFC are not tax havens United Kingdom and France are not on any list of tax haven and areranked rst and fourth largest nancial center Therefore controlling for the agglomeration economies in nancialcenters with a binary dummy could result in underestimating tax haven eects while not controlling for them wouldoverestimate it (think of Switzerland)
18
obvious and readily available measures of scal pressure on corporate prots (STRj) However it
often does not represent the tax cost of reporting income due to various deductions and specic tax
schemes (Dharmapala 2014)23 As in previous empirical studies we alternatively test the actual
tax rate often referred to as eective tax rate (ETR) Previous works have used the eective tax
rate by US rms provided by the Bureau of Economic Analysis available for 50 countries (Hines
2007) These data have recently been extended from rm-level tax forms to 71 countries by Dowd
et al (2017) In order to ll the gap with our sample size we design a simple prediction model to
estimate the missing ETR for 228 countries in total
Transparency An allegedly dening characteristic of tax haven is secrecy Beyond banks secrecy
laws which make it illegal to report nancial information a lot of tax haven jurisdictions oer
a lenient regulation environment allowing individuals or corporate to escape the laws rules and
regulations of home jurisdictions24 As a serious implication of secrecy is to facilitate laundering
criminal proceeds We use the Basel Anti-Money Laundering Index (AML) developed by the Basel
Institute of Governance to test the eect associated with low transparency The overall score is
aggregated from 14 underlying sub-indicators grouped into the following ve categories Money
launderingTerrorist nancing risk Corruption Financial transparency and standards Public
transparency and accountability Political and legal risk
Last we introduce non linearity to provide a more accurate understanding of the driving forces
More precisely V arq25 (V arq75) takes the value of 1 when the country is in the bottom (top) quartile
of measure Var and zero instead
23For example in November 2014 Luxembourg leaks (or Luxleaks) disclosed Luxembourgs tax rulings and taxavoidance for over three hundred multinational companies based in Luxembourg
24A high level of bank secrecy is almost invariably used as a selling point by OFCs some of which have been (andare) exploited also for activities related to money laundering (Errico and Borrero (1999) p10)
19
43 The Poisson pseudo-maximum likelihood
Our augmented sample includes 228 countries including a lot of null values of the dependent vari-
able turnover To address this statistical issue we rely on the Poisson pseudo-maximum likelihood
(PPML) estimator In fact the PPML estimator has three main advantages to estimate a grav-
ity model First the PPML estimator does not require a log-linear specication of the gravity
model Consequently the PPML estimator is consistent in the presence of heteroskedasticity while
estimators requiring a log-linear specication as the OLS estimator can be bias and inconsistent
(Silva and Tenreyro (2006))25 Second the PPML estimator provides a natural way to deal with
zero values of the dependent variable The PPML estimator assumes that the zero and non-zero
observations are produced by the same data generating process 26 In other words no observation
is dropped to estimate the model and PPML estimates are not exposed to a sample selection bias
Conversely OLS estimates using log transformation of the dependent variable imply to drop the
zero observations and are particularly exposed to a sample selection bias A simple strategy to deal
with the zero observations might be to arbitrarily add a small positive number (usually 05 or 1) to
all observations but such ad-hoc approach might perform poorly Last interpretation of estimated
coecients is straightforward estimated coecients are interpreted as elasticities for covariates en-
tered in logarithms and as semi-elasticities for covariates entered in levels27 For robustness check
we also consider the Negative Binomial Quasi-Generalised Pseudo-Maximum Likelihood estimator
(NB QGPML) as suggested by Bosquet and Boulhol (2014)28 This estimator is an alternative to the
25Heteroskedasticity would result from the log transformation of the original nonlinear gravity model used to geta linearized form Consequently this kind of heteroskedasticity does not only aect OLS standard errors but alsoOLS parameter estimates As a result OLS estimates might be biased and inconsistent Alternatively the PPMLestimator provides consistent estimates of the original nonlinear gravity model (Silva and Tenreyro (2006))
26Furthermore note that the PPML estimator is consistent as a PML estimator even if the data are not Poisson-distributed
27Note that estimated coecients associated with dummy variables (as THHinesj for instance) are not directly
interpreted The percentage change of the dependent variable when a dummy variable moves from 0 to 1 is given byexp() 1 where is the estimated coecients associated with dummy variable
28The NB QGPML estimator proposed by Bosquet and Boulhol (2014) is scale invariante contrary to standardNB QGPML estimators Therefore the NB QGPML estimator proposed by Bosquet and Boulhol (2014) can beapplied to a continuous dependent variable (for which unit choice is arbitrary by denition)
20
PPML estimator More precisely the NB QGPML estimator encompasses the Poisson assumption
as a special case and might be more ecient when the dependent variable exhibit over-dispersion
(ie the conditional variance of the dependent variable increases more than proportionally with the
conditional mean)29 Last we will also report the OLS estimates of the log-linear specication for
the stake of comparison
5 Results
51 The Baseline Specication
The rst column of Table 3 reports the estimate results of specication (1) on the large sample of
228 countries30 Most variables are signicant and estimated coecients with the expected sign as
we will comment below The estimates are consistent across both small and large sample which
suggests that our results are robust (see Table 9 in Appendix) The larger the economic size and
the population of a country the larger the local turnover booked by banks foreign aliates In
addition a common border a former status of colony and a current status of dependent territory
for country j all positively impact the reported turnover the eect of a common language is not
signicant probably because it is already captured by the previous three determinants A common
regional trade agreement between countries i and j is associated with larger turnover Moreover
the combination of both estimated coecients associated with GFCdumj and GFCrating
j is positive
a consistent result conrming that the higher the nancial development of a jurisdiction the larger
the turnover reported by foreign banks aliates Last the nding of a non signicant distance
eect can probably be explained by the sample bias due to the inclusion of European banks only
mentioned above
29The PPML estimator assumes proportionality between the conditional variance and the conditional expectationof the dependent variable
30In the following we comment the estimates on the largest sample only and report in Appendix the results on theshortest sample (see Table 9)
21
Table 3 Baseline and augmented specications on the large sample
Dependent variable Turnoverkij Turnoverkij Turnoverkij TurnoverkijEstimator PPML PPML PPML PPML
Coef SE Coef SE Coef SE Coef SE
log (GDP percap
j ) 13205 (01042) 13875 (01039) 13780 (00987) 13566 (01027)
log (Popj) 06177 (00847) 07612 (00758) 07562 (00660) 07474 (00739)
log (distij) 00693 (00835) 00660 (00858) 00168 (00810) 00401 (00856)
Contigij 12495 (04761) 08809 (05537) 11107 (04784) 08594 (05492)
Lij 03276 (02430) 02719 (02477) 02963 (02354) 02454 (02475)
Colonyij 05781 (01707) 06116 (01771) 06319 (01807) 06588 (01823)
RTAij 07802 (02289) 09226 (02056) 08924 (02012) 08954 (02077)
Territoryij 14418 (06155) 14773 (05677) 11006 (06533) 15135 (05838)
GFCDumj -04964 (03802) -07958 (04392) -07309 (03940) -10154 (05216)
GFCRatingj 15295 (05485) 14764 (05777) 15106 (05504) 17116 (06280)
THHinesj 09861 (03613)
THCountj 01789 (00663)
THTop15j 10581 (04156)
No obs 7912 7912 7912 7912
No positive obs 811 811 811 811
No partners 228 228 228 228
No Tax Havens - 43 56 15Log Likelihood -394278 -386592 -386345 -385348
BIC 788959 773597 773103 771110
R2 02949 03035 03174 03055
pseudo-R2 06191 06265 06268 06277
RESET test(pvalue)
112(02895)
014(07132)
001(09995)
004(08325)
Note and indicate signicance at the 1 5 and 10 levels respectively Heteroskedasticity
robust standard errors (using HuberWhitesandwich estimator of variance) are in brackets
22
52 Introducing Tax Havens
In Table 3 we introduce a dummy capturing whether jurisdiction j is a tax haven Columns 2 3 and
4 report the estimate results including three alternatives Estimated coecients are consistent with
the baseline estimate The variable of interest THj is signicant and the estimated coecient is
positive in the three alternatives The estimated coecients associated with THHinesj and THTop15
j
in column 2 and 4 resp are similar Their marginal eect is respectively an additional activity
by 168 and 188 In turn the estimated coecient associated with THCountj is lower because
it measures the marginal eect of being included in one additional list of tax havens In sum the
estimates conrm that tax havens attract more commercial presence than non tax haven once we
control for standard factors Now we would like to get a more accurate understanding of the driving
forces
Table 4 displays the results for the specic drivers The rst column reports the linear results
First we note an unexpected positive sign of the coecient associated with the eective tax rate
suggesting that the larger the tax rate the larger the activity of banks in addition coecients
associated with secrecy and governance are not signicant It is worth mentioning that the tax
haven dummy is signicant In sum nancial secrecy and governance taken linearly do not add any
new information We introduce non linearity in the mechanism in the second and third column
We comment the third column only which displays our nal results for the sake of brevity31 The
estimated coecient associated with the ETR in the bottom quartile is not signicant as our
estimate includes a signicant tax haven dummy it means that we do not get any extra valuable
information In turn the driver associated with nancial secrecy aects banking activity in a non
linear way a high level of secrecy is associated with lower activity while a high level of transparency
has no eect In sum contrary to what is suggested in the literature our results suggest that
31The second column displays intermediate estimate results Non signicant variables are excluded from thespecication in the third column
23
nancial secrecy is not a deerminant and in turn it tends to divert activity This might be due to
the fact that low nancial transparency is also associated with poorly governed countries And in
fact when we control for the quality of governance we nd that banks tend to avoid countries with
weak governance countries Last but not least a short comment on the fact that adding the drivers
in the specication does not change the result on the tax haven dummy The majority of countries
showing a low level of tax rate are also poorly governed and hence cannot pretend to the status
of tax havens Put it dierently tax havens benet from low tax rates but do not necessarily oer
the lowest rates worldwide Similarly while nancial secrecy is appreciated by tax havens users it
needs to go hand in hand with strong institutions
Last Table 5 disentangles the results associated with governance nancial secrecy within sub-
categories In fact each measure aggregates sub-indices that we alternatively test We keep the
aforementioned results that non linearity is necessary to properly capture eects On the one hand
the negative eects of weak governance is driven by the dimensions of voice and accountability
government eectiveness and rule of law A low performance on these dimensions reportedly diverts
activity In turn a low level of corruption political stability and violence do not aect banks activity
On the other hand every single sub-categories of the transparency measure aects banks activity
except money laundering and terrorist nancing Interestingly a low level of nancial transparency
and standard has a negative eect This result suggests a threshold of nancial opacity under which
banking activity can not operate Now we take a closer look at the individual data to shed some
light on the money laundering and terrorism nancing result Removing Luxembourg from the
sample turns this dimension signicant and negative In other words Luxembourg drives the result
because it both attracts the largest amount of volume and performs badly on this dimension
24
Table 4 ETR AML scores and WGI scores
Dependent variable Turnoverkij Turnoverkij TurnoverkijEstimator PPML PPML PPML
Coef SE Coef SE Coef SE
log (GDP percap
j ) 12421 (02332) 09574 (01631) 10724 (01325)
log (Popj) 06482 (00733) 05899 (00720) 06227 (00795)
log (distij) 00787 (00864) 01170 (00910) 00826 (00868)
Contigij 08394 (05659) 10605 (05287) 09916 (05342)
Lij 02981 (02454) 01814 (02358) 02030 (02386)
Colonyij 05523 (01826) 06506 (01753) 06237 (01696)
RTAij 08189 (02457) 08433 (02664) 07302 (02094)
Territoryij 05833 (11034) -04688 (10066) -02130 (09766)
GFCDumj -08568 (04370) -07602 (04410) -07944 (04501)
GFCRatingj 14794 (06015) 15191 (06273) 16234 (06051)
THHinesj 13145 (03501) 10121 (03407) 11377 (03421)
ETRpredictj 00734 (00436)
ETRq25j -04202 (02434) -03738 (02371)
ETRq75j -00176 (03956)
AMLj -00476 (01209)
AMLq25j -03062 (01995)
AMLq75j -13958 (03430) -13100 (03625)
WGIj 02191 (01485)
WGIq25j -09247 (03054) -09383 (03036)
WGIq75j 02920 (01755)
No obs 4412 4412 4412
No positive obs 773 773 773
No partners 128 128 128
No Tax Havens 19 19 19
Log Likelihood -366355 -360748 -362789BIC 733112 721922 725980R2 02943 03128 03137pseudo-R2 05808 05872 05849
RESET test(pvalue)
031(05766)
134(02474)
222(01362)
Note and indicate signicance at the 1 5 and 10 levels respectively Het-
eroskedasticity robust standard errors (using HuberWhitesandwich estimator of variance) are in
brackets
25
Table 5 Dimensions of transparency and governance
A Eect of transparency B Eect of governanceCoef SE Coef SE
overall score (AMLq75j ) -15764 (03726) overall score (WGIq25j ) -10727 (03139)
Dimension used instead of the overall score Dimension used instead of the overall score
Money launderingTerrorist nancing risk -02405 (02650) Voice and accountability -09625 (02974)
Corruption -08979 (03329) Control of corruption 00600 (05011)
Financial transparency and standards -08116 (02896) Government eectiveness -10896 (03610)
Public transparency and accountability -11372 (02987) Political stability and absence of violence -04212 (04270)
Political and legal risk -10156 (03338) Rule of law -07364 (04093)
Money launderingTerrorist nancing risk(modied for Luxembourg)
-09294 (03195)
26
6 The scal loss
What is the tax saving realized by European banks by means of their subsidiaries located in tax
havens Or to put it dierently what is the scal shortfall for the countries (notwithstanding the
central role played by banks in the tax optimization) The CbCR and our previous model might be
used to gauge such amount The results of our calculations are presented in Table 6 According to
Table 6 Estimated tax saving for EU banks
Observed data Predicted data(ebillion or ) non TH TH non TH TH non TH THModel (0) (1) (2)Turnover 229 49 229 49 229+15 34Prot 54 22 54 22 54+36 8(ProtTurnover) (24) (46) (24) (46) (24) (24)Tax 15 25 15 61 15+1 22(TaxProt) (28) (11) (28) (28) (28) (28)Tax savingFiscal loss 36 1 03
Note in bold assumption
the CbCR data for 2015 (model 0) and considering the list of tax havens established by Hines and
Rice (1994) the turnover abroad of the main European banks is e229 billion excluding tax havens
and nearly e50 billion in tax havens The prot before tax is respectively e54 and e22 billion
and the tax burden is e15 and e25 billion Unsurprisingly the implicit tax rate in tax havens is
signicantly lower than for other foreign subsidiaries (11 versus 28) Let us assume the same
average tax rate applies for all foreign bank subsidiaries (28) regardless of where they are located
(model 1) All things being equal this would automatically increase the scal burden in tax
havens which would reach e6 billion As a rst approximation the tax saving for EU banks is then
e36 billion In total this represents 21 of the overall tax burden However if the presence in tax
havens was not so valuable banks would certainly locate fewer subsidiaries in these jurisdictions
and the turnover would be reduced From the gravity model presented above we can estimate the
turnover in tax havens in the absence of tax and regulatory benets (model 2) Given their low
27
economic weight (only 8 tax havens have a population of more than 2 million inhabitants and none
exceeds 10 million inhabitants) and their fringe geographical location (apart from a few countries
such as Hong Kong or Luxembourg) in the absence of specic advantages the total turnover in
tax havens for our sample of European banks should be e34 billion Assuming that productivity
in tax havens and non-tax havens is similar with a same margin rate (ie 24) the total prot
estimated in tax havens would be e8 billion Consequently with an average tax rate of 28 the
tax burden in tax havens would be e22 billion ie e03 billion less than the actual amount (e25
billion) At the same time some activities would be repatriated from tax havens to other countries
Assuming a constant worldwide activity we estimate that the turnover in non-tax havens would be
15 billion higher which translates into an additional scal burden of 1 billion Under this second
set of hypothesis in total the tax saving for EU banks is e07 billion which represents 4 of the
total tax burden The previous estimates must be regarded as upper and lower bounds if we align
the scal policy of tax havens with what is applied in other countries the tax burden for EU banks
would be between 4 [= (1 03)=(15 + 25)] and 21 [= 36=(15 + 25)] higher What about
the scal shortfall for the countries First note that we only consider the direct eect associated
with the tax position of the banks That is we ignore the essential role played in tax havens by
bank subsidiaries to facilitate tax evasion for their clients MNEs and individuals Second our
estimations make it clear that tax havens have no incentives to align their tax rate Indeed in this
case they would lose their comparative advantage and their scal revenue would likely decrease
Our estimate is a scal loss of 03 billion for tax havens which is 12 of their scal revenues On
the contrary the other countries would increase their scal revenue by e1 billion which represents
an increase by 67 This is clearly a non-cooperative game
28
7 An early assessment of the CbC reporting quality
As the public reporting of CbC data is at its early stage we would like to give a tentative diagnosis
of their quality and reliability We would like to go beyond a manual assessment and gure a
systematic test To this end we use the CbCR data to produce a ranking of tax havens and
compare it with existing ones Any signicant gap between our proprietary ranking and existing
lists gives indication on the consistence of the data
We use our baseline estimate from which we exclude the tax haven dummy and we investigate
the errors We compute the abnormal turnover ie a measure of the turnover amount not explained
by our model The computation of such measure is as follows AbTurnkij =bkij
[turnkijwhere bkij
stands for the residuals and[turnkij the estimated values of turnover both taken from the initial
specication We compute the mean and median value of AbTurnkij by country j The mean
value of AbTurnj computed is 092 while the median value is 03 (see Table 7)32 We shall not be
surprised by this right skewness which is precisely due to the fact that we have purposely omitted
to account for tax haven characteristics To be sure we compare the mean and median values
calculated for the whole sample with their values calculated for tax havens only In tax havens the
mean and median values are signicantly higher 19 and 06 (with resp t-stat for the mean and
median tests of 24 and 2) In sum the large errors in the sub-sample composed of tax havens give
a rst positive indication that CbCRdata report substantially large activity in these jurisdictions
(way beyond the standard gravity factors)
Now we focus on the top 10 countries with the largest errors and compare them with existing
lists
We observe that 6 out of 10 countries are listed as tax haven in at least one of the 11 lists
mentioned above It gives us another positive indication that reporting data are consistent33
32For illustration the turnover booked by European banks aliates in the United States is roughly at the prediction33We refer to one of the 11 lists used to construct THCount
j described in the data Section
29
Table 7 Analysis of abnormal turnover values
Small Sample Large Sample
All Tax havens All Tax havenscountries Hines Top 15 countries Hines Top 15(138) (26) (14) (228) (43) (15)
Mean 09184 19063 19173 07077 15267 22442
Median 02951 06432 11102 01080 00182 11855
Mean t-stat(pvalue)
239(0018)
169(0092)
233(0020)
214(0034)
Median t-stat(pvalue)
203(0044)
252(0013)
125(0214)
195(0053)
Note OLS and quantile regessions are used to implement the mean test and the median
test respectively The standard errors used to implement the mean test and the median
test are robust to heteroskedasticity (using the Hubersandwich estimator) The null
hypotheses are no dierence in meanmedian of abnormal turnover values between tax
havens and non tax haven countries
However the absence of Cayman Panama or Bahamas is puzzling in fact these three jurisdic-
tions are listed on 9 out of 11 tax havens lists mentioned above To make sure we systematically
examine the turnover reported by the 10 largest banks in our sample in the 5 jurisdictions which
appear on most lists- Bahamas Cayman Panama Saint-Kitts-et-Nevis and Samoa (see Figure )
Three banks report zero activity in these jurisdictions (Barclays HSBC and Lloyds) Only one bank
reports activity in Panama (Santander) and two in Bahamas (SG and Santander) Seven banks
report activity in Cayman between 002 and 04 of their foreign activity
The very light commercial presence of the largest European banks in the most prominent tax
havens comes at a surprise Could it be due to the geographic bias of our sample implying that
European banks have little or no presence in or near the Caribbean To be sure we look up the
case of every single banks in these specic countries We found evidence of the presence of some
them in jurisdictions where they yet report no activity in their annual report
How can it be While the data from the CbCR are comprehensive and reliable there is still
a room for interpretation In particular Article 891 requires information to be disclosed on a
30
Figure 1 Reporting in a selection of prominent tax havens
consolidated basis but there is no indication as to which level the consolidation should take place
It is likely that banks have to refer to the Capital Requirements Regulation (CRR) Article 18
(methods for prudential consolidation) but a wide range of interpretations are possible Therefore
while the CbCR seeks to achieve a consolidation at the country-level we cannot rule out certain
consolidation over several countries Moreover Article 891 requires each institution to disclose
annually specifying by Member State and by third country in which it has an establishment But
the notion of establishment might be vague for some entities like trusts partnership SPVs etc
In sum an early assessment of the data indicate that they fairly re13ect a substantial activity in
tax havens However we point to misreporting issues in some specic jurisidctions which might be
due to too a vague denition of consolidation
31
8 Conclusion
The main contribution of this paper is to explore the geography of banking this is the rst paper
to take advantage of the CbCR data set which oers a comprehensive and reliable coverage of
rm location choices Overall our results uncover that tax havens attract extra banking activity
beyond regular gravity factors Low tax rates are however not sucient to attract extra activity
governance and transparency matter but as diversion not attraction forces By providing a number
of new stylized facts on the drivers of banks activity in tax havens our paper underlines the value
of such data As expected by its proponents the CbCR is an eective tool to enhance transparency
This new data set raises subsequent research avenues First the CbCR under CRD IV also applies to
investment rms ie mainly broker dealers and asset management entities A natural continuation
is to focus on these entities much less documented Second only 2015 data are so far available
There is no requirement to report prior year comparative gures but in the future we shall be able
to examine changes in banking locations by exploiting exogenous changes of environment Last
the CbCR has rst been applied to nancial institutions but there are currently strong pressures
in Europe and the US to impose the CbCR to all large MNEs Such extension would constitute
a highly valuable source in corporate nance research It is possible to improve the dispositive
without signicant costs For now the data need to be manually and separately collected and for
each bank The data are usually provided within the nancial reports not readily available and with
notable dierences across banks Several recommendations of the International Open Data Charter
could be applied34 First the data need to be provided in open multiple and standardized formats
so that it can more easily be processed and used by a wide range of parties (scholars journalists
34In July 2013 G8 leaders signed the G8 Open Data Charter which outlined a set of core open data principlesSee httpopendatacharternet
32
NGOs ) Second additional information reporting could be required without additional costs the
number of subsidiaries and some aggregate items of the balance sheet to better re13ect aliates
underlying activity such as total asset Third the data need to be published on a central portal
managed for example by the European Central Bank or the European Banking Authority
References
Alworth J and Andresen S (1992) The determinants of cross-border non-bank deposits and the
competitiveness of nancial market centres Money Aairs 5(2)10533
Andersen J Johannesen N Lassen D and Paltseva E (2016) Petro rents political institutions
and hidden wealth Evidence from oshore bank accounts Journal of the European Economic
Association
Bartelsman E J and Beetsma R M (2003) Why pay more corporate tax avoidance through
transfer pricing in oecd countries Journal of Public Economics 87(9)22252252
Bosquet C and Boulhol H (2014) Applying the GLM Variance Assumption to Overcome the
Scale-Dependence of the Negative Binomial QGPML Estimator Econometric Reviews 33(7)772
784
Clausing K (2003) Tax-motivated transfer pricing and us intrarm trade prices Journal of
Public Economics 8722072223
de Sousa J (2012) The currency union eect on trade is decreasing over time Economics Letters
117(3)917 920
Demirgc-Kunt A and Huizinga H (2001) The taxation of domestic and foreign banking Journal
of Public Economics 79429453
33
Desai M Foley C and Hines Jr J (2006a) The demand for tax haven operations Journal of
Public Economics 90513531
Desai M Foley C and Hines Jr J (2006b) Do tax havens divert economic activity Economics
Letters 90219224
Devereux M (2007) The impact of taxation on the location of capital rms and prot A survey
of empirical evidence Oxford University Centre for Business Taxation Working Paper 0702
Dharmapala D (2008) What problems and opportunities are created by tax havens Oxford
Review of Economic Policy 24661679
Dharmapala D (2014) What do we know about base erosion and prot shifting a review of the
empirical literature Fiscal Studies 35(4)421448
Dharmapala D and Hines Jr J R (2009) Which countries become tax havens Journal of
Public Economics 9310581068
Dischinger M and Riedel N (2011) Corporate taxes and the location of intangible assets within
multinational rms Journal of Public Economics 95691707
Dowd T Landefeld P and Moore A (2017) Prot shifting of us multinationals Journal of
Public Economics 148113
Dyreng S D Lindsey B P and Thornock J R (2013) Exploring the role delaware plays as a
domestic tax haven Journal of Financial Economics 108(3)751772
Errico M L and Borrero M A M (1999) Oshore banking an analysis of micro-and macro-
prudential issues International Monetary Fund
Grilli V (1989) Europe 1992 Issues and prospects for the nancial markets Economic Policy
October
34
Grubert H and Slemrod J (1998) The eect of taxes on investment and income shifting to puerto
rico The Review of Economics and Statistics 80(3)365373
Gumpert A Hines Jr J R and Schnitzer M (2016) Multinational rms and tax havens The
Review of Economics and Statistics 98(4)713727
Hampton M P and Christensen J (2002) Oshore pariahs small island economies tax havens
and the reconguration of global nance World Development 30(9)165773
Harris D Morck R Slemrod J and Yeung B (1993) Income shifting in us multinational
corporations In Alberto Giovannini R G H and Slemrod J editors Studies in international
taxation University of Chicago Press Chicago
Hebous S and Lipatov V (2014) A journey from a corruption port to a tax haven Journal of
Comparative Economics 42(3)739754
Hines Jr J (1997) Tax policy and the activities of multinational corporations In Auerbach A
editor Fiscal Policy Lessons from Economic Research pages 401445 MIT Press Cambridge
MA
Hines Jr J (1999) Lessons from behavioral responses to international taxation National Tax
Journal 52305322
Hines Jr J (2005) Do tax havens 13ourish In Poterba J editor Tax Policy and the Economy
pages 6599 MIT Press Cambridge MA
Hines Jr J (2007) Corporate taxation and international competition In Auerbach A Hines
J Slemrod J and Poterba J editors Taxing Corporate Income in the 21st Century pages
6599 Cambridge University Press Cambridge UK
Hines Jr J (2010) Treasure islands The Journal of Economic Perspectives 24(4)103125
35
Hines Jr J and Rice E (1994) Fiscal paradise foreign tax havens and american business
Quarterly Journal of Economics 109149182
Huizinga H and Laeven L (2008) International prot shifting within multinationals A multi-
country perspective Journal of Public Economics 92(5)11641182
Huizinga H and Nicodeme G (2004) Are international deposits tax-driven Journal of Public
Economics 88(6)10931118
Johannesen N (2010) Imperfect tax competition for prots asymmetric equilibrium and benecial
tax havens Journal of International Economics 81(2)253264
Johannesen N (2014) Tax evasion and swiss bank deposits Journal of Public Economics 11146
62
Johannesen N and Larsen D (2016) The power of nancial transparency An event study of
country-by-country reporting standards Economics Letters
Johannesen N Trslv T and Wier L (2016) Are less developed countries more exposed to
multinational tax avoidance method and evidence from micro-data Wider Working Paper
201610
Johns R A (1983) Tax havens and oshore nance a study of transnational economic develop-
ment Frances Pinter
Kaufmann D Kraay A and Mastruzzi M (2011) The worldwide governance indicators Method-
ology and analytical issues Hague Journal on the Rule of Law 3(2)220246
Lane P and Milesi-Ferretti G (2011) Cross-border investment in small international nancial
centres International Finance 14(2)301330
36
Martin P and Rey H (2004) Financial super-markets size matters for asset trade Journal of
International Economics 64(2)335361
Masciandaro D (2005) False and reluctant friends national money laundering regulation inter-
national compliance and non-cooperative countries European Journal of Law and Economics
20(1)1730
Masciandaro D (2006) Oshore nancial centres Explaining the regulation Paolo Ba Centre
Bocconi University Working Paper (170)
Masciandaro D Balakina O and DAndrea A (2016) Bank secrecy in oshore centres capital
13ows and blacklisting Does blacklisting matter Ba Caren Working Paper Series
Okawa Y and van Wincoop E (2012) Gravity in international nance Journal of International
Economics 87(2)205215
Palan R Murphy R and Chavagneux C (2013) Tax havens How globalization really works
Cornell University Press
Portes R and Rey H (2005) The determinants of cross-border equity 13ows Journal of Interna-
tional Economics 65(2)269296
Portes R Rey H and Oh Y (2001) Information and capital 13ows the determinants of trans-
actions in nancial assets European Economic Review 45(4)783796
Rose A K and Spiegel M M (2007) Oshore nancial centres Parasites or symbionts Economic
Journal 117(523)13101335
Silva J M C S and Tenreyro S (2006) The Log of Gravity The Review of Economics and
Statistics 88(4)641658
37
Slemrod J and Wilson J (2006) Tax competition with parasitic tax havens Technical Report
12225 NBER Working Paper
Vicard V (2015) Prot shifting through transfer pricing Evidence from french rm level trade
data Technical report Banque de France
Zucman G (2013) The missing wealth of nations are europe and the us net debtors or net
creditors Quarterly Journal of Economics 128(3)13211364
Zucman G (2014) Taxing across borders Tracking personal wealth and corporate prots Journal
of Economic Perspectives 28(4)121148
Zucman G (2015) The Hidden Wealth of Nations The Scourge of Tax Havens The University
of Chicago Press Chicago IL
38
Appendix
39
Figure 2 Turnover by banks
40
Table 8 Descriptive statistics at the bank level
Bank HQ Nb of Foreign Domestic Foreign Domestic
location countries turnover turnover employees employees
Mean Max Mean Max
ABN AMRO NLD 15 108 332 6896 268 966 18112BBVA ESP 21 788 6983 6785 4926 38499 32903BFA ESP 2 64 128 5155 na na 13558BNPP FRA 63 454 4950 14305 1977 17973 56981BPCE FRA 55 86 2548 19118 209 2796 91232Banka Montei ITA 6 20 53 4974 85 302 25201Banque Postale FRA 1 1 1 5744 na na 4321Barclays GBR 37 520 8488 21090 2181 31221 48622Bayern LB DEU 4 55 128 2050 54 89 6223CA FRA 41 212 2790 9021 891 10348 37559Caixa Bank ESP 2 8 9 12666 14 17 29854Commerzbank DEU 10 298 1086 8082 938 6251 33925Credit Mutuel FRA 14 198 1203 13535 926 7071 65828DZ Bank DEU 19 91 791 5738 227 1153 25123Danske Bank DNK 13 260 1007 7404 639 2021 10098Deutsche Bank DEU 52 349 6307 10510 1064 11368 45757ERSTE Group AUT 6 612 1409 2838 na na naHandelsbanken SWE 16 101 577 2779 407 1904 7263HSBC GBR 57 782 14079 13602 3760 33062 44559Helaba DEU 4 59 109 1879 65 103 5460ING NLD 32 364 3123 5185 1229 9645 14586Intesa Sao ITA 29 149 780 19323 969 5035 61243KBC BEL 16 178 1197 3286 1024 7556 10646LBBW DEU 7 26 91 2636 36 71 9748Lloyds GBR 7 85 128 21780 157 316 87652Nationwide GBR 2 15 36 4226 41 60 16117Nord LB DEU 5 77 110 2491 88 208 5580Nordea SWE 16 495 2605 2893 1420 8288 6957RBS GBR 43 61 763 15161 681 14567 64567Rabobank NLD 36 115 1461 8873 330 3989 35041SEB SWE 20 172 604 4838 na na naSG FRA 68 199 1710 12097 1232 16005 51612Santander ESP 35 1152 11720 5551 4676 44957 29838Standard Chartered GBR 56 238 2774 2736 1642 19731 1853Swedbank SWE 5 196 353 3107 1197 2303 7789Unicredit ITA 24 503 3452 9252 3833 17653 47865
41
Figure 3 Business ratios across jurisdictions
42
Table 9 Baseline and augmented specications on the small sample
Dependent variable Turnoverkij Turnoverkij Turnoverkij TurnoverkijEstimator PPML PPML PPML PPML
Coef SE Coef SE Coef SE Coef SE
log (GDP percap
j ) 11330 (01117) 12074 (01083) 11985 (01035) 11860 (01056)
log (Popj) 05493 (00874) 06766 (00789) 06776 (00685) 06721 (00769)
log (distij) 00626 (00837) 00575 (00845) 00165 (00796) 00323 (00842)
Contigij 12657 (04835) 09526 (05461) 11429 (04825) 09183 (05434)
Lij 02614 (02433) 02230 (02460) 02351 (02355) 01991 (02462)
Colonyij 05932 (01678) 06180 (01734) 06408 (01776) 06578 (01779)
RTAij 07057 (02246) 08314 (02010) 08154 (01959) 08104 (02031)
Territoryij 11979 (06232) 12703 (05725) 09440 (06463) 12946 (05809)
GFCDumj -05036 (03847) -07530 (04387) -07092 (03984) -09477 (05178)
GFCRatingj 16849 (05570) 16226 (05780) 16519 (05553) 18124 (06219)
THHinesj 08176 (03489)
THCountj 01565 (00645)
THTop15j 09079 (04077)
No obs 4762 4762 4762 4762
No positive obs 811 811 811 811
No partners 138 138 138 138
No Tax Havens - 26 32 14
Log Likelihood -382104 -376758 -375973 -375613
BIC 764589 753906 752336 751616
R2 02970 03044 03180 03066
pseudo-R2 05726 05785 05794 05798
RESET test(pvalue)
008(07764)
031(05749)
098(03228)
058(04458)
Note and indicate signicance at the 1 5 and 10 levels respectively Heteroskedasticity
robust standard errors (using HuberWhitesandwich estimator of variance) are in brackets
43
Table 10 Robustness check alternative estimators
Dependent variable Turnover Turnover log (1+Turnover) log (1+Turnover) log (Turnover) TurnoverSample Baseline Large Baseline Large Positive obs Positive obs
Estimator NB QGPML NB QGPML OLS OLS OLS PPML
Coef SE Coef SE Coef SE Coef SE Coef SE Coef SE
log (GDP percap
j ) 13260 (00905) 15760 (00885) 02498 (00186) 01799 (00115) 03220 (00829) 06746 (01194)
log (Popj) 06713 (00543) 07788 (00496) 01498 (00114) 00867 (00052) 02043 (00412) 03851 (00668)
log (distij) -00096 (00727) -00272 (00731) -00970 (00276) -00595 (00179) -00376 (00646) 01491 (00831)
Contigij 12222 (03738) 11660 (03724) 04481 (02452) 02661 (01507) 09414 (03763) 09499 (05039)
Lij 01798 (02021) 02321 (02048) -00172 (01096) 00395 (00715) 00406 (02017) 01730 (02267)
Colonyij 08065 (01961) 08329 (01999) 02891 (01056) 01839 (00692) 05244 (02073) 04588 (01819)
RTAij 10390 (01444) 11684 (01385) 02864 (00437) 01740 (00308) 03097 (01293) 04707 (01874)
Territoryij 15766 (03886) 19186 (03838) 09157 (02682) 05510 (01705) 07364 (03569) 04184 (05015)
GFCDumj -02712 (03476) -02703 (03424) 02372 (02123) 05326 (02201) -01409 (02505) -08033 (04258)
GFCRatingj 10837 (04877) 08924 (04796) 24382 (03589) 24321 (03766) 14269 (03593) 14864 (05598)
THHinesj 06531 (02150) 08079 (02056) 01257 (00630) -00169 (00358) 00501 (02231) 04553 (03747)
No obs 4762 7912 4762 7912 811 811
No positive obs 811 811 811 811 811 811
No partners 138 228 138 228 137 137
No Tax Havens 26 43 26 43 25 25
Log Likelihood -168649 -150983 -226591
BIC 337687 302380 453477
R2 03321 03007 02697 02941
RESET test 009(07610)
112(02905)
36002(00000)
48168(00000)
054(04625)
1237(00004)
Note and indicate signicance at the 1 5 and 10 levels respectively Heteroskedasticity robust standard errors (using HuberWhitesandwich
estimator of variance) are in brackets
44
Additional appendix - not intended for publication
Table A Specication with alternative tax rates
Dependent variable Turnoverkij Turnoverkij Turnoverkij TurnoverkijEstimator PPML PPML PPML PPML
Coef SE Coef SE Coef SE Coef SE
log (GDP percap
j ) 11278 (01383) 11501 (01902) 11031 (00968) 11329 (01254)
log (Popj) 04777 (01126) 05398 (00639) 05084 (00709) 05496 (00767)
log (distij) 00644 (00922) 00610 (00865) 00435 (00876) 00626 (00828)
Contigij 11808 (05411) 12654 (04805) 12398 (04637) 12652 (04920)
Lij 02612 (02639) 02722 (02245) 03302 (02286) 02613 (02370)
Colonyij 06852 (02606) 05871 (01798) 05602 (01741) 05933 (01716)
RTAij 05403 (02675) 07065 (02281) 07369 (02414) 07061 (02043)
Territoryij -02234 (10240) 12070 (06581) 12082 (06246) 11986 (05807)
GFCDumj -06041 (04975) -05001 (03839) -05282 (03706) -05040 (04012)
GFCRatingj 17645 (07808) 16867 (05515) 17026 (05520) 16852 (05816)
ETRDowndj 07542 (13058)
ETRpredictj 06824 (40521)
STRj 15496 (12756)
ETRDum25j 00016 (02772)
No obs 2282 4762 4762 4762
No positive obs 621 811 811 811
No partners 71 138 138 138
No Tax Havens(THHines
j =1)10 26 26 26
Log Likelihood -329899 -382061 -380625 -382103
BIC 660138 764512 761641 764597
R2 01852 02962 02947 02970
pseudo-R2 04599 05726 05742 05726
RESET test(pvalue)
002(08952)
016(06934)
037(05413)
009(07616)
Note and indicate signicance at the 1 5 and 10 levels respectively Heteroskedasticity
robust standard errors (using HuberWhitesandwich estimator of variance) are in brackets
Additional gures
In order to characterize the geographic dispersion of tax havens and their country prole we display
two cartograms scaled by turnover Figure A plots a worldwide map we observe that tax havens are
wealthy countries scattering around advanced countries in Europe the North American continent
45
and a few in Asia The red circles scale the reported turnover Figure B focuses on Europe and
conrms a high concentration of tax havens of both large and small size
46
Figure A Cartogram Worldwide View
Figure B Cartogram European View
47
Tax havens in the academic literature in economics
We searched for academic articles using online archive collections provided by Elsevier (ScienceDi-
rect) Wiley and Jstor These platforms give access to the most in13uential academic journals
worldwide We searched in titles abstracts and keywords and restricted our query to journal
articles in Business Economics and Finance We also used Econlit Ideas and the Google Scholar
All the queries have been made in February 27-28 2017
Figure C Number of academic articles in economic journals about tax haven
48
Table B Academic articles in economics about tax haven breakdown by sub-discipline
Elsevier Jstor Wiley Total Accounting 16 3 5 24 21Public Economics amp Political Economy 9 9 3 21 18Law amp Economics 3 0 1 4 3International Economics amp Eco Geography 5 0 4 9 8Development Economics 4 0 3 7 6Financial amp Monetary Economics 6 1 1 8 7Business amp Management 4 5 4 13 11General amp miscellaneous 12 10 9 31 26Total 59 28 30 117 100
Note The queries is based on the wording tax haven in Abstract Title Keywords for the cat-
egories Economics Econometrics and Finance and Business Management and Accounting for
Journal between 1980-2017 Queries have been made in February 27-28 2017 Academic articles
are collected from ScienceDirect-Elsevier Wiley and Jstor (only journal articles are considered)
Table C Articles about tax haven in Top 100 academic journals in economics (IDEAS)
Rank Top 100 Academic Journals in economics Search21 Journal of Public Economics Elsevier 820 Journal of International Economics Elsevier 446 Journal of International Business Studies Palgrave Macmillan 42 The Quarterly Journal of Economics Oxford University Press 24 Journal of Financial Economics Elsevier 214 Journal of Economic Perspectives American Economic Association 233 World Development Elsevier 253 Journal of Economic Behavior amp Organization Elsevier 254 Economics Bulletin AccessEcon 28 Journal of Finance American Finance Association 116 The Review of Economics and Statistics MIT Press 118 Journal of Banking amp Finance Elsevier 126 European Economic Review Elsevier 138 Economics Letters Elsevier 139 American Economic Journal Econ Policy American Economic Association 142 Energy Policy Elsevier 152 Journal of Economic Dynamics and Control Elsevier 187 Scandinavian Journal of Economics Wiley Blackwell 198 Journal of Business Research Elsevier 1
Note The queries is based on the wording tax haven in Abstract Title Keywords for the cat-
egories Economics Econometrics and Finance and Business Management and Accounting for
Journal between 1980-2017 Queries have been made in February 27-28 2017 Academic articles
are collected from ScienceDirect-Elsevier Wiley and Jstor (only journal articles are considered)
49
Figure D Literature Review A Typology
50
Denitions
List of tax havens
The list of tax havens is derived from Hines and Rice (1994) Andorra Anguilla Antigua and
Barbuda Bahamas Bahrain Barbados Belize Bermuda British Virgin Islands Cayman Islands
Channel Islands (Jersey Guernsey) Cook Islands Cyprus Dominica Gibraltar Grenada Hong
Kong Ireland Isle of Man Jordan Lebanon Liberia Liechtenstein Luxembourg Macao
Maldives Malta Marshall Islands Monaco Montserrat Netherlands Antilles (Aruba Curaao Sint
Maarten) Panama Saint Kitts and Nevis Saint Lucia Saint Martin Saint Vincent and the
Grenadines Singapore Switzerland Turks and Caicos Islands Vanuatu Note Population gt 2
million
The Country-by-Country Reporting
Recital (52) of CRD clearly presents the motivations behind the CbCR35
CBCR will help stakeholders to get a better understanding of groups structures their ac-
tivities and geographical presence In addition CBCR should help understanding of whether
taxes are being paid where the actual business activity takes place Disclosure and trans-
parency are seen as key regulatory tools which help to ensure that rms eectively implement
their obligations and are accountable for the business strategies which they adopt
The new CBCR obligations must be seen against the background of the recent nancial crisis
in which unprecedented levels of public support were necessary in order to restore nancial
stability and the trust of citizens in the nancial sector was heavily aected This led to
strong demands for banks to show greater accountability and increased transparency in their
relations with the public
Independently from the nancial crisis there are increasing calls on companies to take re-
sponsibility for their impact on society and the contribution that businesses make in the form
of taxation is increasingly seen as part of corporate social responsibility This has increased
demand for more transparency in the tax aairs of large enterprises in particular where they
have signicant cross-border activities
Institutional Indicators
ETRDowndj we use the data provided by Dowd et al (2016) They calculate an average
based on individual rm rates by dividing taxes paid by prots They then create country-
35See also httpeur-lexeuropaeulegal-contentENTXTuri=CELEX3A52014DC0676
51
year average tax rates by taking the prot-weighted average of the rm-specic rates within
a country and year
ETRpredictj we run an ETR determination model including the statutory corporate tax rate
and a vector of controls We rely on a sample of 80 countries and obtain a determination model
with an R2 statistics of 40 In a second step we collect all available statutory corporate tax
rates and controls from dierent sources and we predict the missing ETR for a total of 228
countries
AML We use data provided by the BaselInstitute of Governance (expert edition) based on 14
dierent indicators coming from 14 dierent sources They are aggregated using a weighting
scheme based on a qualitative expert assessment implying that the individual indicators are
not weighted equally A countrys overall score is calculated based on available data only and
missing values are not replaced (for details see Basel AML index (2016)
Governance we use the WGI compiled by Kaufmann et al (2011) The overall measure
of countries governance institutions is aggregated from 352 dierent underlying governance-
related variables grouped into six categories voice and accountability political stability gov-
ernment eectiveness regulatory quality rule of law and control of corruption
GFCIj The GFCI was created in 2005 and rst published by ZYen Group in March 2007
The GFCI is updated and republished each September and March It includes 84 nancial
centres Using clustering and correlation analysis they determine a nancial centres pro-
le along 5 dierent dimensions of competitiveness Business Environment Financial Sector
Development Infrastructure Human Capital and Reputational and General Factors
52
EUROPEAN ECONOMY DISCUSSION PAPERS
European Economy Discussion Papers can be accessed and downloaded free of charge from the following address httpseceuropaeuinfopublicationseconomic-and-financial-affairs-publications_enfield_eurovoc_taxonomy_target_id_selective=Allampfield_core_nal_countries_tid_selective=Allampfield_core_date_published_value[value][year]=Allampfield_core_tags_tid_i18n=22617 Titles published before July 2015 under the Economic Papers series can be accessed and downloaded free of charge from httpeceuropaeueconomy_financepublicationseconomic_paperindex_enhtm Alternatively hard copies may be ordered via the ldquoPrint-on-demandrdquo service offered by the EU Bookshop httppublicationseuropaeubookshop
HOW TO OBTAIN EU PUBLICATIONS Free publications bull one copy
via EU Bookshop (httppublicationseuropaeubookshop) bull more than one copy or postersmaps
- from the European Unionrsquos representations (httpeceuropaeurepresent_enhtm) - from the delegations in non-EU countries (httpseeaseuropaeuheadquartersheadquarters- homepageareageo_en) - by contacting the Europe Direct service (httpeuropaeueuropedirectindex_enhtm) or calling 00 800 6 7 8 9 10 11 (freephone number from anywhere in the EU) () () The information given is free as are most calls (though some operators phone boxes or hotels may charge you)
Priced publications bull via EU Bookshop (httppublicationseuropaeubookshop)
ISBN 978-92-79-64901-1
KC-BD-17-055-EN
-N
- Blank Page
- Blank Page
- Blank Page
-
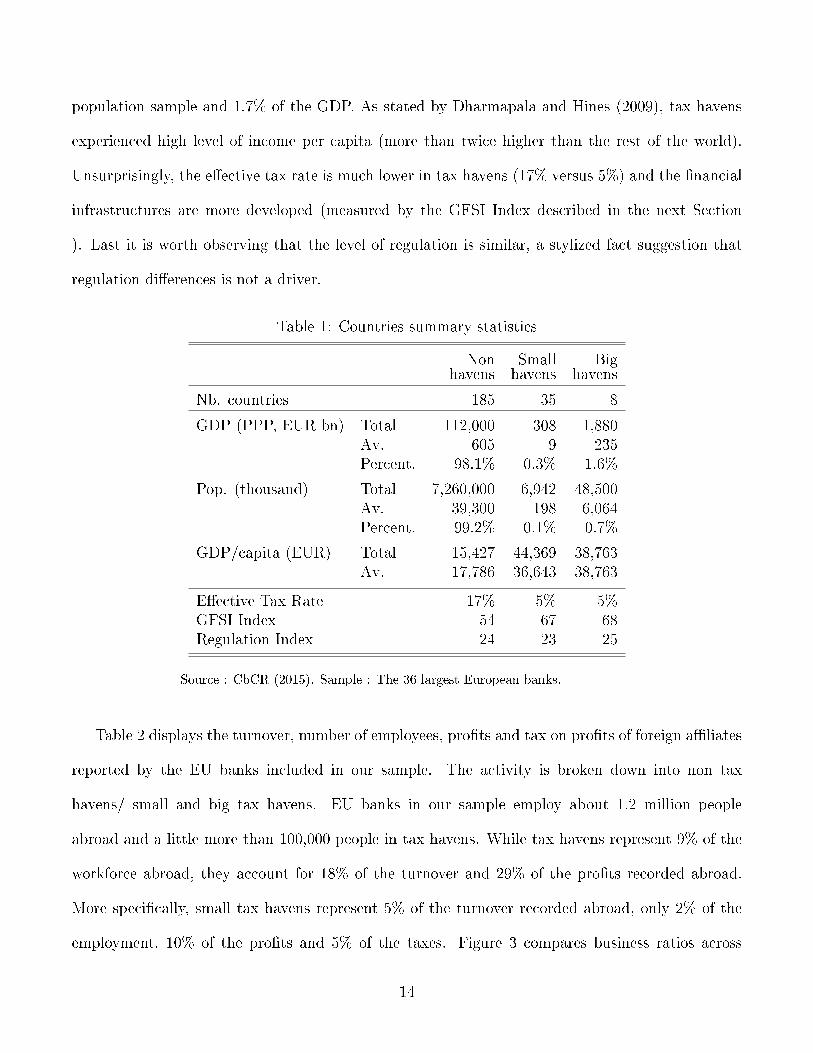
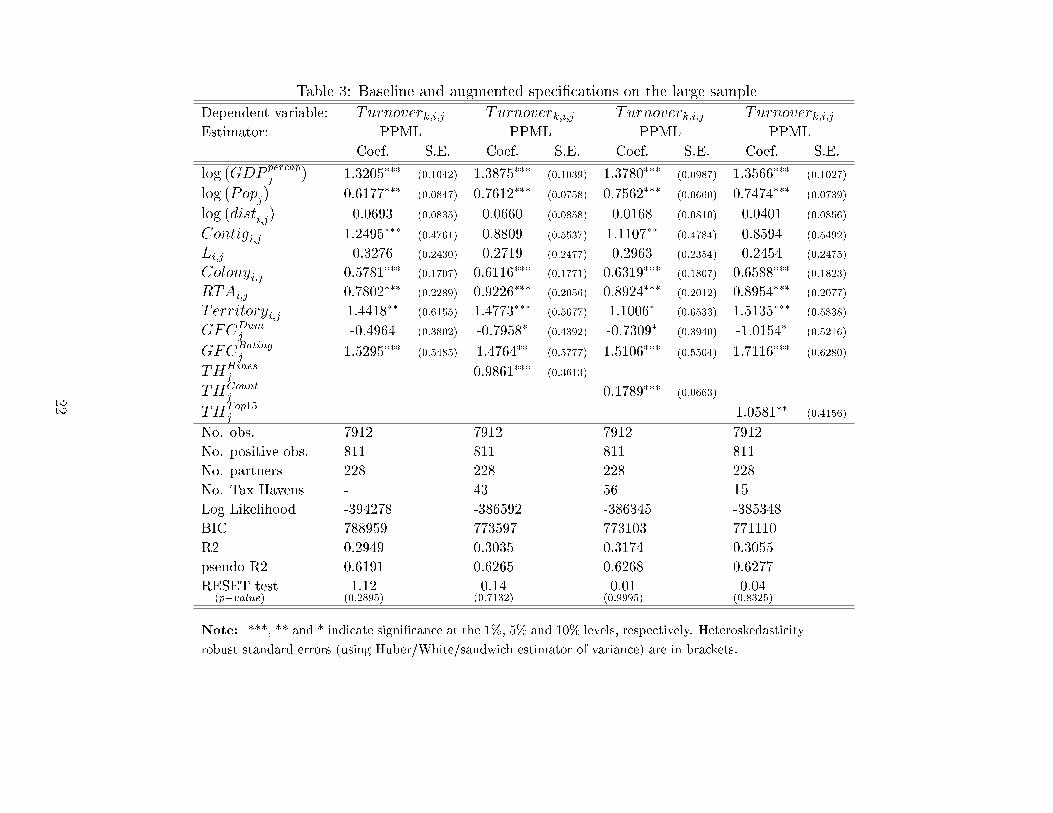
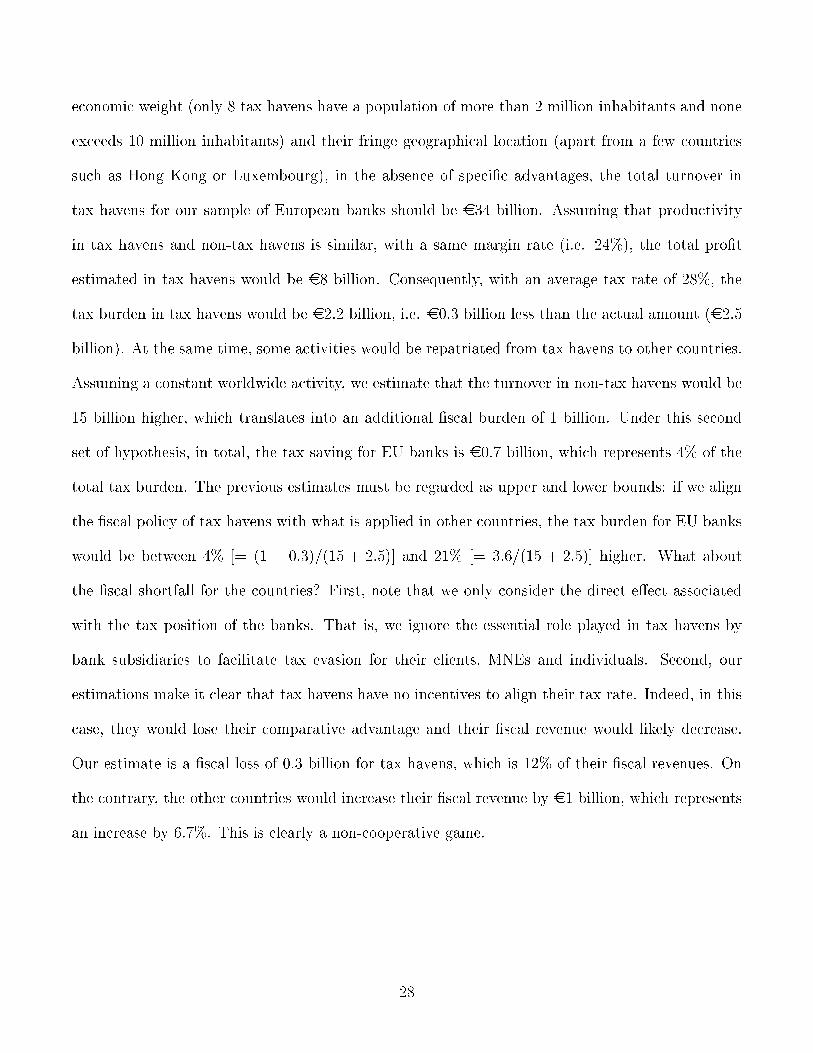
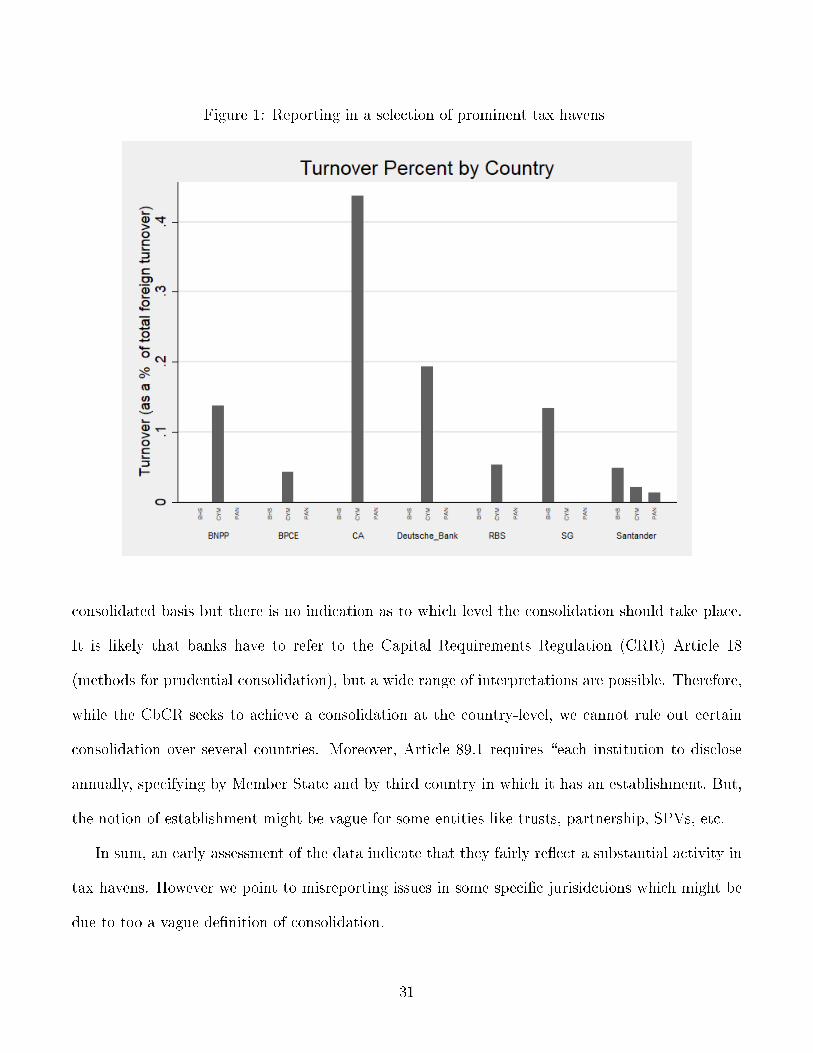
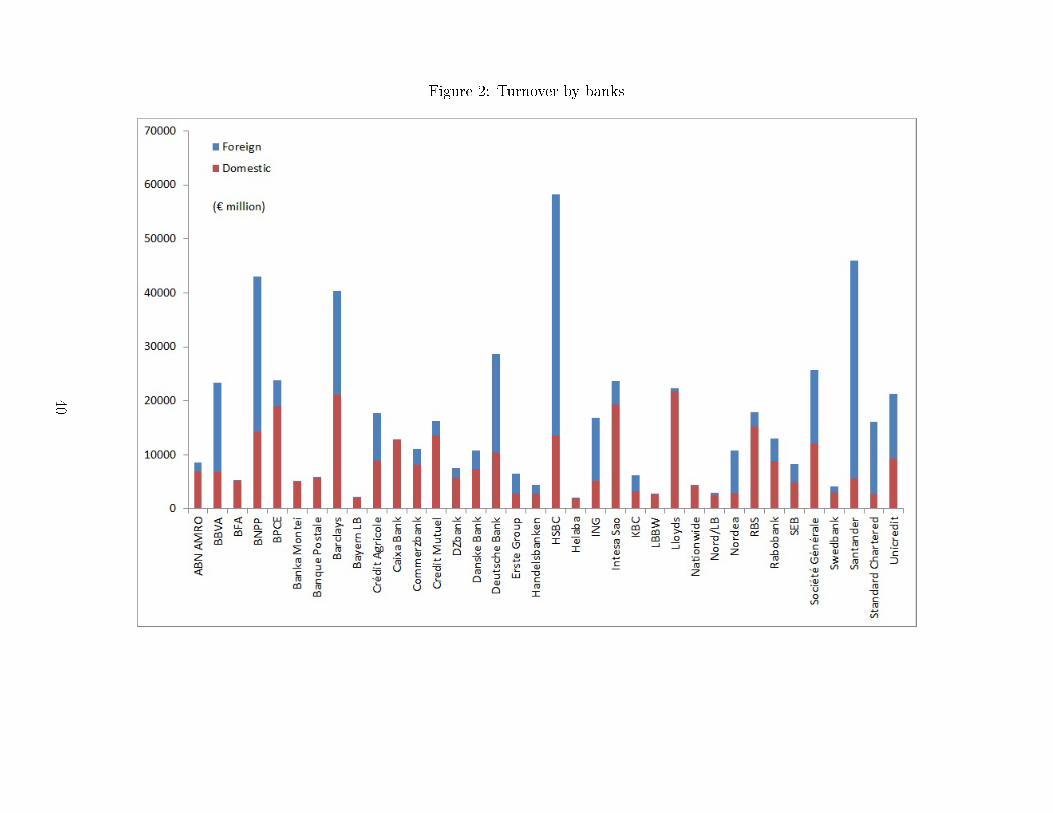
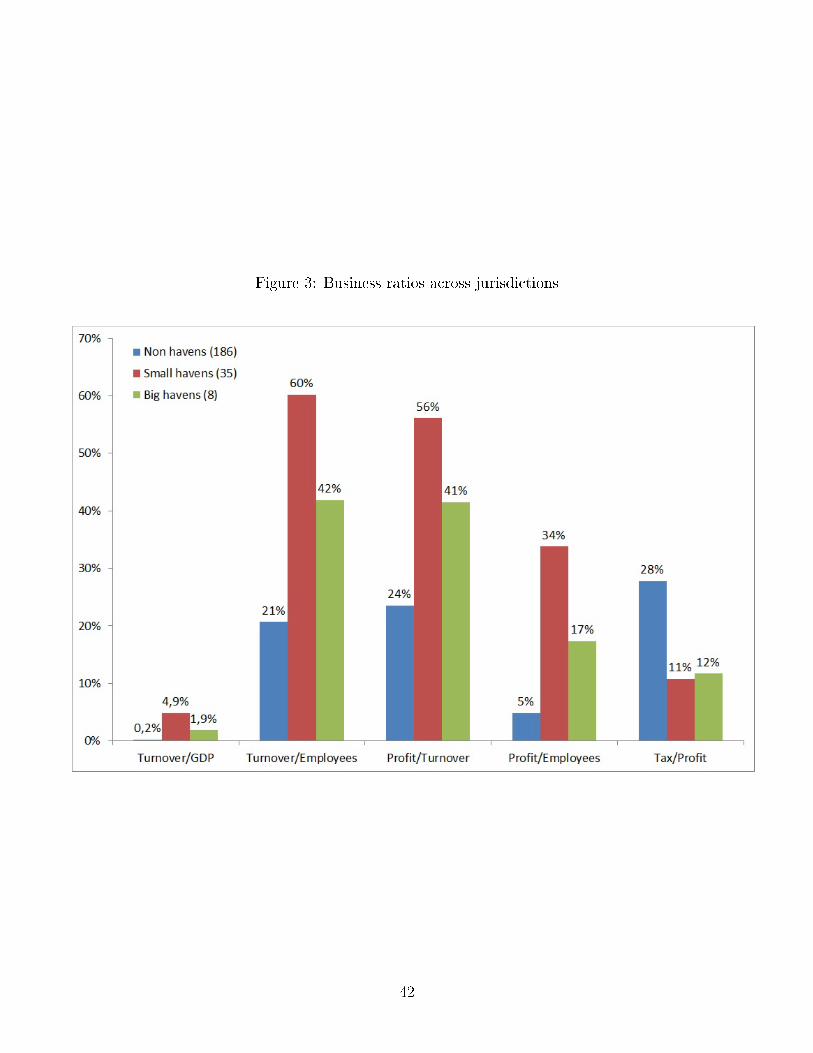
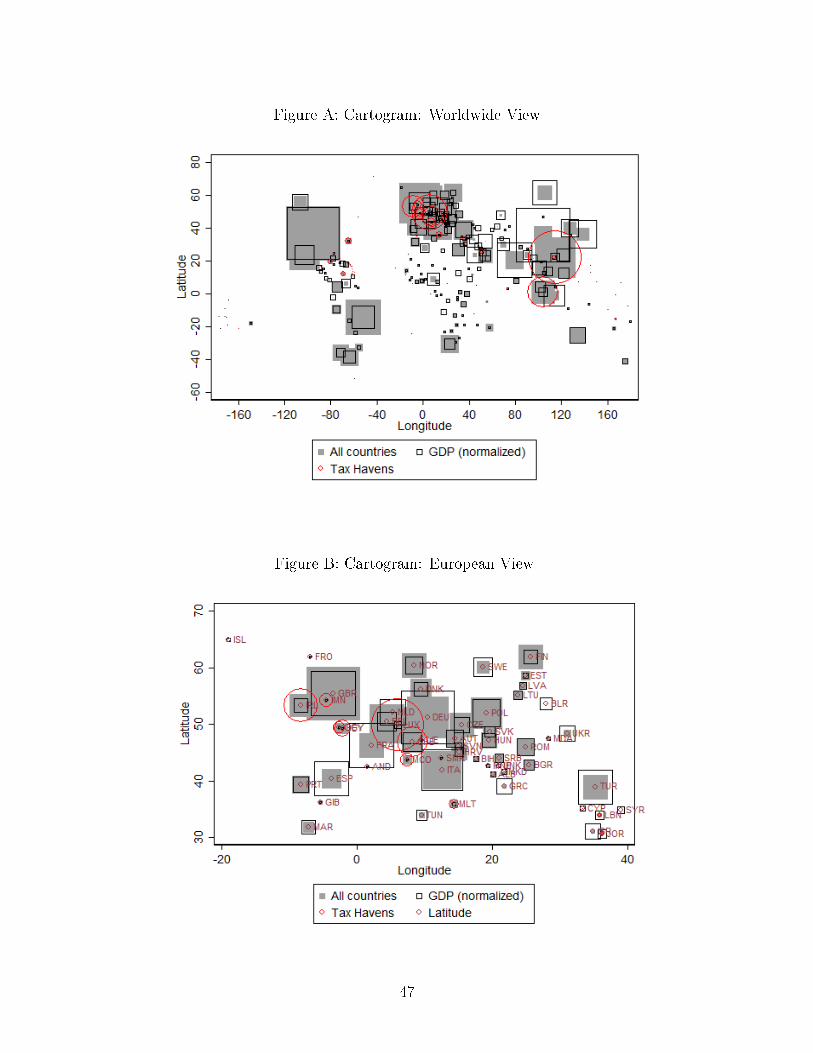
ISBN 978-92-79-64901-1
KC-BD-17-055-EN
-N
- Blank Page
- Blank Page
- Blank Page
-