Bank of theWest and Subsidia ries...180 Mo ntgome ry Street, San Fra ncisco, CA 94104 415.765.4800...
65
Bank of the West and Subsidiaries 2010 Annual Report Financial Statements
Transcript of Bank of theWest and Subsidia ries...180 Mo ntgome ry Street, San Fra ncisco, CA 94104 415.765.4800...

180 Montgomery Street, San Francisco, CA 94104415.765.4800 • www.bankofthewest.com
Bank of theWestand Subsidiaries
2010 Annual Report Financial Statements
111001 BOW AR_Financial Cover_final_v2:Layout 1 3/15/11 5:34 PM Page 1

REPORT OF INDEPENDENT AUDITORS
To the Board of Directors and Stockholdersof Bank of the West and its subsidiaries:
In our opinion, the accompanying consolidated balance sheets and the related consolidatedstatements of income, consolidated statements of changes in equity and comprehensive income andconsolidated statements of cash flows present fairly, in all material respects, the financial position ofBank of the West and its subsidiaries (“the Bank”) at December 31, 2010 and December 31, 2009, andthe results of their operations and their cash flows for the years then ended in conformity withaccounting principles generally accepted in the United States of America. These financial statements arethe responsibility of the Bank’s management. Our responsibility is to express an opinion on thesefinancial statements based on our audits. We conducted our audits of these statements in accordancewith the standards generally accepted in the United States of America. Those standards require that weplan and perform the audit to obtain reasonable assurance about whether the financial statements arefree of material misstatement. An audit includes examining, on a test basis, evidence supporting theamounts and disclosures in the financial statements, assessing the accounting principles used andsignificant estimates made by management, and evaluating the overall financial statement presentation.We believe that our audits provide a reasonable basis for our opinion.
/s/ PricewaterhouseCoopers LLPSan Francisco, CAMarch 21, 2011
-1-2010 Bank of the West Annual Report

BANK OF THE WEST AND SUBSIDIARIESCONSOLIDATED STATEMENTS OF INCOME
(dollars in thousands) 2010 2009Year Ended December 31,
Interest incomeLoans $1,997,836 $2,145,955Lease financing 144,464 161,972Securities available for sale 181,829 277,328Other 4,301 8,386
Total interest income 2,328,430 2,593,641Interest expenseDeposits 255,502 465,414Short-term borrowings 863 10,793Long-term debt 289,020 412,789
Total interest expense 545,385 888,996Net interest income 1,783,045 1,704,645Provision for loan and lease losses 512,782 1,324,723
Net interest income after provision for loan and lease losses 1,270,263 379,922Noninterest incomeService charges on deposit accounts 173,556 200,752Trust and investment services income 17,647 15,635Brokerage service fees 46,336 43,162Credit and debit card fees 102,789 86,085Other service charges and fees 89,323 86,591Net losses on debt securities available for sale(1) (35,951) (311,863)Income from bank-owned life insurance 21,624 26,425Net gains on customer accommodation derivatives 10,012 19,888Loss on credit guarantee derivative (73,201) -Write-downs of other real estate owned assets, net (36,770) (17,609)Other 43,317 9,342
Total noninterest income 358,682 158,408Noninterest expenseSalaries and employee benefits 697,617 674,318Occupancy 134,434 134,756Outside services 125,089 126,155FDIC assessments 85,060 83,348Intangible amortization 35,353 37,499Equipment 56,558 58,079Advertising and marketing 41,817 33,833Collection and repossession 33,710 26,329Restructuring cost - 9,396Other 144,367 146,000
Total noninterest expense 1,354,005 1,329,713Income (loss) before income taxes and noncontrolling interest 274,940 (791,383)Income tax expense (benefit) 89,600 (388,252)
Net income (loss) before noncontrolling interest 185,340 (403,131)Net income attributable to noncontrolling interest 740 225
Net income (loss) attributable to Bank of the West $ 184,600 $ (403,356)
(1) Includes other-than-temporary impairment (OTTI) losses of $8.2 and $240.8 million recognized in earnings ($12.3 millionand $309.8 million of total OTTI losses, net of $4.1 million and $69.0 million recognized in other comprehensive income) forthe years ended December 31, 2010 and 2009, respectively.
The accompanying notes are an integral part of these consolidated financial statements.
-2-2010 Bank of the West Annual Report

BANK OF THE WEST AND SUBSIDIARIESCONSOLIDATED BALANCE SHEETS
(dollars in thousands, except per share amounts) 2010 2009December 31,
AssetsCash and due from banks $ 683,530 $ 878,072Interest-bearing deposits in other banks 118,738 447,019Federal funds sold and securities purchased under agreements to resell - 320,000Trading assets 5,500 5,107Securities available for sale 6,128,762 6,449,316Loans held for sale 107,440 51,804Loans and leases:
Loans and leases 43,007,720 44,424,547Less allowance for loan and lease losses 1,059,017 1,220,661
Net loans and leases 41,948,703 43,203,886Premises and equipment, net 462,547 464,130Customers’ acceptance liability 7,469 3,362Goodwill 4,201,143 4,198,945Other intangibles, net 132,303 159,349Other real estate owned and repossessed personal property 195,017 178,804Interest receivable 158,899 181,266Bank-owned life insurance 1,289,392 1,274,249Other assets 2,213,383 2,185,281
Total assets $57,652,826 $60,000,590Liabilities and EquityDeposits:
Interest-bearing $28,257,259 $30,797,431Noninterest-bearing 11,289,985 9,407,715
Total deposits 39,547,244 40,205,146Federal funds purchased and securities sold under agreements to repurchase 733,172 520,516Short-term borrowings 6,465 2,070Acceptances outstanding 7,469 3,362Long-term debt 5,812,535 9,561,677Liability for pension benefits 162,769 141,273Other liabilities 761,593 619,686
Total liabilities 47,031,247 51,053,730Equity:
Common stock, par value $0.001 per share in 2010 and 2009Authorized — 20,000,000 sharesIssued and outstanding — 5,548,359 and 5,039,194 shares at
December 31, 2010 and 2009, respectively 6 5Additional paid-in capital 9,728,178 8,332,394Retained earnings 1,027,871 843,271Accumulated other comprehensive loss (158,325) (234,584)
Total Bank of the West stockholder’s equity 10,597,730 8,941,086Noncontrolling interest 23,849 5,774Total equity 10,621,579 8,946,860Total liabilities and equity $57,652,826 $60,000,590
The accompanying notes are an integral part of these consolidated financial statements.
-3-2010 Bank of the West Annual Report

BANK OF THE WEST AND SUBSIDIARIESCONSOLIDATED STATEMENTS OF CHANGES IN EQUITY AND COMPREHENSIVE INCOME
(dollars in thousands) Shares Amount
AdditionalPaid-inCapital
RetainedEarnings
AccumulatedOther
ComprehensiveIncome (Loss)
Total Bankof the West
Stockholder’sEquity
Non-controlling
InterestTotal
Equity
Common Stock
Balance, January 1, 2009 4,773,943 $5 $7,729,444 $1,257,439 $(267,392) $ 8,719,496 $ 3,834 $ 8,723,330Comprehensive income:
Net income (loss) - - - (403,356) - (403,356) 225 (403,131)Cumulative effect from change in
accounting for other-than-temporaryimpairment on debt securities, net of tax - - - 14,490 (14,490) - - -
Other comprehensive income (loss), net oftax:
Pension - - - - 19,960 19,960 - 19,960Unrealized net gains (losses) on
securities available for sale arisingduring the year - - - - (145,369) (145,369) - (145,369)
Unrealized losses related to factorsother than credit, net of amountsreclassified in the income statement - - - - (24,740) (24,740) - (24,740)
Reclassification of net realized losseson securities available for saleincluded in net income - - - - 185,247 185,247 - 185,247
Unrealized net losses on cash flowderivative hedges arising during theyear - - - - (4,514) (4,514) - (4,514)
Reclassification of net realized losseson cash flow derivative hedgesincluded in net income - - - - 16,714 16,714 - 16,714
Comprehensive income (loss) - - - (388,866) 32,808 (356,058) 225 (355,833)Stock options - - 2,949 - - 2,949 - 2,949Dividends - - - (25,302) - (25,302) - (25,302)Stock issuance 265,251 - 600,001 - - 600,001 - 600,001Noncontrolling interest - - - - - - 1,715 1,715Balance, December 31, 2009 5,039,194 $5 $8,332,394 $ 843,271 $(234,584) $ 8,941,086 $ 5,774 $ 8,946,860
Comprehensive income:Net income - - - 184,600 - 184,600 740 185,340
Other comprehensive income (loss), net oftax:
Pension - - - - (7,394) (7,394) - (7,394)Unrealized net gains (losses) on
securities available for sale arisingduring the year - - - - 16,608 16,608 - 16,608
Reclassification of losses on previouslycredit-impaired securities included innet income - - - - 38,688 38,688 - 38,688
Reclassification of net realized losseson securities available for saleincluded in net income - - - - 21,355 21,355 - 21,355
Unrealized net losses on cash flowderivative hedges arising during theyear - - - - (2,934) (2,934) - (2,934)
Reclassification of net realized losseson cash flow derivative hedgesincluded in net income - - - - 9,936 9,936 - 9,936
Comprehensive income - - - 184,600 76,259 260,859 740 261,599Stock options - - 2,333 - - 2,333 - 2,333Stock issuance 509,165 1 1,000,000 - - 1,000,001 - 1,000,001Capital infusion - - 393,451 - - 393,451 - 393,451Noncontrolling interest - - - - - - 17,335 17,335Balance, December 31, 2010 5,548,359 $6 $9,728,178 $1,027,871 $(158,325) $10,597,730 $23,849 $10,621,579
The accompanying notes are an integral part of these consolidated financial statements.
-4-2010 Bank of the West Annual Report

BANK OF THE WEST AND SUBSIDIARIESCONSOLIDATED STATEMENTS OF CASH FLOWS
(dollars in thousands) 2010 2009Year Ended December 31,
Cash flows from operating activitiesNet income (loss) $ 184,600 $ (403,356)Adjustments to reconcile net income to net cash provided by operating activities:
Provision for loan losses 512,782 1,324,723Net losses on securities available for sale 35,951 311,863Net gains on sale of loans (21,620) (7,180)Net (increase) decrease in trading assets (393) 38Depreciation and amortization 168,777 169,224Deferred income taxes (18,899) (218,740)Decrease (increase) in interest receivable and other assets 39,858 (16,787)Increase (decrease) in interest payable and other liabilities 141,907 (371,505)Change in fair value of credit guarantee derivative 73,201 -Originations of loans held for sale (1,052,128) (410,607)Proceeds from sales of loans held for sale 1,046,169 361,045Other, net 49,217 32,270
Net cash provided by operating activities 1,159,422 770,988
Cash flows from investing activitiesSecurities available for sale:
Proceeds from maturities and prepayments 3,100,984 3,806,727Proceeds from sales 2,524,515 622,817Purchases (5,241,818) (2,820,604)
Net decrease in loans resulting from originations and collections 521,729 1,367,583Purchases of loans and leases (68,514) (49,625)Proceeds from sales of loans 37,891 389,892Purchase of premises and equipment (55,738) (26,997)Decrease in bank-owned life insurance investments 6,481 4,175Decrease in long-term securities purchased under agreements to resell - 100,000Other, net 182,292 83,289
Net cash used for investing activities 1,007,822 3,477,257
Cash flows from financing activitiesNet (decrease) increase in deposits (488,381) 2,943,975Net increase (decrease) in short-term borrowings under three months 211,680 (7,061,428)Proceeds from issuance of short-term borrowings 5,371 -Repayment of short-term borrowings - (707,000)Proceeds from issuance of long-term debt - 1,152,509Repayment of long-term debt (3,741,704) (3,064,606)Cash dividends paid - (25,302)Proceeds from issuance of common stock 1,000,001 600,001Noncontrolling interest 2,966 1,940
Net cash provided by financing activities (3,010,067) (6,159,911)
Net increase (decrease) in cash and cash equivalents (842,823) (1,911,666)Cash and cash equivalents at beginning of year 1,645,091 3,556,757
Cash and cash equivalents at end of year $ 802,268 $ 1,645,091
Supplemental disclosuresInterest paid $ 577,167 $ 676,206Income taxes paid 48,016 60,054Noncash investing and financing activities:
Capital infusion 393,451 -Transfer from deposits for the settlement of credit guarantee derivative 169,521 -Transfers into (out of) loans held for sale 42,136 (88,427)Transfers from loans to foreclosed properties 171,432 160,713Increase in loans and leases due to consolidation of variable interest entities 15,109 -
The accompanying notes are an integral part of these consolidated financial statements.
-5-2010 Bank of the West Annual Report

1. Organization and Summary of Significant Accounting Policies
Bank of the West (“BOW”) is a State of California chartered bank. BOW has 662 retail branchbanking locations (646 full service retail branches and 16 limited service retail offices) and othercommercial banking offices located in Arizona, California, Colorado, Idaho, Iowa, Kansas, Minnesota,Missouri, Nebraska, Nevada, New Mexico, North Dakota, Oklahoma, Oregon, South Dakota, Utah,Washington, Wisconsin and Wyoming providing a wide range of financial services to both consumersand businesses. BOW also has branches serving Pacific Rim customers, specializing in domestic andinternational products and services in predominantly Asian American communities. In addition, the Bankhas a commercial banking office in New York and an offshore office in the Cayman Islands. Lendingand other services focus on corporate, consumer and smaller middle market businesses. Bank of theWest’s principal subsidiaries include Essex Credit Corporation (“Essex”), BW Insurance (“BWI”) andBancWest Investment Services, Inc. (“BWIS”). The terms “the Bank,” “we,” “our,” “us” and similarterms as used in this report refer to Bank of the West and its subsidiaries.
BancWest Corporation (“BancWest”), a financial holding company, as of December 31, 2010 and2009, owned 83.22% and 81.53% of the outstanding common stock of the Bank, respectively. Thebalance of the Bank’s common stock is held by BNP Paribas (“BNPP”). The Bank received additionalcapital of approximately $1 billion in 2010 and $600 million in 2009 by issuing 509,165 shares and265,251 shares of common stock, respectively to BancWest, which in turn, received the related fundingfrom BNPP. Subsequent to year-end, BancWest repaid debt owed to BNPP, which was collateralized bycommon shares of the Bank’s stock that were transferred to BNPP as part of the debt arrangement. Uponrepayment of the debt, the collateral of 485,413 shares was transferred to BancWest whose ownershippercentage increased to 91.97%. The Bank also had authorized 1,000,000 shares of preferred stock, noneof which were issued or outstanding at December 31, 2010 and 2009.
BancWest is a wholly owned subsidiary of BNPP. BancWest’s other bank subsidiary (wholly owned)is First Hawaiian Bank.
RegulationThe Bank’s primary regulators are the Federal Deposit Insurance Corporation (“FDIC”) and the
California Department of Financial Institutions. The Bank is a member of the Federal Home Loan BankSystem and is required to maintain an investment in the capital stock of the Federal Home Loan Bank.The Bank maintains insurance on its customer deposit accounts with the FDIC, which requires quarterlyassessments of deposit insurance premiums.
Basis of PresentationThe accounting and reporting policies of the Bank and its subsidiaries conform to accounting
principles generally accepted in the United States (“GAAP”). The accompanying consolidated financialstatements include the accounts of the Bank and all of its wholly-owned, majority-owned or controlledsubsidiaries and variable interest entities (“VIEs”) if the Bank determines it is the primary beneficiary.All material intercompany transactions among the Bank and its consolidated entities have beeneliminated.
For consolidated entities where it holds less than a 100% interest, the Bank reports income or lossattributable to noncontrolling shareholders in the consolidated statements of income, and the equityinterest attributable to noncontrolling shareholders in the equity section of the consolidated balancesheets.
Use of Estimates in the Preparation of Financial StatementsThe preparation of financial statements in accordance with GAAP requires management to make
judgments using estimates and assumptions. Actual results could differ from these estimates andassumptions.
-6-2010 Bank of the West Annual Report
ReclassificationsCertain amounts in the financial statements for the prior year have been reclassified to conform to
the current financial statement presentation.
Cash and Due from BanksCash and due from banks include amounts due from other financial institutions as well as in-transit
clearings. Under the terms of the Depository Institutions Deregulation and Monetary Control Act, theBank is required to maintain noninterest-earning reserve balances against certain deposit liabilities withthe Federal Reserve Bank. The average amount of these reserve balances, including coin and currency,was $292 million and $403 million in 2010 and 2009, respectively.
For purposes of the consolidated statement of cash flows, the Bank includes as cash and cashequivalents, cash and due from banks, interest-bearing deposits in other banks and Federal funds soldand securities purchased under agreements to resell.
SecuritiesSecurities are classified as trading, available-for-sale or held-to-maturity.
Securities used for trading purposes are classified as trading and are carried at fair value withunrealized gains and losses included in the consolidated statements of income.
Investments in debt securities and marketable equity securities having readily determinable fairvalues and not used for trading purposes are classified as available for sale and are carried at estimatedfair value with net unrealized gains and losses included in accumulated other comprehensive income(loss), net of applicable income taxes. Refer to Note 16 for information on fair value measurement ofthe securities. Amortization of premiums and accretion of discounts for the investment securitiesclassified as available for sale are included in interest income. Realized gains and losses on the sales ofinvestment securities available for sale are determined using the specific identification method.
Nonmarketable equity securities include stock of the Federal Home Loan Banks of San Franciscoand Topeka, and are carried at cost. The Bank is a member of the Federal Home Loan Bank system.Members are required to own a certain amount of stock based on the level of borrowings and otherfactors, and may invest in additional amounts. These securities are included in other assets.
The Bank evaluates its investment securities portfolio on a quarterly basis for indications ofother-than-temporary impairment. The cost basis of a security is written down through a charge toearnings when a decline in value below amortized cost is considered to be other-than-temporary. For adebt security that the Bank intends to sell or will more likely than not be required to sell before recoveryof its amortized cost basis, an other-than-temporary impairment is recognized in earnings equal to thedifference between the security’s amortized cost and its fair value at the balance sheet date. If the Bankdoes not expect to recover the entire amortized cost basis of the security, but does not plan to sell thesecurity or it is not likely to be required to sell the security before the recovery of its entire amortizedcost basis, then the other-than-temporary impairment is separated into (1) the amount representing acredit loss and (2) the amount related to all other factors. The amount of the other-than-temporaryimpairment related to credit loss is recognized in earnings while the amount related to other factors isrecognized in other comprehensive income (“OCI”), net of applicable taxes. Subsequently, the Bankaccounts for the other-than-temporarily impaired security as if the security had been purchased on themeasurement date of the other-than-temporary impairment at an amortized cost basis equal to theprevious amortized cost basis less the other-than-temporary impairment recognized in earnings. Forequity securities, the Bank evaluates the securities for other-than-temporary impairment based on thelength of time fair value is below cost and the severity of the differences, the Bank’s intent and ability tohold the security until forecasted recovery of the fair value of the security, and the investee’s financialcondition and capital strength. If the Bank determines that the impairment on an equity security is otherthan temporary, an impairment loss equal to the difference between the carrying value of the securityand its fair value is recognized within noninterest income.
-7-2010 Bank of the West Annual Report

Loans Held for SaleThe Bank originates certain loans for individual sale. Such loans are classified as held for sale and
are carried at the lower of cost or fair value. Fair value is determined on an aggregate basis for eachtype of loan, based on collateral value, estimated cash flows or prevailing market prices for loans withsimilar characteristics. The excess of cost over fair value is recorded as a valuation allowance against theloans. Subsequent declines in fair value or recoveries of such declines are recognized as increases ordecreases in the valuation allowance and reported in noninterest income. For the years-endedDecember 31, 2010 and 2009 the Bank did not have any adjustments to record loans held for sale at thelower of cost or fair value.
Loan origination fees and direct costs are deferred at origination of the loan and recognized innoninterest income upon sale of the loan.
The Bank enters into short-term loan commitments to fund the loans that it originates at specifiedrates and also enters into forward commitments to sell those loans at specified prices. Such interest ratelock commitments to fund the loans and the commitments to sell those loans are accounted for asderivatives at fair value with subsequent changes in fair value recorded through noninterest income.
Loans and LeasesLoans and leases for which the Bank has the intent and the ability to hold for the foreseeable future
or until maturity or payoff are classified as loans and leases. The Bank’s loans and lease portfolio isdivided into two portfolio segments, which are the same segments used by the Bank to determine theallowance for credit losses, commercial and consumer. The portfolio segments are well diversified byborrower, collateral, and industry. The Bank further disaggregates its portfolio segments into variousclasses of loans for purposes of monitoring and assessing credit risk as described below.
Commercial LoansThe Bank disaggregates the commercial loan portfolio into the following classes:
• Loans to businesses for commercial, industrial and professional purposes except loans that aresecured by real estate (“Commercial & industrial”);
• Loans that are secured by multifamily properties and nonfarm or nonresidential real estateproperties (“Commercial real estate”);
• Loans secured by real estate to finance land development and construction of industrial,commercial, residential or farm building (“Construction”);
• Indirect and direct leases to finance commercial equipment purchases (“Equipment leases”);
• Loans to finance agricultural production and other loans to farmers (“Agriculture”).
Consumer LoansThe Bank disaggregates the consumer loan portfolio into the following classes:
• Consumer loans and leases such as autos, marine, recreational vehicles, personal lines of creditand credit cards (“Consumer loans and leases”);
• Closed-end loans secured by first and junior liens on 1-4 family residential properties(“Residential secured – closed-end”);
• Revolving, open-end loans secured by 1-4 family residential properties (“Residential secured –revolving, open-end”).
Loans that the Bank originates are recorded at the principal amount outstanding, net of unamortizeddeferred loan origination fees and costs. Deferred fees or deferred costs are accreted or amortized overthe contractual term of the loan, adjusted for actual prepayments, using the interest method or on astraight line basis for revolving loans.
-8-2010 Bank of the West Annual Report

Unimpaired loans purchased by the Bank are initially measured at fair value at the date ofacquisition. The difference between the principal amount of loans and their fair value is considered to bea premium or a discount and is recognized as an adjustment of yield over the contractual life of the loanusing the interest method, adjusted for actual prepayments. At the time of acquisition, the seller’sestimate for expected credit losses is not carried over or recorded by the Bank as a credit loss allowanceagainst the loans (see Allowance for Credit Losses below).
Interest income is accrued unless the loan is determined to be impaired and placed on nonaccrualstatus (see Nonaccrual Loans and Leases below). The Bank recognizes unaccreted or unamortized fees,costs, premiums and discounts on loans and leases paid in full as a component of interest income.
Direct financing leases are carried at the aggregate of lease payments receivable plus estimatedresidual value less unearned income. Unearned income on financing leases is accreted over the lives ofthe leases to provide a constant periodic rate of return on the net investment in the lease. The Bankreviews commercial lease residual values at least annually and recognizes residual value impairmentsthat are deemed to be other-than-temporary through the income statement.
The Bank also charges other loan and lease fees consisting of delinquent payment charges andservicing fees, including fees for servicing loans sold to third parties and recognizes such fees as incomewhen earned.
Nonaccrual Loans and LeasesThe Bank generally places a loan or lease on nonaccrual status when management believes that full
and timely collection of principal or interest has become doubtful; or it is 90 days past due as toprincipal or interest payments based on its contractual terms, unless it is well secured and in the processof collection.
When the Bank places a loan or lease on nonaccrual status, previously accrued and uncollectedinterest is reversed against interest income of the current period. When there are doubts about theultimate collection of the recorded balance on a nonaccrual loan or lease, cash payments by the borrowerare applied as a reduction of the principal balance, under the cost recovery method. Otherwise, the Bankrecords such payments as income.
Nonaccrual loans and leases are generally returned to accrual status when either (1) they becomecurrent as to principal and interest, there is a sustained period of repayment performance by theborrower and the bank expects payment of remaining contractual principal and interest; or (2) they areboth well secured and in the process of collection.
Not all impaired loans or leases are placed on nonaccrual status; for example, restructured loansperforming under restructured terms beyond a specific period may be classified as accruing, but maystill be deemed impaired (see Allowance for Credit Losses below).
Allowance for Credit LossesThe Bank maintains an allowance for loan and lease losses (the “Allowance”) against the carrying
value of the loans and leases to absorb estimated probable credit losses within the portfolio. TheAllowance is maintained at a level which, in management’s judgment, is adequate to absorb probablelosses that have been incurred and can be reasonably estimated as of the balance sheet date. TheAllowance is increased through provisions for loan and lease losses charged to earnings and reduced byprincipal charge-offs, net of recoveries.
The Allowance consists of two components, allocated and unallocated. The Bank determines theallocated component of the Allowance by measuring credit impairment on (i) an individual basis forlarger balance loans in the commercial portfolio that are on nonaccrual status and commercial loans in atroubled debt restructuring, and (ii) on a collective basis for groups of loans with similar riskcharacteristics and large groups or pools of homogeneous loans with smaller balances that are not
-9-2010 Bank of the West Annual Report

evaluated on a case-by-case basis such as credit card, residential mortgages and consumer installmentloans.
The Bank considers a loan to be impaired on an individual basis when, based on currentinformation and events, it is probable that it will be unable to collect all amounts due according to thecontractual terms of the loan. The Bank measures impairment by comparing the present value of theexpected future cash flows discounted at the loan’s effective interest rate with the recorded investment inthe loan, except for collateral-dependent loans. For collateral dependent loans, the Bank measuresimpairment by comparing the fair value of the collateral on an “as-is” basis less disposition costs withthe recorded investment in the loan. On a case-by-case basis, the Bank may measure impairment basedupon a loan’s observable market price.
For loans assessed on a collective basis, the calculation of the allocated reserve considers historicalloss experience for each type of loan, management’s ongoing review of internal risk ratings andassociated trends and factors including:
• Trends in the volume and severity of delinquent loans, non-accrual loans, troubled debtrestructuring and other loan modifications;
• Trends in the quality of risk management and loan administration practices including findings ofinternal and external reviews of loans and effectiveness of collection practices;
• Changes in the quality of the Bank’s risk identification process and loan review system;
• Changes in lending policies and procedures including underwriting standards and collection,charge-off and recovery practices;
• Changes in the nature and volume of the loan portfolio;
• Changes in the concentration of credit and the levels of credit;
• Changes in the national and local economic business conditions, including the condition ofvarious market segments.
The unallocated component of the Allowance is maintained to cover uncertainties in our estimate ofcredit losses. While the Bank’s allocated reserve methodology strives to reflect all risk factors, there maystill be certain unidentified risk elements. The purpose of the unallocated reserve is to capture thesefactors. The relationship of the unallocated component to the total Allowance may fluctuate from periodto period. Management evaluates the adequacy of the Allowance based on the combined total ofallocated and unallocated components.
While the Bank has a formal methodology to determine the adequate and appropriate level of theAllowance, estimates of inherent loan and lease losses involve judgment and assumptions as to variousfactors, including current economic conditions. Management’s determination of adequacy of the totalAllowance is based on quarterly evaluations of the above factors. Accordingly, the provision for loan andlease losses will vary from period to period based on management’s ongoing assessment of the adequacyof the Allowance. See Note 5 for discussion on how the Bank’s experience and current economicconditions have influenced management’s determination of the Allowance.
Charge off and Recovery Policies for Loans and LeasesThe Bank’s policy is to charge off a loan or lease when there is evidence that the loan or lease
balance is uncollectible. A commercial loan or lease that is individually assessed for impairment ischarged-off when potential recovery of the recorded loan balance is uncertain as a result of shortfall incollateral value or borrowers’ financial difficulty. Consumer loans and leases are generally charged off,partially or fully, upon reaching a predetermined delinquency status that ranges from 120 to 180 daysdepending on the type of consumer loans and leases.
-10-2010 Bank of the West Annual Report
Recoveries of amounts that have previously been charged off are credited to the Allowance and aregenerally recorded only to the extent that cash is received.
Troubled Debt RestructuringsIn situations where for economic or legal reasons related to the borrower’s financial difficulties, the
Bank grants a concession to the borrower that it would not otherwise consider, the related loan isclassified as a troubled debt restructuring. Concessions generally include modifications to the loan’sterms, including but not limited to, rate reductions, principal forgiveness, extension of terms or any otheractions that may minimize the potential economic loss to the Bank.
A nonaccrual loan involved in a troubled debt restructuring continues to be recorded as nonaccrualuntil some period of performance on the restructured terms, generally six months, can be evidenced.Loans whose contractual terms have been modified in a troubled debt restructuring and are current at thetime of restructuring remain on accrual status if payment in full under the restructured terms is expected.
Regardless of its accrual status, the Bank continues to measure and recognize impairment on anindividual basis for its restructured commercial loans.
Premises and EquipmentPremises and equipment, including leasehold improvements, are stated at cost less accumulated
depreciation and amortization. Depreciation and amortization are computed on a straight-line basis overthe estimated useful lives as follows:
Premises 10-39 yearsFurniture and equipment 3-20 yearsLeasehold improvements Shorter of the lease term or estimated remaining life
We periodically evaluate our long-lived assets for impairment. We perform these evaluationswhenever events or changes in circumstances suggest that the carrying amount of an asset or group ofassets is not recoverable. If impairment recognition criteria are met, an impairment charge would bereported in noninterest income. For the years ended December 31, 2010 and 2009, the Bank’s evaluationdid not result in any impairment.
Internal-use Software Development CostsThe Bank incurs costs to purchase and develop computer software. The treatment of costs to
purchase or develop the software depends on the nature of the costs and the stage of construction. Costsincurred in the initial design and evaluation phase, such as the cost of performing feasibility studies andevaluating alternatives are charged to expense. Costs incurred in the committed project planning anddesign phase, and in the construction and installation phase, are capitalized as part of the cost of thesoftware. The Bank stops capitalizing costs when the software is substantially completed and ready forits intended use at which point it begins to amortize.
Internal-use software development costs are reviewed for impairment annually or whenever changesin circumstances indicate that the carrying amount of the assets may not be recoverable from theirexpected use and eventual disposition. If such an asset is considered impaired, the impairment to berecognized is measured as the amount by which the carrying basis of the asset exceeds its fair value. Forthe years ended December 31, 2010 and 2009, the Bank’s review did not result in an impairment of itsinternal-use software development costs.
GoodwillUnder the acquisition method of accounting, the net assets of entities acquired by the Bank are
recorded at their estimated fair value at the acquisition date. The excess of the cost of an acquired entityover the fair value of the identifiable net assets acquired represents goodwill.
Goodwill is not amortized, but is tested for impairment annually or whenever events or changes incircumstances suggest that the carrying value may not be recoverable. Under applicable accountingguidance, the goodwill impairment test has two steps. First, the Bank compares the fair value of an
-11-2010 Bank of the West Annual Report

identified reporting unit with its carrying amount, including goodwill. If the fair value of a reportingunit exceeds its carrying value, the goodwill of the reporting unit is not impaired. If the fair value of thereporting unit is less than the carrying value, then the second step must be performed to determine theimplied fair value of the reporting unit’s goodwill and the amount of goodwill impairment.
Other Identifiable Intangible AssetsCore deposit and other intangible assets determined to have finite lives are amortized over their
estimated useful lives. They are generally amortized using accelerated methods over estimated usefullives of five to ten years. The Bank reviews core deposit intangibles for impairment annually orwhenever events or changes in circumstance indicate that we may not recover our investment in theunderlying deposits, which gave rise to such intangibles. Other finite-lived intangible assets are reviewedfor impairment whenever events or changes in circumstance suggest the carrying value may not berecoverable. For the years ended December 31, 2010 and 2009, the Bank’s review did not result in animpairment of its finite-lived intangible assets.
Other Real Estate Owned and Repossessed Personal PropertyOther real estate owned (“OREO”) and repossessed personal property are primarily comprised of
properties that we acquired through foreclosure proceedings. Upon acquisition of assets taken insatisfaction of a defaulted loan, the excess of the remaining loan balance over the asset’s estimated fairvalue less costs to sell is charged off against the Allowance. Subsequent changes in fair value of theassets are recognized in a valuation allowance through noninterest income. Recoveries in fair value of animpaired OREO asset are limited to the amount of previous write-downs. Gains and losses upon sale ofthe foreclosed asset are reported as part of noninterest income.
Transfers and Servicing of Financial AssetsThe Bank enters into loan participations and loan sales, including originations to sell residential
mortgage loans to the Federal National Mortgage Association (“FNMA”). The Bank records thesetransactions as sales and derecognizes the financial assets in accordance with GAAP.
Any interests in the loans retained by the Bank in a participation are recognized by allocating thecarrying amount of the loans between the participating interests sold and interests retained based on theirrelative fair values at the date of transfer. Gain or loss on the sale of the participating interests is basedon the proceeds received and the allocated carrying amount of assets transferred.
The Bank retains the servicing on mortgage loans sold and it records a mortgage servicing right(“MSR”). MSRs are recognized as separate assets representing the right to service third-party loans andare recorded on our balance sheet in other intangible assets, net. Our servicing activities includecollecting principal, interest, tax and insurance payments from borrowers while accounting for andremitting payments to investors on behalf of the borrowers. MSRs are initially recognized at fair value atthe date of transfer as a component of the sales proceeds and subsequently carried at the lower of cost orfair value. Fair value of MSRs is determined based on the present value of estimated future net servicingincome. The MSRs are amortized over the estimated period that net servicing income is expected to bereceived. Projections of the amount and timing of estimated future net cash flows are calculated usingmanagement’s best estimates including, prepayment speeds, forward yield curves and default rates. Theseestimates are updated based on actual results, industry trends and other economic considerations.
The Bank periodically evaluates its MSR assets for impairment by evaluating the fair value of thoseassets based on a disaggregated, discounted cash flow method. For purposes of measuring impairment,MSRs are stratified based on predominant risk characteristics, such as loan category or maturity. Weassess impairment using a present value of expected cash flows model for each strata based uponassumptions for estimated servicing income and expense as discussed in Note 3, Mortgage Sale andServicing Activity. The impairment, if any, is measured as the amount by which the carrying value ofthe servicing right strata exceeds its estimated fair value. Impairment is recognized through a valuationallowance and a charge to earnings if it is considered to be temporary or through a direct write-down ofthe asset and a charge to earnings if it is considered other than temporary.
-12-2010 Bank of the West Annual Report

Securities purchased under agreements to resell and securities sold under agreements to repurchaseare treated as collateralized financing transactions and are recorded at the amounts at which thesecurities were acquired or sold plus accrued interest. The fair value of collateral either received from orprovided to a third party is continually monitored and additional collateral is obtained or is requested tobe returned to the Bank as in accordance with the agreement. The Bank or a custodian holds allcollateral.
Fair ValueThe Bank uses fair value measurements to record fair value adjustments to certain assets and
liabilities and to determine fair value disclosures. Fair value is defined as the exchange price that wouldbe received for an asset or paid to transfer a liability in the principal or most advantageous market forthe asset or liability in an orderly transaction (that is, not a forced liquidation or distressed sale) betweenmarket participants on the measurement date. Trading assets, securities available for sale, certain otherassets and certain liabilities are recorded at fair value on a recurring basis in accordance with applicableaccounting guidance. Also, the Bank may be required to record other assets at fair value on anonrecurring basis, such as loans held for sale and impaired loans held for investment. Thesenonrecurring fair value adjustments typically involve application of lower of cost or fair valueaccounting or write-downs of individual assets.
The Bank values its assets and liabilities based on observable market prices or parameters orderived from such prices or parameters, if available. If observable prices or inputs are not available, fairvalues are measured using valuation models. In the case of securities, fair values are adjusted for creditrating, prepayment assumptions, credit loss assumptions and market liquidity.
Fair value measurements are classified within one of three levels in a valuation hierarchy basedupon the transparency of inputs to the valuation of an asset or liability as of the measurement date. Thethree levels are defined as follows:
• Level 1 inputs to the valuation methodology are quoted prices (unadjusted) for identical assets orliabilities in active markets to which the Bank has access on the measurement date.
• Level 2 inputs to the valuation methodology include quoted prices for similar assets and liabilitiesin active markets, and inputs that are observable for the asset or liability, either directly orindirectly, for substantially the full term of the financial instrument.
• Level 3 inputs to the valuation methodology are unobservable and significant to the fair valuemeasurement.
A financial instrument’s categorization within the valuation hierarchy is based upon the lowest levelof input that is significant to the fair value measurement. See Note 16 for more information regardingfair value measurements.
Foreign Currency TranslationMonetary assets and liabilities denominated in foreign currencies are translated to the U.S. dollar
equivalent at the rate of exchange at the balance sheet date. Transactions in foreign currencies aretranslated to the U.S. dollar equivalent at the rate of exchange in effect at the time of the transaction.Foreign currency gains and losses are included in the consolidated statement of income within othernoninterest income in the period in which they occur.
Lease CommitmentsLease commitments are transactions entered into by the Bank where the Bank is the lessee. Leases
are classified as capital or operating depending on the terms and conditions of the contracts; theaccounting for these leases depends on the nature of the lease transactions. For assets accounted for ascapital leases, depreciation is recorded on a straight-line basis over the period of the lesser of the leaseterm or asset life. Lease obligations recorded under capital leases are reduced by lease payments net ofimputed interest. Operating leases are contracts that do not transfer substantially all of the benefits and
-13-2010 Bank of the West Annual Report

risk of ownership and do not meet the accounting requirements for capital lease classification. Operatinglease payments are charged as rental expense on a straight-line basis over the lease term. Leaseincentives received as part of the lease agreement are recognized as a reduction of rental expense on astraight-line basis over the term of the lease.
Income TaxesThe Bank is included in the consolidated Federal income tax return filed by BancWest. We also file
various combined and separate company state returns according to the laws of the particular state.Federal and state income taxes are generally allocated to individual subsidiaries as if each had filed aseparate return. Amounts equal to income tax benefits of those subsidiaries having taxable losses orcredits are reimbursed by other subsidiaries which would have incurred current income tax liabilities.
The Bank recognizes current income tax expense in an amount which approximates the amount oftax to be paid or refunded for the current period. The Bank recognizes deferred income tax liabilitiesand assets for the expected future tax consequences of events that the Bank includes in our financialstatements or tax returns. Under this method, the Bank determines deferred income tax liabilities andassets based on the difference between the financial statement and tax bases of assets and liabilitiesusing enacted tax rates in effect for the years in which the differences are expected to reverse. Deferredtax assets are recognized if it is more likely than not that all of the deferred tax assets will be realized.Realization is dependent on generating sufficient taxable income prior to expiration of any loss carryforward balance. The Bank’s net tax asset is presented as a component of other assets.
The Bank evaluates tax positions for recognition by determining if the available evidence indicates theposition will likely be sustained upon examination and the amount would be expected to be paid uponultimate settlement. A tax position that meets the “more likely than not” recognition threshold is measuredto determine the amount of benefit to be recognized. The tax position is measured at the largest amount ofbenefit that is greater than 50% likely of being realized upon settlement. The tax position would bederecognized when it is no longer more likely than not of being sustained. Foreign taxes paid are generallyapplied as credits to reduce Federal income taxes payable. Interest is recognized as a component of incometax expense. Penalties are recognized as a component of other noninterest expense.
Derivative Instruments and Hedging ActivitiesDerivatives are recognized on the consolidated balance sheet at fair value. On the date the Bank
enters into a derivative contract, the Bank designates the derivative instrument as (1) a hedge of the fairvalue of a recognized asset or liability or of an unrecognized firm commitment (“fair value” hedge),(2) a hedge of a forecasted transaction or the variability of cash flows to be received or paid related to arecognized asset or liability (“cash flow” hedge) or (3) held for trading, customer accommodation or notqualifying for or designated as intended for hedge accounting (“free standing derivative instrument”).For a fair value hedge, changes in the fair value of the derivative instrument and changes in the fairvalue of the hedged asset or liability or of an unrecognized firm commitment attributable to the hedgedrisk are recorded in current period income. For a cash flow hedge, to the extent that the hedge isconsidered effective, changes in the fair value of the derivative instrument are recorded in othercomprehensive income within stockholder’s equity. The fair value is subsequently reclassified into theincome statement in the same period and classification of the hedged transaction. For free standingderivative instruments, changes in the fair values are reported in current period income.
The Bank formally documents the relationship between hedging instruments and hedged items, aswell as the risk management objective and strategy for undertaking various hedge transactions. Thisprocess includes linking all derivative instruments that are designated as hedges to identified assets andliabilities on the consolidated balance sheet, an unrecognized firm commitment or a forecastedtransaction. The Bank also formally assesses both at the inception of the hedge and on a quarterly basis,whether the derivative instruments are considered effective in offsetting changes in fair values of or cashflows related to hedged items. Any portion of the changes in fair value of derivatives designated as ahedge that is deemed ineffective is recorded in current period earnings.
-14-2010 Bank of the West Annual Report

Valuations of derivative assets and liabilities reflect the value of the instrument including the valuesassociated with counterparty risk and the Bank’s own credit standing; refer to Note 15, DerivativeFinancial Instruments for additional information.
The Bank occasionally purchases or originates financial instruments that contain an embeddedderivative instrument. At the inception of the financial instrument, the Bank assesses whether theeconomic characteristics of the embedded derivative instrument are clearly and closely related to theeconomic characteristics of the host contract, whether the financial instrument that embodies both theembedded derivative instrument and the host contract is currently measured at fair value with changes infair value reported in earnings and whether a separate instrument with the same terms as the embeddedinstrument would meet the definition of a derivative instrument. If the embedded derivative instrument isdetermined not to be clearly and closely related to the host contract, the combined instrument is notcurrently measured at fair value with changes in fair value reported in earnings, and the embeddedderivative instrument would qualify as a derivative instrument, the embedded derivative instrument isseparated from the host contract and carried at fair value with changes recorded in current periodearnings.
Recent Accounting StandardsThe following Accounting Standard Updates (“ASU”) recently issued by the Financial Accounting
Standards Board (“FASB”) impacted the Bank’s financial statements.
ASU 2009-17: Improvements to Financial Reporting by Enterprises Involved with Variable InterestEntities (FAS 167, Amendments to FASB Interpretation No. 46R):
On January 1, 2010, the Bank adopted amended accounting guidance for consolidation of VariableInterest Entities (“VIEs”). The amended accounting guidance replaces the quantitative-based risks andrewards approach to consolidation of variable interest entities with a qualitative approach that identifiesthe primary beneficiary of a variable interest entity as the enterprise that has both the power to direct theactivities that most significantly impact the entity’s economic performance, and the obligation to absorblosses or the right to receive benefits of the entity that could potentially be significant to the variableinterest entity. Upon adoption of this amended guidance on January 1, 2010, the Bank recognized totalassets of previously unconsolidated entities of approximately $30 million.
ASU 2010-06: Fair Value Measurements and Disclosures (Topic 820): Improving Disclosures aboutFair Value Measurements:
In January 2010, the FASB issued guidance which provides new disclosure requirements andclarifies existing disclosure requirements over fair value measurements. New disclosures required includethe amount of significant transfers in and out of levels 1 and 2 fair value measurements and the reasonsfor the transfers. In addition, the reconciliation for level 3 activity will be required on a gross rather thannet basis. Finally, it provided additional guidance related to the level of disaggregation in determiningclasses of assets and liabilities and disclosures about inputs and valuation techniques. The Bank adoptedit in the first quarter of 2010 with prospective application, except for the new requirement related to thereconciliation for level 3 activities on a gross basis (which will be effective for the Bank in first quarterof 2011 reporting periods). The adoption of this guidance impacts the disclosures for the fair valuemeasurement as included in Note 16, Fair Value.
ASU 2010-20: Receivables (Topic 310): Disclosures about the Credit Quality of FinancingReceivables and the Allowance for Credit Losses:
In July 2010, the FASB issued new guidance that requires the Bank to provide more robust anddisaggregated disclosures about the credit quality of financing receivables and allowances for creditlosses. The new disclosure guidance is effective for the Bank’s 2010 financial statements and isdiscussed in Note 4, Loans and Leases, and Note 5, Allowance for Credit Losses. The disclosures aboutactivity that occurs during a reporting period are effective for its 2011 reporting periods.
-15-2010 Bank of the West Annual Report

2. Securities Available for SaleAmortized cost and fair value of securities available for sale at December 31, 2010 and 2009 were
as follows:
(dollars in thousands)Amortized
CostUnrealized
GainsUnrealized
LossesFair
ValueAmortized
CostUnrealized
GainsUnrealized
LossesFair
Value
2010 2009
U.S. Treasury and other U.S.Government agencies andcorporations $ 174,181 $ 126 $ (76) $ 174,231 $ 165,252 $ 295 $ (8) $ 165,539
Government sponsored agencies 483,192 958 (1,039) 483,111 734,969 3,846 (186) 738,629Mortgage and asset-backed
securities:Government agencies(1) 239,209 1,429 (1,116) 239,522 43,063 1,383 (41) 44,405Government sponsored
agencies(1) 1,178,263 33,605 (329) 1,211,539 2,093,656 82,511 (617) 2,175,550Non-government mortgage-
backed securities(1) - - - - 841,977 818 (149,889) 692,906Collateralized debt obligations 127,674 - (60,682) 66,992 194,742 - (114,989) 79,753Collateralized loan obligations 223,390 - (93,484) 129,906 230,517 8,112 (101,654) 136,975Other asset-backed securities 8,546 50 (924) 7,672 29,234 49 (11,010) 18,273
Collateralized mortgageobligations:Government agencies 1,084,543 15,813 (828) 1,099,528 231,487 212 - 231,699Government sponsored agencies 1,451,179 5,943 (19,699) 1,437,423 417,576 5,489 - 423,065Other - - - - 75,983 21 (6,765) 69,239
States and political subdivisions 1,299,297 18,885 (45,589) 1,272,593 1,658,242 29,219 (20,509) 1,666,952Equity securities 6,244 271 (270) 6,245 6,484 129 (282) 6,331
Total securities available for sale $6,275,718 $77,080 $(224,036) $6,128,762 $6,723,182 $132,084 $(405,950) $6,449,316
(1) Backed by residential real estate.
The following tables present the unrealized gross losses and fair values of securities in the availablefor sale portfolio by length of time that individual securities in each category have been in a continuousloss position.
(dollars in thousands)Unrealized
LossesFair
ValueUnrealized
LossesFair
ValueUnrealized
LossesFair
Value
Less Than 12 Months 12 Months or More TotalDecember 31, 2010
U.S. Treasury and other U.S. Governmentagencies and corporations $ (75) $ 90,839 $ (1) $ 330 $ (76) $ 91,169
Government sponsored agencies (1,039) 330,445 - - (1,039) 330,445Mortgage and asset-backed securities:
Government agencies(1) (1,069) 189,008 (47) 890 (1,116) 189,898Government sponsored agencies(1) (329) 97,620 - - (329) 97,620Collateralized debt obligations - - (60,682) 66,992 (60,682) 66,992Collateralized loan obligations - - (93,484) 129,906 (93,484) 129,906Other asset-backed securities - - (924) 3,492 (924) 3,492
Collateralized mortgage obligations:Government agencies (828) 141,128 - - (828) 141,128Government sponsored agencies (19,699) 695,627 - - (19,699) 695,627
State and political subdivisions (27,740) 550,576 (17,849) 165,041 (45,589) 715,617Equity securities - - (270) 5,957 (270) 5,957
Total securities available for sale $(50,779) $2,095,243 $(173,257) $372,608 $(224,036) $2,467,851
(1) Backed by residential real estate.
-16-2010 Bank of the West Annual Report

(dollars in thousands)Unrealized
LossesFair
ValueUnrealized
LossesFair
ValueUnrealized
LossesFair
Value
Less Than 12 Months 12 Months or More TotalDecember 31, 2009
U.S. Treasury and other U.S. Governmentagencies and corporations $ (2) $ 104 $ (6) $ 917 $ (8) $ 1,021
Government sponsored agencies (186) 97,342 - - (186) 97,342Mortgage and asset-backed securities:
Government agencies(1) - - (41) 918 (41) 918Government sponsored agencies(1) (608) 82,872 (9) 579 (617) 83,451Non-government mortgage-backed
securities(1) (10,732) 70,259 (139,157) 570,845 (149,889) 641,104Collateralized debt obligations - - (114,989) 79,753 (114,989) 79,753Collateralized loan obligations (5,863) 13,260 (95,791) 109,217 (101,654) 122,477Other asset-backed securities (9,344) 4,884 (1,666) 4,719 (11,010) 9,603
Collateralized mortgage obligations:Government agencies - - - - - -Government sponsored agencies - - - - - -Other - - (6,765) 67,525 (6,765) 67,525
State and political subdivisions (9,688) 409,709 (10,821) 247,330 (20,509) 657,039Equity securities (36) 47 (246) 5,897 (282) 5,944
Total securities available for sale $(36,459) $678,477 $(369,491) $1,087,700 $(405,950) $1,766,177
(1) Backed by residential real estate.
For the securities in the above tables, at year-end we did not have the intent to sell and determinedit was more likely than not that we would not be required to sell the securities prior to recovery of theamortized cost basis. We have also assessed each of the securities in the above tables for creditimpairment. We frequently monitor the credit ratings of individual investments within our portfolio andbelieve that the majority of our unrealized loss positions are due to changes in interest rates andilliquidity within the markets. The Bank may occasionally sell securities at a loss when it decides torestructure portions of the portfolio due to changing market conditions. For equity securities, weconsider numerous factors in determining whether impairment exists, including our intent and ability tohold the securities for a period of time sufficient to recover the securities’ cost basis.
The following is a description of our security categories, including a description of the nature of theunrealized losses and other-than-temporary impairment (“OTTI”) losses within our portfolio (seeNote 23 for subsequent purchases and sales of securities):
U.S. Treasury and other U.S. Government agencies and corporationsThe unrealized losses associated with United States (“U.S.”) Treasury and Federal agency securities
are driven primarily by changes in interest rates. We do not estimate any credit losses due to explicitguarantees provided by the U.S. Government.
Government sponsored agenciesThe unrealized losses associated with U.S. Government sponsored agencies are driven primarily by
changes in interest rates. We do not estimate any credit losses due to implicit backing provided by theUnited States Government.
Mortgage and asset-backed securities:
Government agencies and government sponsored agenciesThe unrealized losses associated with Federal agency mortgage-backed securities are primarily
driven by changes in interest rates. These securities are issued by U.S. Government or governmentsponsored entities and do not have any expected credit losses given explicit or implicit governmentguarantees.
-17-2010 Bank of the West Annual Report

Non-government mortgage-backed securitiesThe unrealized losses associated with non-government mortgage-backed securities were driven by
changes in interest rates and illiquidity in their primary market. We estimated credit impairment using acash flow model that incorporated default rates, loss severities, prepayment rates and projected collaterallosses for the underlying mortgage loans. The forecasted loan performance was used to project cashflows to the various tranches in the structure. These positions were sold in 2010.
Collateralized debt obligationsThe unrealized losses associated with collateralized debt obligations for securities backed by trust
preferred hybrid capital issued by other financial institutions were driven primarily by changes in interestrates and market illiquidity. We estimate credit impairment using a cash flow model that incorporatescollateral loss severities, the financial strength of the underlying financial institutions and likelihood ofdefault over time. The losses are primarily driven by higher projected collateral losses and wider creditspreads. The key assumptions include default rates, loss severities and prepayment rates.
Collateralized loan obligationsThe unrealized losses associated with collateralized loan obligations, related to securities backed by
commercial loans and individual corporate debt obligations, stem from changes in interest rates andmarket illiquidity. We estimate credit impairment using a cash flow model that incorporates default rates,loss severities and prepayment rates.
Other asset-backed securitiesThe unrealized losses associated with other asset-backed securities are driven by changes in interest
rates and market illiquidity. We estimate credit impairment using an internally developed cash flowmodel as well as tools provided by third party vendors.
Collateralized mortgage obligations:
Government agencies and government sponsored agenciesThe unrealized losses associated with Federal agency mortgage-backed securities are primarily
driven by changes in interest rates. These securities are issued by U.S. Government or governmentsponsored entities and do not have any expected credit losses given explicit or implicit governmentguarantees.
OtherThe unrealized losses associated with non-agency mortgage-backed securities are primarily driven
by changes in interest rates and market illiquidity. We estimate credit impairment using a cash flowmodel that incorporates default rates, loss severities, prepayment rates, and projected collateral losses forthe underlying mortgages. These positions were sold in 2010.
State and political subdivisionsThe unrealized losses associated with securities of U.S. states and political subdivisions are
primarily driven by changes in interest rates and illiquidity within the markets. These securities willcontinue to be monitored as part of our ongoing portfolio review process.
Equity securitiesThe unrealized losses on equity securities are associated with changes in market prices for
Community Reinvestment Act-sponsored corporations. The unrealized losses are due to temporarydeclines in the equity markets.
Assessment of Other-Than-Temporary ImpairmentThe Bank tests for other-than-temporary impairment of investment securities on a quarterly basis.
For 2010 and 2009, we recognized OTTI for certain of our debt securities classified as available for sale.Prior to recording OTTI, we assessed whether we intended to sell or if it was more likely than not thatwe would have been required to sell a security before recovery of its amortized cost basis, less anycurrent period credit losses. For a debt security that is considered other-than-temporarily impaired that
-18-2010 Bank of the West Annual Report

we did not intend to sell and will not be required to sell before recovery of its amortized cost basis lessany current period credit losses, we separate the amount of the impairment into the amount that is creditrelated (credit loss component) and the amount due to all other factors. The credit loss component isrecognized in earnings and is the difference between the security’s amortized cost basis and the presentvalue of its expected future cash flows discounted at the security’s original purchase yield (except forthose securities that are beneficial interests in securitized financial assets). The remaining differencebetween the security’s fair value and the present value of expected future cash flows is due to factorsthat are not credit related and, therefore, is not required to be recognized as a loss in the incomestatement, but instead is recognized in OCI. We believe that we will fully collect the carrying value ofsecurities on which we have recorded a non-credit-related impairment in OCI.
For a certain type of debt security, which has a below AA debt rating at acquisition and is abeneficial interest in securitized financial assets, OTTI occurs when the Bank determines that there hasbeen an adverse change in cash flows and the present value of its expected future cash flows discountedat the security’s then-current effective interest rate is less than the present value of the remaining cashflows estimated at the security’s acquisition date or last estimated cash flow revision date.
Categories of impaired securities at December 31, 2010 include collateralized loan obligations andone municipal security. All previously impaired private label mortgage-backed and collateralized debtobligations backed by residential and trust preferred capital were, with impairment recognized earnings,sold in 2010. The continued economic downturn has negatively affected the creditworthiness of state andlocal governments, particularly within California, and various monoline insurers who provide guaranteesfor these municipal securities, which could result in impairment as the Bank holds bonds from variousstate and local governments. Several other factors including elevated unemployment, illiquidity, creditrating downgrades and the lack of credit could continue to negatively affect the real estate market andthe value of our portfolio.
Gross realized gains and losses on securities available for sale for the periods indicated were asfollows:
(dollars in thousands) 2010 2009
Year EndedDecember 31,
Realized gains $ 77,468 $ 20,336Realized losses(1) (113,419) (332,199)Realized net losses $ (35,951) $(311,863)(1) Includes other-than-temporary impairment recognized in the income statement of
$8.2 million and $240.8 million for 2010 and 2009, respectively. The 2010 amount is net ofa $25 million recovery of OTTI.
The table below presents activity related to the credit component recognized in earnings on debtsecurities held by the Bank for which a portion of the OTTI loss remains in other comprehensive incomefor the years ending December 31, 2010 and 2009. The credit loss component represents the differencebetween the present value of expected future cash flows and the amortized cost basis of the securityprior to considering credit losses. OTTI recognized in earnings in 2010 for credit-impaired debtsecurities is presented as additions in two components based upon whether the current period is the firsttime the debt security was credit-impaired (initial credit impairment) or is not the first time the debtsecurity was credit-impaired (subsequent credit impairments). The credit loss component is reduced ifwe sell, intend to sell or believe we will be required to sell previously credit-impaired debt securities.Additionally, the credit loss component is reduced if we receive or expect to receive cash flows in excessof what we previously expected to receive over the remaining life of the credit-impaired debt security,the security matures or is fully written down.
-19-2010 Bank of the West Annual Report
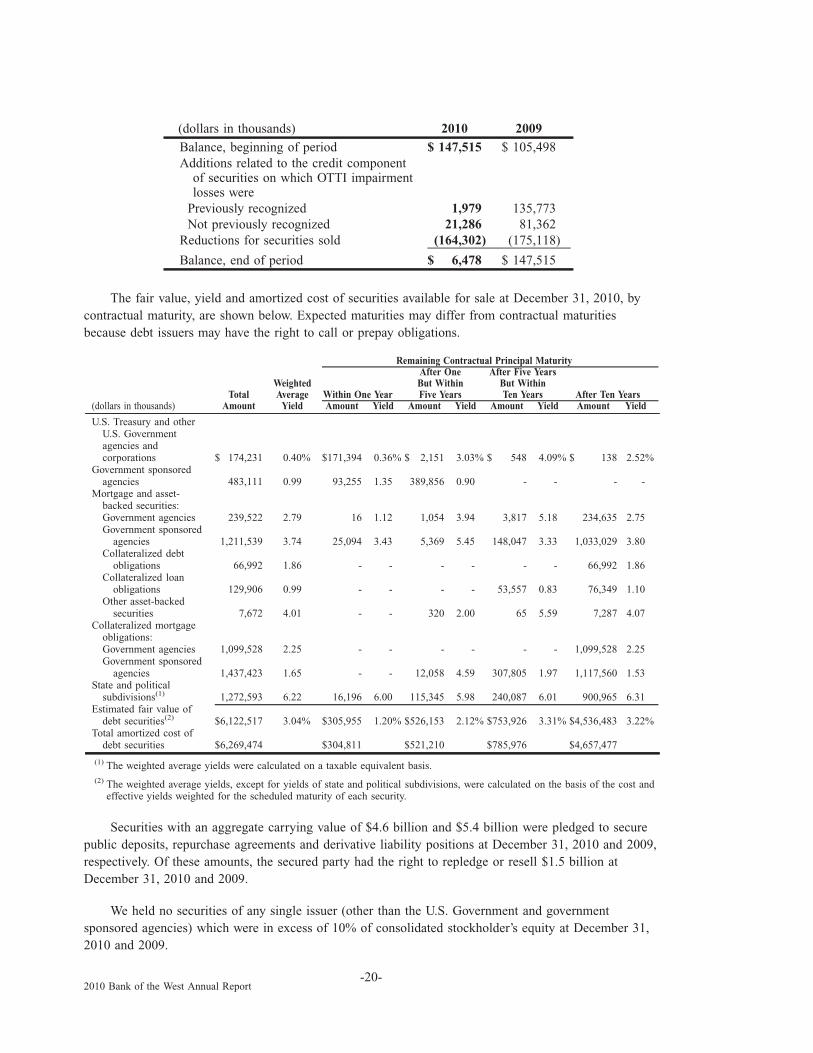
(dollars in thousands) 2010 2009
Balance, beginning of period $ 147,515 $ 105,498Additions related to the credit component
of securities on which OTTI impairmentlosses were
Previously recognized 1,979 135,773Not previously recognized 21,286 81,362
Reductions for securities sold (164,302) (175,118)
Balance, end of period $ 6,478 $ 147,515
The fair value, yield and amortized cost of securities available for sale at December 31, 2010, bycontractual maturity, are shown below. Expected maturities may differ from contractual maturitiesbecause debt issuers may have the right to call or prepay obligations.
(dollars in thousands)Total
Amount
WeightedAverage
Yield Amount Yield Amount Yield Amount Yield Amount YieldWithin One Year
After OneBut WithinFive Years
After Five YearsBut WithinTen Years After Ten Years
Remaining Contractual Principal Maturity
U.S. Treasury and otherU.S. Governmentagencies andcorporations $ 174,231 0.40% $171,394 0.36% $ 2,151 3.03% $ 548 4.09% $ 138 2.52%
Government sponsoredagencies 483,111 0.99 93,255 1.35 389,856 0.90 - - - -
Mortgage and asset-backed securities:Government agencies 239,522 2.79 16 1.12 1,054 3.94 3,817 5.18 234,635 2.75Government sponsored
agencies 1,211,539 3.74 25,094 3.43 5,369 5.45 148,047 3.33 1,033,029 3.80Collateralized debt
obligations 66,992 1.86 - - - - - - 66,992 1.86Collateralized loan
obligations 129,906 0.99 - - - - 53,557 0.83 76,349 1.10Other asset-backed
securities 7,672 4.01 - - 320 2.00 65 5.59 7,287 4.07Collateralized mortgage
obligations:Government agencies 1,099,528 2.25 - - - - - - 1,099,528 2.25Government sponsored
agencies 1,437,423 1.65 - - 12,058 4.59 307,805 1.97 1,117,560 1.53State and political
subdivisions(1) 1,272,593 6.22 16,196 6.00 115,345 5.98 240,087 6.01 900,965 6.31Estimated fair value of
debt securities(2) $6,122,517 3.04% $305,955 1.20% $526,153 2.12% $753,926 3.31% $4,536,483 3.22%Total amortized cost of
debt securities $6,269,474 $304,811 $521,210 $785,976 $4,657,477
(1) The weighted average yields were calculated on a taxable equivalent basis.(2) The weighted average yields, except for yields of state and political subdivisions, were calculated on the basis of the cost and
effective yields weighted for the scheduled maturity of each security.
Securities with an aggregate carrying value of $4.6 billion and $5.4 billion were pledged to securepublic deposits, repurchase agreements and derivative liability positions at December 31, 2010 and 2009,respectively. Of these amounts, the secured party had the right to repledge or resell $1.5 billion atDecember 31, 2010 and 2009.
We held no securities of any single issuer (other than the U.S. Government and governmentsponsored agencies) which were in excess of 10% of consolidated stockholder’s equity at December 31,2010 and 2009.
-20-2010 Bank of the West Annual Report

3. Mortgage Sale and Servicing Activity
At December 31, 2010, the Bank’s portfolio of loans held for sale conformed to FNMA guidelines.
We originated $1,052.1 million and $410.6 million of loans for sale and sold $1,046.2 million and$704.6 million in 2010 and 2009, respectively. Each mortgage loan was sold on a non-recourse basis andthe unpaid principal balance of mortgage loans serviced for others was $1,610.4 million and$682.5 million at December 31, 2010 and 2009, respectively. The Bank realized net gains on sale ofloans of $20.1 million and $6.2 million in 2010 and 2009, respectively, which is reported within othernoninterest income. While we recognize and measure loans for sale at lower of cost or fair value, the fairvalue was not less than the cost of the loans during 2010 and 2009.
Our servicing activities include collecting principal, interest, tax and insurance payments fromborrowers while accounting for and remitting payments to investors on behalf of the borrowers. We alsomonitor delinquencies and execute foreclosure proceedings. Due to similar risks underlying theresidential mortgages and nature of assumptions for estimating the fair value of servicing assets,management has determined that there is a single class of servicing asset.
Servicing income is recorded in noninterest income as a part of other service charges and fees andis reported net of the amortization of the servicing assets. Gross servicing fees include contractuallyspecified fees, late charges and ancillary fees, and were $2.6 million and $0.4 million for the yearsended December 31, 2010 and 2009, respectively.
The changes in MSRs using the amortization method including valuation allowance were:
(dollars in thousands) 2010 2009
Carrying amount, balance at beginning of year $ 6,929 $ -Additions(1):
Assumption of servicing obligations resulting fromasset transfers 10,015 7,177
Subtractions(1):Amortization (2,547) (237)Application of valuation allowance to adjust
carrying values of servicing assets (13) (11)Carrying amount, balance at end of year $14,384 $6,929
Valuation allowance for servicing assets: 2010 2009
Beginning balance $11 $ -Provisions 13 11Balance at end of year $24 $11
(1) The Bank did not purchase or sell any servicing obligations during the years endedDecember 31, 2010 and 2009. Additionally, there was no other than temporary impairmentrecorded and no other changes that affected the balance during the years endedDecember 31, 2010 and 2009.
The MSR asset is stratified into risk strata whose underlying loans possess similar riskcharacteristics, such as loan category or maturity. The Bank evaluates the fair value of each risk stratausing a present value of expected cash flows model, which is based upon assumptions for future netservicing income. The model incorporates significant unobservable inputs classified as Level 3, whichreflects assumptions that market participants use in estimating future net servicing income such asestimates of prepayment speeds, discount rate, cost to service the assets including expecteddelinquencies and foreclosure costs, escrow account earnings, contractual servicing fee income, ancillaryincome and late fees. Impairment of an MSR risk strata is recognized through a valuation allowance ifthe estimated fair value of the strata falls below its amortized cost basis.
-21-2010 Bank of the West Annual Report

The fair value of the amortized MSRs were:
(dollars in thousands) 2010 2009
Balance at beginning of year $ 7,475 $ -Balance at end of year $15,886 $7,475
Key assumptions used in determining the lower of cost or fair value of the Bank’s MSRs were asfollows:
2010 2009
Weighted average constant prepayment rate 12.19% 10.96%Weighted average life in years (of the MSR) 6.28 7.12Weighted average note rate 4.81% 5.09%Weighted average discount rate 10.00% 10.00%
4. Loans and Leases
At December 31, 2010 and 2009, loans and leases were comprised of the following:
(dollars in thousands) Outstanding Commitments(1) Outstanding Commitments(1)2010 2009
Commercial:Commercial and industrial $ 6,169,590 $ 5,414,832 $ 5,949,460 $4,787,062Commercial real estate 9,159,808 343,432 9,374,105 260,518Construction 1,657,053 282,014 2,172,228 408,042Equipment leases 2,366,233 - 2,430,830 -Agriculture 1,899,023 1,011,507 1,978,060 1,048,676
Consumer:Consumer loans and leases 10,563,430 1,131,820 10,211,070 940,955Residential secured – closed-end 8,903,798 - 10,095,493 -Residential secured – revolving, open-end 2,288,785 2,173,200 2,213,301 2,205,169
Total loans and leases $43,007,720 $10,356,805 $44,424,547 $9,650,422
(1) Commitments to extend credit represent unfunded amounts and are reported net of participations sold to other lenders.
Outstanding loan balances at December 31, 2010 and 2009 are net of unearned income, includingnet deferred loan fees, of $227.4 million and $270.8 million, respectively.
Loans totaling $25.4 billion were pledged to collateralize the Bank’s borrowing capacity at theFederal Reserve Bank and Federal Home Loan Bank at December 31, 2010.
Our leasing activities consist primarily of leasing automobiles and commercial equipment.Generally, lessees are responsible for all maintenance, taxes and insurance on the leased property.
The following lists the components of the net investment in financing leases, which includesequipment and consumer leases at December 31:
(dollars in millions) 2010 2009
Total minimum lease payment to be received $2,538 $2,709Estimated residual values of leased property 276 330Less: Unearned income 265 324Net investment in financing leases $2,549 $2,715(1) Includes auto leases of $183 million and $284 million at December 31, 2010 and 2009,
respectively.
-22-2010 Bank of the West Annual Report

At December 31, 2010, minimum lease receivables for the five succeeding years and thereafterwere as follows:
(dollars in millions) Lease Receivable
2011 $ 8792012 7462013 5382014 3072015 1842016 and thereafter 160Gross minimum payments 2,814Less: Unearned income 265Net minimum receivable $2,549
In the normal course of business, the Bank makes loans to executive officers and directors of theBank and to entities and individuals affiliated with those executive officers and directors. Such loans aremade on terms no less favorable to the Bank than those prevailing at the time for comparabletransactions with other persons or, in the case of certain residential real estate loans, on terms that werewidely available to employees of the Bank who were not directors or executive officers.
In the course of evaluating the credit risk presented by a customer and the pricing that willadequately compensate the Bank for assuming that risk, management may require a certain amount ofcollateral support. The type of collateral held varies, but may include accounts receivable, inventory,land, buildings, equipment, income-producing commercial properties and residential real estate. TheBank has the same collateral policy for loans whether they are funded immediately or on a delayed basis(loan commitments).
During 2010 and 2009, the Bank sold participations in certain commercial loans in transactionsnegotiated with other financial institutions at the time of originating the loans. As the Bank sold theparticipating interests concurrently with the loan origination, there was no difference between the fairvalue and carrying amount of the loans transferred and therefore no gain or loss on sale was recognizedin 2010 and 2009. At the end of 2010 and 2009, the Bank recognized $335 million and $453 million(net of charge offs), respectively, as its retained interest in the loans. The unpaid principal balance ofloans sold as participating interests at the end of 2010 and 2009 was $265 million and $385 million,respectively.
A commitment to extend credit is a legally binding agreement to lend funds to a customer usuallyat a stated interest rate and for a specified purpose. Such commitments have fixed expiration dates andgenerally require a fee. The extension of a commitment gives rise to credit risk. The actual liquidityrequirements or credit risk that the Bank will experience will be lower than the contractual amount ofcommitments to extend credit because a significant portion of those commitments are expected to expirewithout being drawn upon. Additionally, certain commitments are subject to loan agreements containingcovenants regarding the financial performance of the customer that must be met before the Bank isrequired to fund the commitment. For our consumer loan commitments, the Bank may reduce or cancelsuch commitments by providing prior notice to the borrower or, in some cases, without notice as legallypermitted.
The Bank further manages the potential credit risk in commitments to extend credit by limiting thetotal amount of arrangements, both by individual customer and in the aggregate, by monitoring the sizeand maturity structure of these portfolios and by applying the same credit standards maintained for all ofits related credit activities. The loan and lease portfolio is principally located in California and, to alesser extent, the remaining states within our footprint. The risk inherent in the portfolio depends uponboth the economic stability of those states, which affects property values, and the financial well-beingand creditworthiness of the borrowers.
-23-2010 Bank of the West Annual Report

Standby letters of credit totaled $868.5 million and $910.7 million at December 31, 2010 and 2009,respectively. Standby letters of credit are issued on behalf of customers in connection with contractsbetween the customers and third parties. Under standby letters of credit, the Bank assures that the thirdparties will receive specified funds if customers fail to meet their contractual obligations. The liquidityrisk to the Bank arises from its obligation to make payment in the event of a customer’s contractualdefault. The Bank also had commitments for commercial and similar letters of credit of $65.7 millionand $41.9 million at December 31, 2010 and 2009, respectively. The commitments outstanding as ofDecember 31, 2010 have maturities ranging from January 1, 2011 to July 25, 2018. Substantially all feesreceived from the issuance of such commitments are deferred and amortized on a straight-line basis overthe term of the commitment.
Credit Quality of Loans and LeasesA significant portion of the Bank’s loan and lease portfolio consists of high credit quality loans.
The Bank assesses the credit quality of its commercial loans and leases with an internal credit riskgrading system using a ten-point credit risk scale and categorizes the loans and leases consistent withFDIC and industry guidelines in the following grades: pass, special mention and classified.
Risk grades one through six (or Pass grades) represent loans with strong to acceptable credit qualitywhere the loan is protected by adequate collateral and the borrower is not facing financial difficulties.Risk grade seven (or Special Mention grade) represents loans with borrowers that have potential creditweaknesses which, if not checked or corrected, will weaken the Bank’s repayment prospects. Risk gradeseight through ten (or Classified grade) represent loans characterized by the distinct possibility that thebank will sustain partial or entire loss. In particular, risk grade eight represents borrowers who have awell-defined weakness but no loss in principal balance is currently anticipated. Risk grade ninerepresents loans with substandard borrowers but partial loss is probable based on facts existing at thetime of assessment. Risk grade ten represents loans with borrowers who are incapable of repayment orloans that are considered uncollectable and are therefore, charged off. All loans in risk grades nine andten and certain loans in risk grade eight that are on nonaccrual status are considered impaired loans.Risk grades of commercial loans are reviewed on an ongoing basis and upon a credit event.
The following represents the credit quality of each class of commercial loans and leases based onour internal risk grading system as of December 31, 2010, and 2009:
(dollars in thousands) PassSpecial
Mention Classified Total
December 31, 2010
Commercial and industrial $ 5,499,516 $ 266,064 $ 404,010 $ 6,169,590
Commercial real estate 7,617,102 578,609 964,097 9,159,808
Construction 717,043 367,023 572,987 1,657,053
Equipment leases 2,192,831 99,960 73,442 2,366,233
Agriculture 1,510,216 226,092 162,715 1,899,023
Total Commercial $17,536,708 $1,537,748 $2,177,251 $21,251,707
(dollars in thousands) PassSpecial
Mention Classified Total
December 31, 2009
Commercial and industrial $ 5,073,293 $ 388,986 $ 487,181 $ 5,949,460
Commercial real estate 8,084,729 606,188 683,188 9,374,105
Construction 846,178 607,487 718,563 2,172,228
Equipment leases 2,211,868 137,799 81,163 2,430,830
Agriculture 1,547,908 254,887 175,265 1,978,060
Total Commercial $17,763,976 $1,995,347 $2,145,360 $21,904,683
-24-2010 Bank of the West Annual Report
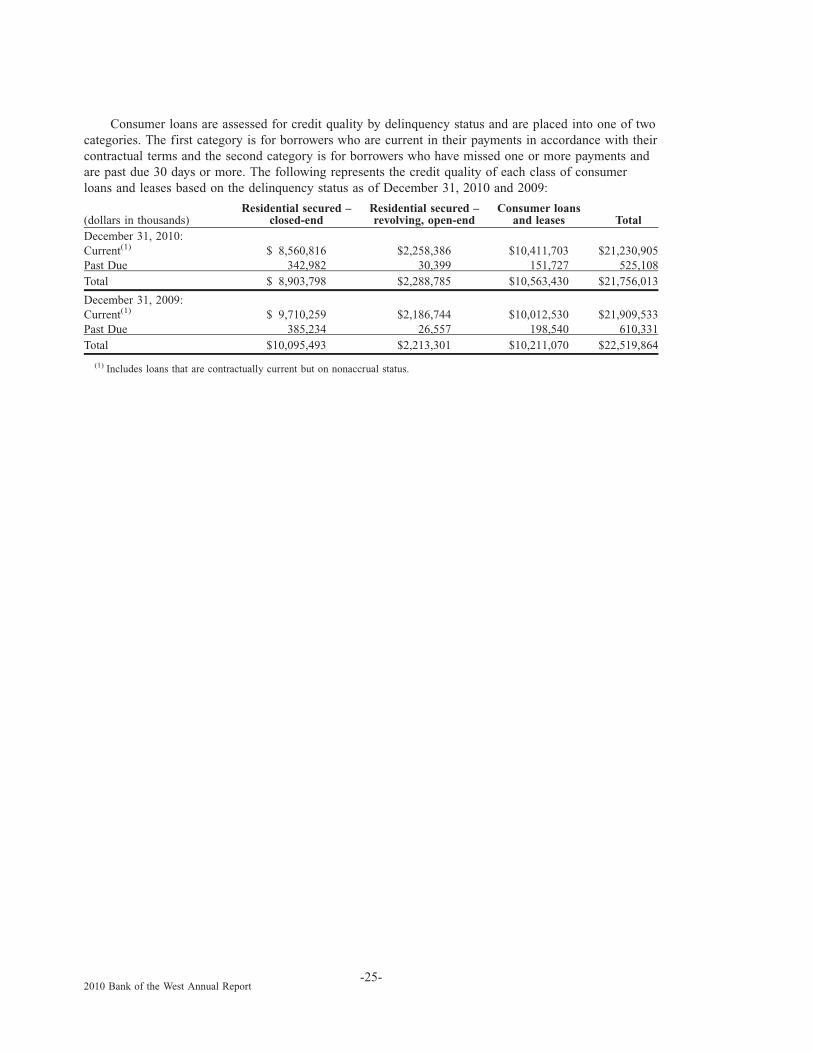
Consumer loans are assessed for credit quality by delinquency status and are placed into one of twocategories. The first category is for borrowers who are current in their payments in accordance with theircontractual terms and the second category is for borrowers who have missed one or more payments andare past due 30 days or more. The following represents the credit quality of each class of consumerloans and leases based on the delinquency status as of December 31, 2010 and 2009:
(dollars in thousands)Residential secured –
closed-endResidential secured –revolving, open-end
Consumer loansand leases Total
December 31, 2010:Current(1) $ 8,560,816 $2,258,386 $10,411,703 $21,230,905Past Due 342,982 30,399 151,727 525,108Total $ 8,903,798 $2,288,785 $10,563,430 $21,756,013
December 31, 2009:Current(1) $ 9,710,259 $2,186,744 $10,012,530 $21,909,533Past Due 385,234 26,557 198,540 610,331Total $10,095,493 $2,213,301 $10,211,070 $22,519,864
(1) Includes loans that are contractually current but on nonaccrual status.
-25-2010 Bank of the West Annual Report

5. Allowance for Credit Losses
The allowance for credit losses reflects management’s estimate of credit losses inherent in the loanand lease portfolio. We consider the Allowance of $1,059 million at the end of 2010 to be adequate tocover such credit losses. Changes in the allowance for credit losses were:
(in thousands) 2010 2009December 31,
Balance at beginning of year $1,220,661 $ 742,845Provision for loan and lease losses 512,782 1,324,723Charge offs:
Commercial:Commercial and industrial (130,434) (142,686)Commercial real estate (98,788) (45,937)Construction (88,050) (242,389)Equipment leases (52,818) (75,700)Agriculture (69,769) (22,772)
Total commercial (439,859) (529,484)Consumer:
Consumer loans and leases (211,568) (263,418)Residential secured – closed-end (93,950) (93,873)Residential secured – revolving, open-end (27,277) (27,067)
Total consumer (332,795) (384,358)Total charge offs (772,654) (913,842)Recoveries:
Commercial:Commercial and industrial 21,538 10,521Commercial real estate 6,867 2,806Construction 14,113 13,188Equipment leases 14,123 12,257Agriculture 2,281 349
Total commercial 58,922 39,121Consumer:
Consumer loans and leases 32,006 25,009Residential secured – closed-end 6,023 1,828Residential secured – revolving, open-end 1,277 977
Total consumer 39,306 27,814Total recoveries 98,228 66,935Net charge offs (674,426) (846,907)Balance at end of year $1,059,017 $1,220,661Components:
Allocated $ 966,400 $1,167,660Unallocated 92,617 53,001
Allowance for credit losses $1,059,017 $1,220,661
The following table summarizes the activity in the allowance for credit losses by commercial andconsumer portfolio segments for the year ended December 31, 2010.
(dollars in thousands) Commercial Consumer Unallocated TotalDecember 31, 2010
Balance at beginning of year $ 565,146 $ 602,514 $53,001 $1,220,661Provision for loan and lease losses 270,600 202,566 39,616 512,782Charge offs (439,859) (332,795) - (772,654)Recoveries 58,922 39,306 - 98,228
Net charge offs (380,937) (293,489) - (674,426)Balance at end of year $ 454,809 $ 511,591 $92,617 $1,059,017
-26-2010 Bank of the West Annual Report

The following table disaggregates our allocated component of the allowance for credit losses andrecorded investment in loans by impairment methodology.
(dollars in thousands) Commercial Consumer Total Commercial Consumer TotalAllocated allowance for credit losses Recorded investment in loans
December 31, 2010
Collectively evaluated $374,779 $511,591 $886,370 $20,202,970 $21,756,013 $41,958,983Individually evaluated 80,030 - 80,030 1,048,737 - 1,048,737Total $454,809 $511,591 $966,400 $21,251,707 $21,756,013 $43,007,720
The following table summarizes the activity in the allowance for credit losses by commercial andconsumer portfolio segments for the year ended December 31, 2009.
(dollars in thousands) Commercial Consumer Unallocated TotalDecember 31, 2009
Balance, beginning of year $ 429,663 $ 302,054 $11,128 $ 742,845Provision for loan and lease losses 625,846 657,004 41,873 1,324,723Charge offs (529,484) (384,358) - (913,842)Recoveries 39,121 27,814 - 66,935
Net charge offs (490,363) (356,544) - (846,907)Balance at end of year $ 565,146 $ 602,514 $53,001 $1,220,661
The following table disaggregates our allocated component of the allowance for credit losses andrecorded investment in loans by impairment methodology.
(dollars in thousands) Commercial Consumer Total Commercial Consumer TotalAllocated allowance for credit losses Recorded investment in loans
December 31, 2009
Collectively evaluated $354,434 $602,514 $ 956,948 $20,802,687 $22,519,864 $43,322,551Individually evaluated 210,712 - 210,712 1,101,996 - 1,101,996Total $565,146 $602,514 $1,167,660 $21,904,683 $22,519,864 $44,424,547
Our total allowance for credit losses decreased compared to the prior year as a result of slightimprovements in the current economic conditions for most sectors. The improvement is reflected throughour estimate for a lower provision for credit losses for 2010 relative to 2009. Recoveries were higher in2010, and there was a reduction in the overall charge-off rate (although this varied by sector). Whilethere are some signs of improvement in economic conditions, the total allowance remains higher thanthe level prior to the economic downturn. High unemployment, a fragile recovery in the housing sector,commodity volatility and a stressed commercial real estate sector are all factors that may continue tonegatively influence the majority of our loan and lease portfolios.
Impaired LoansThe Bank considers a loan to be impaired when, based on current information and events, it is
probable that we will be unable to collect all amounts due according to the contractual terms of the loan.The Bank individually assesses certain larger balance loans and restructured commercial loans for loan-specific impairment. Interest income recognized on impaired loans was not material for 2010 and 2009.
-27-2010 Bank of the West Annual Report

The following tables present information related to impaired loans that are individually assessed asof December 31, 2010 and 2009:
(dollars in thousands)
Commercial&
industrialCommercialreal estate Construction
Equipmentleases Agriculture Total
Commercial ProductDecember 31, 2010
Recorded investment in impairedloans
Impaired loans and leases withrelated allowance $ 89,812 $113,523 $ 99,206 $13,711 $ 19,102 $ 335,354
Impaired loans and leases with norelated allowance 53,718 324,075 251,767 4,542 79,281 713,383
Total impaired loans $143,530 $437,598 $350,973 $18,253 $ 98,383 $1,048,737
Allowance for loan and lease losseson impaired loans $ 31,514 $ 25,737 $ 12,986 $ 6,074 $ 3,719 $ 80,030
Total unpaid principal balance $215,282 $514,537 $496,939 $18,253 $154,605 $1,399,616Average recorded investment in
impaired loans and leases $157,869 $391,248 $402,338 $23,146 $116,165 $1,090,766
(dollars in thousands)
Commercial&
industrialCommercialreal estate Construction
Equipmentleases Agriculture Total
Commercial ProductDecember 31, 2009
Recorded investment in impairedloans
Impaired loans and leases withrelated allowance $111,672 $166,039 $250,248 $27,717 $ 73,084 $ 628,760
Impaired loans and leases with norelated allowance 45,744 169,649 203,238 3,963 50,642 473,236
Total impaired loans $157,416 $335,688 $453,486 $31,680 $123,726 $1,101,996
Allowance for loan and lease losseson impaired loans $ 61,233 $ 42,298 $ 56,277 $14,741 $ 36,163 $ 210,712
Total unpaid principal balance $208,069 $380,017 $653,608 $31,680 $124,241 $1,397,615Average recorded investment in
impaired loans and leases $143,527 $254,435 $477,719 $24,195 $ 55,450 $ 955,326
Impaired loans without a related allowance for loan and lease losses are generally collateralized byassets with fair values (on an “as-is” basis) in excess of the recorded investment in the loans. Paymentson impaired loans are generally applied to reduce the outstanding principal balance of such loans.
Troubled debt RestructuringAt December 31, 2010 and 2009, troubled debt restructurings amounted to $354.1 million and
$22.3 million for commercial loans and $190.8 million and $61.0 million for consumer loans,respectively. The Bank had $3.7 million and nil of commitments to lend additional funds to customerswhose troubled debt has been restructured as of December 31, 2010 and 2009, respectively.
-28-2010 Bank of the West Annual Report

Nonaccrual and Past due Loans and LeasesTotal nonaccrual loans and leases were $1,484.4 million and $1,545.4 million as of December 31,
2010 and 2009, respectively. The following table presents information relating to the age and nonaccrualstatus of the loans and leases by class:
(dollars in thousands) Current30 - 89 days
past dueMore than
90 daysTotal loansand leases
Loans andleases on
nonaccrualstatus
Past due 90days or
more but stillaccruing
December 31, 2010
Commercial:Commercial and industrial $ 6,032,154 $ 26,489 $110,947 $ 6,169,590 $ 218,034 $ 8,910Commercial real estate 8,722,477 86,723 350,608 9,159,808 522,004 19,162Construction 1,396,378 35,977 224,698 1,657,053 363,468 18,187Equipment leases 2,315,558 20,624 30,051 2,366,233 57,650 -Agriculture 1,813,710 19,676 65,637 1,899,023 101,159 994
Consumer:Consumer loans and leases 10,411,703 137,219 14,508 10,563,430 13,536 972Residential secured – closed-end 8,560,816 160,044 182,938 8,903,798 200,433 723Residential secured – revolving, open-end 2,258,386 22,271 8,128 2,288,785 8,128 -
Total $41,511,182 $509,023 $987,515 $43,007,720 $1,484,412 $48,948
(dollars in thousands) Current30 - 89 days
past dueMore than
90 daysTotal loansand leases
Loans andleases on
nonaccrualstatus
Past due 90days or
more but stillaccruing
December 31, 2009
Commercial:Commercial and industrial $ 5,732,506 $ 44,906 $ 172,048 $ 5,949,460 $ 284,593 $ 14,548Commercial real estate 9,004,036 85,097 284,972 9,374,105 380,732 17,766Construction 1,701,170 73,798 397,260 2,172,228 440,697 70,554Equipment leases 2,340,378 37,586 52,866 2,430,830 75,379 -Agriculture 1,882,308 39,476 56,276 1,978,060 137,461 -
Consumer:Consumer loans and leases 10,012,530 177,749 20,791 10,211,070 19,171 1,620Residential secured – closed-end 9,710,259 187,244 197,990 10,095,493 199,652 587Residential secured – revolving, open-end 2,186,744 18,859 7,698 2,213,301 7,698 -
Total $42,569,931 $664,715 $1,189,901 $44,424,547 $1,545,383 $105,075
6. Premises and Equipment
At December 31, 2010 and 2009, premises and equipment were comprised of the following:
(dollars in thousands) 2010 2009
Premises $692,687 $681,871Equipment(1) 278,254 255,225Total premises and equipment 970,941 937,096Less accumulated depreciation and amortization 508,394 472,966Net book value $462,547 $464,130
(1) Includes in process internal-use software development costs and equipment not subject to amortization of$25.0 million and $16.5 million at December 31, 2010 and 2009, respectively.
Occupancy and equipment expenses include depreciation and amortization expenses of$56.0 million for both December 31, 2010 and 2009.
The Bank is obligated under a number of capital and noncancelable operating leases for premisesand equipment with terms, including renewal options, up to 50 years, many of which provide forperiodic adjustment of rentals based on changes in various economic indicators. Under the premisesleases, we are also required to pay real property taxes, insurance and maintenance. The following table
-29-2010 Bank of the West Annual Report

shows future minimum payments under leases with terms in excess of one year as of December 31,2010:
(dollars in thousands)CapitalLeases
OperatingLeases
LessSubleaseIncome
NetLease
Payments
2011 $ 1,501 $ 59,677 $ 3,871 $ 57,3072012 1,479 56,829 2,460 55,8482013 1,501 51,211 1,847 50,8652014 1,546 40,545 1,345 40,7462015 1,514 34,047 529 35,0322016 and thereafter 16,173 180,376 485 196,064
Total minimum payments $23,714 $422,685 $10,537 $435,862Less interest on capital leases 12,619
Total principal payable on capital leases(1) $11,095(1) Excludes purchase accounting adjustments of $5.4 million.
The table above includes operating leases for approximately 260,000 square feet of administrativeoffice space in San Ramon, CA with a monthly expense of $0.5 million. The lease agreements extendthrough December 31, 2025 and were entered into to consolidate multiple back offices from othernearby locations.
Rental expense, net of rental income, for all operating leases was $61.4 million and $58.9 millionfor 2010 and 2009, respectively.
The Bank did not enter into any sale-leaseback transactions in 2010 or 2009. The Bank amortized$5.8 million of deferred gains relating to its prior sale-leaseback transactions into earnings for both 2010and 2009. The Bank has no obligations or circumstances which require our continuing involvement withany of these properties.
7. Credit Guarantee Derivative
On March 31, 2010 (the “transaction date”), the Bank entered into a Collateralized CreditGuarantee Derivative Agreement (the “Guarantee”) with its parent. Under the Guarantee, BancWestagreed to reimburse the Bank for principal charge-offs, write-downs on foreclosed assets and foregoneinterest for a specific portfolio of nonperforming commercial loans and foreclosed properties (the“covered assets”) for a period of seven years. BancWest makes payments to the Bank under theGuarantee on a quarterly basis, but is not entitled to claim any recoveries on or gains on sale of thecovered assets by the Bank.
At the transaction date, the fair value of the Guarantee was estimated at $393.5 million and wasbased upon the expected future claims to be made under the Guarantee. The transaction was accountedfor as a capital contribution to the Bank, and the fair value is reported in other assets within theConsolidated Balance Sheet. To secure payments under the Guarantee, BancWest sent to the Bankcollateral in the form of a non-interest bearing cash deposit of $1.1 billion.
The Guarantee is recognized as a derivative, measured at fair value with changes in fair valuerecorded through earnings. At December 31, 2010, the estimated fair value of the Guarantee asset was$150.7 million while the notional amount of the derivative agreement was $796.6 million and the valueof the cash collateral was $1.0 billion. The decline in the fair value of the Guarantee asset sinceinception was primarily driven by the decrease in the covered assets due to charge offs, paydowns andchanges in credit forecasts. The net impact of the Guarantee on earnings as of December 31, 2010, wasa loss of $73.2 million (reported within noninterest income) due to a $242.7 million decrease in the fairvalue of the Guarantee significantly offset by payments for claims made under the Guarantee for$169.5 million.
-30-2010 Bank of the West Annual Report

8. Goodwill and Intangible Assets
We performed impairment testing of goodwill in the fourth quarter of 2010 and in the second andfourth quarters of 2009 and no impairment of goodwill was found. Our estimates of fair value werebased upon factors such as projected future cash flows, discount rates, and other uncertain elements thatrequire significant judgments. While we use available information to prepare our estimates and performimpairment evaluations, actual results in the future could differ significantly. Impairment tests in futureperiods may result in impairment charges which could materially impact our future reported results. Thetable below provides the breakdown of goodwill by reportable segment.
(dollars in millions)RegionalBanking
CommercialBanking
NationalFinance
WealthManagement Total
Balance as of January 1, 2009: $2,921 $840 $421 $16 $4,198Purchase accounting adjustments:
Insurance agency acquisitions - - - 1 1Balance as of December 31, 2009: $2,921 $840 $421 $17 $4,199Purchase accounting adjustments:
Wachovia branch purchase(1) 1 - - - 1Insurance agency acquisitions - - - 1 1
Balance as of December 31, 2010: $2,922 $840 $421 $18 $4,201(1) In January 2010, the Bank acquired deposits of approximately $265 million of two former Wachovia branches from
Wells Fargo located in Northern California.
The details of our finite-lived intangible assets are presented below:
(dollars in thousands)Gross Carrying
AmountAccumulatedAmortization
Net BookValue
Balance as of December 31, 2010:Core Deposits $398,878 $293,706 $105,172Other Intangible Assets(1) 42,942 15,811 27,131
Total $441,820 $309,517 $132,303Balance as of December 31, 2009:Core Deposits $397,630 $259,787 $137,843Other Intangible Assets(1) 32,733 11,227 21,506
Total $430,363 $271,014 $159,349
(1) Includes mortgage servicing rights. Refer to Note 3 for additional information.
Intangible amortization expense included in noninterest expense was $35.4 million and$37.5 million for 2010 and 2009, respectively.
The estimated annual amortization expense for finite-lived intangible assets, primarily core depositintangibles, is:
(dollars in thousands)Estimate for the year ended December 31,2011 $34,5062012 16,9382013 13,8442014 13,7802015 13,731
-31-2010 Bank of the West Annual Report

9. Variable Interest Entities
A VIE is an entity that has either a total equity investment that is insufficient to finance itsactivities without additional subordinated financial support or whose equity investors lack the ability tocontrol the entity’s activities. Under existing accounting guidance, a VIE is consolidated by its primarybeneficiary, the party that has both the power to direct the activities that most significantly impact theVIE and a variable interest that could potentially be significant to the VIE.
The Bank evaluates whether an entity is a VIE upon its creation and upon the occurrence ofsignificant events such as a change in an entity’s assets or activities. The determination of whether theBank is the primary beneficiary involves performing a qualitative analysis of the VIE that includes itscapital structure, contractual terms including the rights of each variable interest holder, the activities ofthe VIE that most significantly impact its economic performance, whether the Bank has the power todirect those activities and our obligation to absorb losses or the right to receive benefits significant tothe VIE.
Limited liability companiesThe Bank has investments in numerous limited liability companies (“LLCs”) for the purpose of
managing foreclosed properties seized to mitigate losses to the Bank and its partners by selling thecollateral. These LLCs have similar risks and characteristics and therefore have been aggregated fordisclosure purpose. For some of these entities, the Bank is responsible for managing the daily operations.The Bank is the primary beneficiary when it has the power to direct the activities that significantlyimpact the performance of the LLCs and the obligation to absorb losses or the right to receive benefitsthat could potentially be significant to the VIE. Profits and losses of the entities are allocated to theBank and its third-party partners in accordance with their respective ownership percentages. If deemednecessary, the Bank may be required to provide additional financial support to fund the operations ofthese entities. However, there are no circumstances in which the Bank’s maximum exposure to lossesassociated with the foreclosed properties would exceed its investments in these properties and creditors,if any, of the consolidated VIE do not have recourse on the general credit of the Bank.
In addition to the investments in LLCs for managing foreclosed properties, the Bank has formedCLAAS Financial Services, LLC with the purpose of providing lease and loan financing to commercialentities acquiring agricultural equipment. The Bank owns a 51% interest in the LLC and provides for allof its funding. As a result, the Bank carries the greatest variability in the LLC and has the obligation toabsorb a majority of the expected losses. The Bank also has the power to direct key activities of theLLC that significantly drive its performance through control of the Board of Directors. Since the Bank isthe primary beneficiary of this entity, it is consolidated in our financial statements.
Tax credit investmentsThe Bank owns several limited partnership interests in low-income housing developments in
conjunction with the Community Reinvestment Act. The Bank is not the primary beneficiary of theseentities and in most instances, the Bank is one of many limited partners and our interest in thepartnerships may decrease as new limited partners are added. Limited partners do not participate in thecontrol of the partnerships’ businesses. The general partners, which are either developers or nonprofitorganizations, exercise the day-to-day control and management of the projects. The general partners haveexclusive control over the partnerships’ businesses and have all of the rights, powers, and authoritygenerally conferred by law or necessary, advisable or consistent with accomplishing the partnerships’businesses. As a limited partner, the Bank does not have an active role in any of the partnerships and ourinvolvement is limited to providing financial support, as stated within the contractual agreements andtherefore we are not the primary beneficiary.
The business purpose of these entities is to provide affordable housing within the Bank’s servicearea in return for tax credits and tax loss deductions. The Bank has not received additional income orincurred additional expenses as a result of our involvement with these entities. Because we are the
-32-2010 Bank of the West Annual Report

limited partners, our maximum exposure would never exceed our investment, including our subscriptionamount. In the unlikely event that the general partners do not adhere to their contractual obligations toprovide financial support to low-income housing, the Bank may be subject to tax credit recapture rulesand would record income or expense related to the project, including recognition of a gain or loss on thedisposition or termination of its partnership interest. Bargain purchase options are available for thegeneral partners to purchase the Bank’s portion of interests in the limited partnerships.
Consolidated VIEsThe following table presents information on assets and liabilities of the consolidated VIEs as they
are included in these line items in our consolidated balance sheets at December 31:
(dollars in thousands) 2010 2009AssetsCash and due from banks $ 9,646 $ 5,889Loans and leases:
Loans and leases 153,878 90,589Less allowance for loan and lease losses 871 498
Net loans and leases 153,007 90,091Other real estate owned assets 7,026 2,770Interest receivable 148 -Other assets 21 10
Total Assets $169,848 $98,760LiabilitiesOther liabilities $ 570 $ 507
Total liabilities $ 570 $ 507
Unconsolidated VIEsThe following tables present the carrying amount of assets, liabilities and our maximum exposure to
loss related to our unconsolidated VIEs in our consolidated balance sheets at December 31:
(dollars in thousands)Total
Assets(1)Total
Liabilities(1)
MaximumExposureto Loss
December 31, 2010
Tax credit investments $109,464 $23,407 $219,435(1) Reported in other assets and other liabilities.
(dollars in thousands)Total
Assets(1)Total
Liabilities(1)
MaximumExposureto Loss
December 31, 2009
Tax credit investments $117,159 $31,221 $209,435Limited liability companies $ 14,945 $ - $ 14,945
(1) Reported in other assets and other liabilities.
Trust preferred securitiesIn addition to our involvement with the VIEs disclosed above, we had outstanding debt financing
through the issuance of trust preferred securities through a statutory business trust in which the Bankowned all the voting equity shares at December 31, 2009. On May 23, 2010, the Bank completed theredemption of the 20,000 outstanding shares of Commercial Federal Capital Trust III (“CFC Trust III”),an unconsolidated VIE, at a price of $1,000 per share plus accrued and unpaid interest. The trust wasformed in 2005 and issued $20 million of floating-rate capital securities. The proceeds of the offeringwere invested by CFC Trust III in junior subordinated debentures of Commercial Federal Bank, whichwere later assumed by the Bank following the merger of Commercial Federal Bank with and into the
-33-2010 Bank of the West Annual Report

Bank. All of the common securities of CFC Trust III were owned by the Bank. The trust preferredsecurities did not qualify as Tier 1 capital as the rule that allows them to be included only applies tobank holding companies. The debt is included in Note 13.
10. Regulatory Capital Requirements
The Bank is subject to various regulatory capital requirements administered by Federal bankingagencies. If the Bank fails to meet minimum capital requirements, these agencies can initiate certaindiscretionary and mandatory actions. Such regulatory actions could have a material effect on the Bank’sfinancial statements. The Bank constantly monitors its regulatory capital levels and, if necessary, mayobtain capital from its Parent company through BNP Paribas or by other means. The Bank received$1,000 million and $600 million in capital through the issuance of common stock to help ensurecompliance with the regulatory capital requirements in 2010 and 2009, respectively.
Under capital adequacy guidelines and the regulatory framework for prompt corrective action, theBank must meet specific capital guidelines that involve quantitative measures of its assets and certainoff-balance sheet items as calculated under regulatory accounting practices. These capital amounts andclassifications are also subject to qualitative judgments by the regulators about components, riskweightings and other factors.
Quantitative measures established by regulation to ensure capital adequacy require the Bank tomaintain adequate levels of Tier 1 and Total capital to risk-weighted assets and Tier 1 capital to averageassets. The table below sets forth those ratios at December 31, 2010 and 2009.
(dollars in thousands) Amount Ratio Amount Ratio Amount RatioActual
For CapitalAdequacy Purposes
To be Well-CapitalizedUnder Prompt Corrective
Action Provisions
As of December 31, 2010Tier I capital to risk-weighted
assets $5,979,172 13.32% $1,795,229 4.00% $2,692,843 6.00%Total capital to risk-weighted
assets $6,546,329 14.59% $3,590,457 8.00% $4,488,072 10.00%Tier I capital to average assets
(leverage ratio)(1) $5,979,172 11.22% $2,132,475 4.00% $2,665,594 5.00%As of December 31, 2009Tier I capital to risk-weighted
assets $4,796,444 9.80% $1,958,466 4.00% $2,937,698 6.00%Total capital to risk-weighted
assets $5,425,979 11.08% $3,916,931 8.00% $4,896,164 10.00%Tier I capital to average assets
(leverage ratio)(1) $4,796,444 8.41% $2,282,665 4.00% $2,853,331 5.00%
(1) The leverage ratio consists of a ratio of Tier 1 capital to average assets, excluding goodwill and certain other items. Theminimum leverage ratio guideline is 3% for banking organizations that do not anticipate or are not experiencing significantgrowth, and that have well-diversified risk, excellent asset quality, high liquidity, good earnings, are considered strongbanking organizations and rated a composite 1 under the Uniform Financial Institution Rating System established by theFederal Financial Institution Examination Council. For all others, the minimum ratio is 4%.
Pursuant to applicable laws and regulations, the Bank is deemed to be well-capitalized. To be well-capitalized, a bank must have a total risk-based capital ratio of 10.00% or greater, a Tier 1 risk-basedcapital ratio of 6.00% or greater, a leverage ratio of 5.00% or greater and not be subject to anyagreement, order or directive to meet a specific capital level for any capital measure. These capital ratiosrepresent the relative risk inherent within our balance sheet.
-34-2010 Bank of the West Annual Report
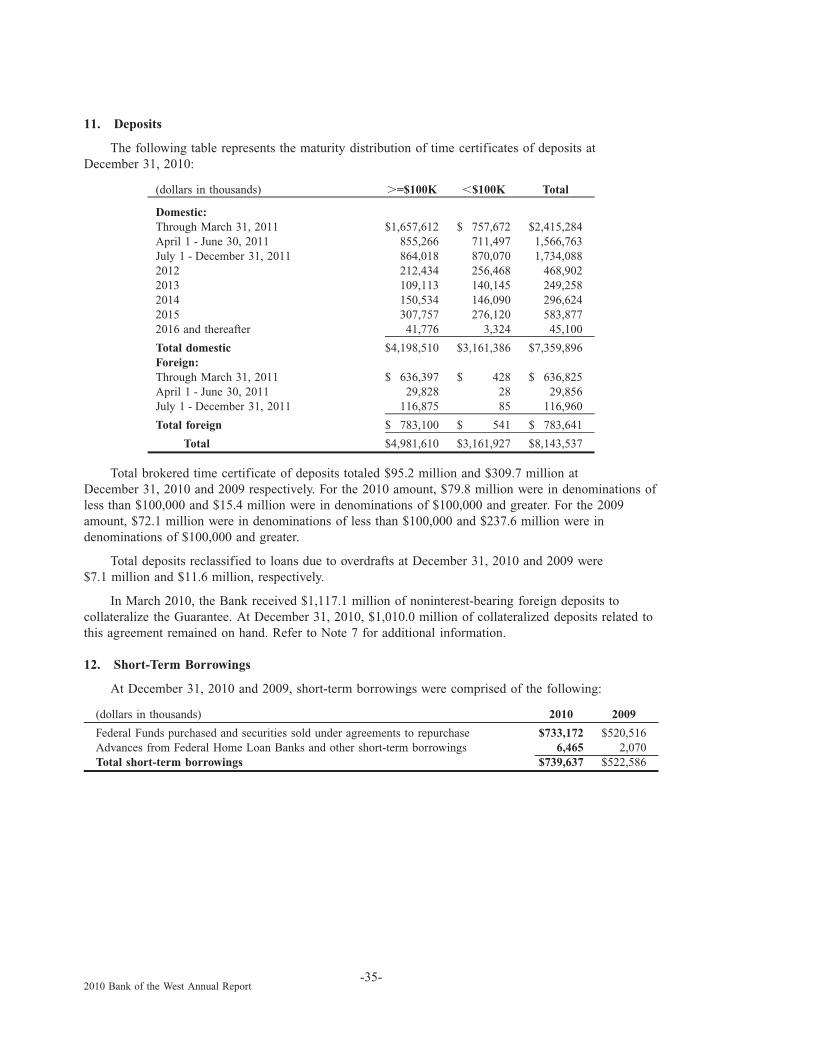
11. Deposits
The following table represents the maturity distribution of time certificates of deposits atDecember 31, 2010:
(dollars in thousands) �=$100K �$100K Total
Domestic:Through March 31, 2011 $1,657,612 $ 757,672 $2,415,284April 1 - June 30, 2011 855,266 711,497 1,566,763July 1 - December 31, 2011 864,018 870,070 1,734,0882012 212,434 256,468 468,9022013 109,113 140,145 249,2582014 150,534 146,090 296,6242015 307,757 276,120 583,8772016 and thereafter 41,776 3,324 45,100
Total domestic $4,198,510 $3,161,386 $7,359,896Foreign:Through March 31, 2011 $ 636,397 $ 428 $ 636,825April 1 - June 30, 2011 29,828 28 29,856July 1 - December 31, 2011 116,875 85 116,960
Total foreign $ 783,100 $ 541 $ 783,641
Total $4,981,610 $3,161,927 $8,143,537
Total brokered time certificate of deposits totaled $95.2 million and $309.7 million atDecember 31, 2010 and 2009 respectively. For the 2010 amount, $79.8 million were in denominations ofless than $100,000 and $15.4 million were in denominations of $100,000 and greater. For the 2009amount, $72.1 million were in denominations of less than $100,000 and $237.6 million were indenominations of $100,000 and greater.
Total deposits reclassified to loans due to overdrafts at December 31, 2010 and 2009 were$7.1 million and $11.6 million, respectively.
In March 2010, the Bank received $1,117.1 million of noninterest-bearing foreign deposits tocollateralize the Guarantee. At December 31, 2010, $1,010.0 million of collateralized deposits related tothis agreement remained on hand. Refer to Note 7 for additional information.
12. Short-Term Borrowings
At December 31, 2010 and 2009, short-term borrowings were comprised of the following:
(dollars in thousands) 2010 2009
Federal Funds purchased and securities sold under agreements to repurchase $733,172 $520,516Advances from Federal Home Loan Banks and other short-term borrowings 6,465 2,070Total short-term borrowings $739,637 $522,586
-35-2010 Bank of the West Annual Report

The table below shows selected information for short-term borrowings:
(dollars in thousands) 2010 2009
Federal Funds purchased and securities sold under agreements to repurchase:Weighted average interest rate at December 31 0.09% 0.10%Highest month-end balance $4,433,701 $3,286,334Average daily outstanding balance $ 720,107 $1,667,897Weighted average daily interest rate paid 0.12% 0.12%
Advances from Federal Home Loan Banks and other short-term borrowings:Weighted average interest rate at December 31 - -Highest month-end balance $ 89,665 $4,508,993Average daily outstanding balance $ 13,724 $2,969,721Weighted average daily interest rate paid 0.01% 0.30%
The Bank treats securities sold under agreements to repurchase as collateralized financings. TheBank reflects the obligations to repurchase the identical securities sold as liabilities, with the dollaramount of securities underlying the agreements remaining in the asset accounts. At December 31, 2010,the weighted average maturity of these agreements was 3 days. Maturities of these agreements atDecember 31 were as follows:
(dollars in thousands) 2010
Overnight $422,187Less than 30 days 70030 days through 90 days -Over 90 days -
Total $422,887
At December 31, 2010, the Bank had $13.5 billion of credit lines available from otherU.S. financial institutions. Of this amount, $0.9 billion is available from First Hawaiian Bank and$0.6 billion is available from BNP Paribas of New York. At December 31, 2010, the Bank had drawndown on the available credit lines of credit by $0.3 billion, from non-affiliated U.S. financial institutions.
-36-2010 Bank of the West Annual Report

13. Long-Term Debt
At December 31, 2010 and 2009, long-term debt was comprised of the following:
(dollars in thousands) Rate(s) 2010 2009
Fixed-rate advances from the Federal Home LoanBank due through 2035(1)(2)(8) 2.87% to 7.96% $2,908,042 $4,460,936
Fixed-rate advances from the Federal Home LoanBank due through 2018(1)(3)(7)(9) 3.54% to 4.99% 680,000 1,395,000
Floating-rate advances from the Federal Home LoanBank due through 2013(1)(2) 1 mo. LIBOR +0.02% to 0.19% 1,050,000 1,050,000
Fixed-rate TLGP unsecured senior debt(4) 2.15% 1,000,997 1,001,762Fixed – rate unsecured lines of credit with BNP
Paribas due through 2015(2) 2.89% to 4.71% 75,900 83,700Floating-rate subordinated note due 2011(4) 6 mo. LIBOR +3.75% 31,026 32,032Fixed-rate subordinated note due 2011(4) 8.30% 50,036 50,875Floating-rate junior subordinated note due 2035(3)(5) 3 mo. LIBOR +1.97% - 20,000Fixed-rate structured term repurchase agreements
due 2010(1)(3)(6) 5.02% and 5.03% - 1,000,000Floating-rate structured term repurchase agreements
due 2010(1)(3) 8.12% - 100,000Floating-rate BNP structured term repurchase
agreement due 2010(2) 8.03% and 8.18% - 350,000Capital leases due through 2030(2) 16,534 17,372
Total long-term debt $5,812,535 $9,561,677
(1) This debt is secured by real estate loans or securities. See Notes 2 and 4 to the financial statements for additional information.(2) Interest is payable monthly.(3) Interest is payable quarterly.(4) Interest is payable semi-annually.(5) These notes related to the CFC Trusts were redeemed on May 23, 2010. See Note 9 for additional information.(6) These agreements contained put options that were exercisable by the counterparties.(7) Fixed rate with partial repayment quarterly(8) In 2009, the Bank terminated $339 million of these advances and recognized a $4.9 million loss on the termination.(9) In 2009, the Bank terminated $500 million of these advances and recognized a $6.4 million loss on the termination.
As part of long-term and short-term borrowing arrangements, we were subject to various covenants.At December 31, 2010 and 2009, we were in compliance with all the covenants.
As of December 31, 2010, the principal payments due on long-term debt were as follows:
(dollars in thousands)
2011 $1,769,312
2012 2,141,355
2013 1,573,844
2014 36,739
2015 15,652
2016 and thereafter 270,027
Total(1) $5,806,929(1) Excludes fair valuation for debt that was hedged and purchase accounting adjustments totaling
$5.6 million.
-37-2010 Bank of the West Annual Report
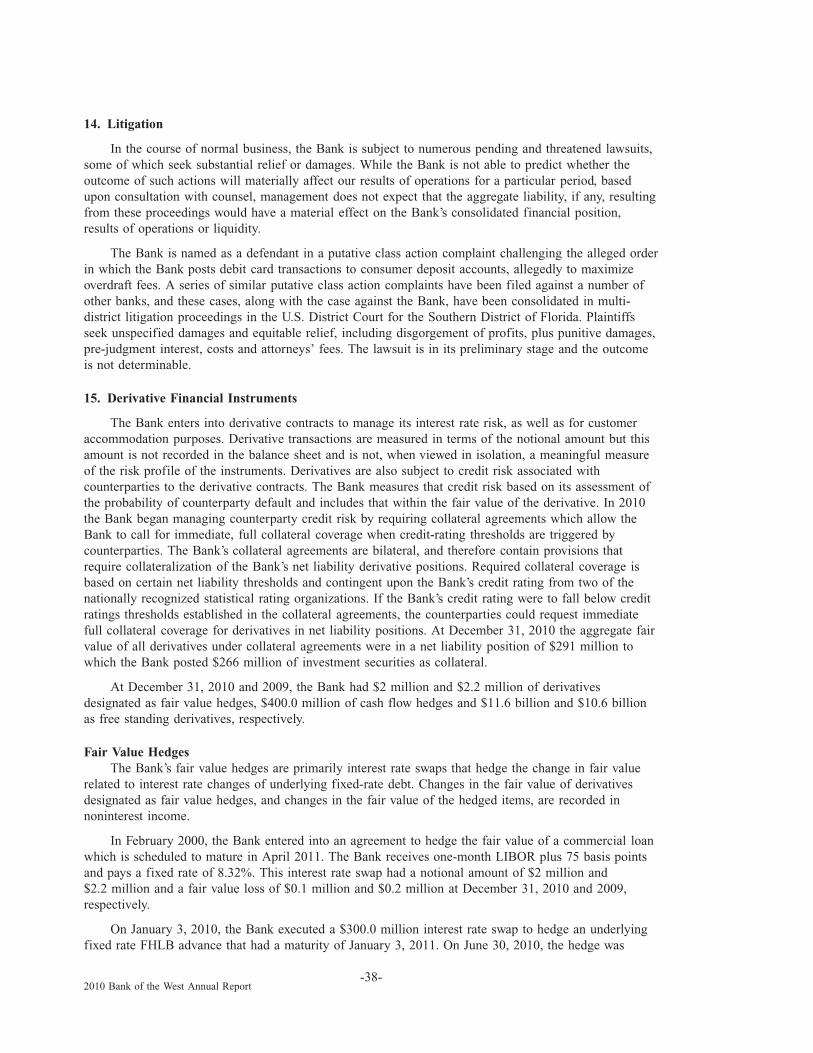
14. Litigation
In the course of normal business, the Bank is subject to numerous pending and threatened lawsuits,some of which seek substantial relief or damages. While the Bank is not able to predict whether theoutcome of such actions will materially affect our results of operations for a particular period, basedupon consultation with counsel, management does not expect that the aggregate liability, if any, resultingfrom these proceedings would have a material effect on the Bank’s consolidated financial position,results of operations or liquidity.
The Bank is named as a defendant in a putative class action complaint challenging the alleged orderin which the Bank posts debit card transactions to consumer deposit accounts, allegedly to maximizeoverdraft fees. A series of similar putative class action complaints have been filed against a number ofother banks, and these cases, along with the case against the Bank, have been consolidated in multi-district litigation proceedings in the U.S. District Court for the Southern District of Florida. Plaintiffsseek unspecified damages and equitable relief, including disgorgement of profits, plus punitive damages,pre-judgment interest, costs and attorneys’ fees. The lawsuit is in its preliminary stage and the outcomeis not determinable.
15. Derivative Financial Instruments
The Bank enters into derivative contracts to manage its interest rate risk, as well as for customeraccommodation purposes. Derivative transactions are measured in terms of the notional amount but thisamount is not recorded in the balance sheet and is not, when viewed in isolation, a meaningful measureof the risk profile of the instruments. Derivatives are also subject to credit risk associated withcounterparties to the derivative contracts. The Bank measures that credit risk based on its assessment ofthe probability of counterparty default and includes that within the fair value of the derivative. In 2010the Bank began managing counterparty credit risk by requiring collateral agreements which allow theBank to call for immediate, full collateral coverage when credit-rating thresholds are triggered bycounterparties. The Bank’s collateral agreements are bilateral, and therefore contain provisions thatrequire collateralization of the Bank’s net liability derivative positions. Required collateral coverage isbased on certain net liability thresholds and contingent upon the Bank’s credit rating from two of thenationally recognized statistical rating organizations. If the Bank’s credit rating were to fall below creditratings thresholds established in the collateral agreements, the counterparties could request immediatefull collateral coverage for derivatives in net liability positions. At December 31, 2010 the aggregate fairvalue of all derivatives under collateral agreements were in a net liability position of $291 million towhich the Bank posted $266 million of investment securities as collateral.
At December 31, 2010 and 2009, the Bank had $2 million and $2.2 million of derivativesdesignated as fair value hedges, $400.0 million of cash flow hedges and $11.6 billion and $10.6 billionas free standing derivatives, respectively.
Fair Value HedgesThe Bank’s fair value hedges are primarily interest rate swaps that hedge the change in fair value
related to interest rate changes of underlying fixed-rate debt. Changes in the fair value of derivativesdesignated as fair value hedges, and changes in the fair value of the hedged items, are recorded innoninterest income.
In February 2000, the Bank entered into an agreement to hedge the fair value of a commercial loanwhich is scheduled to mature in April 2011. The Bank receives one-month LIBOR plus 75 basis pointsand pays a fixed rate of 8.32%. This interest rate swap had a notional amount of $2 million and$2.2 million and a fair value loss of $0.1 million and $0.2 million at December 31, 2010 and 2009,respectively.
On January 3, 2010, the Bank executed a $300.0 million interest rate swap to hedge an underlyingfixed rate FHLB advance that had a maturity of January 3, 2011. On June 30, 2010, the hedge was
-38-2010 Bank of the West Annual Report

deemed ineffective and unwound; the swap was re-designated as a free standing derivative withsubsequent gains and losses recorded to earnings.
The total impact of amortization related to the carrying value adjustments of hedged items due toterminated fair value hedges at December 31, 2010 and 2009 was $11.5 million and $4.0 million,respectively.
Cash Flow HedgesThe Bank’s cash flow hedges are interest rate swaps that hedge the forecasted cash flows of
underlying variable-rate debt. Changes in the fair values of derivatives designated as cash flow hedges,to the extent effective, are recorded in other comprehensive income until income from the cash flows ofthe hedged items is realized. Any ineffectiveness which may arise during the hedging relationship isrecognized in earnings in the period in which it arises. If a derivative designated as a cash flow hedge isterminated or deemed overall ineffective, the gain or loss in other comprehensive income is amortized toearnings over the period the forecasted hedged transactions impact earnings. If a hedged forecastedtransaction is probable of not occurring, hedge accounting is ceased and any gain or loss included inother comprehensive income (loss) is reported in earnings immediately.
At December 31, 2010 and 2009 the Bank had $400.0 million of interest rate swaps outstandingwith $9.5 million and $18.9 million of unrealized losses in other comprehensive income, respectively.The estimated amount to be reclassified from other comprehensive income into earnings during the next12 months is a loss of $7.2 million. This includes net gains and losses related to hedges that wereterminated early for which the transactions or cash flows are probable. The total impact of amortizationrelated to those terminated hedges at December 31, 2010 and 2009 was expense of $1.2 million and$13.0 million, respectively. All cash flow hedges were deemed effective at December 31, 2010 and 2009.
Free Standing DerivativesFree standing derivative instruments include derivative transactions entered into for purposes for
which hedge accounting does not apply. These derivatives include interest rate swaps, interest ratecollars, market linked equity swaps and options and forward commitments to fund and sell residentialmortgage loans. The Bank acts as a seller and buyer of interest rate derivatives and foreign exchangecontracts to accommodate customers. To mitigate the market and liquidity risk associated with thesederivatives, the Bank enters into similar offsetting positions.
-39-2010 Bank of the West Annual Report
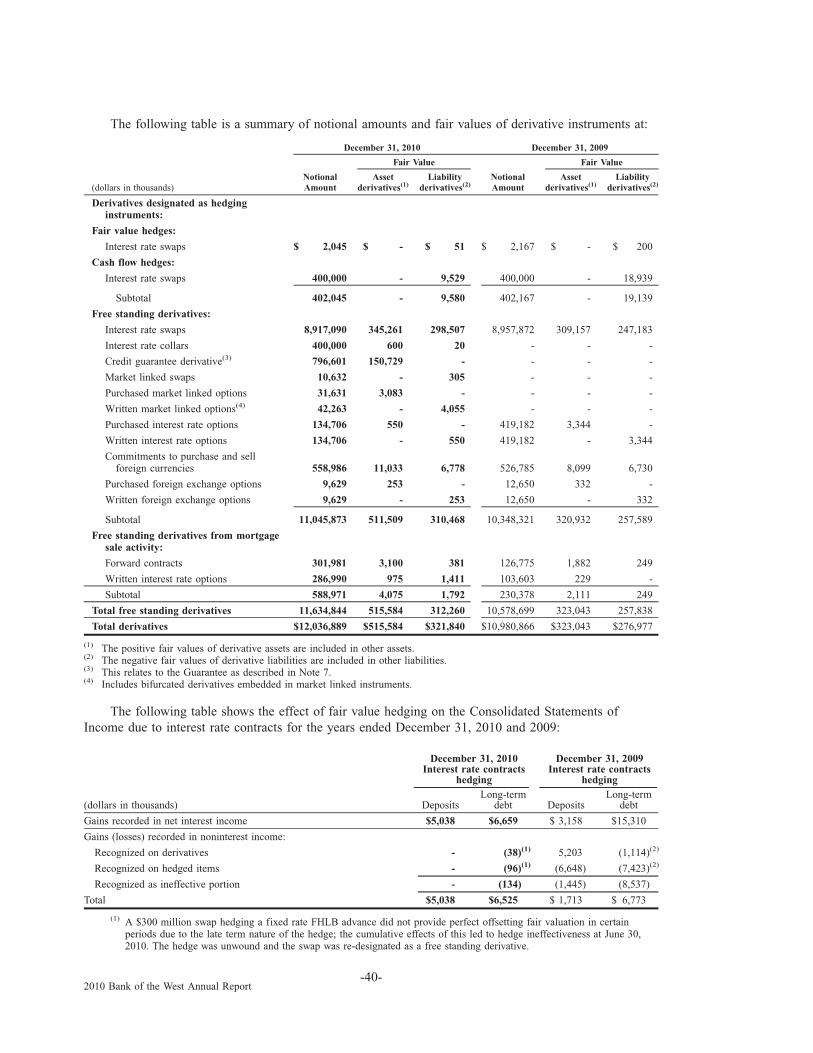
The following table is a summary of notional amounts and fair values of derivative instruments at:
(dollars in thousands)NotionalAmount
Assetderivatives(1)
Liabilityderivatives(2)
NotionalAmount
Assetderivatives(1)
Liabilityderivatives(2)
Fair Value Fair Value
December 31, 2010 December 31, 2009
Derivatives designated as hedginginstruments:
Fair value hedges:
Interest rate swaps $ 2,045 $ - $ 51 $ 2,167 $ - $ 200
Cash flow hedges:
Interest rate swaps 400,000 - 9,529 400,000 - 18,939
Subtotal 402,045 - 9,580 402,167 - 19,139
Free standing derivatives:
Interest rate swaps 8,917,090 345,261 298,507 8,957,872 309,157 247,183
Interest rate collars 400,000 600 20 - - -
Credit guarantee derivative(3) 796,601 150,729 - - - -
Market linked swaps 10,632 - 305 - - -
Purchased market linked options 31,631 3,083 - - - -
Written market linked options(4) 42,263 - 4,055 - - -
Purchased interest rate options 134,706 550 - 419,182 3,344 -
Written interest rate options 134,706 - 550 419,182 - 3,344
Commitments to purchase and sellforeign currencies 558,986 11,033 6,778 526,785 8,099 6,730
Purchased foreign exchange options 9,629 253 - 12,650 332 -
Written foreign exchange options 9,629 - 253 12,650 - 332
Subtotal 11,045,873 511,509 310,468 10,348,321 320,932 257,589
Free standing derivatives from mortgagesale activity:
Forward contracts 301,981 3,100 381 126,775 1,882 249
Written interest rate options 286,990 975 1,411 103,603 229 -
Subtotal 588,971 4,075 1,792 230,378 2,111 249
Total free standing derivatives 11,634,844 515,584 312,260 10,578,699 323,043 257,838
Total derivatives $12,036,889 $515,584 $321,840 $10,980,866 $323,043 $276,977
(1) The positive fair values of derivative assets are included in other assets.(2) The negative fair values of derivative liabilities are included in other liabilities.(3) This relates to the Guarantee as described in Note 7.(4) Includes bifurcated derivatives embedded in market linked instruments.
The following table shows the effect of fair value hedging on the Consolidated Statements ofIncome due to interest rate contracts for the years ended December 31, 2010 and 2009:
(dollars in thousands) DepositsLong-term
debt DepositsLong-term
debt
December 31, 2010Interest rate contracts
hedging
December 31, 2009Interest rate contracts
hedging
Gains recorded in net interest income $5,038 $6,659 $ 3,158 $15,310
Gains (losses) recorded in noninterest income:
Recognized on derivatives - (38)(1) 5,203 (1,114)(2)
Recognized on hedged items - (96)(1) (6,648) (7,423)(2)
Recognized as ineffective portion - (134) (1,445) (8,537)
Total $5,038 $6,525 $ 1,713 $ 6,773
(1) A $300 million swap hedging a fixed rate FHLB advance did not provide perfect offsetting fair valuation in certainperiods due to the late term nature of the hedge; the cumulative effects of this led to hedge ineffectiveness at June 30,2010. The hedge was unwound and the swap was re-designated as a free standing derivative.
-40-2010 Bank of the West Annual Report

(2) A steeper yield-curve at termination of the TLGP hedge caused a larger fair valuation on TLGP debt versus a smalleroffset on the related swap. In addition, due to late-term hedging, some swaps hedging FHLB advances did not provide anoffsetting fair valuation in certain periods. This caused the fair value changes on the swaps to move in the same directionas the related advances.
The following table summarizes the effect of cash flow hedging for the years ended December 31,2010 and 2009:
(dollars in thousands) 2010 2009
Pretax loss recognized in OCI on derivatives (effectiveportion) $ (4,939) $ (7,600)
Pretax loss reclassified from cumulative OCI into netinterest income (effective portion)(1) $16,727 $28,137
(1) Includes net settlement of $15.5 million and $15.1 million, and amortization of fair value captured in OCIon terminated swaps of $1.2 million and $13.0 million for the years ending December 31, 2010 and 2009,respectively.
The following table shows the net gains (losses) recognized as noninterest income relating to freestanding derivatives not recognized as hedging instruments, held by the Bank as of December 31, 2010and 2009:
(dollars in thousands) 2010 2009
Interest rate swaps $ (1,669) $ 9,357Interest rate collars 580 -Credit guarantee derivative (73,201) -Market linked equity swaps 23 -Purchased market linked options 347 -Written market linked options (631) -Purchased interest rate options (2,794) (4,343)Written interest rate options 2,374 4,328Commitments to purchase and sell foreign
currencies 11,021 10,168Purchased foreign exchange options 340 629Written foreign exchange options (479) (804)Forward contracts 836 1,882
Total net gains (losses) $(63,253) $21,217
16. Fair Value
The following is a description of valuation methodologies used for assets and liabilities recorded atfair value and for estimating fair value for financial instruments not recorded at fair value:
Short-term financial assetsWe do not measure short-term financial assets at fair value. As such, valuation techniques discussed
herein for short-term financial assets are for estimations used in the fair value of financial instrumentsdisclosure requirements. Short-term financial assets include cash and due from banks and due fromcustomers on acceptances. The carrying amount is a reasonable estimate of fair value because of therelatively short time between the origination of the instrument and its expected realization.
Federal funds sold and securities purchased under agreements to resellWe do not record these assets at fair value. As such, valuation techniques discussed herein for these
assets are primarily for estimations used in the fair value of financial instruments disclosurerequirements. The carrying amount of these items is generally a reasonable estimate of fair valuebecause of the relatively short time between the origination of the instrument and its expectedrealization.
-41-2010 Bank of the West Annual Report

Trading assetsTrading assets are measured at fair value on a recurring basis. Fair values of trading assets are
based on quoted market prices of comparable instruments and are classified as Level 2. Trading assetsinclude U.S. Treasury Notes.
SecuritiesSecurities available for sale are measured at fair value on a recurring basis. Fair value measurement
is based upon quoted prices if available. If quoted prices are not available for the specific security, theBank may estimate the fair value of such instruments using a combination of observed transaction pricesof comparables, independent pricing services, or other adjustments deemed necessary to properly reflectan exit price. Level 1 securities include certain equity securities that have quoted prices available inactive markets. Level 2 securities primarily include U.S. Treasury securities that are not traded bydealers or brokers in active over-the-counter markets, U.S. Government agency securities, municipalbonds, and other equity securities, the pricing of which are derived using observable data such as priceson similar assets in active or inactive markets. Level 3 securities include mortgage-backed securities,collateralized debt obligations, collateralized loan obligations and other asset-backed securities wherepricing was based on a qualified third-party source.
Loans held for saleLoans held for sale are measured at fair value on a nonrecurring basis. For loans originated for
investment and transferred to held for sale with declines in fair value that are attributable to creditquality, any reduction in the loan’s value at the time of the transfer must be reflected as a write down ofthe recorded investment resulting in a new cost basis, with a corresponding reduction in the allowancefor loan and lease losses. For mortgage loans held for sale, we use inputs from quoted prices or rates forassets in the active bond loans market and accordingly, classify them as Level 2.
LoansLoans may be measured at fair value on a nonrecurring basis. As such, valuation techniques
discussed herein for loans are primarily for estimations used in the fair value of financial instrumentsdisclosure requirements. We use discounted cash flow analyses, which include a liquidity premium, thatis based upon actual funding experience and utilize interest rates currently being offered for loans withsimilar terms and prepayment rates to borrowers of similar credit quality. For certain loans, we mayestimate fair value based upon a loan’s observable market price. The carrying amount of accrued interestapproximates its fair value. For real estate secured loans and leases that are impaired, the Bank uses thefair value of collateral to determine the amount of impairment. The fair values of collateral for impairedloans are primarily based on real estate appraisal reports prepared by third party appraisers. The Bankreviews the third party’s appraisal based on observable market data for reasonableness. As such,impaired loans are classified as Level 2.
Foreclosed assetsForeclosed assets are measured at fair value on a nonrecurring basis using lower of cost or fair
value. Foreclosed assets include foreclosed properties securing residential and auto loans. Foreclosedassets are adjusted to fair value less costs to sell upon transfer of the loans to foreclosed assets.Subsequently, foreclosed assets are carried at the lower of carrying value or fair value less costs to sell.Fair value is generally determined using appraised values based on observable market data and,accordingly, we classify foreclosed assets as Level 2.
Assets for deferred compensation plansAssets for deferred compensation plans are Level 1 securities consisting of money market funds
held within a nonqualified deferred compensation trust. Fair value measurement of these assets is basedupon quoted prices.
-42-2010 Bank of the West Annual Report
DepositsWe do not measure deposits at fair value. As such, valuation techniques discussed herein for
deposits are primarily for estimations used in the fair value of financial instruments disclosurerequirements. The fair values of deposits with no maturity date (e.g., interest and noninterest-bearingchecking, regular savings, and certain types of money market savings accounts) are equal to the amountpayable on demand at the reporting date (i.e., their carrying amounts). Fair values of fixed-ratecertificates of deposit are estimated using a discounted cash flow calculation that applies interest ratescurrently being offered on certificates to a schedule of aggregated expected monthly maturities on timedeposits.
Short-term borrowings and long-term debtWe do not measure short-term borrowings or long-term debt at fair value. As such, valuation
techniques discussed herein are primarily for estimations used in the fair value of financial instrumentsdisclosure requirements. The fair values are estimated using quoted market prices or discounted cashflow analyses based on our current incremental borrowing rates for similar types of borrowingarrangements.
DerivativesMost of our derivatives are traded in over-the-counter markets where quoted market prices are not
readily available. For those derivatives, we measure fair value primarily using market observable inputs,such as yield curves. In addition, the fair valuations for derivatives include an adjustment for estimatedcredit risk. As such, we classify derivatives as Level 2. Examples of Level 2 derivatives are interest rateswaps and forward contracts. The fair value of the Guarantee is classified as a Level 3 fair valuemeasurement since the Bank estimates its fair value using an internally developed discounted cash flowvaluation model. The key assumptions in the model and the drivers of changes in fair value are creditloss forecasts to project the future potential payoffs from the Guarantee, the average remaining life ofthe covered assets, and the rate to discount the estimated claims under the Guarantee. The credit lossforecast is an internally developed estimate that incorporates the timing and amount of potential creditlosses. The credit loss forecast also uses migration matrices to predict potential future credit ratings forthe covered assets. The expected life of the Guarantee is based on management’s best estimate at eachbalance sheet date.
Off-balance sheet financial instrumentsThe fair value of letters of credit and commitments to fund loans represents estimated fees that
would be charged to enter into similar agreements with similar remaining maturities and is not presentedherein. These estimates are subjective in nature and involve uncertainties and matters of significantjudgment and, therefore, cannot be determined with precision. The fair value of these financialinstruments is not material to our consolidated financial statements.
-43-2010 Bank of the West Annual Report

The table below presents the balances of assets, liabilities and derivatives measured at fair value ona recurring basis at December 31, 2010:
(dollars in thousands) Level 1 Level 2 Level 3 Total
Trading assets $ - $ 5,500 $ - $ 5,500Securities available for sale:
U.S. Treasury and other U.S. Government agencies andcorporations - 174,231 - 174,231
Government sponsored agencies - 483,111 - 483,111Mortgage and asset-backed securities: -
Government agencies(1) - 239,522 - 239,522Government sponsored agencies(1) - 1,211,539 - 1,211,539Non-government mortgage-backed securities(1) - - - -Collateralized debt obligations - - 66,992 66,992Collateralized loan obligations - - 129,906 129,906Other asset-backed securities - 6,809 863 7,672
Collateralized mortgage obligations:Government agencies - 1,099,528 - 1,099,528Government sponsored agencies - 1,437,423 - 1,437,423Other - - - -
State and political subdivisions and others - 1,272,593 - 1,272,593Equity securities 441 5,804 - 6,245
Total securities available for sale 441 5,930,560 197,761 6,128,762Derivative assets - 364,855 150,729 515,584Other assets(2) 25,414 907 92 26,413
Total assets measured at fair value on a recurring basis $25,855 $6,301,822 $348,582 $6,676,259
Derivative liabilities $ - $ 321,840 $ - $ 321,840Other liabilities - 72 - 72
Total liabilities measured at fair value on a recurring basis $ - $ 321,912 $ - $ 321,912(1) Backed by residential real estate.(2) Largely represents assets for deferred compensation plans.
-44-2010 Bank of the West Annual Report

The table below presents the balances of assets and liabilities measured at fair value on a recurringbasis at December 31, 2009:
(dollars in thousands) Level 1 Level 2 Level 3 Total
Trading assets $ - $ 5,107 $ - $ 5,107Securities available for sale:
U.S. Treasury and other U.S. Government agencies andcorporations - 165,539 - 165,539
Government sponsored agencies - 738,629 - 738,629Mortgage and asset-backed securities:
Government agencies(1) - 44,405 - 44,405Government sponsored agencies(1) - 2,175,550 - 2,175,550Non-government mortgage-backed securities(1) - - 692,906 692,906Collateralized debt obligations - - 79,753 79,753Collateralized loan obligations - - 136,975 136,975Other asset-backed securities - 12,289 5,984 18,273
Collateralized mortgage obligations:Government agencies - 231,699 - 231,699Government sponsored agencies - 423,065 - 423,065Other - 69,239 - 69,239
State and political subdivisions and others - 1,666,952 - 1,666,952Equity securities 240 6,091 - 6,331
Total securities available for sale 240 5,533,458 915,618 6,449,316Derivative assets - 323,043 - 323,043Other assets(2) 13,536 238 3,673 17,447
Total assets measured at fair value on a recurring basis $13,776 $5,861,846 $919,291 $6,794,913
Derivative liabilities $ - $ 276,977 $ - $ 276,977Other liabilities - 76 - 76
Total liabilities measured at fair value on a recurring basis $ - $ 277,053 $ - $ 277,053(1) Backed by residential real estate.(2) Largely represents assets for deferred compensation plans.
For the year ended December 31, 2010, there were no transfers in or out of Levels 1 or 2. Thechanges for 2010 in Level 3 assets measured at fair value on a recurring basis are summarized below.There were no Level 3 liabilities measured at fair value on a recurring basis for the year endedDecember 31, 2010:
(dollars in thousands)Beginning
balance
Total netgains
(losses)included
in netincome(1)
Total net gains(losses)
included inother
comprehensiveincome
Purchases,sales,
issuancesand
settlements,net
Transfersout of
Level 3Endingbalance
Netunrealized
gains(losses)
included innet incomefor the yearrelating to
assetsheld at
year end
Securities available for sale:Non-government mortgage-backed securities(2) $692,906 $(23,246) $149,072 $(818,732) $ - $ - $ -
Collateralized debt obligations 79,753 (7,483) 54,308 (59,586) - 66,992 -Collateralized loan obligations 136,975 (459) 58 (6,668) - 129,906 (459)Other asset-backed securities 5,984 (130) 9,407 (14,398) - 863 -
Total securities available for sale $915,618 $(31,318) $212,845 $(899,384) $ - $197,761 $(459)
Derivative assets $ - $(73,200) $ - $ 223,929 $ - $150,729 $ -Other assets $ 3,673 $ - $ - $ (55) $(3,526)(3) $ 92 $ -(1) Included in noninterest income in the income statement.(2) Backed by residential real estate.(3) Related to the adoption of new accounting guidance for the consolidation of VIEs and transfers of financial assets.
-45-2010 Bank of the West Annual Report

The changes for 2009 in Level 3 assets measured at fair value on a recurring basis are summarizedbelow. There were no Level 3 liabilities measured at fair value on a recurring basis for the year endedDecember 31, 2009:
(dollars in thousands)Beginning
balance
Total netgains
(losses)included in
netincome(1)
Total net gains(losses)
included inother
comprehensiveincome
Purchases,sales,
issuancesand
settlements,net
Transfersout of
Level 3Endingbalance
Netunrealized
gains(losses)
included innet incomefor the yearrelating to
assetsheld at
year end
Securities available for sale:
Mortgage and asset-backed securities:
Government sponsored agencies(2) $ 26 $ - $ 2 $ (2) $(26) $ - $ -
Non-government mortgage-backed securities(2) 1,056,078 (57,919) (102,456) (202,797) - 692,906 (102,527)
Collateralized debt obligations 274,916 (134,975) (33,229) (26,959) - 79,753 -
Collateralized loan obligations 184,341 (18,026) (28,892) (448) - 136,975 (25,134)
Other asset-backed securities 13,544 2,940 (10,032) (468) - 5,984 (6,404)
Total securities available for sale $1,528,905 $(207,980) $(174,607) $(230,674) $(26) $915,618 $(134,065)
Other assets $ 5,022 $ - $ (1,265) $ (84) $ - $ 3,673 $ -(1) Included in noninterest income in the income statement.(2) Backed by residential real estate.
The following table presents gains or losses in level 3 assets from the above tables that werereported in noninterest income for the years ended December 31, 2010 and 2009:
(dollars in thousands) 2010 2009
Total losses included in earnings $(104,518) $(207,980)Change in unrealized gains or losses relating to assets still held at
reporting date $ (459) $(134,065)
We may be required, from time to time, to measure certain other assets at fair value on anonrecurring basis in accordance with GAAP. These adjustments to fair value usually result fromapplication of lower of cost or fair value accounting or write downs of individual financial assets. Thefollowing table provides the level of valuation inputs used to determine each adjustment, the carryingvalue of the related individual assets or portfolios for assets measured at fair value on a nonrecurringbasis, and total losses for the year ended:
(dollars in thousands) Level 1 Level 2 Level 3Total Losses For
Year EndedCarrying Value
December 31, 2010:Impaired loans $- $968,707(1) $- $ -Foreclosed assets $- $195,017 $- $36,770
December 31, 2009:Impaired loans $- $891,284(1) $- $ -Foreclosed assets $- $178,804 $- $17,609
(1) The fair value adjustment is not related to actual losses but is related to the allocation of the allowance in order to adjust thecarrying amount of the loan to the fair value of the collateral.
Fair Value of Financial InstrumentsIn compliance with GAAP, we disclose estimated fair values for certain financial instruments.
Financial instruments include such items as loans, deposits, securities, interest rate and foreign exchangecontracts, swaps and other instruments as defined by the standard.
-46-2010 Bank of the West Annual Report

Disclosure of fair values is not required for certain items such as lease financing, investmentsaccounted for under the equity method of accounting, obligations for pension and other postretirementbenefits, premises and equipment, other real estate owned, prepaid expenses, core deposit intangibles andother customer relationships, other intangible assets and income tax assets and liabilities. Accordingly,the aggregate fair value amounts presented do not purport to represent, and should not be consideredrepresentative of, the underlying “market” or franchise value of the Bank.
Reasonable comparisons of our fair value information to other financial institutions cannotnecessarily be made as the fair value disclosure standard permits many alternative calculation techniqueswhich require numerous assumptions used to estimate fair values.
This table is a summary of financial instruments, requiring fair value of financial instrumentsdisclosure under GAAP, excluding certain short-term financial assets and liabilities, for which carryingamounts approximate fair value, trading assets, which are carried at fair value, securities available forsale (Note 2) and derivative financial instruments (Note 15).
(dollars in thousands) Book Value Fair Value Book Value Fair Value2010 2009
Financial AssetsFederal funds sold and securities
purchased under agreements to resell $ - $ - $ 320,000 $ 320,000Loans held for sale $ 107,440 $ 107,440 $ 51,804 $ 51,804Loans, net(1) $39,458,611 $40,516,706 $40,567,434 $41,239,307
Financial LiabilitiesDeposits $39,547,244 $39,578,059 $40,205,146 $40,397,753Short-term borrowings(2) $ 739,637 $ 739,637 $ 522,586 $ 522,586Long-term debt(3) $ 5,796,001 $ 5,965,192 $ 9,544,305 $ 9,853,629(1) Excludes net leases of $2,490 million and $2,636 million at December 31, 2010 and 2009, respectively.(2) Includes Federal funds purchased and securities sold under agreements to repurchase and short-term borrowings.(3) Excludes capital leases of $16.5 million and $17.4 million at December 31, 2010 and 2009, respectively.
17. Limitations on Payment of Dividends
Regulations limit the amount of dividends the Bank may declare or pay. Due to our net loss in2009, the Bank could not declare or pay cash dividends in 2010 as dividends cannot exceed the pastthree years of net income.
-47-2010 Bank of the West Annual Report
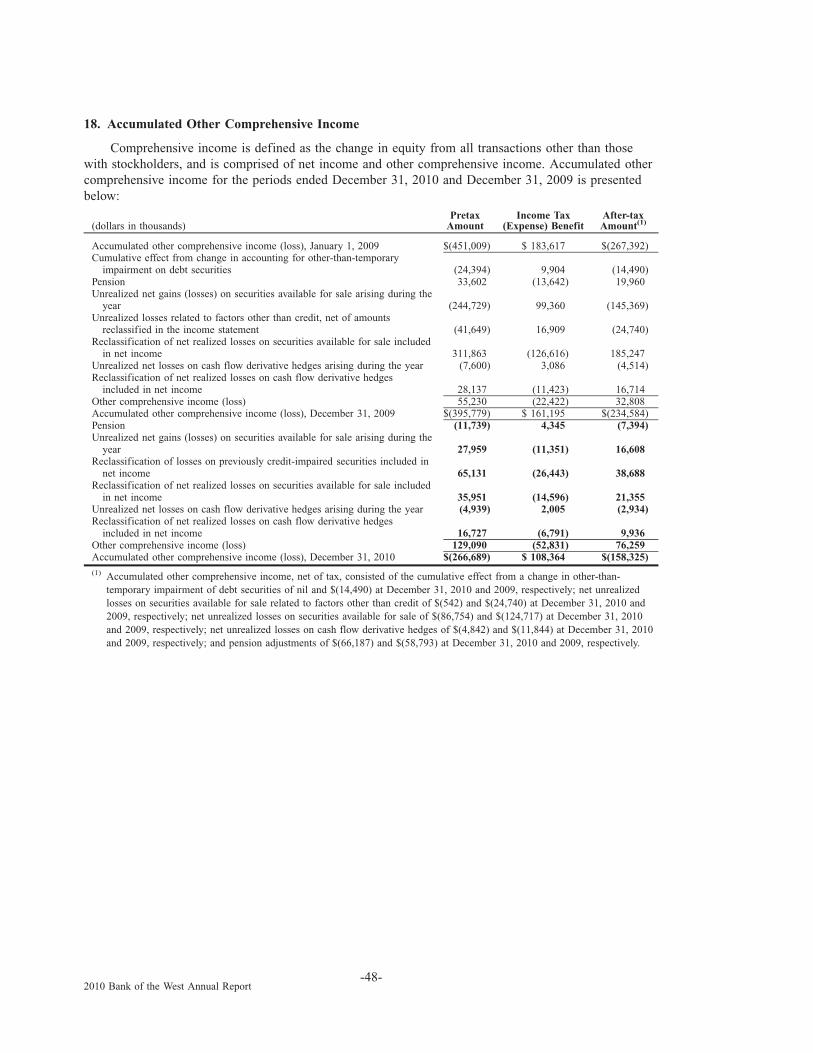
18. Accumulated Other Comprehensive Income
Comprehensive income is defined as the change in equity from all transactions other than thosewith stockholders, and is comprised of net income and other comprehensive income. Accumulated othercomprehensive income for the periods ended December 31, 2010 and December 31, 2009 is presentedbelow:
(dollars in thousands)Pretax
AmountIncome Tax
(Expense) BenefitAfter-taxAmount(1)
Accumulated other comprehensive income (loss), January 1, 2009 $(451,009) $ 183,617 $(267,392)Cumulative effect from change in accounting for other-than-temporary
impairment on debt securities (24,394) 9,904 (14,490)Pension 33,602 (13,642) 19,960Unrealized net gains (losses) on securities available for sale arising during the
year (244,729) 99,360 (145,369)Unrealized losses related to factors other than credit, net of amounts
reclassified in the income statement (41,649) 16,909 (24,740)Reclassification of net realized losses on securities available for sale included
in net income 311,863 (126,616) 185,247Unrealized net losses on cash flow derivative hedges arising during the year (7,600) 3,086 (4,514)Reclassification of net realized losses on cash flow derivative hedges
included in net income 28,137 (11,423) 16,714Other comprehensive income (loss) 55,230 (22,422) 32,808Accumulated other comprehensive income (loss), December 31, 2009 $(395,779) $ 161,195 $(234,584)Pension (11,739) 4,345 (7,394)Unrealized net gains (losses) on securities available for sale arising during the
year 27,959 (11,351) 16,608Reclassification of losses on previously credit-impaired securities included in
net income 65,131 (26,443) 38,688Reclassification of net realized losses on securities available for sale included
in net income 35,951 (14,596) 21,355Unrealized net losses on cash flow derivative hedges arising during the year (4,939) 2,005 (2,934)Reclassification of net realized losses on cash flow derivative hedges
included in net income 16,727 (6,791) 9,936Other comprehensive income (loss) 129,090 (52,831) 76,259Accumulated other comprehensive income (loss), December 31, 2010 $(266,689) $ 108,364 $(158,325)(1) Accumulated other comprehensive income, net of tax, consisted of the cumulative effect from a change in other-than-
temporary impairment of debt securities of nil and $(14,490) at December 31, 2010 and 2009, respectively; net unrealizedlosses on securities available for sale related to factors other than credit of $(542) and $(24,740) at December 31, 2010 and2009, respectively; net unrealized losses on securities available for sale of $(86,754) and $(124,717) at December 31, 2010and 2009, respectively; net unrealized losses on cash flow derivative hedges of $(4,842) and $(11,844) at December 31, 2010and 2009, respectively; and pension adjustments of $(66,187) and $(58,793) at December 31, 2010 and 2009, respectively.
-48-2010 Bank of the West Annual Report

19. Benefit Plans
The Bank has the following pension and other postretirement benefit plans:
Pension Benefits:
Funded Pension PlansThe Bank had previously offered the Employees’ Retirement Plan (“ERP”) of BancWest
Corporation to its employees, which is a noncontributory defined benefit pension plan. The ERP wascreated from the merger of two separate plans: the First Hawaiian Bank Employee Plan and the Bank ofthe West Employee Plan. The Bank of the West Employee Plan was a cash balance pension plan thatwas frozen on January 1, 2010. At the freeze date, the plan stopped accruing benefits and was closed tonew participants. However, existing participants of the plan continue to earn interest until distributionsare made in accordance with the plan requirements. The Bank did not incur an immediate gain or lossassociated with the closing of the plan; however, as the plan’s participant base shrinks as a result ofterminations, retirement and mortality without replacement by new participants, the overall cost of theplan is expected to decline.
Additionally, in connection with the acquisition of United California Bank (“UCB”) in 2002, theBank assumed the pension obligations of UCB. UCB employees participated in a funded noncontributoryfinal average pay defined benefit pension plan (“UCBP”) that was frozen on June 30, 2003 to newparticipants and benefit accruals. On July 1, 2003, the Bank integrated employees under the UCBP intothe Bank’s existing ERP plan.
Unfunded Pension PlansThe Bank also sponsored an unfunded excess benefit pension plan covering employees whose pay
or benefits exceed certain regulatory limits and, for certain key executives, an unfunded supplementalexecutive retirement plan (“SERP”). The unfunded excess plan was frozen at January 1, 2010 to newparticipants and benefit accruals. The SERP was frozen in 2002 to new participants; however benefitscontinue to accrue for existing plan participants. The Bank did not incur an immediate gain or lossassociated with the closing of the plan; however, as the plan’s participant base shrinks as a result ofterminations, retirement and mortality without replacement by new participants, the overall cost of theplan is expected to decline.
Additionally, in connection with the acquisition of UCB in 2002, the Bank assumed the pensionobligations of UCB’s unfunded supplemental pension benefit plan (“UCB SEP”) which was available toeligible key executives if certain requirements were met. The UCB SEP was frozen on June 30, 2003 tonew participants and benefit accruals. On July 1, 2003, the Bank integrated employees under the UCBSEP into the Bank of the West Excess Benefit Plan.
Other Postretirement Benefits:
Postretirement Medical and Life Insurance PlanThe Bank offers an unfunded postretirement medical and life insurance plan. The benefits include
access to medical benefits and the payment of premiums for medical and life insurance benefits.
Executive Life Insurance PlanThe Bank also offered pre-and postretirement life insurance benefits for certain executives under
the unfunded Executive Life Insurance Plan (the “ELIP”). Under the ELIP, death benefits are paid to anemployee’s beneficiary while the plan participants are actively employed. On the policy distribution dateas defined by the plan, the Bank will transfer, to the participants, ownership of a company-owned lifeinsurance policy with sufficient cash value to provide a fully-paid postretirement benefit based onactuarial assumptions. The accumulated benefit obligation and expense amounts for the ELIP Plan areincluded in Other Benefits in the tables that follow.
-49-2010 Bank of the West Annual Report
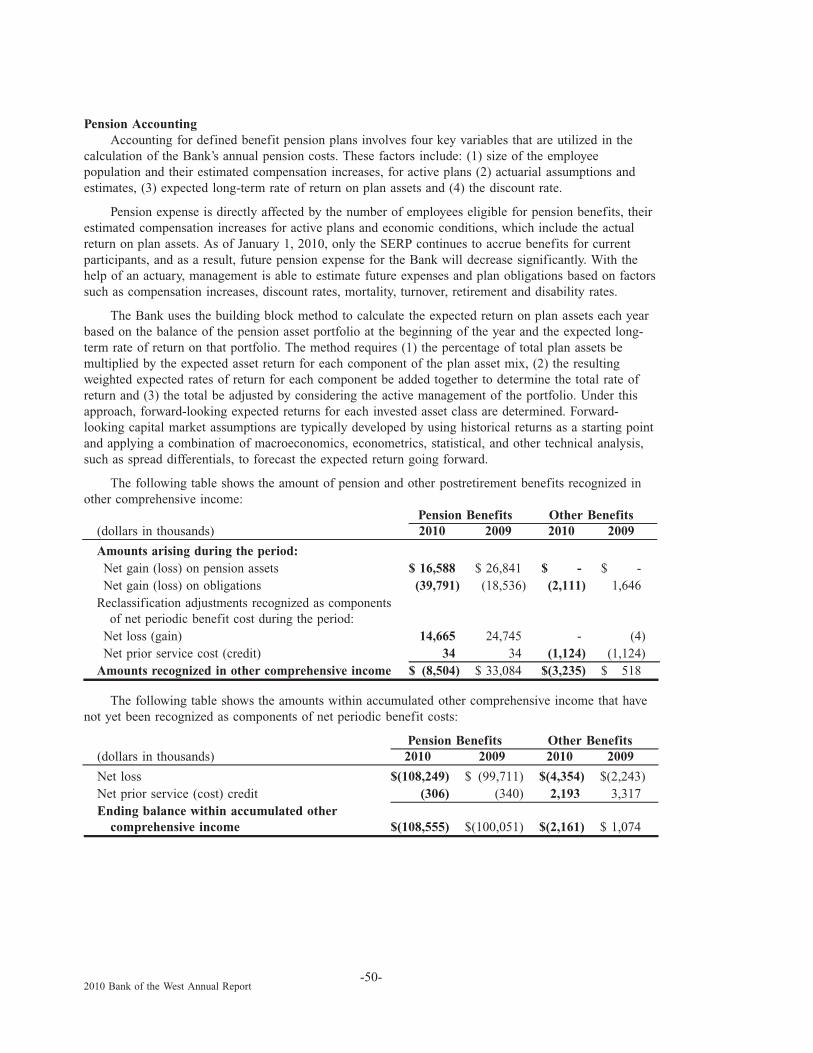
Pension AccountingAccounting for defined benefit pension plans involves four key variables that are utilized in the
calculation of the Bank’s annual pension costs. These factors include: (1) size of the employeepopulation and their estimated compensation increases, for active plans (2) actuarial assumptions andestimates, (3) expected long-term rate of return on plan assets and (4) the discount rate.
Pension expense is directly affected by the number of employees eligible for pension benefits, theirestimated compensation increases for active plans and economic conditions, which include the actualreturn on plan assets. As of January 1, 2010, only the SERP continues to accrue benefits for currentparticipants, and as a result, future pension expense for the Bank will decrease significantly. With thehelp of an actuary, management is able to estimate future expenses and plan obligations based on factorssuch as compensation increases, discount rates, mortality, turnover, retirement and disability rates.
The Bank uses the building block method to calculate the expected return on plan assets each yearbased on the balance of the pension asset portfolio at the beginning of the year and the expected long-term rate of return on that portfolio. The method requires (1) the percentage of total plan assets bemultiplied by the expected asset return for each component of the plan asset mix, (2) the resultingweighted expected rates of return for each component be added together to determine the total rate ofreturn and (3) the total be adjusted by considering the active management of the portfolio. Under thisapproach, forward-looking expected returns for each invested asset class are determined. Forward-looking capital market assumptions are typically developed by using historical returns as a starting pointand applying a combination of macroeconomics, econometrics, statistical, and other technical analysis,such as spread differentials, to forecast the expected return going forward.
The following table shows the amount of pension and other postretirement benefits recognized inother comprehensive income:
(dollars in thousands) 2010 2009 2010 2009Pension Benefits Other Benefits
Amounts arising during the period:Net gain (loss) on pension assets $ 16,588 $ 26,841 $ - $ -Net gain (loss) on obligations (39,791) (18,536) (2,111) 1,646
Reclassification adjustments recognized as componentsof net periodic benefit cost during the period:
Net loss (gain) 14,665 24,745 - (4)Net prior service cost (credit) 34 34 (1,124) (1,124)
Amounts recognized in other comprehensive income $ (8,504) $ 33,084 $(3,235) $ 518
The following table shows the amounts within accumulated other comprehensive income that havenot yet been recognized as components of net periodic benefit costs:
(dollars in thousands) 2010 2009 2010 2009Pension Benefits Other Benefits
Net loss $(108,249) $ (99,711) $(4,354) $(2,243)Net prior service (cost) credit (306) (340) 2,193 3,317Ending balance within accumulated other
comprehensive income $(108,555) $(100,051) $(2,161) $ 1,074
-50-2010 Bank of the West Annual Report
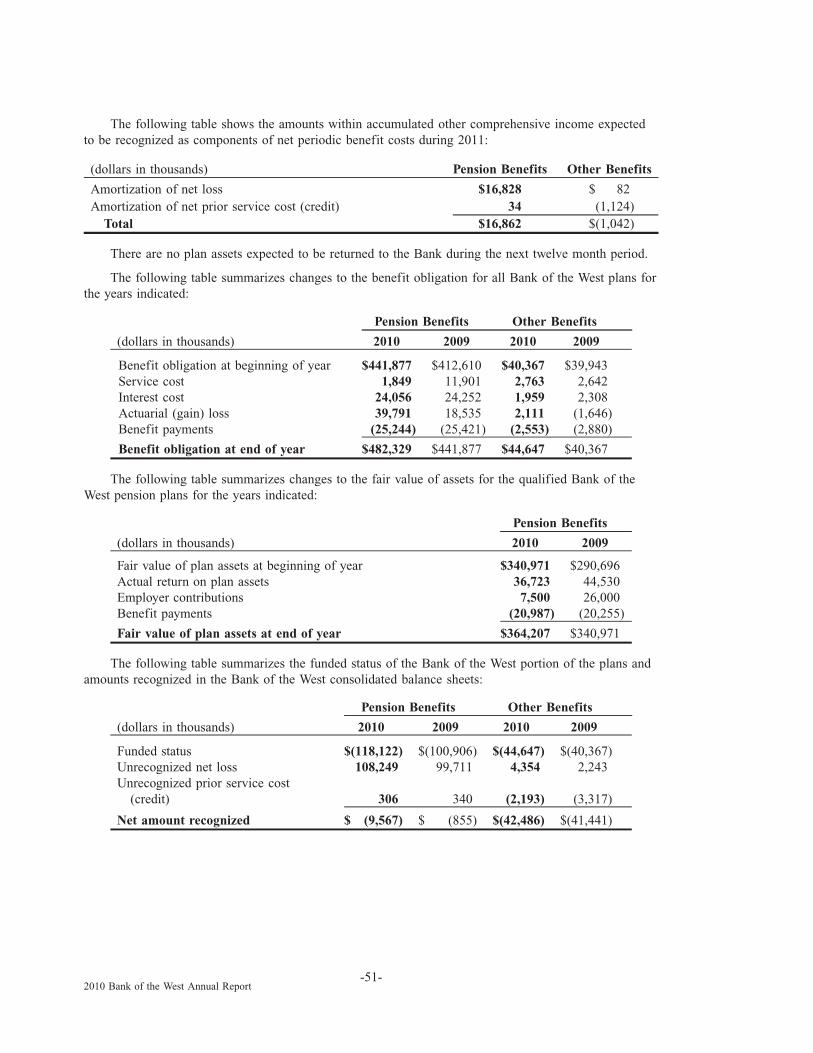
The following table shows the amounts within accumulated other comprehensive income expectedto be recognized as components of net periodic benefit costs during 2011:
(dollars in thousands) Pension Benefits Other Benefits
Amortization of net loss $16,828 $ 82Amortization of net prior service cost (credit) 34 (1,124)
Total $16,862 $(1,042)
There are no plan assets expected to be returned to the Bank during the next twelve month period.
The following table summarizes changes to the benefit obligation for all Bank of the West plans forthe years indicated:
(dollars in thousands) 2010 2009 2010 2009
Pension Benefits Other Benefits
Benefit obligation at beginning of year $441,877 $412,610 $40,367 $39,943Service cost 1,849 11,901 2,763 2,642Interest cost 24,056 24,252 1,959 2,308Actuarial (gain) loss 39,791 18,535 2,111 (1,646)Benefit payments (25,244) (25,421) (2,553) (2,880)
Benefit obligation at end of year $482,329 $441,877 $44,647 $40,367
The following table summarizes changes to the fair value of assets for the qualified Bank of theWest pension plans for the years indicated:
(dollars in thousands) 2010 2009
Pension Benefits
Fair value of plan assets at beginning of year $340,971 $290,696Actual return on plan assets 36,723 44,530Employer contributions 7,500 26,000Benefit payments (20,987) (20,255)
Fair value of plan assets at end of year $364,207 $340,971
The following table summarizes the funded status of the Bank of the West portion of the plans andamounts recognized in the Bank of the West consolidated balance sheets:
(dollars in thousands) 2010 2009 2010 2009
Pension Benefits Other Benefits
Funded status $(118,122) $(100,906) $(44,647) $(40,367)Unrecognized net loss 108,249 99,711 4,354 2,243Unrecognized prior service cost
(credit) 306 340 (2,193) (3,317)
Net amount recognized $ (9,567) $ (855) $(42,486) $(41,441)
-51-2010 Bank of the West Annual Report

Amounts recognized in the Bank of the West’s statement of financial position consist of:
(dollars in thousands) 2010 2009 2010 2009
Pension Benefits Other Benefits
Accrued benefit liability $(118,122) $(100,906) $(44,647) $(40,367)Accumulated other comprehensive loss (income) 108,555 100,051 2,161 (1,074)Net amount recognized $ (9,567) $ (855) $(42,486) $(41,441)
Amortization of the unrecognized net gain or loss is included as a component of net pension cost. Ifamortization results in an amount less than the minimum amortization required under GAAP, theminimum required amount is recorded. The minimum amount recorded under GAAP representsunrecognized net gains or losses that exceed 5% of the greater of the projected benefit obligation or themarket-related value of plan assets as of the beginning of the year. The unrecognized amounts areamortized on a straight-line basis over the lesser of five years or the average remaining service period ofactive employees expected to receive benefits under the plan.
The accumulated benefit obligation for the Bank’s defined benefit pension plans was $478.9 millionand $440.3 million at December 31, 2010 and 2009, respectively.
The following table summarizes key provisions for the Bank’s funded pension plans as ofDecember 31:
(dollars in thousands) 2010 2009
Projected benefit obligation $404,626 $375,477
Accumulated benefit obligation $404,626 $375,477
Each of our pension plans had an accrued benefit liability at December 31, 2010 and 2009. Theprojected benefit obligations for the unfunded plans were $77.7 million and $66.8 million atDecember 31, 2010 and 2009, respectively. The accumulated benefit obligation for the unfunded planswas $74.3 million and $64.8 million at December 31, 2010 and 2009, respectively.
The following table sets forth the components of the net periodic benefit cost (credit) for Bank ofthe West at December 31:
(dollars in thousands) 2010 2009 2010 2009
Pension Benefits Other Benefits
Service cost $ 1,849 $ 11,901 $ 2,763 $ 2,642
Interest cost 24,056 24,252 1,959 2,308
Expected return on plan assets (21,605) (17,689) - -
Amortization of prior service cost 34 34 (1,124) (1,124)
Recognized net actuarial loss (gain) 14,665 24,745 - (4)
Total benefit cost $ 18,999 $ 43,243 $ 3,598 $ 3,822
-52-2010 Bank of the West Annual Report

The following table sets forth the components of the net periodic benefit cost (credit) for Bank ofthe West’s portion of the funded plans at December 31:
(dollars in thousands) 2010 2009
Funded PensionBenefits
Service cost $ - $ 11,599
Interest cost 20,743 20,501
Expected return on plan assets (21,605) (17,689)
Recognized net actuarial loss 10,931 20,739
Net periodic benefit cost $ 10,069 $ 35,150
AssumptionsWeighted-average assumptions used to determine benefit obligations were as follows at
December 31:
2010 2009 2010 2009 2010 2009
ERP PensionBenefits
SERP PensionBenefits
OtherBenefits(1)
Discount rate 5.25% 5.75% 5.25% 5.75% 6.00% 6.00%
Rate of compensation increase NA 4.00% 4.00% 4.00% 5.00% 5.00%(1) Includes the postretirement medical and life insurance plan, which used a discount rate of 5.25% and 5.75% in 2010 and
2009, respectively. The rate of compensation increase is not applicable to the postretirement medical and life insuranceplan.
Weighted-average assumptions used to determine net periodic benefit cost for the years endedDecember 31:
2010 2009 2010 2009 2010 2009
ERP PensionBenefits
SERP PensionBenefits
OtherBenefits(1)
Discount rate 5.75% 6.00% 5.75% 6.00% 6.00% 6.00%
Expected long-term return on planassets 6.00% 6.00% NA NA NA NA
Rate of compensation increase NA 4.00% 4.00% 4.00% 5.00% 5.00%(1) Includes the postretirement medical and life insurance plan, which used a discount rate of 5.75% and 6.00% in 2010 and
2009, respectively. The rate of compensation increase is not applicable to the postretirement medical and life insuranceplan.
The assumed discount rate reflects management’s estimate of the rate at which the benefits could beeffectively settled. In selecting the discount rate, the Bank reviews the yield on high quality corporatebonds, such as the Citigroup Pension Discount Curve. This rate is adjusted for converting the yield to anannual discount rate basis and may be adjusted for the population of plan participants to reflect theexpected duration of the benefit payments of the plan. The resulting selected rate is rounded to thenearest 25 basis points.
Assumed health care cost trend rates at December 31, were as follows:
2010 2009
Health care cost trend rate assumed for next year 8.0% 8.5%
Rate to which the cost trend rate is assumed to decline (the ultimate trendrate) 5.0% 5.0%
Year that the rate reaches the ultimate trend rate 2017 2017
-53-2010 Bank of the West Annual Report

Assumed health care cost trend rates have an impact on the amounts reported for the health careplans. A one-percentage-point change in the assumed health care cost trend rates would have thefollowing pretax effect:
(dollars in thousands)One-Percentage-Point Increase
One-Percentage-Point Decrease
Effect on 2010 total of service and interest cost components $ 49 $ (44)
Effect on postretirement benefit obligation at December 31,2010 $1,210 $(865)
Plan AssetsThe assets within the Bank of the West Employees’ Retirement Plan and the UCB Retirement Plan
(“the Plans”) are managed in accordance with the Employee Retirement Income Security Act of 1974(“ERISA”). The Plans’ assets consist mainly of fixed income and equity securities of U.S. and foreignissuers and may include alternative investments such as real estate, private equity and other absolutereturn strategies.
Investment Strategy and Risk Management for the Plans AssetsThe long-term investment objective of the ERP and UCB plans is to earn an investment return
which meets or exceeds the following benchmarks over the long term:
• The target rate of return should meet or exceed the current actuarial investment return assumptionas reflected in the funding valuation rate.
• The target rate of return should meet or exceed a compounded annual long-term rate of returnequal to or greater than the Plans’ custom benchmark return.
The Plans’ assets are managed in accordance with the Retirement Committee’s guidelines. Theassets are managed in accordance with ERISA’s requirements and are invested in a manner that isconsistent with generally accepted standards of fiduciary responsibility as we follow all laws andregulations specific to the investment of assets, including the Uniform Prudent Investors Act. Alltransactions that utilize assets of the Trust will be undertaken for the sole benefit of the participants ofthe Plans.
The assets selected for the Plans may consist of individual security issues managed by theinvestment manager(s) or securities held in a well-diversified portfolio of a registered investmentcompany or an exchange-traded fund. In addition, for the UCB plan, the assets selected for the planmust have readily ascertainable market value and must be marketable. The assets under this plan mayalso consist of a publicly traded mutual fund.
Investment managers may be permitted to use derivative instruments to control portfolio risk.Derivatives are contracts or securities whose returns are derived from the returns of other securities,indices or instruments including, but not limited to futures, forwards, options, options on futures andprivate swaps. Examples of appropriate applications of derivative strategies include hedging interest rateand currency risk, maintaining exposure to a desired asset class while effecting asset allocation changesand adjusting portfolio durations for fixed income. Derivatives are not to be utilized for leverage orspeculative purposes.
The equity portion and debt portion of the Plans’ assets may employ commingled assets or beindividually invested expressly including the use of money market funds managed by a corporate trusteeor by others.
Sufficient liquidity shall be maintained in amounts to be determined by the Bank to meet the needsof the Plans, including periodic distributions.
-54-2010 Bank of the West Annual Report

The Committee recognizes that capital markets can be unpredictable and that any investment couldresult in periods where the market value of the Plans’ assets will decline in value. In its desire to protectPlans’ assets, the Committee imposes general guidelines on asset allocation. Asset allocations are basedon the Committee’s appraisal of current and long-term needs for liquidity and income of the Plans andits estimate of the investment returns from the various classes and types of investments. The assetallocations are likely to be the primary determinant of the Plans’ returns and the associated volatility ofreturns for the Plans.
The target asset allocations for the two plans for December 31, 2010 are as follows:
2010 2009 2010 2009
Bank of theWest Plan UCB Plan
Equity 45% 45% 45% 45%
Fixed Income 50 50 50 50
Other 5 5 5 5
Total 100% 100% 100% 100%
Concentration of RiskThe Bank describes “risk” as the possibility of not achieving the Plans’ actuarial rates of return.
Risks associated with the Plans’ investments include systematic and nonsystematic risk, interest rate,yield curve, reinvestment and credit risk and the combination of these risks. The Bank mitigates thecredit risk of investments by establishing guidelines with the investment managers. Both the Bank andexternal managers monitor the diversity of the plans to ensure that they meet ERISA requirements.Equity securities in the Plans did not include BancWest or BNP Paribas stock at December 31, 2010 and2009.
The tables below summarize the Bank’s ERP pension plan assets and valuation methodologies usingthe fair value hierarchy, by investment category at December 31, 2010 and 2009:
(dollars in thousands) Fair Value Level 1 Level 2 Level 32010
Asset CategoryCash and equivalents(1) $ 575 $ 575 $- $ -Fixed income:
U.S. corporate securities(2) 2,872 2,872 - -Mutual funds core bond fund(3) 27,292 27,292 - -Exchange traded funds(4) 3,663 3,663 - -Insurance products contracts and annuities(5) 10,005 - - 10,005
Equity mutual funds(6):Large cap growth fund 14,883 14,883 - -Large cap value fund 18,241 18,241 - -International equity fund 7,909 7,909 - -
Equity exchange traded funds(7):Mid cap ETF 6,365 6,365 - -Small cap ETF 4,374 4,374 - -
Total ERP plan assets $96,179 $86,174 $- $10,005
-55-2010 Bank of the West Annual Report
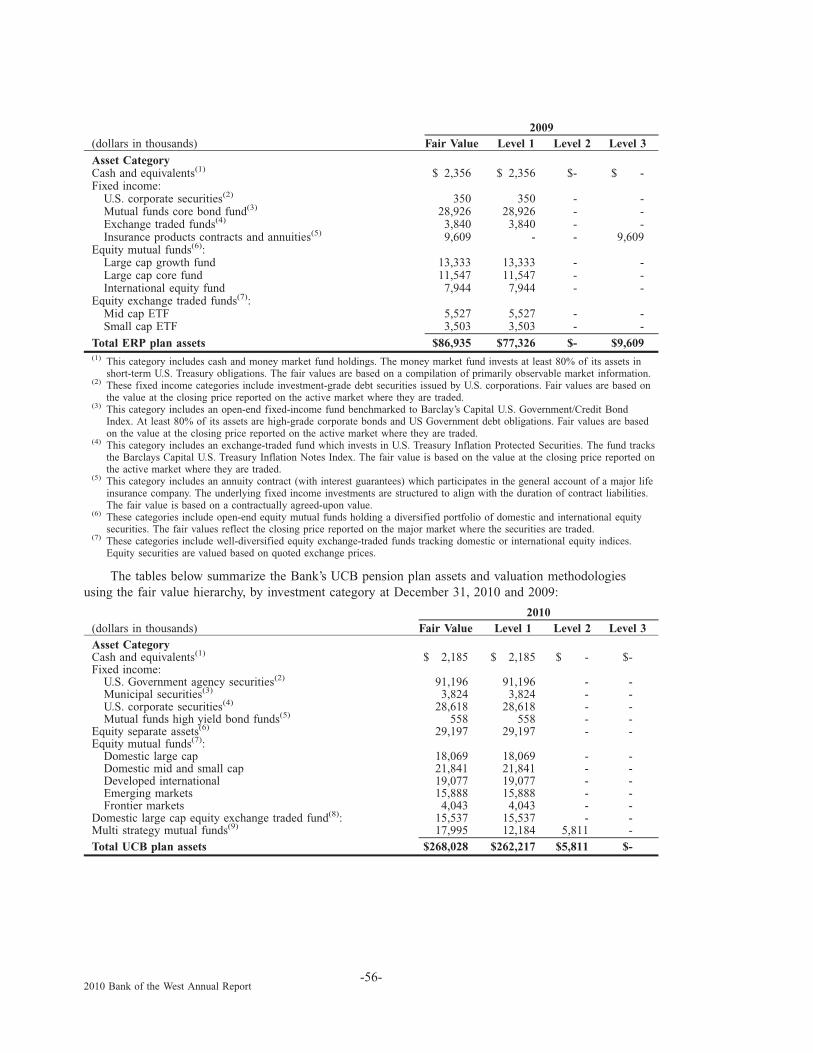
(dollars in thousands) Fair Value Level 1 Level 2 Level 32009
Asset CategoryCash and equivalents(1) $ 2,356 $ 2,356 $- $ -Fixed income:
U.S. corporate securities(2) 350 350 - -Mutual funds core bond fund(3) 28,926 28,926 - -Exchange traded funds(4) 3,840 3,840 - -Insurance products contracts and annuities(5) 9,609 - - 9,609
Equity mutual funds(6):Large cap growth fund 13,333 13,333 - -Large cap core fund 11,547 11,547 - -International equity fund 7,944 7,944 - -
Equity exchange traded funds(7):Mid cap ETF 5,527 5,527 - -Small cap ETF 3,503 3,503 - -
Total ERP plan assets $86,935 $77,326 $- $9,609(1) This category includes cash and money market fund holdings. The money market fund invests at least 80% of its assets in
short-term U.S. Treasury obligations. The fair values are based on a compilation of primarily observable market information.(2) These fixed income categories include investment-grade debt securities issued by U.S. corporations. Fair values are based on
the value at the closing price reported on the active market where they are traded.(3) This category includes an open-end fixed-income fund benchmarked to Barclay’s Capital U.S. Government/Credit Bond
Index. At least 80% of its assets are high-grade corporate bonds and US Government debt obligations. Fair values are basedon the value at the closing price reported on the active market where they are traded.
(4) This category includes an exchange-traded fund which invests in U.S. Treasury Inflation Protected Securities. The fund tracksthe Barclays Capital U.S. Treasury Inflation Notes Index. The fair value is based on the value at the closing price reported onthe active market where they are traded.
(5) This category includes an annuity contract (with interest guarantees) which participates in the general account of a major lifeinsurance company. The underlying fixed income investments are structured to align with the duration of contract liabilities.The fair value is based on a contractually agreed-upon value.
(6) These categories include open-end equity mutual funds holding a diversified portfolio of domestic and international equitysecurities. The fair values reflect the closing price reported on the major market where the securities are traded.
(7) These categories include well-diversified equity exchange-traded funds tracking domestic or international equity indices.Equity securities are valued based on quoted exchange prices.
The tables below summarize the Bank’s UCB pension plan assets and valuation methodologiesusing the fair value hierarchy, by investment category at December 31, 2010 and 2009:
(dollars in thousands) Fair Value Level 1 Level 2 Level 32010
Asset CategoryCash and equivalents(1) $ 2,185 $ 2,185 $ - $-Fixed income:
U.S. Government agency securities(2) 91,196 91,196 - -Municipal securities(3) 3,824 3,824 - -U.S. corporate securities(4) 28,618 28,618 - -Mutual funds high yield bond funds(5) 558 558 - -
Equity separate assets(6) 29,197 29,197 - -Equity mutual funds(7):
Domestic large cap 18,069 18,069 - -Domestic mid and small cap 21,841 21,841 - -Developed international 19,077 19,077 - -Emerging markets 15,888 15,888 - -Frontier markets 4,043 4,043 - -
Domestic large cap equity exchange traded fund(8): 15,537 15,537 - -Multi strategy mutual funds(9) 17,995 12,184 5,811 -Total UCB plan assets $268,028 $262,217 $5,811 $-
-56-2010 Bank of the West Annual Report

(dollars in thousands) Fair Value Level 1 Level 2 Level 32009
Asset CategoryCash and equivalents(1) $ 3,006 $ 3,006 $ - $-Fixed income:
U.S. Government agency securities(2) 77,134 77,134 - -Municipal individual securities(3) 2,880 2,880 - -U.S. corporate securities(4) 42,013 42,013 - -Corporate mortgage-backed securities(4) 2,515 2,515 - -Mutual funds high yield bond funds(5) 49 49 - -
Equity separate assets(6) 26,451 26,451 - -Equity mutual funds(7):
Domestic large cap 16,095 16,095 - -Domestic mid and small cap 21,464 21,464 - -Developed international 19,850 19,850 - -Emerging markets 6,524 6,524 - -Frontier markets 2,432 2,432 - -
Domestic large cap equity exchange traded fund(8) 15,934 15,934 - -Multi strategy mutual funds(9) 17,689 12,401 5,288 -Total UCB plan assets $254,036 $248,748 $5,288 $-(1) This category includes cash and money market fund holdings. The money market fund invests at least 80% of its assets in
short-term U.S. Treasury obligations. The fair values are based on a compilation of primarily observable market information.(2) These fixed income categories include obligations issued and guaranteed by the U.S. Treasury. Duration is intermediate and
usually benchmarked to the Barclays Capital U.S. Aggregate Index. The fair values are based on a compilation of primarilyobservable market information.
(3) These are individual debt securities issued by a state, municipality or county to primarily finance capital expenditures.Duration is intermediate to long-term and benchmarked to the Lipper General Municipal Index. The fair values are primarilybased on observable market information.
(4) This category includes debt securities or bonds issued by corporations and backed by the earnings or assets of thecorporation. Duration is generally intermediate and usually benchmarked to the Barclays Capital U.S. Aggregate Index. Thefair values are based on a compilation of primarily observable market information.
(5) This category includes SEC registered mutual funds exclusively investing in high-yield debt securities. Duration is short tointermediate and usually benchmarked to CSFB Credit Suisse High Yield Index. Mutual funds are valued at the closing pricereported on the active market.
(6) Individual equities held in the form of common stock of companies in the Standard and Poor’s 500 Index. This asset class isusually benchmarked to the Standard and Poor’s 500 Index. Equity securities are valued based on the exchange prices in theirprimary market.
(7) These categories include SEC compliant registered mutual funds investing mostly in common stock securities. Underlyingfunds are focused on their respective asset classes including Domestic Large Cap, Domestic Mid/Small Cap, DevelopedInternational, Emerging Markets, and Frontier Markets asset classes. Equity mutual funds are valued at the closing pricereported on the active market.
(8) These funds invest in individual equity securities with the goal of replicating an underlying asset class index, in this case,large cap equity securities. Equity securities are valued based on quoted exchange prices in their primary market.
(9) Includes SEC registered mutual funds investing in multiple asset strategies. Most of these equity mutual funds are valued atthe closing price reported on the active market.
The changes in our Level 3 pension plan assets for the year ended December 31, 2010, were asfollows:
(dollars in thousands) Contracts/Annuities
Beginning balance at December 31, 2009 $ 9,609
Actual return on plan assets 504
Settlements (1,786)
Purchases 1,747
Service fees (69)
Ending balance at December 31, 2010 $10,005
ContributionsBank of the West expects to contribute $5.1 million to its non-qualified defined benefit pension
plans and $4.1 million to its other postretirement benefit plans in 2011. These contributions are the
-57-2010 Bank of the West Annual Report

estimated benefit payments for the unfunded plans and may vary depending on retirements during 2011.Based on the funding requirements of the Pension Protection Act of 2006, Bank of the West anticipatesmaking a contribution of approximately $20.0 million to the ERP during 2011.
Estimated Future Benefit PaymentsThe following table presents the expected benefit payments, for the periods indicated:
(dollars in thousands)PensionBenefits
OtherBenefits
2011 $ 24,323 $ 4,1372012 $ 25,461 $ 4,7142013 $ 26,162 $ 2,7512014 $ 27,233 $ 6,0562015 $ 27,997 $ 2,8352016 - 2020 $161,562 $20,733
401(k) Match PlanThe Bank matched employee contributions up to 3% of pay to the BancWest Corporation 401(k)
Savings Plan, a defined contribution plan, up until December 31, 2009. On January 1, 2010 the Bankbegan matching employee contributions up to 6% of pay. The plan covers all employees who satisfyeligibility requirements. Matching employer contributions to the 401(k) plan for 2010 and 2009 were$21.1 million and $10.7 million, respectively.
Incentive Plan for Key Executives and Officer’s Incentive PlanThe Bank has an Incentive Plan for Key Executives (the “IPKE”), under which awards of cash are
made to key executives. The IPKE limits the aggregate and individual value of the awards that could beissued in any one fiscal year. In 2007, the bank created a separate plan for those employees below thelevel of key executives, the Officer’s Incentive Plan (“OIP”). The OIP has the same limits on individualawards as the IPKE plan. Salary and employee benefits expense includes IPKE and OIP expense of$29.7 million and $8.1 million for 2010 and 2009, respectively.
Long-Term Incentive PlansIn 2006, the Bank created an incentive plan, The Phantom Stock Plan (“PSP”), that is designed to
reward certain employees for their performance and BancWest’s performance over a multi-yearperformance cycle. For the years ended December 31, 2010 and 2009, related salary and employeebenefits expense for the Bank was $1.0 million and nil, respectively. In 2008, the Bank created aPerformance Share Plan to replace the BWE PSP on a go-forward basis with employee benefit expensefor the Bank at $3.1 million and nil for 2010 and 2009, respectively. During 2010, the 2006 plan vestedwith a total payout value of $6.3 million.
In 2008, the Bank created a new Long Term Incentive Plan (“LTIP”) to replace the BancWest LTIPon a go-forward basis. The plan rewards selected key executives for the Bank of the West performanceassessed over a three year performance cycle on a relative and absolute basis. The first payments underthis plan will not be until the end of the performance cycle. Salary and employee benefits expense forthe Bank includes LTIP expense of $4.7 million and $1.2 million for 2010 and 2009, respectively.
-58-2010 Bank of the West Annual Report
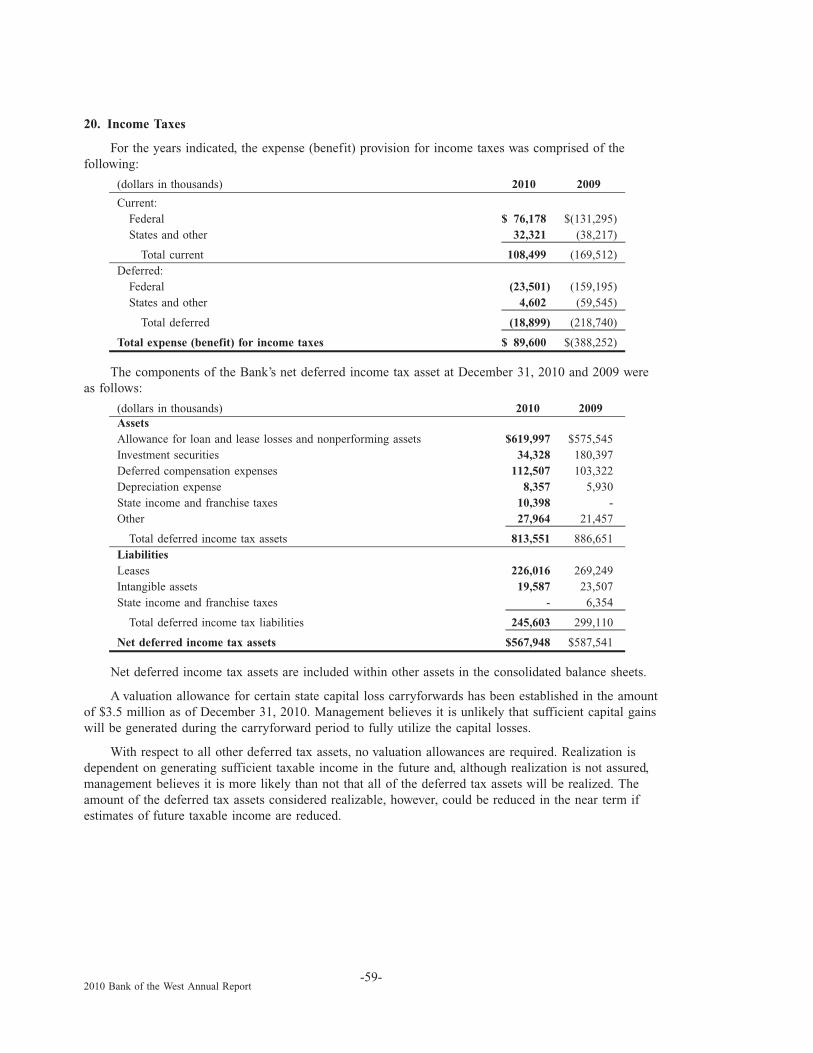
20. Income Taxes
For the years indicated, the expense (benefit) provision for income taxes was comprised of thefollowing:
(dollars in thousands) 2010 2009
Current:Federal $ 76,178 $(131,295)States and other 32,321 (38,217)
Total current 108,499 (169,512)Deferred:
Federal (23,501) (159,195)States and other 4,602 (59,545)
Total deferred (18,899) (218,740)
Total expense (benefit) for income taxes $ 89,600 $(388,252)
The components of the Bank’s net deferred income tax asset at December 31, 2010 and 2009 wereas follows:
(dollars in thousands) 2010 2009AssetsAllowance for loan and lease losses and nonperforming assets $619,997 $575,545Investment securities 34,328 180,397Deferred compensation expenses 112,507 103,322Depreciation expense 8,357 5,930State income and franchise taxes 10,398 -Other 27,964 21,457
Total deferred income tax assets 813,551 886,651LiabilitiesLeases 226,016 269,249Intangible assets 19,587 23,507State income and franchise taxes - 6,354
Total deferred income tax liabilities 245,603 299,110
Net deferred income tax assets $567,948 $587,541
Net deferred income tax assets are included within other assets in the consolidated balance sheets.
A valuation allowance for certain state capital loss carryforwards has been established in the amountof $3.5 million as of December 31, 2010. Management believes it is unlikely that sufficient capital gainswill be generated during the carryforward period to fully utilize the capital losses.
With respect to all other deferred tax assets, no valuation allowances are required. Realization isdependent on generating sufficient taxable income in the future and, although realization is not assured,management believes it is more likely than not that all of the deferred tax assets will be realized. Theamount of the deferred tax assets considered realizable, however, could be reduced in the near term ifestimates of future taxable income are reduced.
-59-2010 Bank of the West Annual Report

The following analysis reconciles the Federal statutory income tax rate to the effective income taxrate for the years indicated:
(dollars in thousands) Amount % Amount %2010 2009
Federal statutory income tax expense (benefit) and rate $ 96,229 35.0% $(276,984) (35.0)%Foreign, state and local taxes expense (benefit), net of
Federal effect 26,021 9.5 (61,135) (7.7)Bank-owned life insurance (8,571) (3.1) (9,570) (1.2)Non-taxable income, net (21,188) (7.7) (24,572) (3.1)Tax credits (5,599) (2.1) (5,145) (0.7)Other 2,708 1.0 (10,846) (1.4)
Effective income tax expense (benefit) and rate $ 89,600 32.6% $(388,252) (49.1)%
The Bank and its subsidiaries file income tax returns with the Federal government and various stateand local jurisdictions. The Internal Revenue Service (“IRS”) is in the process of examining the Bank’sincome tax returns for 2003 through 2005. Subsequent to December 31, 2010, the IRS issued a RevenueAgent’s Report and 30-Day Letter for tax years 2003-2005 and the IRS proposed no significantadjustments with respect to the Bank or its acquired entities. With few exceptions, the Bank and itsacquired entities are no longer subject to state and local income tax examinations for years prior to 2003and are no longer subject to Federal income tax examinations for years prior to 2003. As ofDecember 31, 2010 the state tax jurisdictions have not proposed any significant adjustments. The Bankbelieves that there are no other jurisdictions in which the outcome of unresolved issues or claims islikely to be material to our results of operations, financial position or cash flows. The Bank furtherbelieves that it has made adequate provision for all income tax uncertainties.
A reconciliation of the beginning and ending amounts of unrecognized tax benefits is as follows:
(dollars in thousands) 2010 2009Balance at January 1, $21,518 $30,467Additions based on tax positions related to the current year 2,475 507Additions for tax positions of prior years - 457Reductions for tax positions of prior years (1,574) -Reductions relating to settlements with tax authorities - (5,096)Reductions as a result of a lapse of the applicable statute of limitations (3,995) (4,817)
Balance at December 31, $18,424 $21,518
Included in the balance of unrecognized tax benefits are $12.6 million and $15.6 million of taxbenefits as of December 31, 2010 and 2009, respectively which, if recognized, will affect the effectivetax rate.
During the year ended December 31, 2010, the Bank recognized approximately $1.4 million($0.8 million, net of Federal and state tax benefit) in interest and no penalties. The unrecognized taxbenefit balances do not include $3.7 million and $4.0 million of the net accruals for the payment ofinterest and penalties for the years ended December 31, 2010 and 2009, respectively.
It is reasonably possible that the total amounts of unrecognized tax benefits will decrease withintwelve months of the reporting date with respect to certain state tax liabilities of acquired companies thatthe Bank expects to be finalized with the tax jurisdictions.
-60-2010 Bank of the West Annual Report

21. Transactions with Affiliates
The Bank participates in various transactions with its affiliates, including BancWest, First HawaiianBank, BNP Paribas and its affiliates.
These transactions are subject to review by the FDIC and other regulatory authorities. Thetransactions are required to be on terms at least as favorable to the Bank as those prevailing at the timefor similar non-affiliate transactions. These transactions have included the sales and purchases of assets,foreign exchange activities, financial guarantees, international services, interest rate swaps andintercompany deposits and borrowing.
Amounts due to and from affiliates and off-balance sheet transactions at December 31, 2010 and2009 were as follows:
(dollars in thousands) 2010 2009Cash and due from banks $ 45,701 $ 46,738Loans 6 6,456Noninterest-bearing demand deposits(1) 1,040,583 36,682Money market deposits 67,941 87,017Time certificates of deposit 219,438 3,452,115Other assets 225,298 13,626Other liabilities 116,445 105,269Short-term borrowings 1,092 1,961Fixed-rate unsecured lines of credit 75,900 83,700Junior subordinated debt - 20,000Structured repurchase agreement - 350,000Noncontrolling interest 23,849 5,774Derivatives and off-balance sheet transactions:
Credit guarantee derivative(2) 796,601 -Standby letters of credit 19,242 12,984Guarantees received 141,220 130,970Fair value hedge(2) 2,045 2,167Commitments to purchase foreign currencies(2) 108,389 77,666Commitments to sell foreign currencies(2) 5,054 18,645Interest rate contracts(2) 2,464,853 1,971,304
(1) Predominately related to foreign deposits to collateralize the Guarantee with BancWest, refer to Note 7 foradditional information.
(2) Represents the notional amount of derivative financial instruments.
Junior subordinated debt of $20 million that was owed to the Commercial Federal Capital III trustswas paid off on May 23, 2010 (see Notes 9 and 13).
Interest expense to affiliates for 2010 and 2009 was $107.7 million and $177.1 million, respectively.Noninterest income from affiliate transactions includes fair value adjustments related to derivatives andwas a net decrease to noninterest income of $169.7 million for 2010 and a net increase of $41.1 millionfor 2009.
22. Stock-based Compensation
The Bank participates in a BNPP stock option plan where certain members of Bank of the West’ssenior management team receive stock option awards from BNPP for shares of BNPP Stock. The Bankaccounts for these stock option awards at their fair values estimated on the grant dates using a trinomialtree pricing model as compensation expense over the vesting or requisite service periods. Upon exerciseof the stock options, the Bank’s senior management team receives shares of BNPP stock. The stockoptions were awarded in the years 2003 through 2010. The options do not vest until after the fourth year,at which time they are exercisable from the fourth anniversary through the tenth anniversary date (the
-61-2010 Bank of the West Annual Report

expiration date) for the 2003 and 2004 grants and through the eighth anniversary date for the 2005through 2010 grants. The range of exercise prices for the 2003-2010 options were $46.67 through$101.78. As of December 31, 2010, no stock options had expired.
Annual stock option awards are recognized over the vesting period and reflected as compensationexpense, which was $2.3 million and $2.9 million for the years ending December 31, 2010 and 2009,respectively. The related income tax benefit was $0.9 million and $1.2 million for the years endedDecember 31, 2010 and 2009, respectively.
During 2009, BNPP performed a share-rights issuance which resulted in modifications to allunexercised stock options, whether vested or unvested. As a result of this modification, the exerciseprice of the options was adjusted downwards and the number of stock options was adjusted upwards,impacting all awarded years. The intent was to keep the plan participants whole. The modification in2009 impacted a total of 93 employees with an additional 21,157 options granted. There was noadditional impact due to this modification in 2010.
The following table is a summary of stock option activity:
NumberWeighted Average
Exercise Price
Weighted AverageRemaining
Contractual Life(in years)
Options outstanding as of January 1, 2009: 729,273 $91.96 4.08Granted 139,897 $50.36Exercised (25,744) $76.42Forfeited (38,215) $84.59
Options outstanding as of December 31,2009 805,211 $88.46 4.79
2010:Granted 102,484 $68.06Exercised (8,217) $64.00Forfeited (46,843) $78.24
Options outstanding as of December 31,2010 852,635 $81.05 4.00
The total fair value of vested options and options exercised was $4.8 million and $0.3 million in2010 and $5.9 million and $1.1 million in 2009, respectively.
The fair value of each stock option was estimated on the date of grant using a trinomial tree pricingmodel. The implied volatility used in measuring stock options is estimated on the basis of a range ofratings prepared by various dealing rooms. The level of volatility used by the Bank takes into accounthistorical volatility trends for the Dow Jones Euro Stoxx Bank index and BNPP shares over a 10-yearperiod. The weighted-average grant-date fair values of options granted during the years 2010 and 2009were $40.32 and $46.98, respectively. Total unrecognized compensation costs related to nonvested shareswas $5.0 million and $5.5 million and the weighted-average period in which these costs will berecognized was 3.01 and 3.97 years at December 31, 2010 and 2009, respectively. The following tablepresents the weighted-average assumptions used.
2010 2009Dividend yield 2.0% 2.0%Expected volatility 30.4% 39.9%Risk free interest rate 3.1% 3.2%Expected life (in years) 8 8
-62-2010 Bank of the West Annual Report
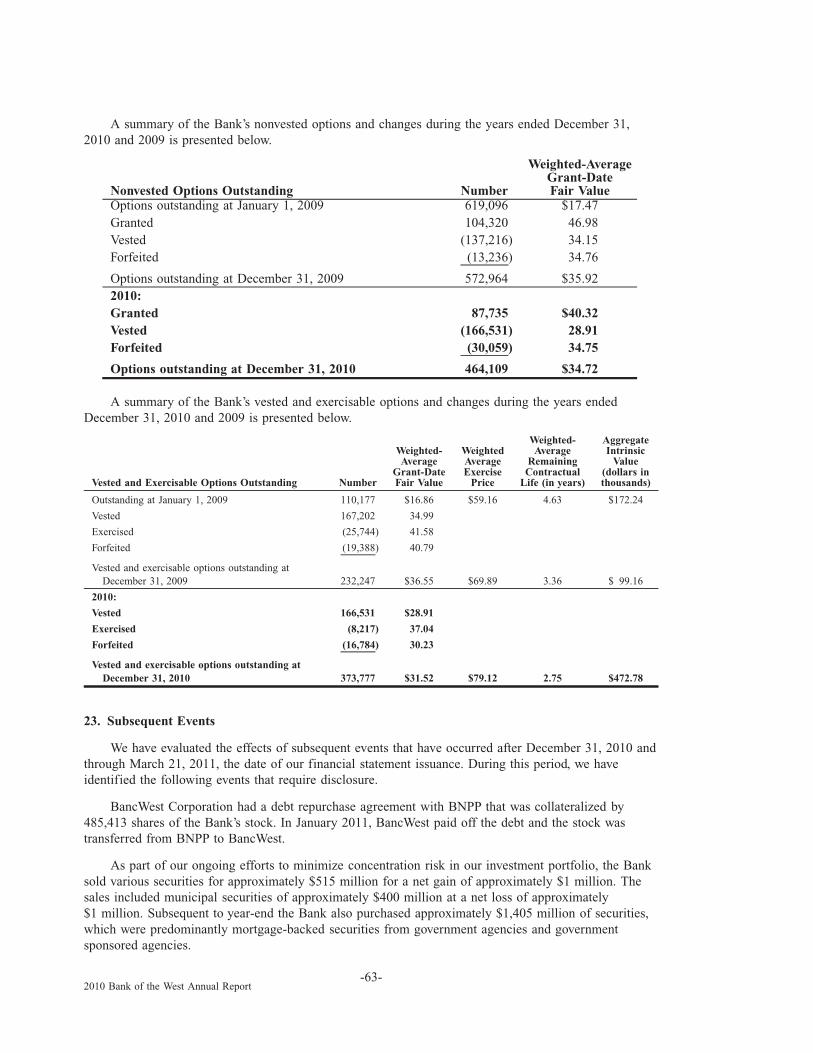
A summary of the Bank’s nonvested options and changes during the years ended December 31,2010 and 2009 is presented below.
Nonvested Options Outstanding Number
Weighted-AverageGrant-DateFair Value
Options outstanding at January 1, 2009 619,096 $17.47Granted 104,320 46.98Vested (137,216) 34.15Forfeited (13,236) 34.76
Options outstanding at December 31, 2009 572,964 $35.922010:Granted 87,735 $40.32Vested (166,531) 28.91Forfeited (30,059) 34.75
Options outstanding at December 31, 2010 464,109 $34.72
A summary of the Bank’s vested and exercisable options and changes during the years endedDecember 31, 2010 and 2009 is presented below.
Vested and Exercisable Options Outstanding Number
Weighted-Average
Grant-DateFair Value
WeightedAverageExercise
Price
Weighted-Average
RemainingContractual
Life (in years)
AggregateIntrinsic
Value(dollars inthousands)
Outstanding at January 1, 2009 110,177 $16.86 $59.16 4.63 $172.24
Vested 167,202 34.99
Exercised (25,744) 41.58
Forfeited (19,388) 40.79
Vested and exercisable options outstanding atDecember 31, 2009 232,247 $36.55 $69.89 3.36 $ 99.16
2010:
Vested 166,531 $28.91
Exercised (8,217) 37.04
Forfeited (16,784) 30.23
Vested and exercisable options outstanding atDecember 31, 2010 373,777 $31.52 $79.12 2.75 $472.78
23. Subsequent Events
We have evaluated the effects of subsequent events that have occurred after December 31, 2010 andthrough March 21, 2011, the date of our financial statement issuance. During this period, we haveidentified the following events that require disclosure.
BancWest Corporation had a debt repurchase agreement with BNPP that was collateralized by485,413 shares of the Bank’s stock. In January 2011, BancWest paid off the debt and the stock wastransferred from BNPP to BancWest.
As part of our ongoing efforts to minimize concentration risk in our investment portfolio, the Banksold various securities for approximately $515 million for a net gain of approximately $1 million. Thesales included municipal securities of approximately $400 million at a net loss of approximately$1 million. Subsequent to year-end the Bank also purchased approximately $1,405 million of securities,which were predominantly mortgage-backed securities from government agencies and governmentsponsored agencies.
-63-2010 Bank of the West Annual Report

180 Montgomery Street, San Francisco, CA 94104415.765.4800 • www.bankofthewest.com
Bank of theWestand Subsidiaries
2010 Annual Report Financial Statements
111001 BOW AR_Financial Cover_final_v2:Layout 1 3/15/11 5:34 PM Page 1