Bank of Barodabankofbaroda.com/download/BOB_Analysts_FY16.pdf · · 2015-07-30and 50% for traders...
30
Bank of Baroda: Bank of Baroda: Consolidating and striding ahead Consolidating and striding ahead Performance Analysis: Q1, 2015 Performance Analysis: Q1, 2015-16 (FY16) 16 (FY16) V S V S Narang Narang General Manager General Manager July 30, 2015 July 30, 2015
Transcript of Bank of Barodabankofbaroda.com/download/BOB_Analysts_FY16.pdf · · 2015-07-30and 50% for traders...
Bank of Baroda: Bank of Baroda: Consolidating and striding aheadConsolidating and striding ahead
Performance Analysis: Q1, 2015Performance Analysis: Q1, 2015--16 (FY16) 16 (FY16)
V S V S NarangNarangGeneral ManagerGeneral Manager
July 30, 2015July 30, 2015
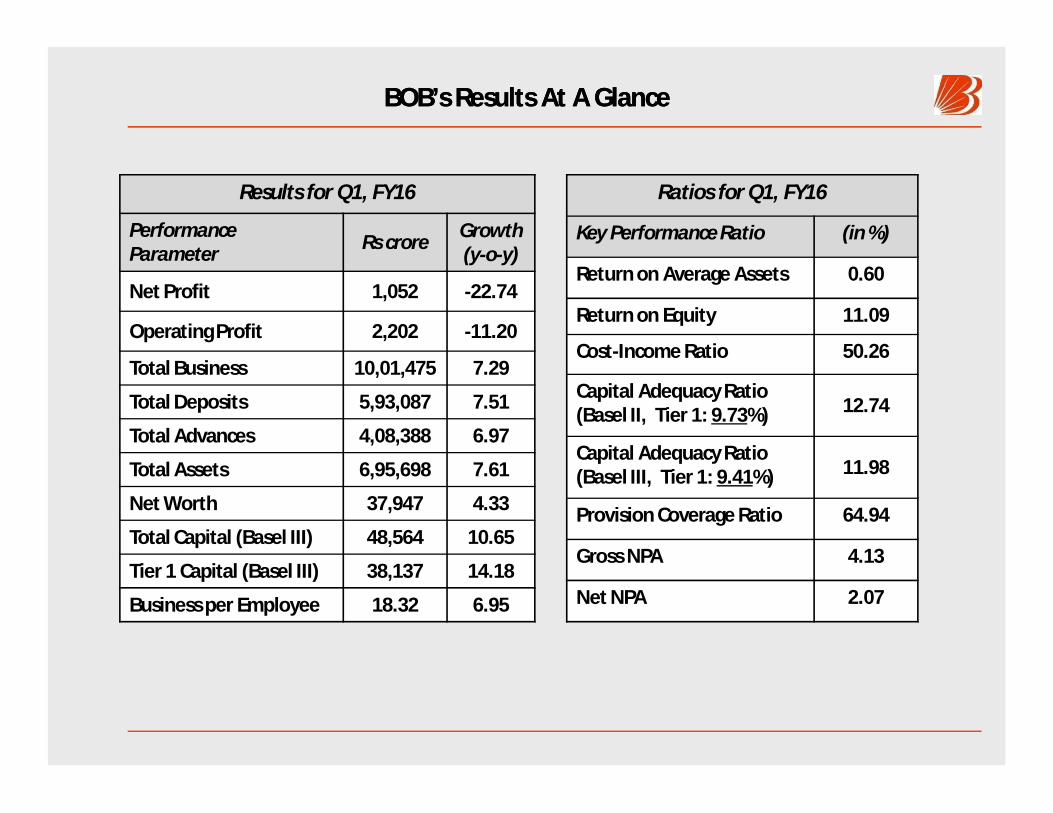
BOB’s Results At A Glance BOB’s Results At A Glance
Results for Q1, FY16
PerformanceParameter Rs crore Growth
(y-o-y)
Net Profit 1,052 -22.74
Operating Profit 2,202 -11.20
Total Business 10,01,475 7.29
Total Deposits 5,93,087 7.51
Total Advances 4,08,388 6.97
Total Assets 6,95,698 7.61
Net Worth 37,947 4.33
Total Capital (Basel III) 48,564 10.65
Tier 1 Capital (Basel III) 38,137 14.18
Business per Employee 18.32 6.95
Ratios for Q1, FY16
Key Performance Ratio (in %)
Return on Average Assets 0.60
Return on Equity 11.09
Cost-Income Ratio 50.26
Capital Adequacy Ratio(Basel II, Tier 1: 9.73%) 12.74
Capital Adequacy Ratio(Basel III, Tier 1: 9.41%) 11.98
Provision Coverage Ratio 64.94
Gross NPA 4.13
Net NPA 2.07
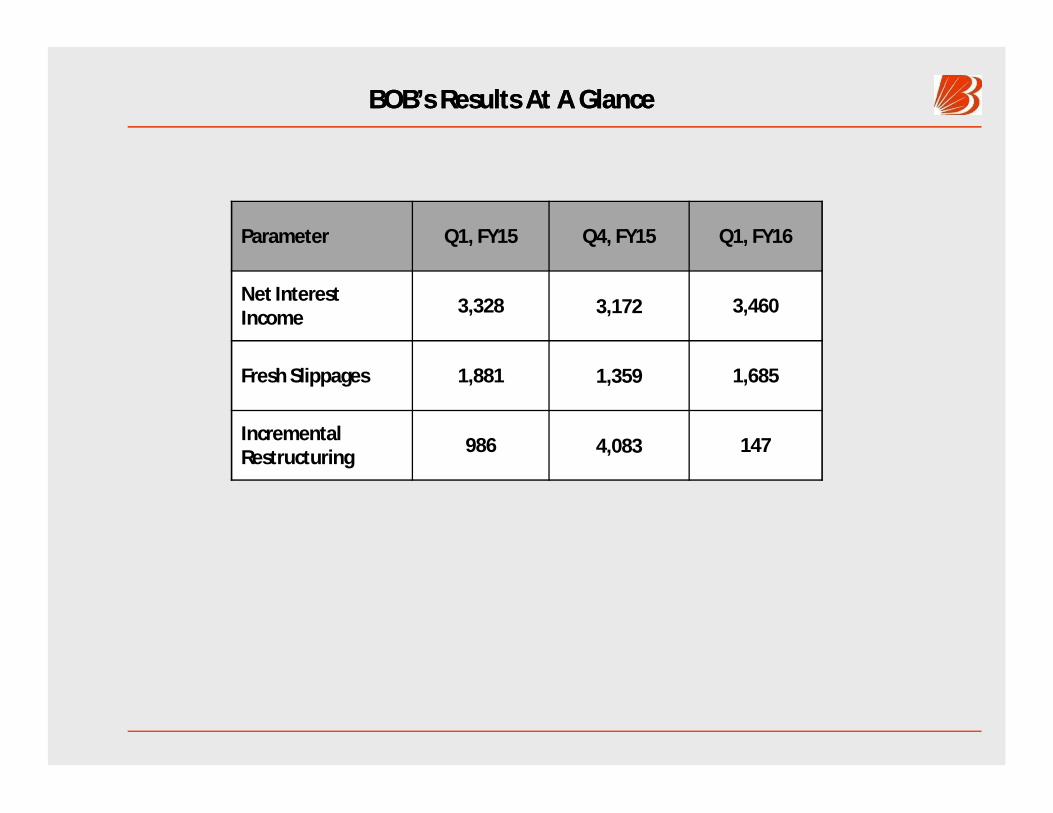
BOB’s Results At A Glance BOB’s Results At A Glance
Parameter Q1, FY15 Q4, FY15 Q1, FY16
Net Interest Income 3,328 3,172 3,460
Fresh Slippages 1,881 1,359 1,685
Incremental Restructuring 986 4,083 147
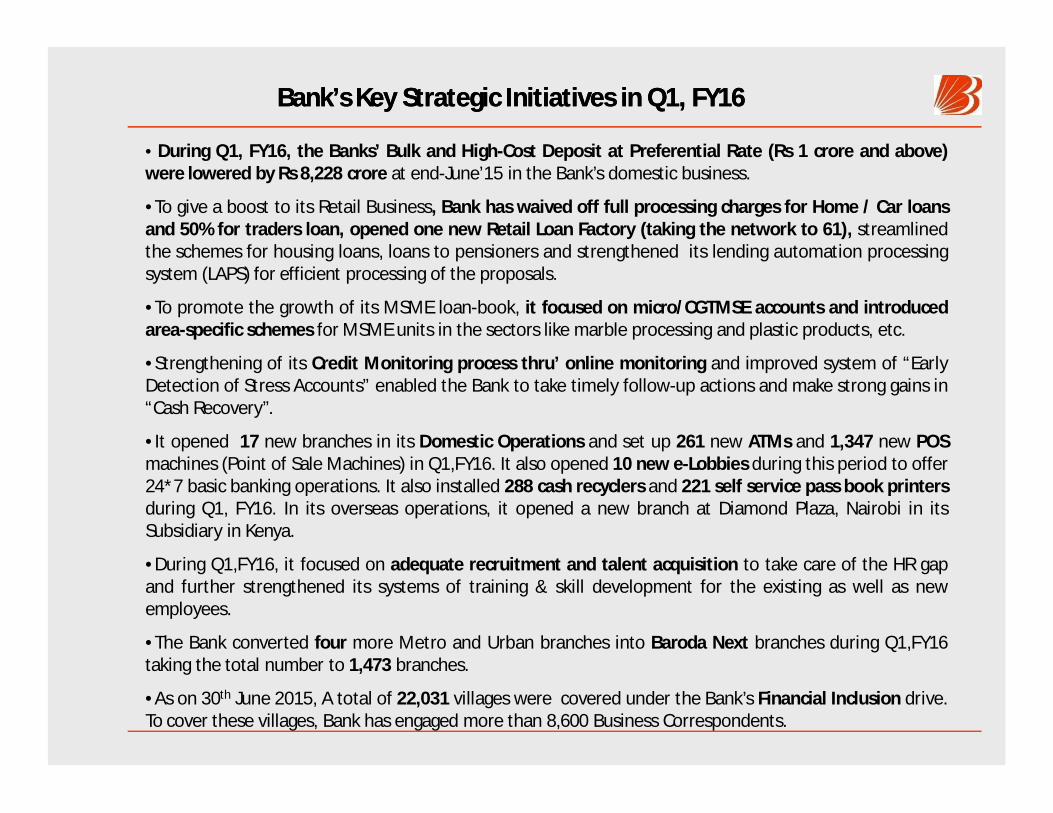
Bank’s Key Strategic Initiatives in Q1, FY16 Bank’s Key Strategic Initiatives in Q1, FY16
• During Q1, FY16, the Banks’ Bulk and High-Cost Deposit at Preferential Rate (Rs 1 crore and above)were lowered by Rs 8,228 crore at end-June’15 in the Bank’s domestic business.
•To give a boost to its Retail Business, Bank has waived off full processing charges for Home / Car loansand 50% for traders loan, opened one new Retail Loan Factory (taking the network to 61), streamlinedthe schemes for housing loans, loans to pensioners and strengthened its lending automation processingsystem (LAPS) for efficient processing of the proposals.
•To promote the growth of its MSME loan-book, it focused on micro/CGTMSE accounts and introducedarea-specific schemes for MSME units in the sectors like marble processing and plastic products, etc.
•Strengthening of its Credit Monitoring process thru’ online monitoring and improved system of “EarlyDetection of Stress Accounts” enabled the Bank to take timely follow-up actions and make strong gains in“Cash Recovery”.
•It opened 17 new branches in its Domestic Operations and set up 261 new ATMs and 1,347 new POSmachines (Point of Sale Machines) in Q1,FY16. It also opened 10 new e-Lobbies during this period to offer24*7 basic banking operations. It also installed 288 cash recyclers and 221 self service pass book printersduring Q1, FY16. In its overseas operations, it opened a new branch at Diamond Plaza, Nairobi in itsSubsidiary in Kenya.
•During Q1,FY16, it focused on adequate recruitment and talent acquisition to take care of the HR gapand further strengthened its systems of training & skill development for the existing as well as newemployees.
•The Bank converted four more Metro and Urban branches into Baroda Next branches during Q1,FY16taking the total number to 1,473 branches.
•As on 30th June 2015, A total of 22,031 villages were covered under the Bank’s Financial Inclusion drive.To cover these villages, Bank has engaged more than 8,600 Business Correspondents.
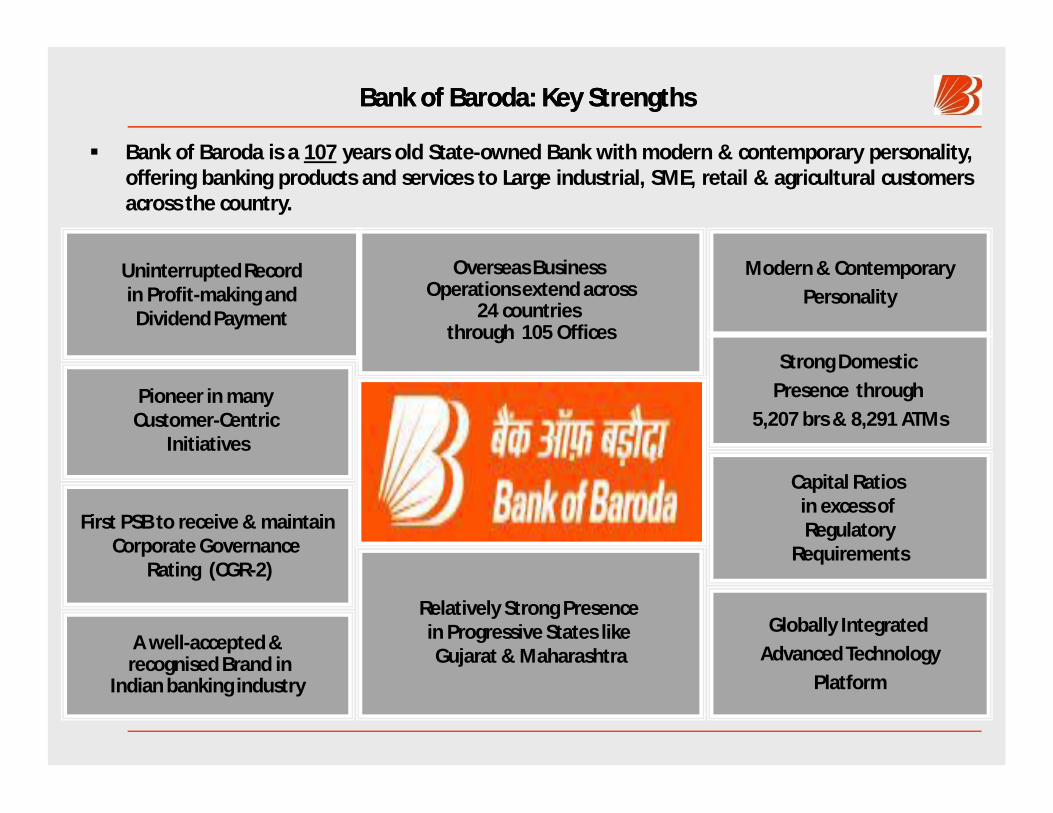
Bank of Baroda: Key Strengths Bank of Baroda: Key Strengths
Bank of Baroda is a 107 years old State-owned Bank with modern & contemporary personality,offering banking products and services to Large industrial, SME, retail & agricultural customersacross the country.
Relatively Strong Presence in Progressive States like Gujarat & Maharashtra
Uninterrupted Recordin Profit-making and Dividend Payment
Overseas Business Operations extend across
24 countries through 105 Offices
First PSB to receive & maintainCorporate Governance
Rating (CGR-2)
Globally Integrated Advanced Technology
Platform
Pioneer in many Customer-Centric
Initiatives
Strong Domestic Presence through
5,207 brs & 8,291 ATMs
Modern & ContemporaryPersonality
Capital Ratios in excess of Regulatory
Requirements
A well-accepted &recognised Brand in
Indian banking industry
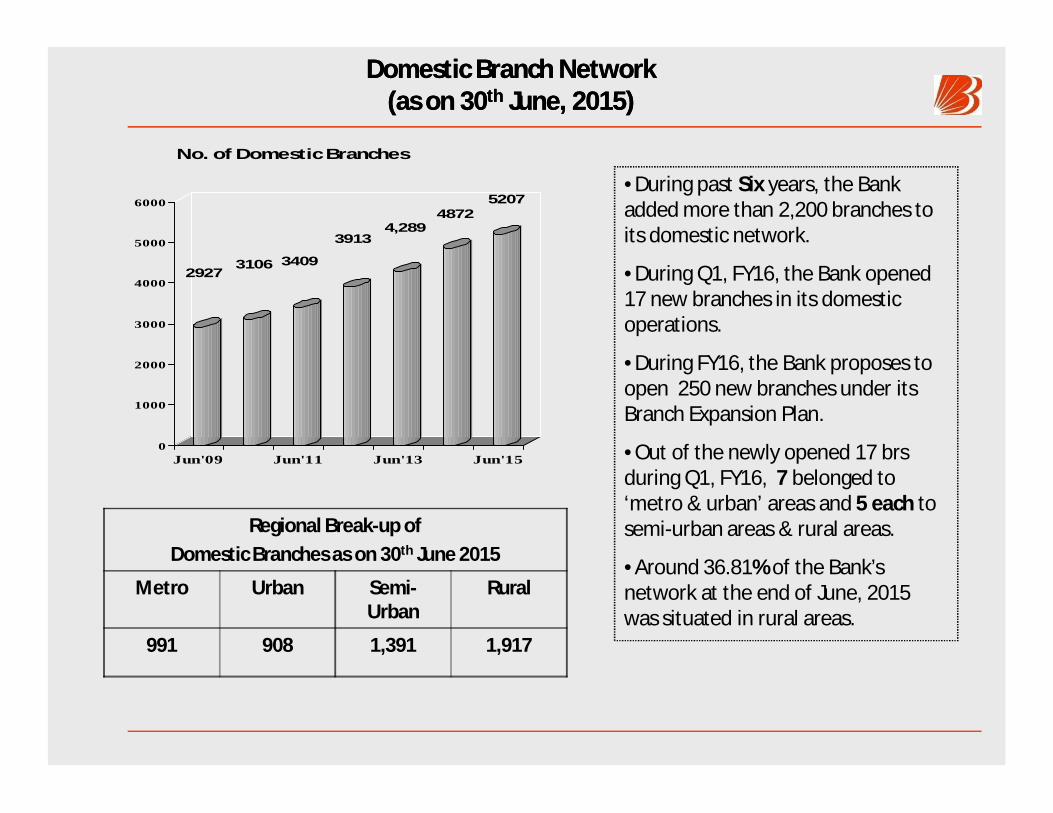
Domestic Branch NetworkDomestic Branch Network(as on 30(as on 30thth June, 2015) June, 2015)
29273106 3409
39134,289
48725207
0
1000
2000
3000
4000
5000
6000
Jun'09 Jun'11 Jun'13 Jun'15
No. of Domestic Branches
Regional Break-up of Domestic Branches as on 30th June 2015
Metro Urban Semi-Urban
Rural
991 908 1,391 1,917
•During past Six years, the Bank added more than 2,200 branches to its domestic network.
•During Q1, FY16, the Bank opened 17 new branches in its domestic operations.
•During FY16, the Bank proposes to open 250 new branches under its Branch Expansion Plan.
•Out of the newly opened 17 brs during Q1, FY16, 7 belonged to ‘metro & urban’ areas and 5 each to semi-urban areas & rural areas.
•Around 36.81% of the Bank’s network at the end of June, 2015 was situated in rural areas.
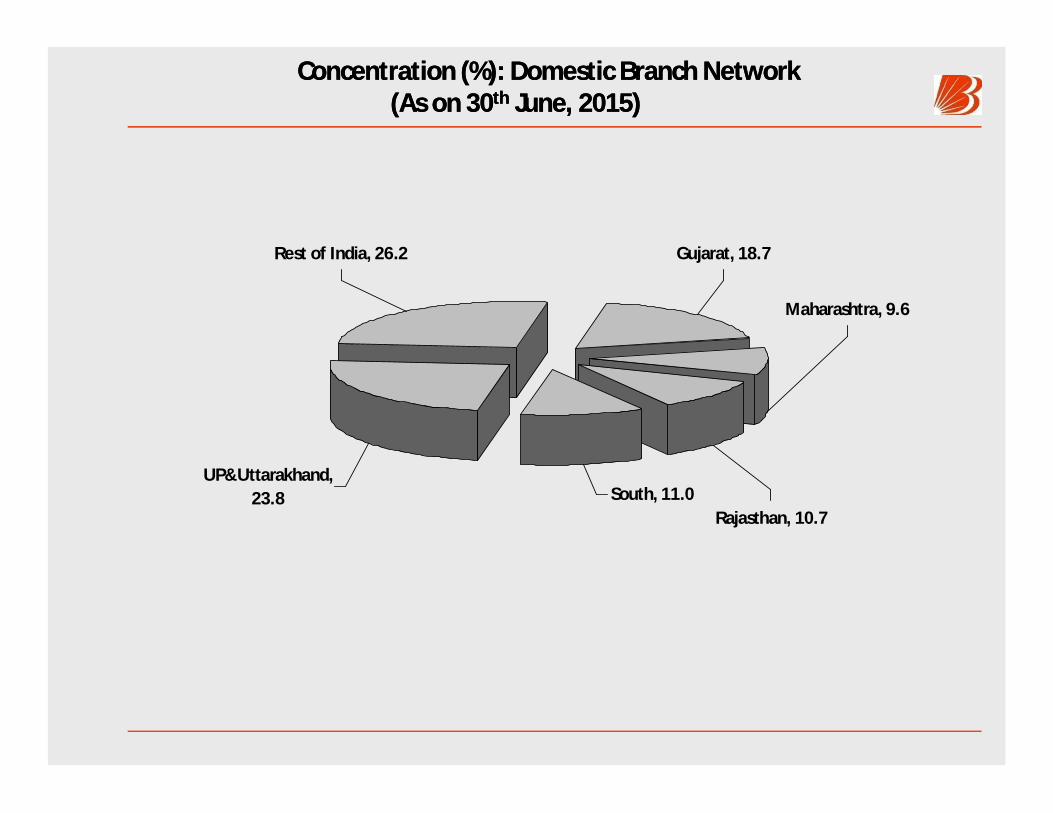
Concentration (%): Domestic Branch NetworkConcentration (%): Domestic Branch Network(As on 30(As on 30thth June, 2015)June, 2015)
Rest of India, 26.2
UP&Uttarakhand, 23.8 South, 11.0
Rajasthan, 10.7
Maharashtra, 9.6
Gujarat, 18.7

Pattern of Shareholding: 30Pattern of Shareholding: 30thth June, 2015June, 2015
•FIIs/FPIs
14.0%
Corp. Bodies2.4%Indian
Public5.0%
Others2.1%
Mutual Funds7.6%
Insurance Cos
11.4% Govt. of India57.5%
• BOB is a Part of the following Indices
BSE 100, BSE 200, BSE 500 & Bankex
Nifty, BankNifty, CNX 100, CNX 200, CNX 500
• BOB’s Share is also listed on BSE and NSE in the‘Future and Options’ segment.
As on 30th June, 2015
•Share Capital: Rs 443.56 crore
•Net worth: Rs 37,947.40 crore (up 4.33%, y-o-y)
• B. V. per share (F. V. per share of Rs 2 ): Rs 171.59
•Return on Equity: 11.09% in Q1, FY16
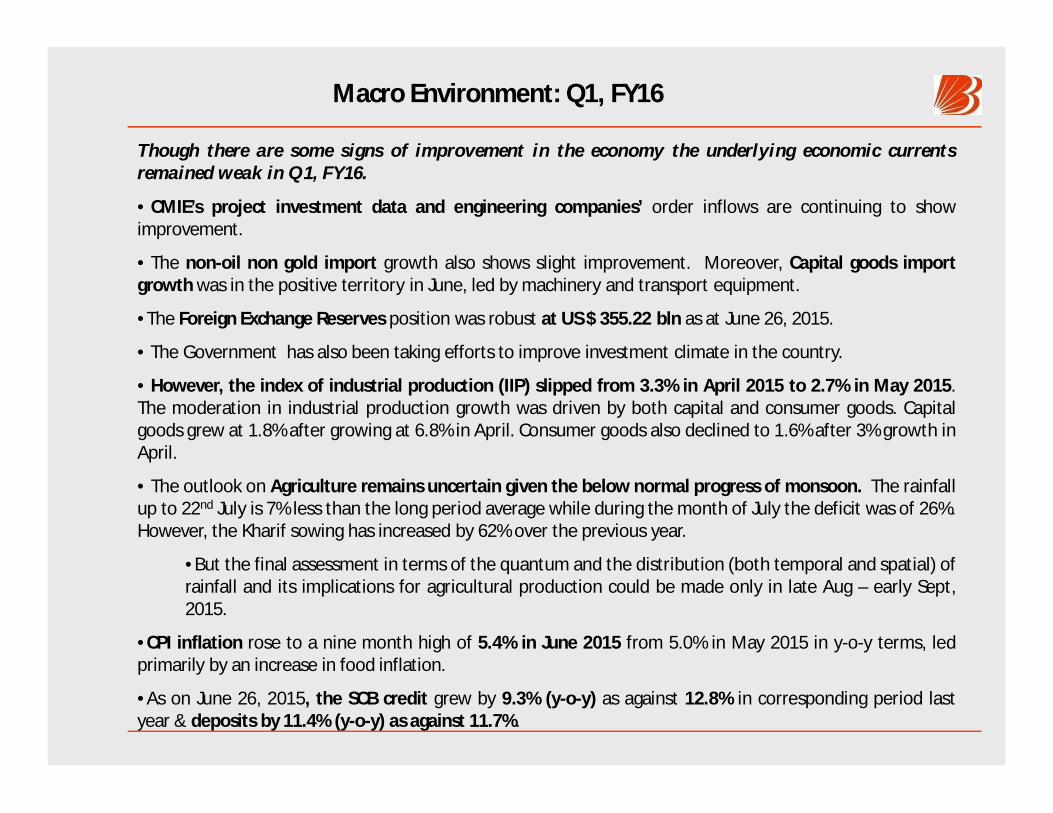
Macro Environment: Q1, FY16
Though there are some signs of improvement in the economy the underlying economic currentsremained weak in Q1, FY16.
• CMIE’s project investment data and engineering companies’ order inflows are continuing to showimprovement.
• The non-oil non gold import growth also shows slight improvement. Moreover, Capital goods importgrowth was in the positive territory in June, led by machinery and transport equipment.
•The Foreign Exchange Reserves position was robust at US $ 355.22 bln as at June 26, 2015.
• The Government has also been taking efforts to improve investment climate in the country.
• However, the index of industrial production (IIP) slipped from 3.3% in April 2015 to 2.7% in May 2015.The moderation in industrial production growth was driven by both capital and consumer goods. Capitalgoods grew at 1.8% after growing at 6.8% in April. Consumer goods also declined to 1.6% after 3% growth inApril.
• The outlook on Agriculture remains uncertain given the below normal progress of monsoon. The rainfallup to 22nd July is 7% less than the long period average while during the month of July the deficit was of 26%.However, the Kharif sowing has increased by 62% over the previous year.
•But the final assessment in terms of the quantum and the distribution (both temporal and spatial) ofrainfall and its implications for agricultural production could be made only in late Aug – early Sept,2015.
•CPI inflation rose to a nine month high of 5.4% in June 2015 from 5.0% in May 2015 in y-o-y terms, ledprimarily by an increase in food inflation.
•As on June 26, 2015, the SCB credit grew by 9.3% (y-o-y) as against 12.8% in corresponding period lastyear & deposits by 11.4% (y-o-y) as against 11.7%.

Business Expansion
Particular(Rs crore)
June’14 Mar’15 June’15Y-O-Y
(%)
ChangeOver
Mar’15 (%)
Global Business 9,33,421 10,45,625 10,01,475 7.29 -4.22
Domestic Business 6,24,894 7,06,148 6,81,033 8.98 -3.56
Overseas Business 3,08,527 3,39,477 3,20,443 3.86 -5.61
Global Deposits 5,51,649 6,17,560 5,93,087 7.51 -3.96
Domestic Deposits 3,65,413 4,14,278 4,05,211 10.89 -2.19
Overseas Deposits 1,86,236 2,03,282 1,87,876 0.88 -7.58
Global CASA Deposits 1,38,632 1,62,969 1,53,544 10.76 -5.78
Domestic CASA 1,14,478 1,36,752 1,29,223 12.88 -5.51
Overseas CASA 24,154 26,217 24,321 0.69 -7.23
•Share of Domestic CASA in Total Domestic Deposits increased to 31.89% at end-June,2015 as against 31.33% as at June, 2014.

Business ExpansionBusiness Expansion
Particular(Rs crore)
June’14 Mar’15 June’15Y-O-Y
(%)
ChangeOver
Mar’14 (%)
Global advances (Net) 3,81,772 4,28,065 4,08,388 6.97 -4.60
Domestic Advances 2,59,482 2,91,870 2,75,821 6.30 -5.50
Overseas Advances 1,22,291 1,36,195 1,32,567 8.40 -2.66
Retail CreditOf which:
44,545 52,488 51,735 16.14 -1.43
Home Loans 20,168 22,542 22,807 13.09 1.18
SME Credit 57,433 61,993 61,542 7.15 -0.73
Farm Credit 31,259 37,403 39,502 26.37 5.61
Credit to Weaker Sections 20,610 22,510 22,587 9.59 0.34
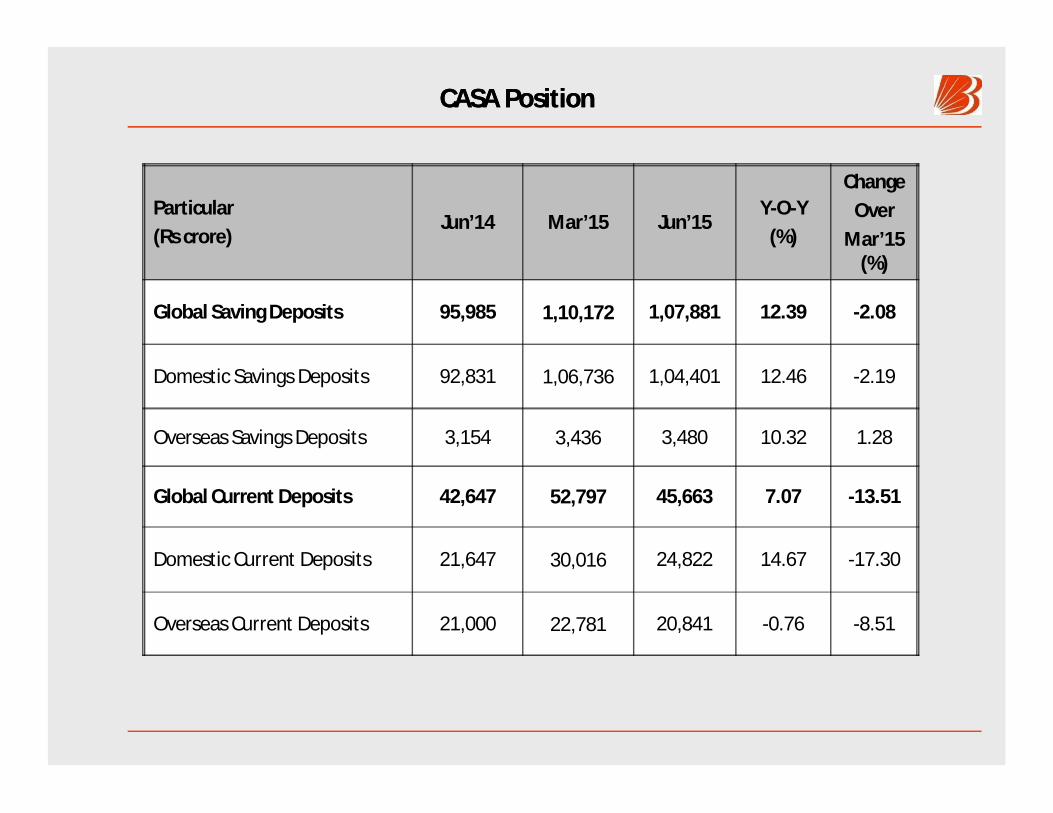
CASA PositionCASA Position
Particular(Rs crore)
Jun’14 Mar’15 Jun’15Y-O-Y
(%)
ChangeOver
Mar’15 (%)
Global Saving Deposits 95,985 1,10,172 1,07,881 12.39 -2.08
Domestic Savings Deposits 92,831 1,06,736 1,04,401 12.46 -2.19
Overseas Savings Deposits 3,154 3,436 3,480 10.32 1.28
Global Current Deposits 42,647 52,797 45,663 7.07 -13.51
Domestic Current Deposits 21,647 30,016 24,822 14.67 -17.30
Overseas Current Deposits 21,000 22,781 20,841 -0.76 -8.51
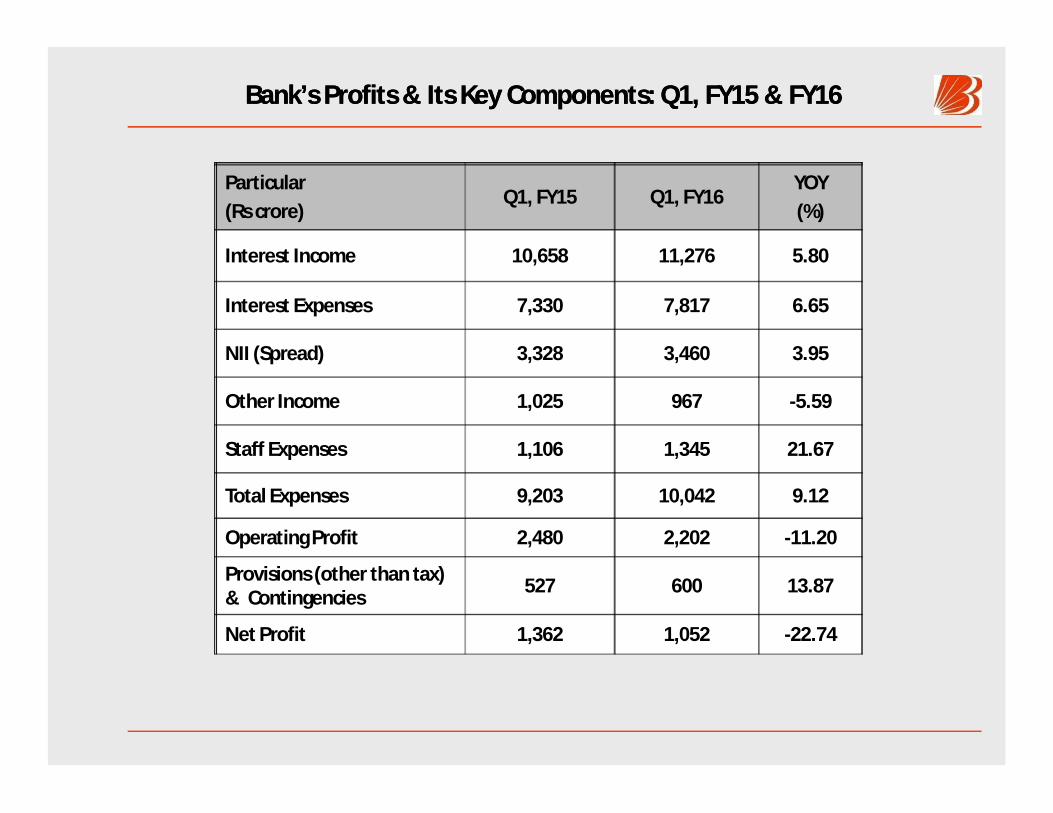
Bank’s Profits & Its Key Components: Q1, FY15 & FY16 Bank’s Profits & Its Key Components: Q1, FY15 & FY16
Particular(Rs crore)
Q1, FY15 Q1, FY16YOY(%)
Interest Income 10,658 11,276 5.80
Interest Expenses 7,330 7,817 6.65
NII (Spread) 3,328 3,460 3.95
Other Income 1,025 967 -5.59
Staff Expenses 1,106 1,345 21.67
Total Expenses 9,203 10,042 9.12
Operating Profit 2,480 2,202 -11.20
Provisions (other than tax) & Contingencies 527 600 13.87
Net Profit 1,362 1,052 -22.74
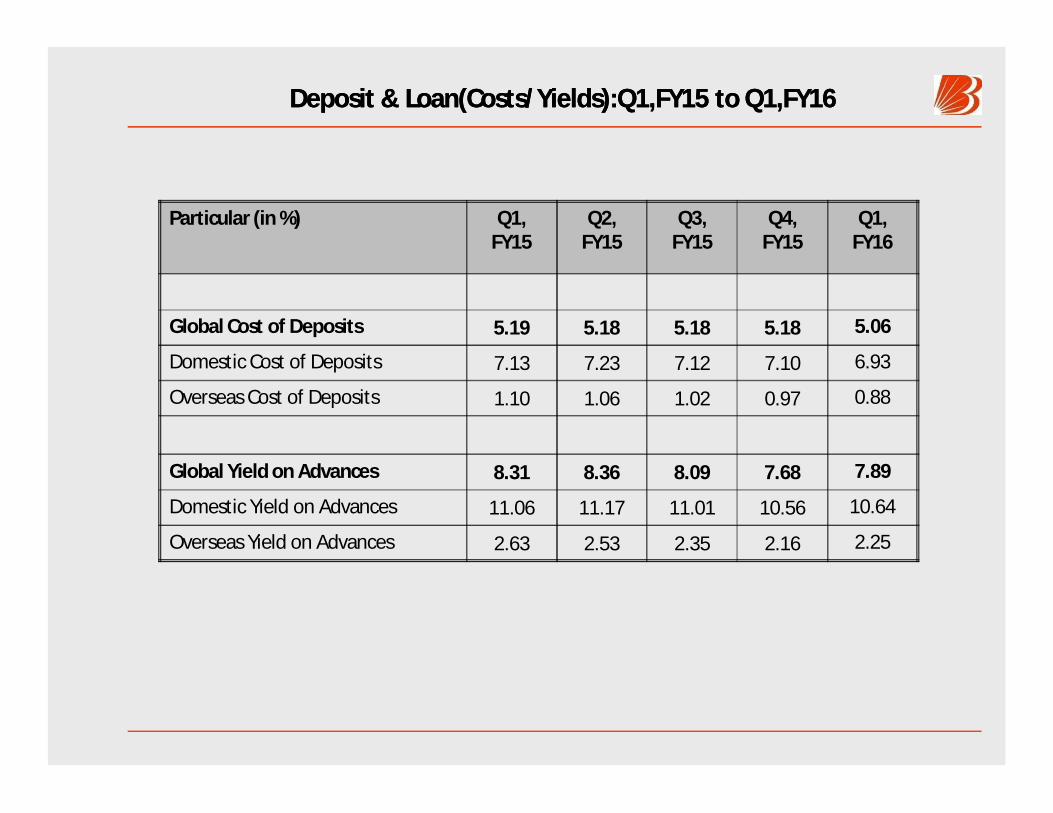
Deposit & Loan(Costs/Yields):Q1,FY15 to Q1,FY16Deposit & Loan(Costs/Yields):Q1,FY15 to Q1,FY16
Particular (in %) Q1, FY15
Q2, FY15
Q3, FY15
Q4, FY15
Q1, FY16
Global Cost of Deposits 5.19 5.18 5.18 5.18 5.06
Domestic Cost of Deposits 7.13 7.23 7.12 7.10 6.93
Overseas Cost of Deposits 1.10 1.06 1.02 0.97 0.88
Global Yield on Advances 8.31 8.36 8.09 7.68 7.89
Domestic Yield on Advances 11.06 11.17 11.01 10.56 10.64
Overseas Yield on Advances 2.63 2.53 2.35 2.16 2.25
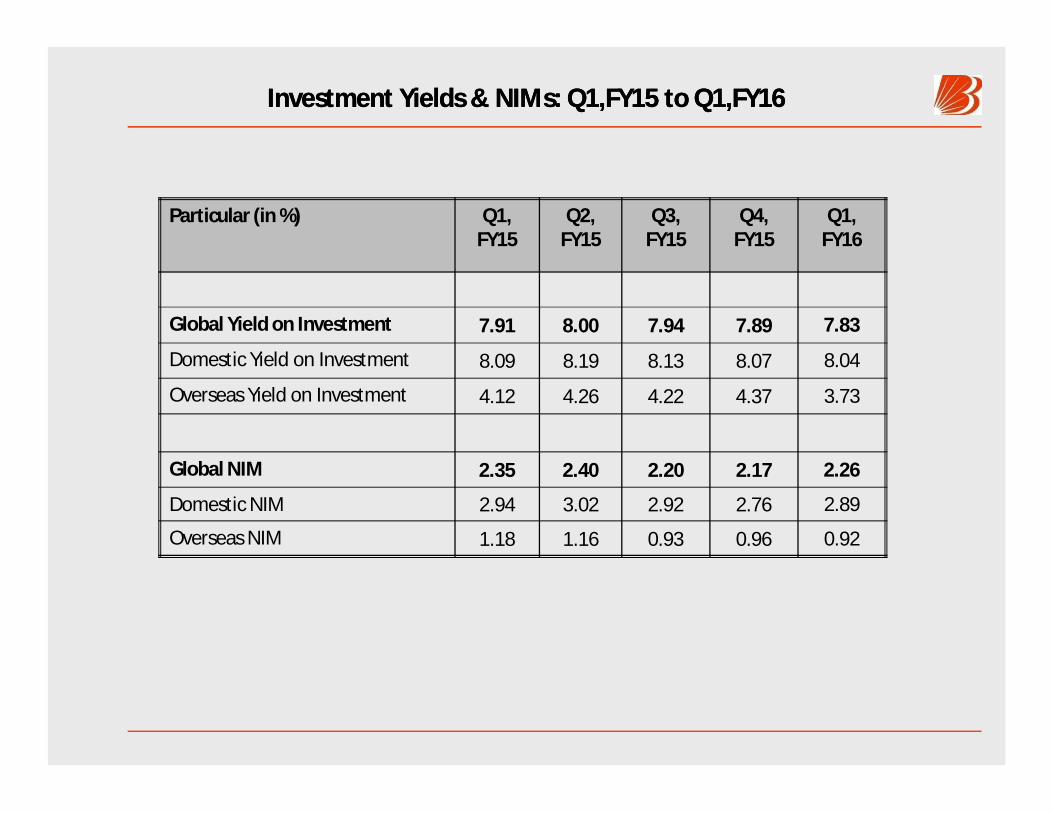
Investment Yields & NIMs: Q1,FY15 to Q1,FY16 Investment Yields & NIMs: Q1,FY15 to Q1,FY16
Particular (in %) Q1, FY15
Q2, FY15
Q3, FY15
Q4, FY15
Q1, FY16
Global Yield on Investment 7.91 8.00 7.94 7.89 7.83
Domestic Yield on Investment 8.09 8.19 8.13 8.07 8.04
Overseas Yield on Investment 4.12 4.26 4.22 4.37 3.73
Global NIM 2.35 2.40 2.20 2.17 2.26
Domestic NIM 2.94 3.02 2.92 2.76 2.89
Overseas NIM 1.18 1.16 0.93 0.96 0.92

NonNon--Interest income: Q1 of FY15 & FY16Interest income: Q1 of FY15 & FY16
(Rs crore) Q1, FY15 Q1, FY16% Change
(Y-O-Y)
Commission, Exchange, Brokerage 347.26 346.37 -0.26
Incidental Charges 71.77 79.39 10.62
Other Miscellaneous Income 64.26 93.60 45.66
Total Fee-Based Income 483.29 519.36 7.46
Trading Gains 224.17 157.04 -29.94
FX Profits (Treasury) 256.07 277.78 8.48
Recovery from PWO 61.01 13.05 -78.61
Total Non-Interest Income 1,024.54 967.23 -5.59

Provisions & Contingencies: Q1 of FY15 & FY16Provisions & Contingencies: Q1 of FY15 & FY16
(Rs crore) Q1, FY15 Q1, FY16%
Change
Provision for NPA & Bad Debts Written-off 771.80 567.82 -26.43
Provision for Depreciation on Investment -318.89 18.91 --
Provision for Standard Advances 79.90 12.08 -84.89
Other Provisions (including Provision for staff welfare) -6.11 0.94 --
Tax Provisions 591.01 550.06 -6.93
Total Provisions 1,117.72 1149.80 2.87
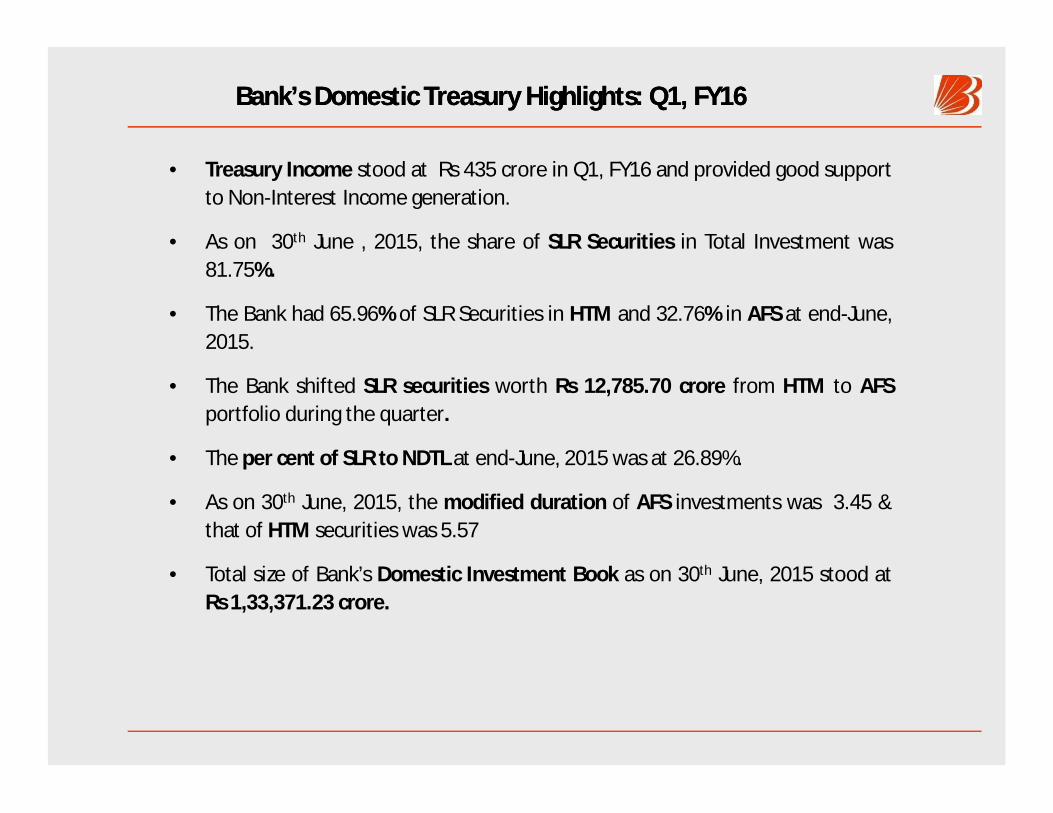
Bank’s Domestic Treasury Highlights: Q1, FY16Bank’s Domestic Treasury Highlights: Q1, FY16
• Treasury Income stood at Rs 435 crore in Q1, FY16 and provided good supportto Non-Interest Income generation.
• As on 30th June , 2015, the share of SLR Securities in Total Investment was81.75%.
• The Bank had 65.96% of SLR Securities in HTM and 32.76% in AFS at end-June,2015.
• The Bank shifted SLR securities worth Rs 12,785.70 crore from HTM to AFSportfolio during the quarter.
• The per cent of SLR to NDTL at end-June, 2015 was at 26.89%.
• As on 30th June, 2015, the modified duration of AFS investments was 3.45 &that of HTM securities was 5.57
• Total size of Bank’s Domestic Investment Book as on 30th June, 2015 stood atRs 1,33,371.23 crore.
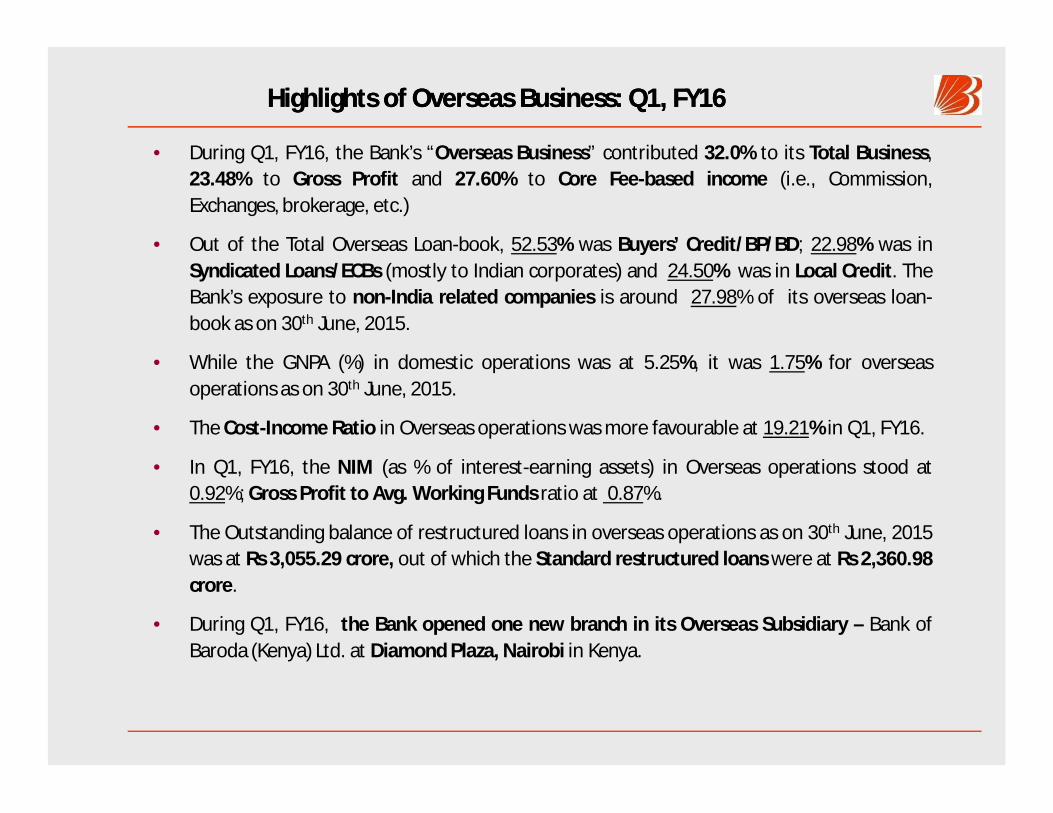
Highlights of Overseas Business: Q1, FY16Highlights of Overseas Business: Q1, FY16
• During Q1, FY16, the Bank’s “Overseas Business” contributed 32.0% to its Total Business,23.48% to Gross Profit and 27.60% to Core Fee-based income (i.e., Commission,Exchanges, brokerage, etc.)
• Out of the Total Overseas Loan-book, 52.53% was Buyers’ Credit/BP/BD; 22.98% was inSyndicated Loans/ECBs (mostly to Indian corporates) and 24.50% was in Local Credit. TheBank’s exposure to non-India related companies is around 27.98% of its overseas loan-book as on 30th June, 2015.
• While the GNPA (%) in domestic operations was at 5.25%, it was 1.75% for overseasoperations as on 30th June, 2015.
• The Cost-Income Ratio in Overseas operations was more favourable at 19.21% in Q1, FY16.
• In Q1, FY16, the NIM (as % of interest-earning assets) in Overseas operations stood at0.92%; Gross Profit to Avg. Working Funds ratio at 0.87%.
• The Outstanding balance of restructured loans in overseas operations as on 30th June, 2015was at Rs 3,055.29 crore, out of which the Standard restructured loans were at Rs 2,360.98crore.
• During Q1, FY16, the Bank opened one new branch in its Overseas Subsidiary – Bank ofBaroda (Kenya) Ltd. at Diamond Plaza, Nairobi in Kenya.
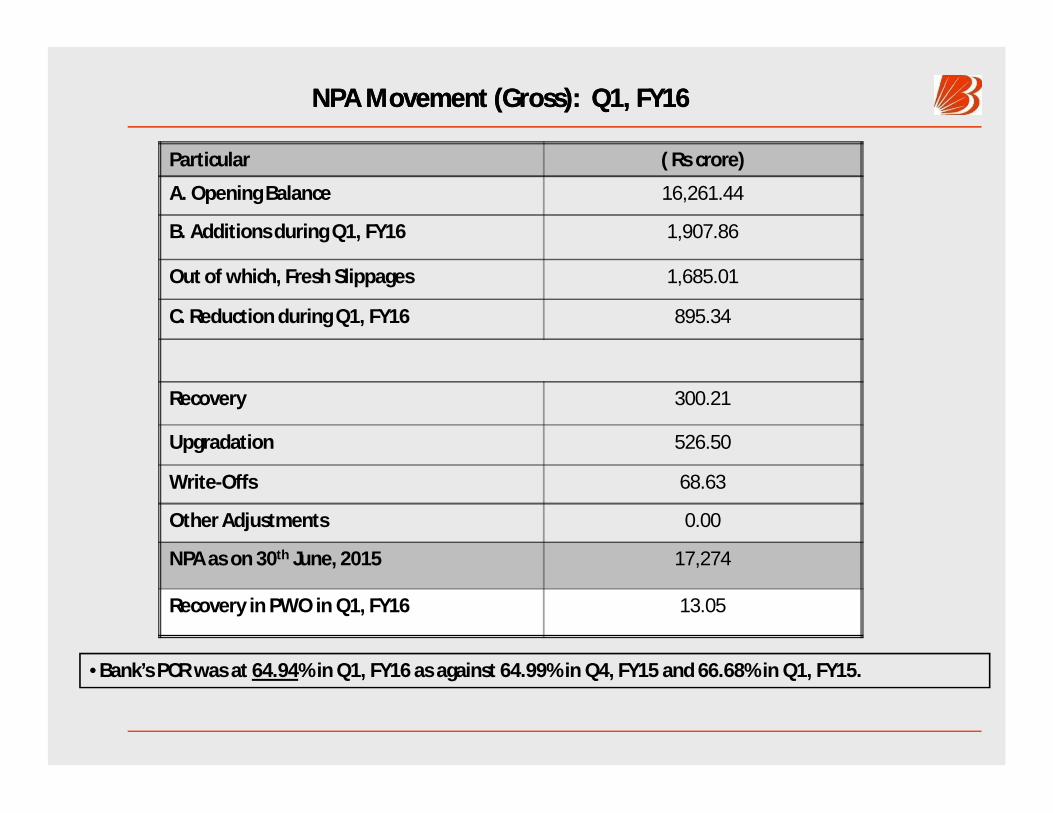
NPA Movement (Gross): Q1, FY16NPA Movement (Gross): Q1, FY16
Particular ( Rs crore)
A. Opening Balance 16,261.44
B. Additions during Q1, FY16 1,907.86
Out of which, Fresh Slippages 1,685.01
C. Reduction during Q1, FY16 895.34
Recovery 300.21
Upgradation 526.50
Write-Offs 68.63
Other Adjustments 0.00
NPA as on 30th June, 2015 17,274
Recovery in PWO in Q1, FY16 13.05
•Bank’s PCR was at 64.94% in Q1, FY16 as against 64.99% in Q4, FY15 and 66.68% in Q1, FY15.
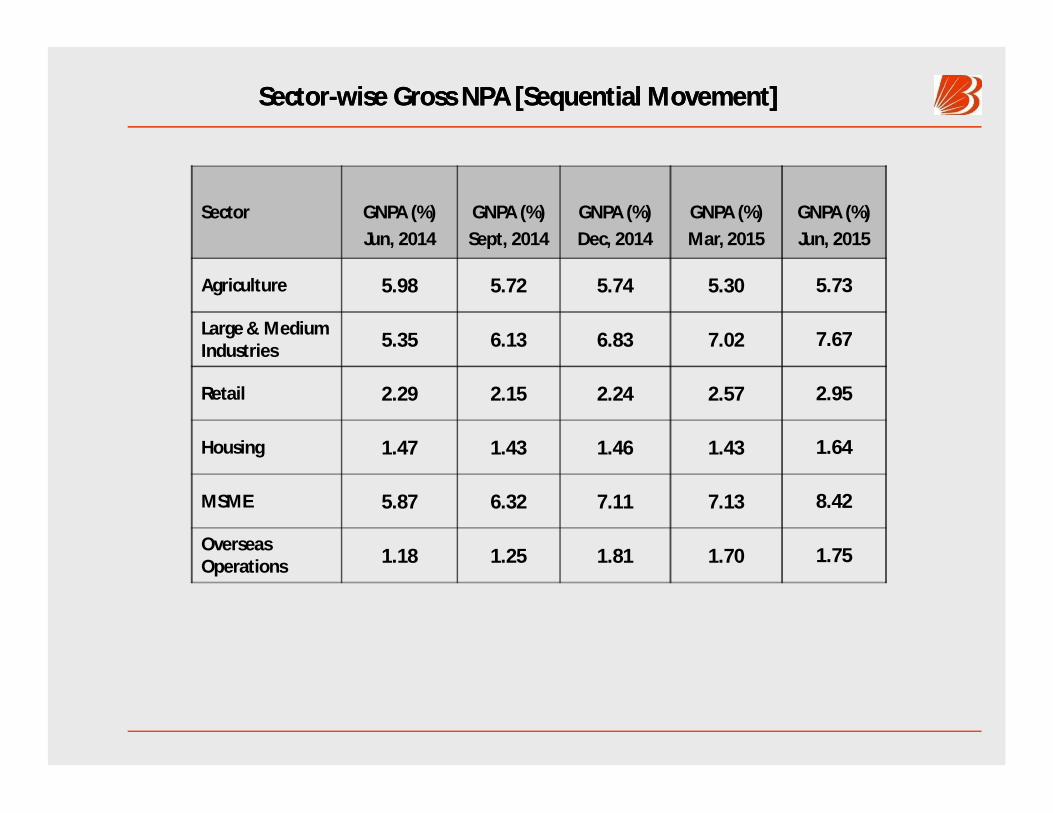
SectorSector--wise Gross NPA [Sequential Movement]wise Gross NPA [Sequential Movement]
Sector GNPA (%)Jun, 2014
GNPA (%)Sept, 2014
GNPA (%)Dec, 2014
GNPA (%)Mar, 2015
GNPA (%)Jun, 2015
Agriculture 5.98 5.72 5.74 5.30 5.73
Large & Medium Industries 5.35 6.13 6.83 7.02 7.67
Retail 2.29 2.15 2.24 2.57 2.95
Housing 1.47 1.43 1.46 1.43 1.64
MSME 5.87 6.32 7.11 7.13 8.42
Overseas Operations 1.18 1.25 1.81 1.70 1.75
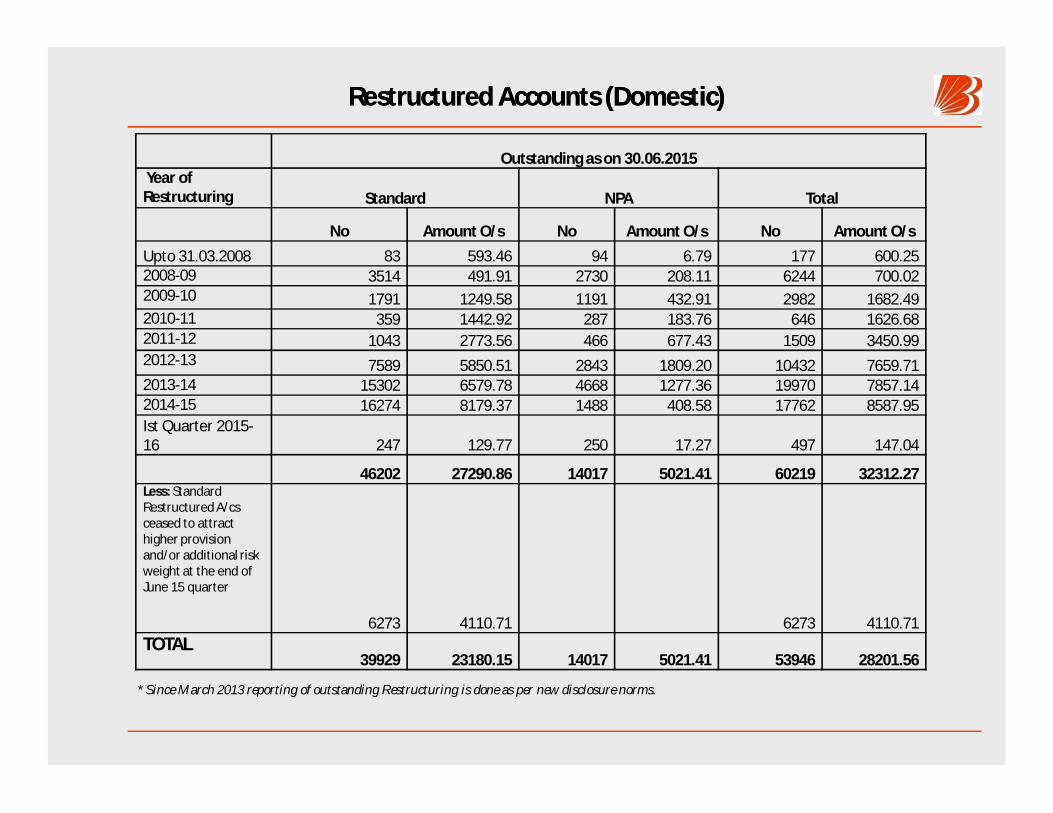
Restructured Accounts (Domestic)Restructured Accounts (Domestic)
Outstanding as on 30.06.2015 Year of Restructuring Standard NPA Total
No Amount O/s No Amount O/s No Amount O/sUpto 31.03.2008 83 593.46 94 6.79 177 600.252008-09 3514 491.91 2730 208.11 6244 700.022009-10 1791 1249.58 1191 432.91 2982 1682.492010-11 359 1442.92 287 183.76 646 1626.682011-12 1043 2773.56 466 677.43 1509 3450.992012-13 7589 5850.51 2843 1809.20 10432 7659.712013-14 15302 6579.78 4668 1277.36 19970 7857.142014-15 16274 8179.37 1488 408.58 17762 8587.95Ist Quarter 2015-16 247 129.77 250 17.27 497 147.04
46202 27290.86 14017 5021.41 60219 32312.27Less: Standard Restructured A/cs ceased to attract higher provision and/or additional risk weight at the end of June 15 quarter
6273 4110.71 6273 4110.71TOTAL
39929 23180.15 14017 5021.41 53946 28201.56
* Since March 2013 reporting of outstanding Restructuring is done as per new disclosure norms.
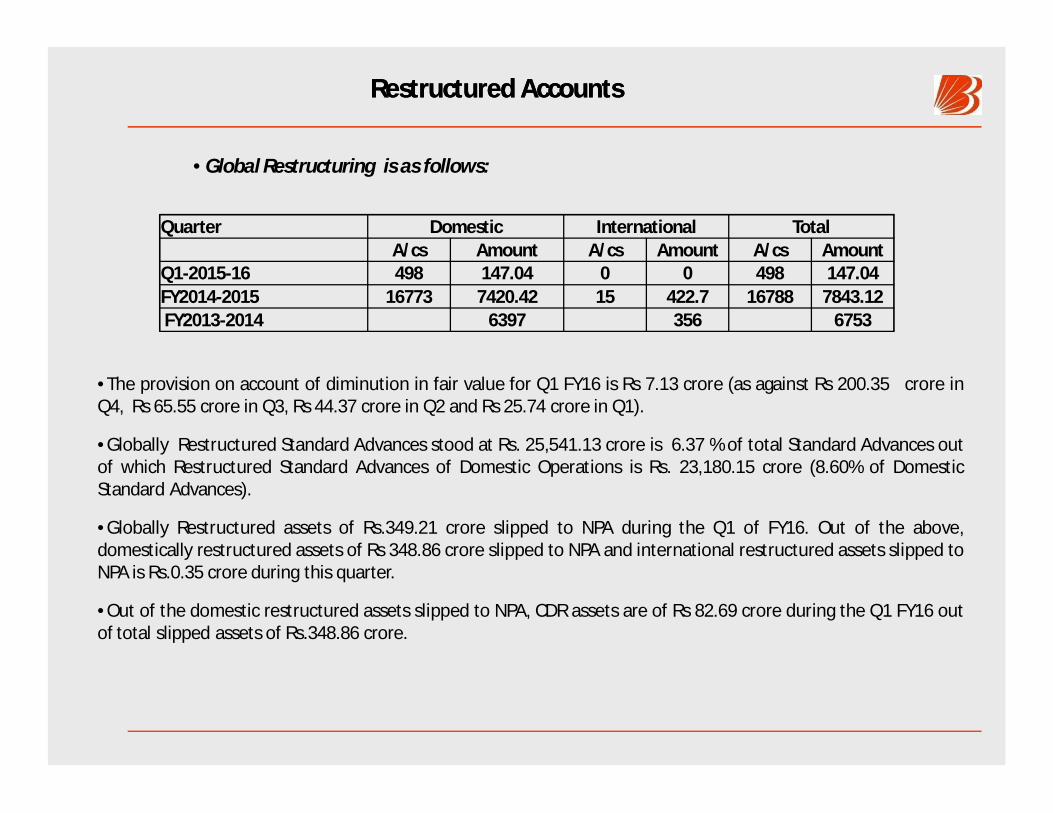
Restructured Accounts Restructured Accounts
•Global Restructuring is as follows:
Quarter Domestic International TotalA/cs Amount A/cs Amount A/cs Amount
Q1-2015-16 498 147.04 0 0 498 147.04FY2014-2015 16773 7420.42 15 422.7 16788 7843.12FY2013-2014 6397 356 6753
•The provision on account of diminution in fair value for Q1 FY16 is Rs 7.13 crore (as against Rs 200.35 crore inQ4, Rs 65.55 crore in Q3, Rs 44.37 crore in Q2 and Rs 25.74 crore in Q1).
•Globally Restructured Standard Advances stood at Rs. 25,541.13 crore is 6.37 % of total Standard Advances outof which Restructured Standard Advances of Domestic Operations is Rs. 23,180.15 crore (8.60% of DomesticStandard Advances).
•Globally Restructured assets of Rs.349.21 crore slipped to NPA during the Q1 of FY16. Out of the above,domestically restructured assets of Rs 348.86 crore slipped to NPA and international restructured assets slipped toNPA is Rs.0.35 crore during this quarter.
•Out of the domestic restructured assets slipped to NPA, CDR assets are of Rs 82.69 crore during the Q1 FY16 outof total slipped assets of Rs.348.86 crore.
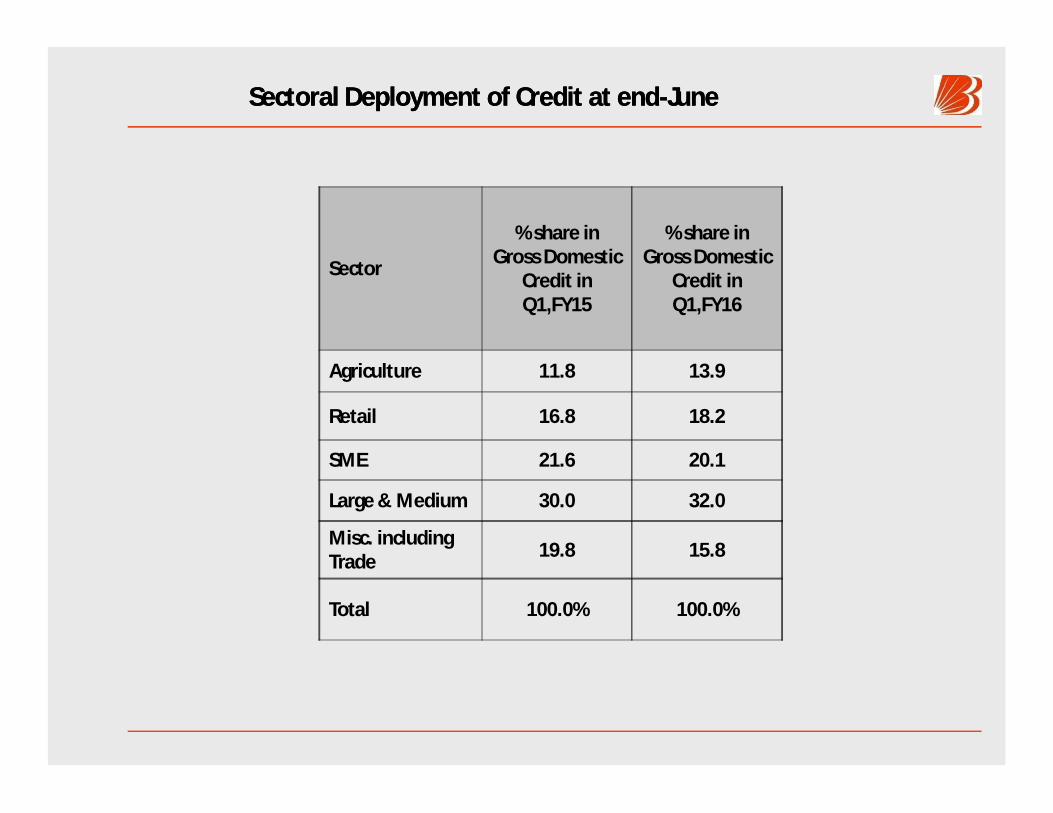
SectoralSectoral Deployment of Credit at endDeployment of Credit at end--JuneJune
Sector
% share in Gross Domestic
Credit in Q1,FY15
% share in Gross Domestic
Credit in Q1,FY16
Agriculture 11.8 13.9
Retail 16.8 18.2
SME 21.6 20.1
Large & Medium 30.0 32.0
Misc. including Trade 19.8 15.8
Total 100.0% 100.0%
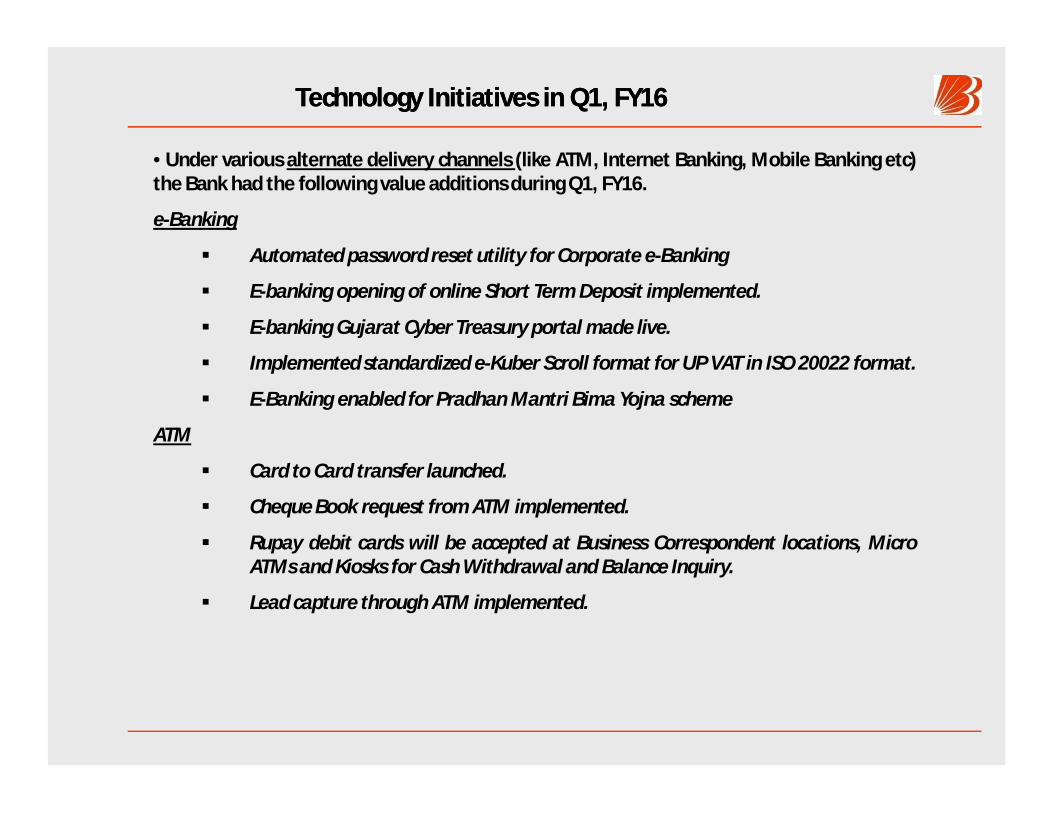
Technology Initiatives in Q1, FY16Technology Initiatives in Q1, FY16
•Under various alternate delivery channels (like ATM, Internet Banking, Mobile Banking etc)the Bank had the following value additions during Q1, FY16.
e-Banking
Automated password reset utility for Corporate e-Banking
E-banking opening of online Short Term Deposit implemented.
E-banking Gujarat Cyber Treasury portal made live.
Implemented standardized e-Kuber Scroll format for UP VAT in ISO 20022 format.
E-Banking enabled for Pradhan Mantri Bima Yojna scheme
ATM
Card to Card transfer launched.
Cheque Book request from ATM implemented.
Rupay debit cards will be accepted at Business Correspondent locations, MicroATMs and Kiosks for Cash Withdrawal and Balance Inquiry.
Lead capture through ATM implemented.
Technology Initiatives in Q1,FY16Technology Initiatives in Q1,FY16
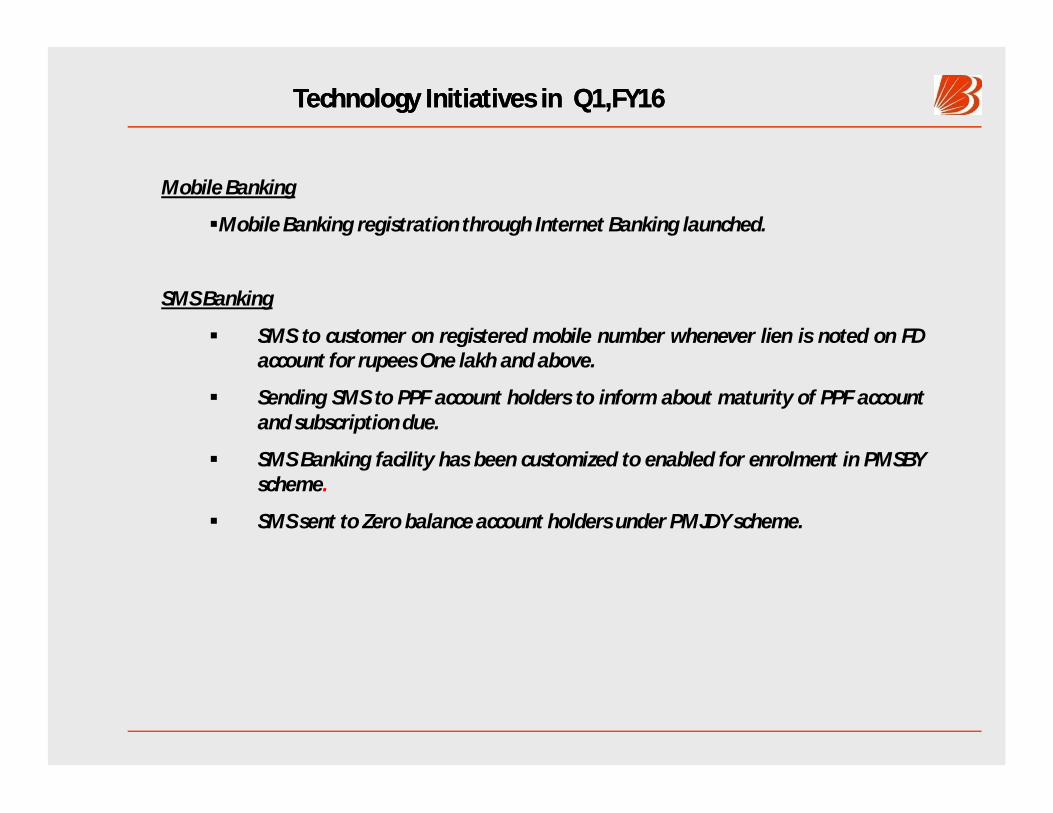
Mobile Banking
Mobile Banking registration through Internet Banking launched.
SMS Banking
SMS to customer on registered mobile number whenever lien is noted on FDaccount for rupees One lakh and above.
Sending SMS to PPF account holders to inform about maturity of PPF accountand subscription due.
SMS Banking facility has been customized to enabled for enrolment in PMSBYscheme.
SMS sent to Zero balance account holders under PMJDY scheme.
Bank’s BPR Project Bank’s BPR Project –– New Initiatives in Q1, FY16New Initiatives in Q1, FY16
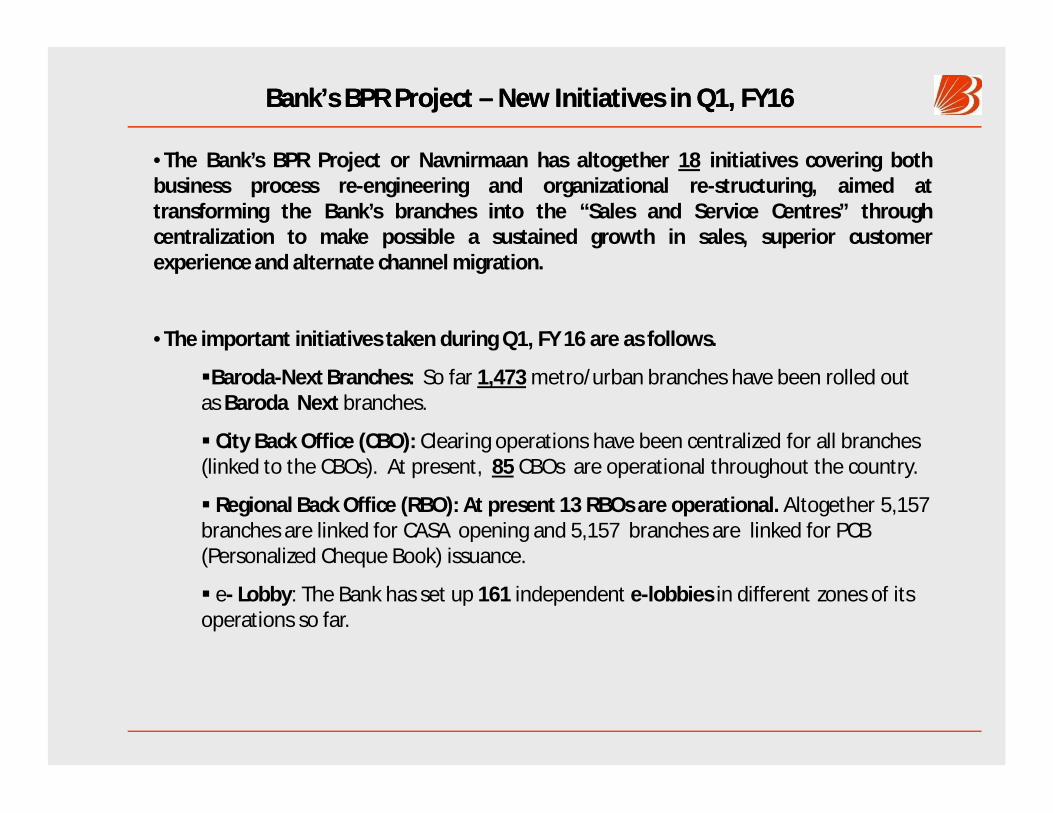
•The Bank’s BPR Project or Navnirmaan has altogether 18 initiatives covering bothbusiness process re-engineering and organizational re-structuring, aimed attransforming the Bank’s branches into the “Sales and Service Centres” throughcentralization to make possible a sustained growth in sales, superior customerexperience and alternate channel migration.
•The important initiatives taken during Q1, FY 16 are as follows.
Baroda-Next Branches: So far 1,473 metro/urban branches have been rolled out as Baroda Next branches.
City Back Office (CBO): Clearing operations have been centralized for all branches (linked to the CBOs). At present, 85 CBOs are operational throughout the country.
Regional Back Office (RBO): At present 13 RBOs are operational. Altogether 5,157 branches are linked for CASA opening and 5,157 branches are linked for PCB (Personalized Cheque Book) issuance.
e- Lobby: The Bank has set up 161 independent e-lobbies in different zones of its operations so far.
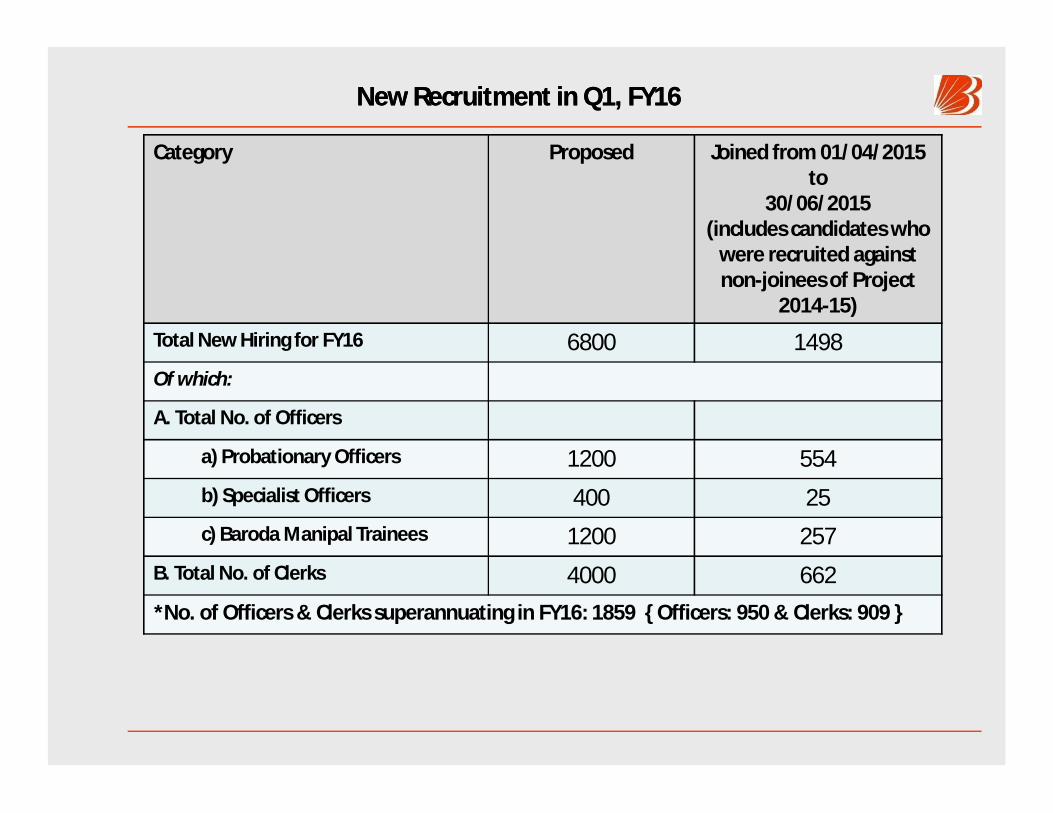
New Recruitment in Q1, FY16New Recruitment in Q1, FY16
Category Proposed Joined from 01/04/2015 to
30/06/2015(includes candidates who
were recruited against non-joinees of Project
2014-15)
Total New Hiring for FY16 6800 1498Of which:
A. Total No. of Officers
a) Probationary Officers 1200 554b) Specialist Officers 400 25c) Baroda Manipal Trainees 1200 257
B. Total No. of Clerks 4000 662*No. of Officers & Clerks superannuating in FY16: 1859 { Officers: 950 & Clerks: 909 }

Bank’s Forward Guidance
• The IIP, exports & agriculture indicate subdued growth amidst gradual signs of improvement ineconomy as reflected in the CMIEs project investment data and capital goods imports .
•Against the back drop of lower crude oil prices, the fuel price inflation is expected to be weak, however,the inflation trajectory of CPI is increasing on the back of rising food prices. Also, risks to inflation havegrown on account of below normal monsoon in Jul, 2015.
•However, the efforts of the government is underway to improve the investment climate throughacceleration of project approvals, ease of doing business and striving to pass key legislations.
• The Bank aspires for consistent growth with improvement in profitability & focusing on core areas likeCASA, Retail lending, improving asset quality and non-interest income. By rebalancing the loan book, theBank would improve its domestic NIM; increasing the ROAA by further improving the CASA share andimproving the yield on advances on the back of improving investment climate .
•On the qualitative side, the Bank’s endeavours at BPR, Capacity Building, Technology Up-gradation,Talent Management & Training, Marketing, etc. would continue with full vigour.
•The Bank is continuously evolving its Strategic Focus to cope with changing circumstances byconsolidating its Core Competencies while striding ahead by adapting its business model in sync with thechanging economic and banking environment.

Thank you.