Bank competition and collateral: theory and evidence
40
Christa Hainz – Laurent Weill – Christophe J Godlewski Bank competition and collateral: theory and evidence Bank of Finland Research Discussion Papers 27 • 2008
Transcript of Bank competition and collateral: theory and evidence

Christa Hainz – Laurent Weill – Christophe J Godlewski
Bank competition and collateral: theory and evidence
Bank of Finland ResearchDiscussion Papers27 • 2008

Suomen Pankki Bank of Finland
PO Box 160 FI-00101 HELSINKI
Finland +358 10 8311
http://www.bof.fi

Bank of Finland Research Discussion Papers 27 • 2008
Christa Hainz* – Laurent Weill** – Christophe J Godlewski***
Bank competition and collateral: theory and evidence
The views expressed in this paper are those of the authors and do not necessarily reflect the views of the Bank of Finland. * University of Munich, Munich. E-mail: christa.hainz@
lrz.uni-muenchen.de. ** Universite Robert Schuman, Strasbourg. E-mail:
[email protected]. Corresponding author. *** University of Strasbourg, Strasbourg. E-mail:

http://www.bof.fi
ISBN 978-952-462-474-9 ISSN 0785-3572
(print)
ISBN 978-952-462475-6 ISSN 1456-6184
(online)
Helsinki 2008
3
Bank competition and collateral: theory and evidence
Bank of Finland Research Discussion Papers 27/2008
Christa Hainz – Laurent Weill – Christophe J Godlewski Monetary Policy and Research Department Abstract
We investigate the impact of bank competition on the use of collateral in loan contracts. We develop a theoretical model incorporating information asymmetries in a spatial competition framework where banks choose between screening the borrower and asking for collateral. We show that presence of collateral is more likely when bank competition is low. We then test this prediction empirically on a sample of bank loans from 70 countries. We estimate logit models where the presence of collateral is regressed on bank competition, measured by the Lerner index. Our empirical tests corroborate the theoretical predictions that bank competition reduces the use of collateral. These findings survive several robustness checks. Keywords: collateral, bank competition, asymmetric information JEL classification numbers: G21, D43, D82.

4
Kilpailun vaikutukset pankkien vakuuspolitiikkaan
Suomen Pankin keskustelualoitteita 27/2008
Christa Hainz – Laurent Weill – Christophe J. Godlewski Rahapolitiikka- ja tutkimusosasto Tiivistelmä
Tässä tutkimuksessa tarkastellaan pankkien välisen kilpailun vaikutuksia niiden myöntämien luottojen vakuuskäytäntöihin. Työn teoreettisen osan analyysi perus-tuu epäsymmetrisellä informaatiolla täydennettyyn spatiaalisen kilpailun malliin. Siinä pankit valintansa mukaan joko seulovat laina-asiakkaansa tai vaativat vakuuksia myöntämilleen lainoille. Mallin mukaan vakuuksien käyttö on todennä-köisempää, kun pankkien välinen kilpailu on vähäistä. Tätä mallin implikaatiota testataan työn empiirisessä osassa hyödyntämällä 70 maan aineistoa pankkien myöntämistä lainoista. Estimoivassa logit-mallissa pankkien vakuuksien käytön todennäköisyyttä selitetään pankkien välistä kilpailua mittaavalla ns. Lerner-indeksillä. Estimointitulokset tukevat teoreettisen mallin keskeistä implikaatiota, että vakuuksien käyttö vähenee, kun pankkien välinen kilpailu kiristyy. Avainsanat: vakuudet, pankkien välinen kilpailu, epäsymmetrinen informaatio JEL-luokittelu: G21, D43, D82

5
Contents
Abstract .................................................................................................................... 3 Tiivistelmä (abstract in Finnish) .............................................................................. 4 1 Introduction ...................................................................................................... 7 2 Theoretical model ............................................................................................. 9 2.1 Set up of the model .................................................................................... 9 2.2 Collateralized credit contract ................................................................... 11 2.3 Screening contract ................................................................................... 12 2.4 One bank screens, the other bank collateralizes ...................................... 13 2.5 Comparison of contracts .......................................................................... 15 3 Empirical evidence ......................................................................................... 16 3.1 Data and variables ................................................................................... 16 3.2 The measurement of bank competition.................................................... 19 3.3 Results ..................................................................................................... 20 4 Concluding remarks ....................................................................................... 26 References .............................................................................................................. 27 Appendix ................................................................................................................ 30

6
7
1 Introduction
Following the significant structural changes of the banking industry witnessed around the globe, much theoretical and empirical work has examined the economic role of bank competition in recent years.1 Among others, the impact of bank competition on the access to bank finance has been investigated, as benefits from bank competition are intuitively expected from lower loan rates which should favor this access (eg Beck, Demirgüc-Kunt and Maksimovic, 2004). Nevertheless, the role of bank competition on the access to bank finance also depends on its effects on collateral use, as collateral requirements are repeatedly mentioned as a major financing obstacle. For instance, by relying on the World Business Environment Survey (WBES) survey for firms in 80 countries, Beck et al (2006) report that collateral requirements are rated as the third most important obstacle among 12 financing obstacles, just after high interest rates and access to long-term loans. One can therefore wonder how bank competition influences the use of collateral. However research on the effect of bank competition on collateral is impressively poor. To investigate this effect, we develop a theoretical model with asymmetric information about the firm’s creditworthiness. Banks can solve the resulting adverse selection problem either by screening or by collateralization. With a screening contract banks have to incur costs, that increase in the distance to the firm, to get a perfect signal on the creditworthiness. Since they can observe the firm’s location, they are able to price-discriminate. With a collateralized contract firms self-select themselves, but costs arise if collateralized assets are liquidated. We show that firms that are located close to a bank are financed by a screening contract and those further away by a collateralized contract. The reason is that the banks offer the most cost-efficient contract and screening costs are low for those firms that are close to the bank. As the number of banks increases and competition intensifies the fraction of firms financed by a screening contract increases. We then test empirically our theoretical predictions with a cross-country analysis on a sample of 4931 bank loans from 70 countries. We perform logit regressions of the presence of collateral on bank competition. Bank competition is measured by the Lerner index, which infers bank’ conduct directly and then informs on the actual behavior of the bank. The empirical analysis confirms the model’s prediction that bank competition decreases the use of collateral. There are a few papers about the relationship between bank competition and collateralization. The theoretical papers study how either the adverse selection or 1 See the special issue of the Journal of Money, Credit and Banking in 2004 (vol. 36, no. 3) on this topic.

8
the moral hazard problem is solved by collateralization. Manove, Padilla and Pagano (2001) use a model in which banks choose between screening the borrower and asking the latter to pledge collateral. In their model, the bank gets a signal whether a firm will repay or not through screening but only a signal about their probability to repay through collateralization. Competing banks offer different contracts that allow firms with a high probability to repay to collateralize which is more attractive to them than a screening contract. However, socially it would be beneficial to have all firms screened and the monopolistic bank as a residual claimant would screen them. Thus, the paper predicts that borrowers are more likely to post collateral in competitive markets than in monopolistic markets. Berlin and Butler (2002) develop a model based on the possibility of renegotiation between the bank and the borrower. This renegotiation can take place after the completion of the initial loan contract and depends on new information obtained by the bank. They support the view that bank competition leads to lower collateral requirements, which results from the incentives of the bank to proceed to renegotiation. Both former models consider the role of collateral in solving adverse selection problems, and offer opposing predictions. In contrast, Hainz (2003) proposes a model in which collateral helps solving moral hazard problems. At the same time, collateral can be used to extract rent from borrowers. Through collateralization the payoff of the firm in the case of failure is reduced. This allows the bank to demand a higher repayment in the case of success, without destroying the firm’s incentives. This model predicts that competition reduces the use of collateral. On the empirical side, two recent papers can be related to the impact of bank competition on the use of collateral, although they do not focus on this issue. Jimenez, Salas and Saurina (2006) investigate a wide range of determinants of the presence of collateral on a large sample of loans granted by Spanish banks. They notably analyze the impact of bank concentration, measured by the Herfindahl index, and find a negative impact of bank concentration on collateral use. Berger et al (2007) test whether the adoption of a lending technology reducing ex ante information asymmetries, ie small business credit scoring, is associated with lower collateral use in loan contracts in the US. Bank concentration measured by the Herfindahl index is included as a control variable. They find no significant sign for bank concentration to explain the incidence of collateral in their estimations. We can thus point out that the theoretical literature provides conflicting predictions which lack of empirical tests to their validation. The aim of this paper is to provide a broad and consistent analysis of the role of bank competition on the use of collateral, based on theoretical and empirical investigation. In an innovative theoretical explanation, we incorporate information asymmetries in an industrial organization framework. Our theoretical model is related to Manove, Padilla and Pagano (2001) but we differ from this model in two major aspects. The first

9
difference concerns the fact that banks are not lazy in our model, in the sense that there is no additional information on the borrower that the bank can obtain. The second difference is the modeling of the market structure. Following recent theoretical works on bank competition (eg Dell’Arricia, 2001; Hauswald and Marquez, 2006), we consider a spatial competition framework based on a circular economy. Such representation is closer to the reality of banking markets, marked more by differentiation, than monopoly or oligopoly. That geographical distance shapes lending rates of banks is empirically shown by Degryse and Ongena (2005). We also depart from the empirical studies in two important respects. We do not focus on a single country for our study which may lead to country-specific results but we perform a cross-country analysis. By measuring bank competition with the Lerner index we infer the banks’ conduct directly, which is in line with the recent empirical works on bank competition (Martin, Salas and Saurina, 2006; Maudos and Fernandez de Guevara, 2004, 2007). Thereby, we do not have to rely on concentration measures that infer the degree of competition from indirect proxies such as market shares. The rest of the paper is organized as follows. Section 2 presents the theoretical model. In section 3, we develop the empirical results. We finally provide some concluding remarks in section 4. 2 Theoretical model
2.1 Set up of the model
We start by describing the characteristics of the firms possibly applying for a loan and the banking sector. Firms want to undertake an investment project that costs I. Due to the lack of own liquid funds, the firms need to finance their investment through credit. The firm’s owners are endowed with an asset A > I that can potentially be offered as collateral. There exists a continuum of firms the number of which is normalized to 1. Firms are distributed uniformly around a circle of length 1. The fraction of good firms is μ and that of bad firms is (1–μ). The good firms have a project that is successful with probability p. In the case of success, the project’s payoff is X, in the case of failure it is 0. Thus, the expected payoff of a good firm is pX – I > 0, which we assume to be positive. Bad firms will fail with probability 1. If bad firms receive a loan, they take the money and run. Since there are no costs of application, both good and bad firms apply for loans. We consider a banking sector with N identical banks that are located equidistantly around the circle. Accordingly, the distance between two banks is
10
N1 . Banks compete in repayments. They cannot observe the firm’s type, ie
whether a particular firm is good or bad. However, they know the distribution of good and bad firms. Moreover, banks can observe the firm’s location. Having this information allows a bank to price-discriminate because it can make the offer contingent on the firm’s location. We assume that banks possess enough funds to finance all firms that apply for loans and that the firms’ returns (and in the case of collateralization their assets) are high enough such that the market is covered. Banks have two means to discriminate between good and bad firms: they either offer a collateralized credit contract which induces firms to signal their type, or they screen all firms applying for credit by evaluating their credit proposals. In the case of screening, banks receive a perfect signal about a firm’s creditworthiness. The screening costs c are proportional to the distance d between bank and firm, ie the further away a firm is located from a bank, the higher are the screening cost. The idea is that the bank already possesses more costless information if a firm is located close-by because, for instance, through a relationship it can observe the firm’s daily business, quality of management or competitive position. Consequently, the effort the bank has to incur to get a perfect signal is lower.2 Alternatively, distance could be interpreted as a measure for the strength of the relationship between the bank and the firm. A screening contract is viable because we assume that even with financing a firm that is located next to the competing bank, the latter could make non-negative profits, ie
0N1cIpX ≥−− .
In the case of collateralization, the bank gets a payoff from the collateralized assets that are liquidated if the project fails. There are costs associated with liquidation. Therefore, the liquidation value of each unit of collateral, denoted by α, is lower than the continuation value of the firm, ie, α < 1. We want to render collateralization a viable option if the competitor offers a screening contract. Therefore we assume that at least for the customer that is located half-way between two banks, the costs of a collateralized contract are below those of a
screening contract, ie N2cI)1)(p1( <α−− . Moreover, we assume that for firms
located closer to the bank that offers the screening contract, screening is a viable
option by assuming I)1)(p1(N4c α−−< . Note that offering a contract without
either screening or collateralization does not pay off, because we assume that μpX – I < 0.
2 Agarwal and Hauswald (2007) provide empirical evidence that distance matters for the informativeness of a signal. We capture the impact of distance not on the informativeness of the signal (as in Hauswald and Marquez, 2006) but on the costs needed to generate a perfect signal.

11
The timing of the game is as follows. In the first stage, banks decide simultaneously which type of contract they offer. In the second stage, banks determine simultaneously the terms of the credit contract they offer. Firms apply at the bank which offers the contract with the most favourable terms. We assume that if banks offer the same repayments, firms apply at the closest bank.3 Finally, payoffs are realized. We solve the game by backward induction. Thus, we first analyse the contract terms for a situation in which either both banks offer the same type of contract or different types of contracts. In a second step, we show when a particular contract is optimal. In our model, each firm has two banks that are in its neighbourhood. We denote the bank that is closest to the firm as bank 1 and the other bank as bank 2. Without loss of generality, we can restrict our analysis to the competition between one bank and its nearest competitor. Thus, we analyze competition for firms that
are located at a distance ⎥⎦⎤
⎢⎣⎡∈
N21;0d from bank 1.
2.2 Collateralized credit contract
We first suppose that all banks offer a collateralized credit contract. Firms compare the repayments announced by the bank and choose the contract with the most favourable terms. Collateralization implies that the firm repays an amount RL in the case of success and that it loses collateral in the amount L in the case of failure. The credit contract has to be designed in a way that the bad firms have no incentive to demand credit. This is reached through collateralization. The incentive compatibility constraint for a bad firm can be written as
)L_BF.IC(ILorA)LA(I
≥≤−+
If a bad firm receives a loan in the amount of I (and runs away with the money), it will lose assets in the amount of L as the project fails with certainty. Therefore, it is obvious that the amount of collateral that prevents bad firms from applying for credit is I. As a result, bad firms do not apply for loans. Moreover, the good firm has to be as well off with a loan as without a loan, ie
A)IA)(p1()RXA(p L ≥−−+−+ . Finally, the bank must be willing to offer a contract because its participation constraint is fulfilled as well, ie
3 We would obtain the same qualitative result if firms had to incur some cost of application.

12
0II)p1(pR L ≥−−α+ . The results are summarized in the following lemma where ΠL denotes the bank’s expected profits: Lemma 1: With a collateralized contract, each bank demands
p))p1(1(IR L α−−= as a repayment and collateral L = I, and serve firms up to a
distance of N21 . Each bank makes zero expected profits.
Proof: See the Appendix. Banks have identical cost structures because the liquidation value of collateral is the same for all. This means that there is perfect competition between banks which drives their profits down to zero. They all demand the same repayments and therefore they serve firms up to the marginal customer which is located half-way between a bank and its competitor. No bank has an incentive to demand a higher repayment because then it would lose the customer. It does not have an incentive to undercut either because then it would make a loss. The repayment is determined by the bank’s participation constraint. Note that the firm’s participation constraint is fulfilled because otherwise collateralization would not be a viable option. 2.3 Screening contract
We next suppose that all banks offer a screening contract. The distance to bank 1
is d, the one to bank 2 is dN1 − . The bank demands a repayment RS in the case of
success and zero otherwise, because the owner’s personal assets are not pledged as collateral. To break even, the bank needs a repayment of RS that is determined by its participation constraint which is (where subscripts 1, 2 are used to denote the bank)
)S_1B.PC(0cdIpRS1 ≥−− for bank 1 and
)S_2B.PC(0dN1cIpRS
2 ≥⎟⎠⎞
⎜⎝⎛ −−− for bank 2
Banks can price-discriminate and they marginally undercut the competitors offer. Since we assume that firms take the loan from the closest bank, this implies that bank 1 demands the same repayment as bank 2. We summarize the result in the following lemma.

13
Lemma 2: With a screening contract, each bank demands a repayment of
⎟⎟⎠
⎞⎜⎜⎝
⎛⎟⎠⎞
⎜⎝⎛ −+= d
N1cI
p1RS and serves all firms up to a distance of
N21 . Each bank
makes an expected profit per customer of dc2NcS −=Π .
Proof: See the Appendix. Since banks can price-discriminate the repayment they demand depends on the firm’s outside option. This outside option is to take a loan from bank 2. The further away is bank 2 the higher the repayment bank 2 needs to break-even. This implies that a firm has to repay more the closer it is located to bank 1. This paradoxical situation is due to the hold-up problem which the firm faces and is supported by empirical evidence (Degryse and Ongena, 2005). In equilibrium, each bank serves all customers up to the one that is located half-way between the bank and its competitor. Banks can extract rents and thereby make positive expected profits per customer that decrease for more distant customers. Distance influences the bank’s profit through two channels. First, the further away a firm from bank 1, the lower the repayment demanded by bank 2. Second, for these firms the screening costs of bank 1 are higher which additionally reduces the profit. 2.4 One bank screens, the other bank collateralizes
We first study the case in which bank 1 offers a screening contract and bank 2 a collateralized contract (therefore we use the superscript SL to denote by S (L) that bank 1 (2) offers a screening (collateralized) contract). Then a firm that is located at a distance d from bank 1 has the outside option of getting a collateralized credit contract from bank 2. It depends on the the firm’s location which contract is the least costly. The results are summarized in the following lemma: Lemma 3: Suppose bank 1 offers a screening contract and bank 2 a collateralized
contract. Bank 1 serves firms that are located at a distance c
)1)(p1(Id~d α−−≡≤
through a screening contract with p
)1)(p1(1IRSL1
α−−+= . With each of these
firms bank 1 makes an expected profit per customer of cdI)1)(p1(SL1 −α−−=Π .
Bank 2 finances firms that are located at N21dd~ ≤< through a collateralized

14
contract demanding pcdIRSL
2 += and L = I. With each firm bank 2 makes an
expected profit per customer of I)1)(p1(cdSL2 α−−−=Π .
Proof: See the Appendix. The firm has the outside option to demand a collateralized credit contract from bank 2. Bank 2 offers a contract that breaks even (see Lemma 1). Given this offer, bank 1 has to decide which repayment to demand. For firms that are located close to bank 1, bank 1 has low screening costs and it can match the expected repayment that bank 2 demands for a collateralized contract. This repayment is higher than the repayment bank 1 needs to break even. With these firms, bank 1 makes positive expected profits. The closer a firms is located to the bank, the lower are the bank’s screening costs and the higher is its profit. However, for firms that are located further away from bank 1 the screening costs can exceed the costs of a collateralized contract. Thus, bank 2 has a cost advantage and can match bank 1’s offer. These firms will choose the collateralized contract and be financed by bank 2. With these firms, bank 2 makes positive expected profits. The profits per customer are higher the further away the firm is from bank 1 because the hold-up problem the firms face (by bank 2) is more severe. Next, we study a situation in which bank 1 offers a collateralized contract and
bank 2 a screening contract. Bank 2 needs a repayment of ⎟⎠⎞
⎜⎝⎛ −+= d
N1cI
p1RS to
break even when serving a customer that is located at a distance d from bank 1. The result is as follows: Lemma 4: Suppose bank 1 offers a collateralized contract and bank 2 a screening
contract. Bank 1 finances firms in a distance N21d ≤ through a collateralized
contract with p
dN1c
IR LS1
⎟⎠⎞
⎜⎝⎛ −
+= and L = I. It makes expected profits of
I)1)(p1(dN1cLS
1 α−−−⎟⎠⎞
⎜⎝⎛ −=Π .
Proof: See the Appendix.
The firms we are looking at are located at a distance more of than N21 from bank
2. This implies that it is rather costly for bank 2 to screen and, consequently, the

15
repayment must be sufficiently high to cover these screening costs. As a result, bank 1 can win the competition by matching bank 2’s offer. The closer a firm is to bank 1, the higher is the repayment bank 2 needs to break even and the worse is the firm’s outside option. For bank 1 these firms are particularly profitable because for them the hold-up problem is most severe. Therefore, bank 1’s profit decreases in the distance to the firm. 2.5 Comparison of contracts
Solving the game by backward induction, we next identify the contracts that are offered by banks. Therefore, we look for the Nash equilibrium and we get the following result for the contracts through which a firm is financed: Proposition 1: In equilibrium, firms that are located at a distance of
c)p1)(1(Id~d −α−≡≤ are financed by a screening contract. Firms that are located
further away are financed by a collateralized contract. Proof: See the Appendix. When deriving the Nash equilibrium, we find that given that the other bank offers a collateralized credit contract, offering a screening contract is a (weakly) dominant strategy. However, the best response of a bank to the competitor offering a screening contract depends on the distance of the firm to which this contract is offered. For bank 1 this means that the best response is to offer a screening contract for all firms up to a distance of d~ and the (weakly) best response is to offer a collateralized contract for those firms that are located further away. For bank 2 the (weakly) best response if bank 1 offers a screening contract, is to offer a screening contract as well as long as d is below another threshold
d~d̂ > and to offer a collateralized contract for those firms that are located further away. The Nash equilibrium is that both banks offer a screening contract if d~d ≤ and firms are financed by bank 1. For d̂dd~ ≤< , the weakly dominant strategy of bank 1 (bank 2) is to offer a collateralized (screening) contract. As a result, firms in this parameter range will be financed by bank 1 with a collateralized contract.
Finally, if N21dd~ << , both banks offer collateralized contracts and firms are
financed by bank 1. We use this result to study the impact of bank competition on collateralization and find that:
16
Proposition 2: The fraction of firms financed by a collateralized contract decreases as the banking sector becomes more competitive, ie N is higher. Proof: See the Appendix. Up to the threshold d~ firms are screened. This threshold does not change with the number of banks. However, as the number of banks increases, the distance between banks decreases. This means that the ‘range’ in which collateralized contract are offered shrinks. As a result, the fraction of screening contracts among all contracts increases. 3 Empirical evidence
The theoretical model shows that greater bank competition lowers collateral requirements. We now bring empirical evidence to bear on this issue. We first describe data and variables, before explaining how we measure bank competition. We then develop the empirical results. 3.1 Data and variables
The sample of bank loans is obtained from the Dealscan database, which is supplied by the Loan Pricing Corporation (LPC, Reuters). This database is commonly used in empirical studies on bank loans (eg Dahiya et al, 2003; Bharath et al, 2007; Qian and Strahan, 2007). We use loan data for the period January 2000 to December 2005 as it is the period with the best coverage for both loans and banks. Following Qian and Strahan (2007), we drop loans to firms from the financial industry (SIC 6) and from the public sector (SIC 9). Public ownership or the monopoly situation is likely to influence the risk of loans granted to these firms, which may bias the use of collateral in comparison to what would be observed in manufacturing and other services. These criteria produced a sample of 4,931 bank loans made to borrowers located in 70 countries. A list of countries is displayed in table 1.
17
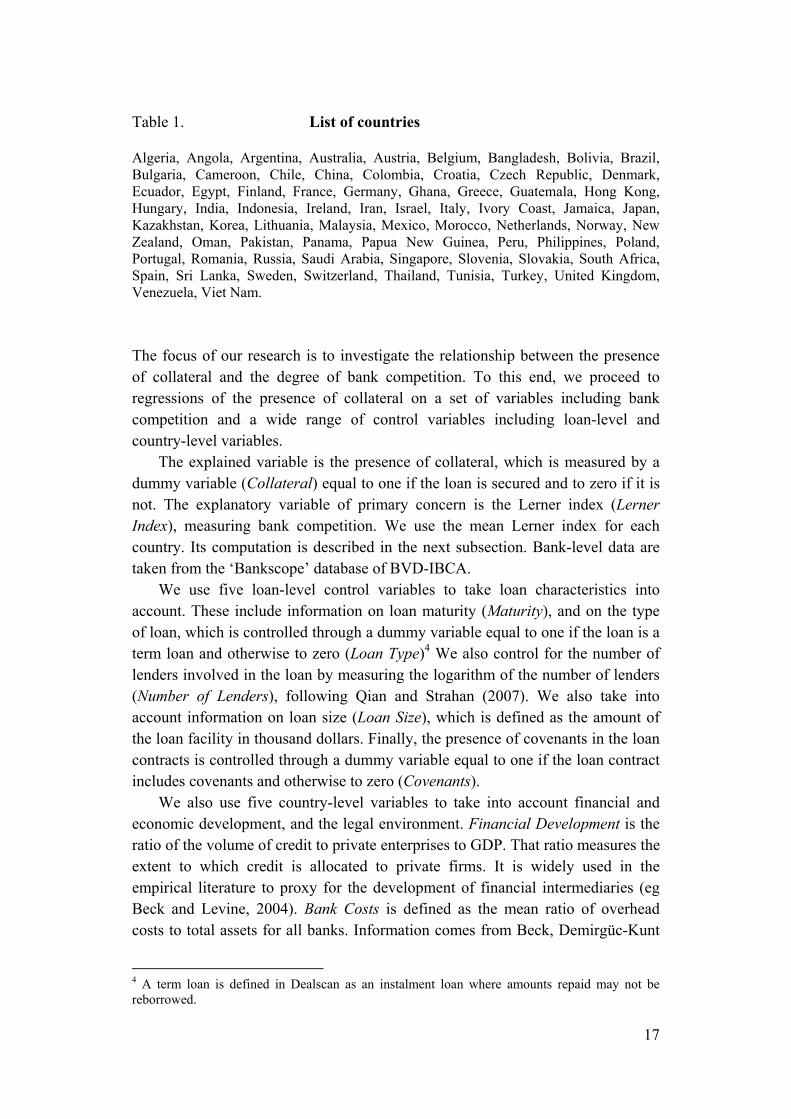
Table 1. List of countries Algeria, Angola, Argentina, Australia, Austria, Belgium, Bangladesh, Bolivia, Brazil, Bulgaria, Cameroon, Chile, China, Colombia, Croatia, Czech Republic, Denmark, Ecuador, Egypt, Finland, France, Germany, Ghana, Greece, Guatemala, Hong Kong, Hungary, India, Indonesia, Ireland, Iran, Israel, Italy, Ivory Coast, Jamaica, Japan, Kazakhstan, Korea, Lithuania, Malaysia, Mexico, Morocco, Netherlands, Norway, New Zealand, Oman, Pakistan, Panama, Papua New Guinea, Peru, Philippines, Poland, Portugal, Romania, Russia, Saudi Arabia, Singapore, Slovenia, Slovakia, South Africa, Spain, Sri Lanka, Sweden, Switzerland, Thailand, Tunisia, Turkey, United Kingdom, Venezuela, Viet Nam. The focus of our research is to investigate the relationship between the presence of collateral and the degree of bank competition. To this end, we proceed to regressions of the presence of collateral on a set of variables including bank competition and a wide range of control variables including loan-level and country-level variables. The explained variable is the presence of collateral, which is measured by a dummy variable (Collateral) equal to one if the loan is secured and to zero if it is not. The explanatory variable of primary concern is the Lerner index (Lerner Index), measuring bank competition. We use the mean Lerner index for each country. Its computation is described in the next subsection. Bank-level data are taken from the ‘Bankscope’ database of BVD-IBCA. We use five loan-level control variables to take loan characteristics into account. These include information on loan maturity (Maturity), and on the type of loan, which is controlled through a dummy variable equal to one if the loan is a term loan and otherwise to zero (Loan Type)4 We also control for the number of lenders involved in the loan by measuring the logarithm of the number of lenders (Number of Lenders), following Qian and Strahan (2007). We also take into account information on loan size (Loan Size), which is defined as the amount of the loan facility in thousand dollars. Finally, the presence of covenants in the loan contracts is controlled through a dummy variable equal to one if the loan contract includes covenants and otherwise to zero (Covenants). We also use five country-level variables to take into account financial and economic development, and the legal environment. Financial Development is the ratio of the volume of credit to private enterprises to GDP. That ratio measures the extent to which credit is allocated to private firms. It is widely used in the empirical literature to proxy for the development of financial intermediaries (eg Beck and Levine, 2004). Bank Costs is defined as the mean ratio of overhead costs to total assets for all banks. Information comes from Beck, Demirgüc-Kunt
4 A term loan is defined in Dealscan as an instalment loan where amounts repaid may not be reborrowed.
18
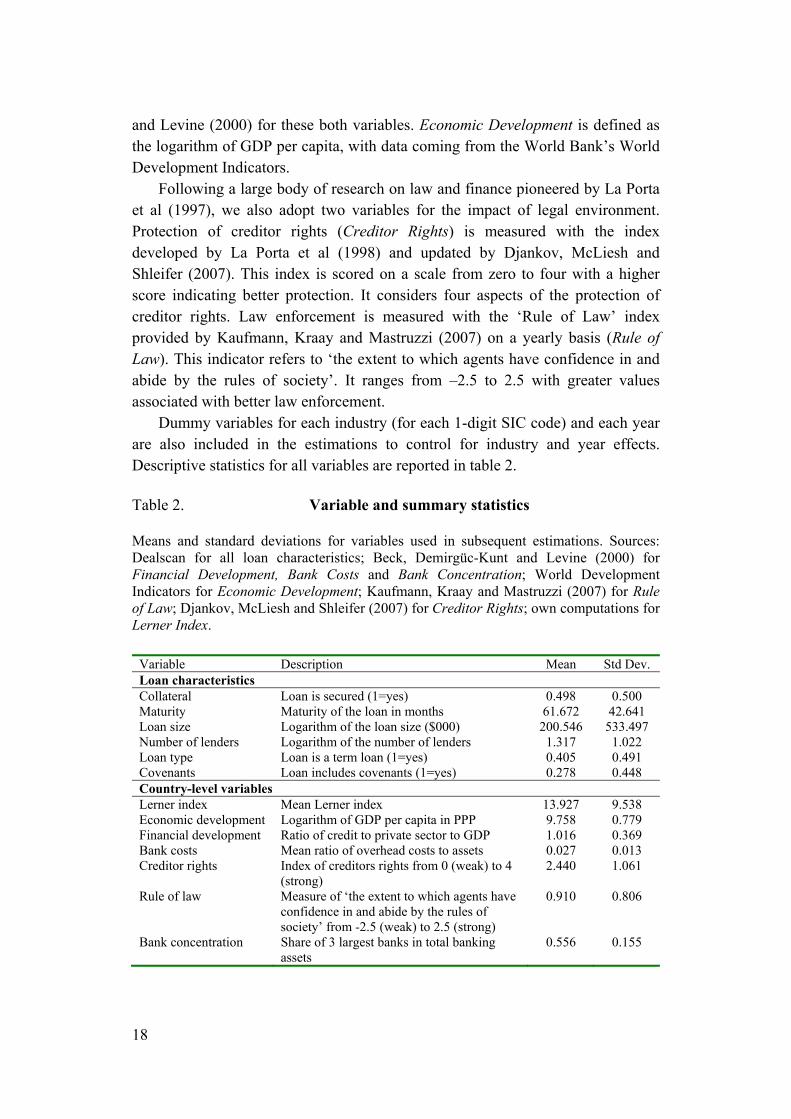
and Levine (2000) for these both variables. Economic Development is defined as the logarithm of GDP per capita, with data coming from the World Bank’s World Development Indicators. Following a large body of research on law and finance pioneered by La Porta et al (1997), we also adopt two variables for the impact of legal environment. Protection of creditor rights (Creditor Rights) is measured with the index developed by La Porta et al (1998) and updated by Djankov, McLiesh and Shleifer (2007). This index is scored on a scale from zero to four with a higher score indicating better protection. It considers four aspects of the protection of creditor rights. Law enforcement is measured with the ‘Rule of Law’ index provided by Kaufmann, Kraay and Mastruzzi (2007) on a yearly basis (Rule of Law). This indicator refers to ‘the extent to which agents have confidence in and abide by the rules of society’. It ranges from –2.5 to 2.5 with greater values associated with better law enforcement. Dummy variables for each industry (for each 1-digit SIC code) and each year are also included in the estimations to control for industry and year effects. Descriptive statistics for all variables are reported in table 2. Table 2. Variable and summary statistics Means and standard deviations for variables used in subsequent estimations. Sources: Dealscan for all loan characteristics; Beck, Demirgüc-Kunt and Levine (2000) for Financial Development, Bank Costs and Bank Concentration; World Development Indicators for Economic Development; Kaufmann, Kraay and Mastruzzi (2007) for Rule of Law; Djankov, McLiesh and Shleifer (2007) for Creditor Rights; own computations for Lerner Index.
Variable Description Mean Std Dev. Loan characteristics Collateral Loan is secured (1=yes) 0.498 0.500 Maturity Maturity of the loan in months 61.672 42.641 Loan size Logarithm of the loan size ($000) 200.546 533.497 Number of lenders Logarithm of the number of lenders 1.317 1.022 Loan type Loan is a term loan (1=yes) 0.405 0.491 Covenants Loan includes covenants (1=yes) 0.278 0.448 Country-level variables Lerner index Mean Lerner index 13.927 9.538 Economic development Logarithm of GDP per capita in PPP 9.758 0.779 Financial development Ratio of credit to private sector to GDP 1.016 0.369 Bank costs Mean ratio of overhead costs to assets 0.027 0.013 Creditor rights Index of creditors rights from 0 (weak) to 4
(strong) 2.440 1.061
Rule of law Measure of ‘the extent to which agents have confidence in and abide by the rules of society’ from -2.5 (weak) to 2.5 (strong)
0.910 0.806
Bank concentration Share of 3 largest banks in total banking assets
0.556 0.155

19
3.2 The measurement of bank competition
Empirical research on the measurement of bank competition provides several tools, which can be divided into the traditional Industrial Organization (IO) and the new empirical IO approaches. The traditional IO approach proposes tests of market structure to assess bank competition based on the Structure Conduct Performance (SCP) model. The SCP hypothesis argues that greater concentration causes less competitive bank conduct and leads to greater profitability of the bank.5 According to this, competition can be measured by concentration indices such as the market share of the largest banks, or by the Herfindahl index. These tools were widely applied until the 1990s. The new empirical IO approach provides non-structural tests to circumvent the problems of the measures of competition provided by the traditional IO approach. These latter measures suffer from the fact that they infer the degree of competition from indirect proxies such as market structure or market shares. In comparison, non-structural measures do not infer the competitive conduct of banks through the analysis of market structure, but rather measure banks’ conduct directly. Following new empirical IO approach, we compute the Lerner index for each bank of our sample, and then measure bank competition for each country by the mean Lerner index. The Lerner index has been computed in several recent studies on bank competition (eg Maudos and Fernandez de Guevara, 2004, 2007; Martin, Saurina and Salas, 2006). It is defined as the difference between the price and the marginal cost, divided by the price. The price is computed by estimating the average price of bank production (proxied by total assets) as the ratio of total revenues to total assets, following Maudos and Fernandez de Guevara (2004). The marginal cost is estimated on the basis of a translog cost function with one output (total assets) and three input prices (price of labor, price of physical capital, and price of borrowed funds). One cost function is estimated for each year to allow technology to change over time. We impose the restriction of linear homogeneity in input prices by normalizing total costs and input prices by one input price. The cost function is specified as follows
5 This can lower performance in terms of social welfare because higher interest rates worsen the firm’s incentives (Schnitzer, 1999).

20
ε+⎟⎟⎠
⎞⎜⎜⎝
⎛α+⎟⎟
⎠
⎞⎜⎜⎝
⎛α
⎟⎟⎠
⎞⎜⎜⎝
⎛⎟⎟⎠
⎞⎜⎜⎝
⎛α+⎟
⎟⎠
⎞⎜⎜⎝
⎛⎟⎟⎠
⎞⎜⎜⎝
⎛α+⎟⎟
⎠
⎞⎜⎜⎝
⎛⎟⎟⎠
⎞⎜⎜⎝
⎛α
⎟⎟⎠
⎞⎜⎜⎝
⎛α+⎟⎟
⎠
⎞⎜⎜⎝
⎛α+α+α+α=⎟⎟
⎠
⎞⎜⎜⎝
⎛
3
29
3
18
2
3
27
2
3
16
3
2
3
15
3
24
3
13
2210
3
wwlnyln
wwlnyln
wwln
21
wwln
21
wwln
wwln
wwln
wwln)y(ln
21yln
wTCln
where TC denotes total costs, y total assets, w1 the price of labor (the ratio of personnel expenses to total assets),6 w2 the price of physical capital (the ratio of other non-interest expenses to fixed assets), w3 the price of borrowed funds (the ratio of paid interests to all funding). Total costs are the sum of personnel expenses, other non-interest expenses and paid interest. The indices for each bank have been dropped from the presentation for the sake of simplicity. The estimated coefficients of the cost function are then used to compute the marginal cost. 3.3 Results
As the dependent variable, the presence of collateral, is a binary variable, we perform logit regressions following Jimenez, Salas and Saurina (2006) and Berger et al (2007).7 We estimate four logit regressions of the use of collateral by testing different combinations of control variables. The first regression includes all loan-level and country-level control variables (column 1). The second one includes no country-level control variable (column 2). The third one skips the legal variables (Creditor Rights and Rule of Law) (column 3), while the fourth one skips the economic and financial variables (Economic Development, Financial Development, Bank Costs) (column 4). In computing standard errors, we cluster by borrower. The major finding is the positive coefficient of Lerner Index, which is significant at the 1% level in all regressions. We therefore observe that the presence of collateral is more likely when the degree of bank competition is lower. As a consequence, our estimations clearly support our theoretical prediction on the impact of bank competition on the use of collateral. This result is in sharp contrast with the negative link between bank concentration and collateral use observed by Jimenez, Salas and Saurina (2006) or the absence of
6 As Bankscope database does not provide information on the number of employees, we use this proxy variable for the price of labor following Maudos and Fernandez de Guevara (2004, 2007). 7 We adopt the logit model rather the probit model, because Akaike and Schwarz information criteria are lower in logit regressions. However, we have also performed the probit regressions as as robustness check, and found similar results.

21
link between both variables obtained by Berger et al (2007). However, these studies focus on one single country and use concentration indices to measure bank competition, which limit their relevance for the investigation of the role of bank competition on the presence of collateral. Regarding the loan-level control variables, the coefficient is significantly positive for Maturity, Number of Lenders, Loan Type, and Covenants, while it is significantly negative for Loan Size. Our results thus suggest that a loan is more likely to be secured when it has a longer maturity, a greater number of lenders, some covenants, or when it is a term loan. In the opposite, larger loans are less likely to be secured. These findings are in line with the empirical literature showing that riskier loans are more likely to be secured (eg Jimenez and Saurina, 2004). Regarding the country-level variables, we find a positive and significant influence for Bank Costs and Creditor Rights, suggesting that banks with higher costs and benefiting from better protection of creditor rights ask more for collateral. The coefficient for Rule of Law is negative but only significant in one specification. Economic Development and Financial Development are not significant in the estimations. These findings are consistent with Qian and Strahan (2007) who investigate how legal and institutional variables influence loan characteristics including the presence of collateral. To further address the validity of the results, we use an alternative measure for bank competition in our estimations. Following the wide utilization of concentration indices in the literature, we take an indicator of bank concentration as a natural robustness check, even if we are fully aware of the limitations of such indices as mentioned above. Bank concentration is measured by the assets of the three largest banks as a share of all commercial banks (Concentration). Information comes again from the Beck, Demirgüc-Kunt and Levine (2000)’s database. Table 4 displays the estimations with bank concentration. We observe a positive coefficient for Concentration, which is significant in three of the four specifications, meaning that bank concentration favors the presence of collateral. Therefore, these results corroborate those obtained with the Lerner index.

22
Table 3. Main regressions Logit regressions for Collateral. Definitions of variables appear in table 1. Standard errors are clustered by borrower and are reported in parentheses. *, **, *** denote an estimate significantly different from 0 at the 10%, 5% or 1% level. Dummy variables for industries and years are included in the regressions but are not reported. Explanatory variables Estimations
(1) (2) (3) (4) Intercept 4.441***
(1.444) 4.337*** (0.782)
4.436*** (1.058)
4.268*** (0.782)
Maturity 0.012*** (0.001)
0.012*** (0.001)
0.012*** (0.001)
0.012*** (0.001)
Loan size -0.294*** (0.045)
-0.278*** (0.043)
-0.289*** (0.044)
-0.266*** (0.044)
Number of lenders 0.252*** (0.060)
0.273*** (0.056)
0.234*** (0.059)
0.300*** (0.060)
Loan type 0.592*** (0.097)
0.661*** (0.094)
0.585*** (0.096)
0.619*** (0.096)
Covenants 0.608*** (0.120)
0.648*** (0.121)
0.627*** (0.122)
0.684*** (0.122)
Lerner index 0.055*** (0.008)
0.045*** (0.006)
0.060*** (0.007)
0.039*** (0.007)
Economic development -0.109 (0.153)
– -0.100 (0.089)
–
Financial development -0.147 (0.231)
– 0.038 (0.214)
–
Bank costs 32.631*** (5.598)
– 31.812* (5.204)
–
Creditor rights 0.168*** (0.063)
– – 0.101* (0.058)
Rule of law -0.021 (0.165)
– – -0.297*** (0.078)
Log likelihood -2523.386 -2593.451 -2531.529 -2575.678 Pseudo R² 0.2617 0.2412 0.2593 0.2464 N 4931 4931 4931 4931

23
Table 4. Robustness tests: with bank concentration Logit regressions for Collateral. Definitions of variables appear in table 1. Standard errors are clustered by borrower and are reported in parentheses. *, **, *** denote an estimate significantly different from 0 at the 10%, 5% or 1% level. Dummy variables for industries and years are included in the regressions but are not reported. Explanatory variables Estimations
(1) (2) (3) (4) Intercept 2.732***
(1.475) 4.897*** (0.783)
6.551*** (1.022)
4.090*** (0.792)
Maturity 0.012*** (0.002)
0.012*** (0.002)
0.011*** (0.002)
0.011*** (0.002)
Loan Size -0.290*** (0.044)
-0.281*** (0.042)
-0.281*** (0.043)
-0.269*** (0.044)
Number of lenders 0.251*** (0.060)
0.232*** (0.055)
0.214*** (0.057)
0.290*** (0.060)
Loan type 0.547*** (0.096)
0.602*** (0.097)
0.571*** (0.097)
0.580*** (0.098)
Covenants 0.660*** (0.120)
0.676*** (0.118)
0.646*** (0.120)
0.688*** (0.121)
Bank concentration 1.331*** (0.371)
0.531 (0.331)
1.166*** (0.346)
1.243*** (0.366)
Economic development 0.082 (0.151)
– -0.321*** (0.091)
–
Financial development 0.229 (0.247)
– 0.514*** (0.217)
–
Bank costs 22.907*** (5.100)
– 24.196*** (4.803)
–
Creditor rights 0.276*** (0.062)
– – 0.237*** (0.055)
Rule of law -0.543*** (0.158)
– – -0.504*** (0.078)
Likelihood ratio -2577.762 -2660.082 -2619.637 -2604.182 Pseudo R² 0.2458 0.2217 0.2335 0.2381 N 4931 4931 4931 4931
24
Another source of skepticism might concern Dealscan database, which includes many syndicated loans. Consequently, the loan can be granted by a syndicate of banks from different countries, which might make it hard to consider the degree of competition of one country as relevant to explain the use of collateral. However, investigating the sample shows that a large number of banks involved in the syndicated loans are domestic banks. Without meaning that all lenders are domestic, it stresses the fact that bank competition at the domestic level clearly matters. From the perspective of syndicated loans practitioners (Taylor and Sansone, 2007), the strong implication of domestic banks in syndicated loans is in line with, on the one hand, the fact that the arrangers are usually relationship banks, which are generally local banks with respect to the borrower’s country (Esty, 2001), and, on the other hand, the fact that the presence of local lenders reduces problems related to information asymmetries (Sufi, 2007). Nevertheless, we perform additional estimations to check whether our findings are dependent of the presence of syndicated loans. In this aim, we keep only single-lender loans, resulting in a strong reduction of the sample size. The loan sample then includes 1173 loans from 43 countries. The results of these estimations are reported in table 5. Once again, we find that bank competition exerts a positive and significant impact on the use of collateral. The only changes concern the significance of some country-level control variables. Therefore, in spite of the limitations of Dealscan database, these additional points support the relevance of our results. Our findings have thus survived several robustness checks, leading to the strong support of our theoretical prediction that a loan is more likely to be secured if competition is lower in the banking industry.

25
Table 5. Robustness tests: single-lender loans only Logit regressions for Collateral. Definitions of variables appear in table 1. Standard errors are clustered by borrower and are reported in parentheses. *, **, *** denote an estimate significantly different from 0 at the 10%, 5% or 1% level. Dummy variables for industries and years are included in the regressions but are not reported. Explanatory variables Estimations
(1) (2) (3) (4) Intercept 4.659*
(2.571) 5.295*** (1.455)
7.217*** (1.904)
5.421*** (1.460)
Maturity 0.006** (0.003)
0.006** (0.003)
0.006** (0.003)
0.006** (0.003)
Loan size -0.269*** (0.086)
-0.255*** (0.083)
-0.267*** (0.086)
-0.257*** (0.085)
Loan type 0.893*** (0.218)
0.991*** (0.209)
0.909*** (0.216)
0.886*** (0.213)
Covenants 0.605** (0.284)
0.684** (0.269)
0.581** (0.280)
0.714*** (0.276)
Lerner index 0.052*** (0.015)
0.055*** (0.013)
0.057*** (0.014)
0.053*** (0.0.14)
Economic development -0.008 (0.278)
- -0.332* (0.172)
-
Financial development 0.681* (0.496)
- 0.646 (0.463)
-
Bank costs 16.964 (13.014)
- 22.787* (12.054)
-
Creditor rights -0.0186 (0.149)
- - 0.025 (0.134)
Rule of law -0.4349 (0.308)
- - -0.367** (0.157)
Likelihood ratio -523.067 -531.747 -524.786 -526.189 Pseudo R² 0.3214 0.3101 0.3192 0.3173 N 1173 1173 1173 1173
26
4 Concluding remarks
We investigate how bank competition influences the use of collateral. This question is of major interest to assess the implications of the structural changes of the banking industry on the access to bank finance, owing to the dependence of this access to collateral requirements. We construct a theoretical model incorporating information asymmetries in a spatial competition framework. Banks can choose between screening the borrower or asking collateral in the loan contract. Screening becomes more expensive as the distance between a bank and a firm increases. We show that increased competition in the banking industry makes the use of collateral in loan contracts less likely, by making the choice for screening more attractive. The model thus predicts that bank competition lowers the presence of collateral in loan contracts. In order to check this theoretical prediction, we develop an empirical cross-country analysis based on the regression of the presence of collateral on bank competition measured by the Lerner index. As predicted by the model, our tests provide evidence on a negative impact of bank competition on the presence of collateral. Robustness checks confirm this finding with alternative specifications. Thus our paper shows that presence of collateral is more likely when bank competition is lower. As a consequence, the effects of bank competition on loan rates and on collateral use are complementary for the access to bank finance, as the reduction of loan rates is accompanied by lower collateral requirements. This conclusion is in line with the finding of Beck, Demirgüc-Kunt and Maksimovic (2004) that greater bank concentration fosters financing obstacles. Thus, taking measures that increase bank competition should improve the firms’ access to finance. With more competition, a firm’s asset endowment becomes a less important prerequisite for getting a loan. In particular, in less developed countries where the types of assets that can potentially be pledged as collateral are limited and therefore firms find it difficult to get a loan competition in the banking sector should be intensified.
27
References
Agarwal, S – Hauswald, R (2007) Distance and Information Asymmetries in Lending. Mimeo, American University, Washington, D.C.
Beck, T – Demirgüc-Kunt, A – Laeven, L – Maksimovic, V (2006) The
Determinants of Financing Obstacles. Journal of International Money and Finance 25, 932–952.
Beck, T – Demirgüc-Kunt, A – Levine, R (2000) A New Database on Financial
Development and Structure. World Bank Economic Review 14, 597–605. Beck, T – Demirgüc-Kunt, A – Maksimovic, V (2004) Bank Competition and
Access to Finance: International Evidence. Journal of Money, Credit and Banking 36, 3, 627–654.
Beck, T – Levine, R (2004) Stock Markets, Banks, and Growth: Panel
Evidence. Journal of Banking and Finance 28, 423–442. Berger, A – Espinosa-Vega, M – Frame, W S – Miller, N (2007) Why Do
Borrowers Pledge More Collateral? New Empirical Evidence on the Role of Asymmetric Information. Working Paper no. 2006-29a, Federal Reserve Bank of Atlanta.
Berlin, M – Butler, A (2002) Collateral and Competition. Working Paper no.
02-22, Federal Reserve of Philadelphia. Bharath, S – Dahiya, S – Saunders, A – Srinivasan, A (2007) So What Do I Get?
The Bank’s View of Lending Relationships. Journal of Financial Economics 85, 368–419.
Dahiya, S – Kose, J – Puri, M – Ramirez, G (2003) Debtor-in-possession
financing and bankruptcy resolution. Journal of Financial Economics 69, 1, 259–280.
Degryse, H – Ongena, S (2005) Distance, Lending Relationships, and
Competition. Journal of Finance 60, 1, 231–266. Dell’Ariccia, G (2001) Asymmetric Information and the Structure of the
Banking Industry. European Economic Review 45, 1957–1980.

28
Djankov, S – McLiesh, C – Shleifer, A (2007) Private Credit in 129 Countries. Journal of Financial Economics 84, 2, 299–329.
Esty, B (2001) Structuring Loan Syndicates: A Case Study of the Hong Kong
Disneyland Project Loan. Journal of Applied Corporate Finance 14, 3, 80–95.
Hainz, C (2003) Bank Competition and Credit Markets in Transition
Economies. Journal of Comparative Economics 31, 223–245. Hauswald, R – Marquez, R (2006) Competition and Strategic Information
Acquisition in Credit Markets. Review of Financial Studies 19, 3, 967–1000.
Jacobson, T – Lindé, J – Roszbach, K (2006) Internal Rating Systems, Implied
Credit Risk and the Consistency of Banks’ Risk Classification Policies. Journal of Banking and Finance 30, 1899–1926.
Jimenez, G – Salas, V – Saurina, J (2006) Determinants of Collateral. Journal of
Financial Economics 81, 255–281. Kaufmann, D – Kraay, A – Mastruzzi, M (2007) Governance Matters VI:
Governance Indicators for 1996–2006. World Bank Policy Research Paper no. 4280.
La Porta, R – Lopez-de-Silanes, F – Shleifer, A – Vishny, R W (1997) Legal
Determinants of External Finance. Journal of Finance 52, 1131–1150. La Porta, R – Lopez-de-Silanes, F – Shleifer, A – Vishny, R W (1998) Law and
Finance. Journal of Political Economy 106, 1113–1155. Manove, M – Padilla, A J – Pagano, M (2001) Collateral versus Project
Screening: A Model of Lazy Banks. Rand Journal of Economics 32, 4, 726–744.
Martin, A – Salas, V – Jesus, S (2006) Risk Premium and Market Power in
Credit Markets. Economics Letters 93, 3, 450–456. Maudos, J – de Guevara, J F (2007) The Cost of Market Power in Banking:
Social Welfare Loss vs. Cost Inefficiency. Journal of Banking and Finance 31, 2103–2125.
29
Maudos, J – de Guevara, J F (2004) Factors Explaining the Interest Margin in the Banking Sectors of the European Union. Journal of Banking and Finance 28, 2259–2281.
Mitchell, J – van Roy, P (2007) Failure Prediction Models: Performance,
Disagreements, and Internal Rating Systems. Working Paper no. 123, National Bank of Belgium.
Qian, J – Strahan, P (2007) How Laws & Institutions Shape Financial
Contracts: The Case of Bank Loans. Journal of Finance LXII, 6, 2803–2834.
Schnitzer, M (1999) On the Role of Bank Competition for Corporate Finance
and Corporate Control in Transition Economies. Journal of Institutional and Theoretical Economics 155, 1, 22–46.
Sufi, A (2007) Information Asymmetry and Financing Arrangements. Journal
of Finance 62, 2, 629–668. Taylor, A – Sansone, A (2007) The Handbook of Loan Syndications and
Trading. McGraw-Hill.

30
Appendix
Proof of Lemma 1: From (IC.BF_L) we know that L = I. Moreover, the participation constraint of the good firm must hold
A)IA)(p1()RXA(p L ≥−−+−+ or 0I)p1()RX(p L ≥−−− (PC.GF_L)
If the project is successful, a good firm repays RL from the payoff X it generates. In the case of failure, collateralized assets in the amount of I are seized by the bank. The expected payoff when the investment is credit-financed has to be at least as high as the payoff from not investing (which is A). The bank will participate if it makes at least zero expected profit with the contract offered. The bank’s expected profit by each (good) firm is given by
0II)p1(pR L ≥−−α+ (PC.B_L) which implies that it needs a repayment of at least RL. Since both banks are identical they cannot demand a higher repayment without losing all their customers. Q.E.D. Proof of Lemma 2: Bank 1 undertakes the following consideration. According to bank 2’s
participation constraint the repayment must be ⎟⎟⎠
⎞⎜⎜⎝
⎛⎟⎠⎞
⎜⎝⎛ −+= d
N1cI
p1RS
2 . The
payoff the firm receives must fulfil the good firm’s participation constraint.
AdN1cI
p1XpA ≥⎟⎟
⎠
⎞⎜⎜⎝
⎛⎟⎟⎠
⎞⎜⎜⎝
⎛⎟⎠⎞
⎜⎝⎛ −+−+ (PC.F_S)
According to the participation constraint, the good firm must be better off by being able to realize the project and generate a return X and repay RS than by not investing and getting the outside option of A. We have assumed that this is the case. Bank 1 does not have an incentive to demand a higher repayment because it

31
would loose the firm to its competitor. By demanding S2R bank 1 receives an
expected profit per borrower of: dc2NcS −=Π . Q.E.D.
Proof of Lemma 3: Bank 1 offers a screening contract and bank 2 a collateralized contract. Given the offer bank 2 needs to break even, bank 1 can demand a repayment of SL
1R without losing the firm as a customer
p)1)(p1(1IR
orI)p1(p
))p1(1(IXp)RX(p
SL1
SL1
α−−+=
−−⎟⎟⎠
⎞⎜⎜⎝
⎛ α−−−=−
Bank 1’s expected profit per borrower with this repayment is
cdI)1)(p1(SL1 −α−−=Π
And bank 2 makes zero expected profit. Bank 1’s expected profit is non-negative
if c
)1)(p1(Id α−−≤ . For firms located further away, bank 2 has lower costs of
producing information than bank 1. This means that bank 2 can make a more attractive offer to the firm than bank 1. Firms are indifferent between the
screening contract of bank 1 (which needs a repayment of at least pcdIRS
1 += )
and the collateralized contract of bank 2 when
pcdIR
orI)p1()RX(ppcdIXp
SL2
SL2
+=
−−−=⎟⎟⎠
⎞⎜⎜⎝
⎛−−
In this case bank 1 makes zero expected profit because bank 2 serves all customers from this location and the bank gets a profit per borrower of
I)1)(p1(cdSL2 α−−−=Π . Q.E.D.

32
Proof of Lemma 4: Suppose bank 1 offers a collateralized contract and bank 2 a screening contract. A firm is indifferent between these two contracts if the following condition holds
⎟⎟⎠
⎞⎜⎜⎝
⎛⎟⎟⎠
⎞⎜⎜⎝
⎛⎟⎠⎞
⎜⎝⎛ −+−=−−− d
N1cI
p1XpI)p1()RX(p L
Thus, p
dN1c
IR LS1
⎟⎠⎞
⎜⎝⎛ −
+= and L = I. The resulting profit per borrower of bank 1
is I)1)(p1(dN1cLS
1 α−−−⎟⎠⎞
⎜⎝⎛ −=Π . Q.E.D.
Proof of Proposition 1: We want to derive the Nash equilibrium. To do so, we first compare the best answers of bank 1 (bank 2) given the offer of bank 2 (bank 1). Best answers of bank 1 – Provided bank 2 offers a collateralized contract: Since 0LSL
1 =Π>Π , bank 1’s best response is to offer a screening contract if
c)1)(p1(Id~d α−−=≤ . For firms located further away bank 1 is indifferent
between screening and collateralization because both contracts yield zero expected profits.
– Provided bank 2 offers a screening contract: Bank 1 compares ΠS and LS
1Π . Its payoff with a screening contract is higher
for all c
)1)(p1(Id~d α−−=≤ and therefore it offers a screening contract to all
firms that are relatively close. To all other firms bank 1 offers a collateralized contract.
Best answers of bank 2 – Provided bank 1 offers a collateralized contract: Bank 2 will always make zero expected profits independently of the contract
it offers. Therefore, it is indifferent between the type of contract offered.

33
– Provided bank 1 offers a screening contract: Bank 2 compares LS
1Π and ΠS. For firms up to a distance of
⎟⎠⎞
⎜⎝⎛ −α−−−=≤
N1
c)1)(p1(I
31d~d the profit is higher with a screening
contract. For those further away bank 2 offers a collateralized contract.
Due to the assumption that I)1)(p1(N4c α−−< , the threshold values can be
ranked as d~d̂ > . Thus, we have three parameter ranges for the distance: 1. d~d ≤ – Given that bank 2 chooses a collateralized contract, bank 1 chooses a
screening contract. – Given that bank 2 chooses a screening contract, bank 1 chooses a screening
contract as well. – Given that bank 1 chooses a collateralized contract, bank 2 is indifferent
between a screening and a collateralized contract. – Given that bank 1 chooses a screening contract, bank 2 chooses a screening
contract as well. The Nash equilibrium is that both banks offer a screening contract. 2. d̂dd~ << – Given that bank 2 chooses a collateralized contract, bank 1 is indifferent
between a screening and a collateralized contract. – Given that bank 2 chooses a screening contract, bank 1 chooses a
collateralized contract. – Given that bank 1 chooses a collateralized contract, bank 2 is indifferent
between a screening and a collateralized contract. – Given that bank 1 chooses a screening contract, bank 2 chooses a screening
contract as well. Thus, bank 1 weakly prefers a collateralized contract and bank 2 weakly prefers a screening contract. In equilibrium, firms are offered a collateralized contract by bank 1 and a screening contract by bank 2. Bank 1 will finance the firm through a collateralized contract.
3. N21dd̂ <<
– Given that bank 2 chooses a collateralized contract, bank 1 is indifferent between a screening and a collateralized contract.
– Given that bank 2 chooses a screening contract, bank 1 chooses a collateralized contract.

34
– Given that bank 1 chooses a collateralized contract, bank 2 is indifferent between a screening and a collateralized contract.
– Given that bank 1 chooses a screening contract, bank 2 chooses a collateralized contract.
Thus, both banks weakly prefers a collateralized contract. In equilibrium, firms are financed by a collateralized contract by bank 1. Q.E.D. Proof of Proposition 2: All banks are identical. Bank 1 finances the following fraction of firms through a screening contract
0c2
)1)(p1(IN
N21d~
andNc2
)1)(p1(I
N21d~
>α−−=⎟⎟⎟⎟
⎠
⎞
⎜⎜⎜⎜
⎝
⎛
∂
α−−=
As a result, the fraction of firms financed through a screening contract increases as the number of banks increases. Q.E.D.
BANK OF FINLAND RESEARCH DISCUSSION PAPERS ISSN 0785-3572, print; ISSN 1456-6184, online 1/2008 Peik Granlund Regulatory choices in global financial markets – restoring
the role of aggregate utility in the shaping of market supervision. 2008. 36 p. ISBN 978-952-462-416-9, print; ISBN 978-952-462-417-6, online.
2/2008 Ari Hyytinen – Tuomas Takalo Consumer awareness and the use of
payment media: evidence from Young Finnish consumers. 2008. 34 p. ISBN 978-952-462-418-3, print; ISBN 978-952-462-419-0, online.
3/2008 Patrick M Crowley One money, several cycles? Evaluation of European
business cycles using model-based cluster analysis. 2008. 47 p. ISBN 978-952-462-420-6, print; ISBN 978-952-462-421-3, online.
4/2008 József Molnár Market power and merger simulation in retail banking.
2008. 26 p. ISBN 978-952-462-422-0, print; ISBN 978-952-462-423-7, online. 5/2008 Heli Huhtala Along but beyond mean-variance: Utility maximization in a
semimartingale model. 2008. 29 p. ISBN 978-952-462-426-8, print; ISBN 978-952-462-427-5, online.
6/2008 Mikael Juselius Cointegration implications of linear rational expectation
models. 2008. 25 p. ISBN 978-952-462-428-2, print; ISBN 978-952-462-429-9, online.
7/2008 Tuomas Takalo – Tanja Tanayama – Otto Toivanen Evaluating innovation
policy: a structural treatment effect model of R&D subsidies. 2008. 59 p. ISBN 978-952-462-430-5, print; ISBN 978-952-462-431-2, online.
8/2008 Essi Eerola – Niku Määttänen On the importance of borrowing constraints
for house price dynamics. 2008. 40 p. ISBN 978-952-462-432-9, print; ISBN 978-952-462-433-6, online.
9/2008 Marko Melolinna Using financial markets information to identify oil supply
shocks in a restricted VAR. 2008. 35 p. ISBN 978-952-462-434-3, print; ISBN 978-952-462-435-0, online.
10/2008 Bill B Francis – Iftekhar Hasan – James R Lothian – Xian Sun The signalling
hypothesis revisited: Evidence from foreign IPOs. 2008. 41 p. ISBN 978-952-462-436-7, print; ISBN 978-952-462-437-4, online.

11/2008 Kari Takala – Matti Viren Efficiency and costs of payments: some new evidence from Finland. 2008. 50 p. ISBN 978-952-462-438-1, print; ISBN 978-952-462-439-8, online.
12/2008 Jukka Topi Bank runs, liquidity and credit risk. 2008. 31 p. ISBN 978-952-462-440-4, print; ISBN 978-952-462-441-1, online. 13/2008 Juha Kilponen – Matti Viren Why do growth rates differ? Evidence from
cross-country data on private sector production. 2008. 29 p. ISBN 978-952-462-442-8, print; ISBN 978-952-462-443-5, online. 14/2008 Bill B Francis – Iftekhar Hasan – Delroy M Hunter Does hedging tell the full
story? Reconciling differences in US aggregate and industry-level exchange rate risk premia. 2008. 58 p. ISBN 978-952-462-444-2, print;
ISBN 978-952-462-445-9, online. 15/2008 Leonardo Becchetti – Annalisa Castelli – Iftekhar Hasan Investment-cash
flow sensitivities, credit rationing and financing constraints. 2008. 64 p. ISBN 978-952-462-446-6, print; ISBN 978-952-462-447-3, online.
16/2008 Maritta Paloviita Estimating open economy Phillips curves for the euro area
with directly measured expectations. 2008. 37 p. ISBN 978-952-462-448-0, print; ISBN 978-952-462-449-7, online.
17/2008 Esa Jokivuolle – Kimmo Virolainen – Oskari Vähämaa Macro-mode-based
stress testing of Basel II capital requirements. 2008. 27 p. ISBN 978-952-462-450-3, print; ISBN 978-952-462-451-0, online. 18/2008 Mika Vaihekoski History of finance research and education in Finland: the
first thirty years. 2008. 41 p. ISBN 978-952-462-452-7, print; ISBN 978-952-462-453-4, online. 19/2008 Tuomas Takalo – Tanja Tanayama Adverse selection and financing of
innovation: is there a need for R&D subsidies? 2008. 41 p. ISBN 978-952-462-454-1, print; ISBN 978-952-462-455-8, online. 20/2008 Efrem Castelnuovo – Luciano Greco – Davide Raggi Estimating regime-
switching Taylor rules with trend inflation. 2008. 40 p. ISBN 978-952-462-456-5, print; ISBN 978-952-462-457-2, online. 21/2008 Helvi Kinnunen Government funds and demographic transition –
alleviating ageing costs in a small open economy. 2008. 39 p. ISBN 978-952-462-458-9, print; ISBN 978-952-462-459-6, online.

22/2008 Kari Kemppainen Integrating European retail payment systems: some economics of SEPA. 2008. 43 p. ISBN 978-952-462-460-2, print; ISBN 978-952-462-461-9, online.
23/2008 Paolo Zagaglia Money-market segmetation in the euro area: what has
changed during the turmoil? 2008. 24 p. ISBN 978-952-462-462-6, print; ISBN 978-952-462-463-3, online.
24/2008 Massimiliano Marzo – Paolo Zagaglia Determinancy of interest rate rules
with bond transaction services in a cashless economy. 2008. 36 p. ISBN 978-952-462-464-0, print; ISBN 978-952-462-465-7, online. 25/2008 Massimiliano Marzo – Silvia Romagnoli – Paolo Zagaglia A continuous-time
model of the term structure of interest rates with fiscal-monetary policy interactions. 2008. 35 p. ISBN 978-952-462-466-4, print;
ISBN 978-952-462-467-1, online. 26/2008 Fabrizio Spargoli – Paolo Zagaglia The co-movements along the forward
curve of natural gas futures: a structural view. 2008. 32 p. ISBN 978-952-462-468-8, print; ISBN 978-952-462-469-5, online. 27/2008 Christa Hainz – Laurent Weill – Christophe J Godlewski Bank competition
and collateral: theory and evidence. 2008. 37 p. ISBN 978-952-462-474-9, print; ISBN 978-952-462-475-6, online.

Suomen PankkiBank of FinlandP.O.Box 160FI-00101 HELSINKIFinland