BALTIC ECONOMIC OUTLOOK
13
Oslo Tallinn Riga Vilnius Baltic see BALTIC ECONOMIC OUTLOOK 2012
Transcript of BALTIC ECONOMIC OUTLOOK

Oslo
Tallinn
Riga
Vilnius
Baltic see
BALTIC ECONOMIC OUTLOOK
2012

Macroeconomic indicators and forecasts
Lithuania
2008 2009 2010 2011 2012 F 2013 F 2014 F 2015 F
Real GDP, annual change, % 9.8 2.9 –14.8 5.9 3.0 2.0 3.0 5.0
annual inflation, eop, % 8.2 8.5 1.2 3.5 3.2 2.7 2.5 3.0
average gross monthly earnings, eop, annual change, % 20.5 13.0 –8.7 2.5 4.0 4.0 5.0 5.0
unemployment rate, eop, % 4.2 7.9 15.6 13.9 12.0 11.0 10.0 9.5
General government budget balance, ratio to GDP, % –1.0 –3.3 –9.4 –5.5 –3.5 –2.5 –2.0 –1.5
Current account balance, ratio to GDP, % –14.4 –12.9 3.7 –1.6 –2.5 –2.5 –3.0 –3.0
Latvia
2008 2009 2010 2011 2012 F 2013 F 2014 P 2015 F
Real GDP, annual change, % 9.6 –3.3 –17.7 5.5 4.7 2.8 3.5 5.0
annual inflation, eop, % 14.0 10.4 –1.4 3.9 2.5 2.5 3.0 3.0
average gross monthly earnings, eop, annual change, % 25.2 9.5 –11.7 4.5 4.0 4.0 5.0 5.0
unemployment rate, eop, % 5.7 10.5 20.9 15.0 13.0 12.0 9.5 8.0
General government budget balance, ratio to GDP, % –0.4 –4.2 –9.8 –3.5 1.0 –1.5 –0.5 1.0
Current account balance, ratio to GDP, % –22.4 –13.2 8.6 –1.2 –2.0 –3.0 –3.0 –3.0
Estonia
2008 2009 2010 2011 2012 F 2013 F 2014 F 2015 F
Real GDP, annual change, % 7.5 –4.2 –14.1 7.6 3.0 2.5 3.5 5.0
annual inflation, eop, % 9.7 7.5 –1.9 4.1 3.5 3.0 2.5 3.0
average gross monthly earnings, eop, annual change, % 20.1 6.9 –6.5 6.3 4.0 4.0 5.0 5.0
unemployment rate, eop, % 4.1 7.6 15.5 11.4 9.0 8.5 8.0 7.5
General government budget balance, ratio to GDP, % 2.4 –2.9 –2.0 1.0 –1.0 –1.0 1.0 1.5
Current account balance, ratio to GDP, % –15.9 –9.2 3.4 3.2 1.0 0.0 1.0 1.0
BALTIC ECONOMIC OUTLOOK | 2012
2

Summary of macroeconomic trends
GRoss DomEstiC PRoDuCt
Economic growth will slow down in the three Baltic states next year. our projection is a growth rate of 2.0 per cent of GDP for Lithuania, 2.8 per cent for Latvia and 2.5 per cent for Estonia. The main factor behind the slowdown in growth in Lithuania and our Baltic neighbors will be more moderate growth of exports as the recovering domestic consumption will not be able to offset the dip. We believe that real growth of Lithuanian exports will fall to around 4 per cent next year from 7 per cent this year. if some extraordinary measures are taken next year to make use of LtL 400 million allocated for renovation of residential houses, this would add approximately 0.3 per cent to our projected GDP growth. In recent years, Lithuania has had a significantly weaker flow of capital invest-ments compared to its Baltic neighbours. so we expect investments to make a breakthrough in 2014–2015 and make a considerable contribution to faster economic growth during that period together with stronger exports and domestic consumption.
PRiCEs
By the end of next year, the inflation rate will drop in all three Baltic states. We expect the rate to fall from 3.2 per cent this December to 2.7 per cent at the end of 2013 in Lithuania. Lower prices of oil will put down-ward pressure on inflation. The price rise in Latvia is expected to be even slower and make up 2.5 per cent at the end of 2013 as a result of government efforts to keep the price level below the Maastricht criterion. We believe that Latvia will meet the maastricht inflation criterion in late 2012 and early 2013, which would ensure that Latvia becomes the 18th member of the euro area on 1 January 2014. Estonia is expected to have the highest inflation rate among the Baltic states at the end of 2013 (3.0 per cent) because of the steep-est rise of earnings.
GRoss DomEstiC PRoDuCt, annuaL ChanGE, PER CEnt
�.� �.��.�
�.�
��.���.�
���.�
���.�
���.�
�.�
��.�
�.�
�.� �.�
�.�
�.�
�.�
�.��.�
�.�
�.��.�
�.��.�
Lithuania Latvia Estonia
���� ���� ���� ���� ���� ���� Q� ���� Q� ���� Q�
avERaGE annuaL inFLation, PER CEnt
��
�
�
�
�
�
��
��
��
��
����
/��
����
/��
����
/��
����
/��
����
/��
����
/��
����
/��
����
/��
����
/��
����
/��
����
/��
����
/��
����
/��
����
/��
����
/��
����
/��
����
/��
����
/��
����
/��
����
/��
����
/��
����
/��
����
/��
����
/��
����
/��
����
/��
����
/��
Maastricht criteria
Latvia
Lithuania
Estonia
SUMMAry Of MACrOECONOMIC TrENdS
�
unEmPLoymEnt
slow growth of the economies is likely to keep the unemployment rate high in all three Baltic states. in Lithuania, the jobless rate should fall from around 12 per cent at the end of this year to 11 per cent at the end of 2013. However, both new jobs and shrink-ing workforce due to emigration will contribute to better unemployment figures in almost equal measure. Labour markets in Lithuania and Latvia are threat-ened by structural unemployment when the major-ity of jobless people lack the specific skills sought by employers while low wages across some profes-sions discourage unemployed from seeking voca-tional training. In a couple of years Lithuania may face a situation where the unemployment rate stalls at around 10 per cent but it will be close to impossible for unemployed people to re-enter the labour market and employers will be in a dire need of workers of certain professions. theoretically, the problem should be abated by faster rising wages of workers which would encourage people to upgrade their skills, but the reality is that the government may need to step up its efforts in addressing the issue of struc-tural unemployment. if renovation of residential housing gathered pace, this would create decrease unemployment in the short-run.
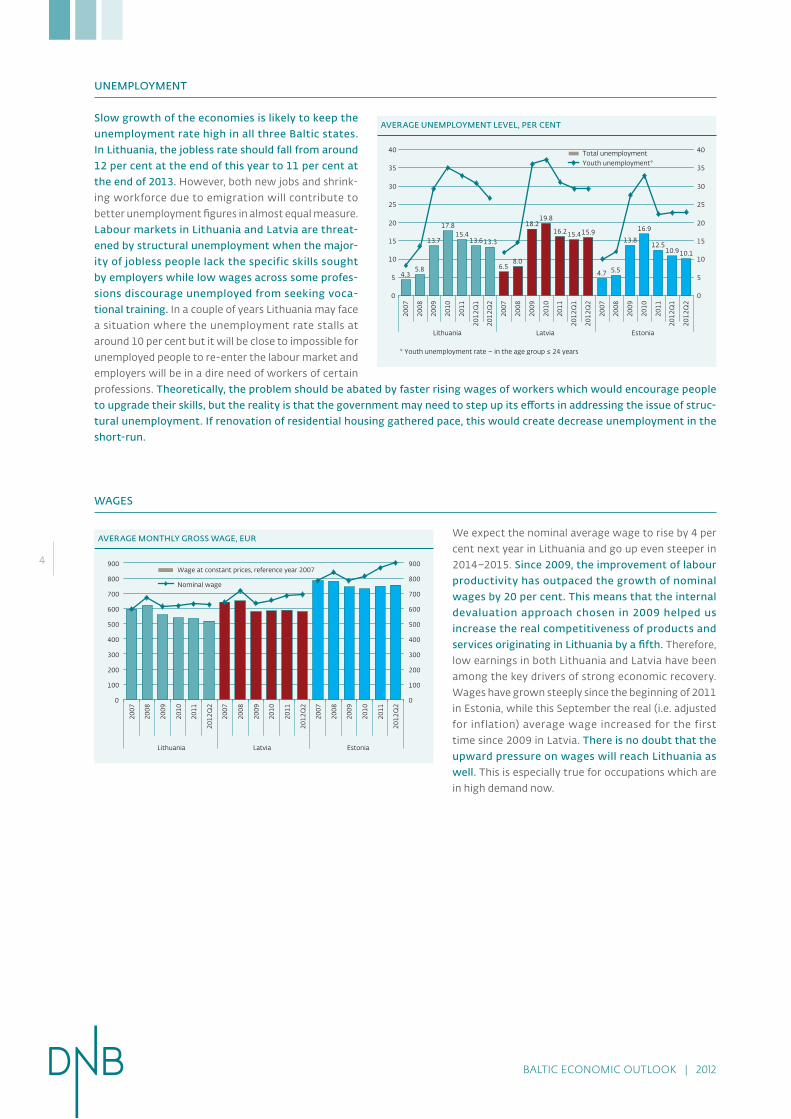
WaGEs
We expect the nominal average wage to rise by 4 per cent next year in Lithuania and go up even steeper in 2014–2015. since 2009, the improvement of labour productivity has outpaced the growth of nominal wages by 20 per cent. this means that the internal devaluation approach chosen in 2009 helped us increase the real competitiveness of products and services originating in Lithuania by a fifth. Therefore, low earnings in both Lithuania and Latvia have been among the key drivers of strong economic recovery. Wages have grown steeply since the beginning of 2011 in Estonia, while this September the real (i.e. adjusted for inflation) average wage increased for the first time since 2009 in Latvia. there is no doubt that the upward pressure on wages will reach Lithuania as well. This is especially true for occupations which are in high demand now.
avERaGE unEmPLoymEnt LEvEL, PER CEnt
* Youth unemployment rate � in the age group ≤ �� years
�.��.�
��.���.�
��.���.���.�
�.� �.�
��.�
��.�
��.���.���.�
��.���.���.�
��.�
��.�
�.��.�
�
�
��
��
��
��
��
��
��
����
����
����
����
����
����
Q�
����
Q�
����
����
����
����
����
����
Q�
����
Q�
����
����
����
����
����
����
Q�
����
Q�
Lithuania Latvia Estonia
�
�
��
��
��
��
��
��
��Total unemploymentYouth unemployment*
avERaGE monthLy GRoss WaGE, EuR
�
���
���
���
���
���
���
���
���
���
����
����
����
����
����
����
Q�
����
����
����
����
����
����
Q�
����
����
����
����
����
����
Q�
Lithuania Latvia Estonia
�
���
���
���
���
���
���
���
���
���Wage at constant prices, reference year ����
Nominal wage
BALTIC ECONOMIC OUTLOOK | 2012
�

Last year, Lithuanian GDP at constant prices rose by 5.9 per cent, which was the second highest indicator in the Eu after Estonia (8.3 per cent). this year, the Lithuanian economy has also shown quite an impressive growth rate despite the mounting problems in the euro area. in the first nine months of 2012, GDP rose by 3.5 per cent year-on-year. the annual growth rate dipped in the second quarter (2.2 per cent) due to maintenance at the oil refining company. however, it rose again considerably in the third quarter (4.4 per cent) driven mostly by an excellent harvest of crops which will also have a positive effect on indicators of the last quarter. nevertheless, we believe that the development of the Lithuanian economy will slow down soon because of the decelerating growth of the its main export markets.
As the Lithuanian population has continued to shrink, the GDP per capita has been rising steeply in recent years and stood at EUR 10,200 last year, up by 21 per cent from 2010. Measured in purchasing power standards, value added per capita made up 66 per cent of the EU average in 2011, which is by 9 percent-age points more than two years ago. In 2004 when Lithuania acceded to the EU, the same indicator stood at 51 per cent.
Last year, the main driving forces of the economy were the manufacturing industry which exports about 60 per cent of output, domestic trade and construction industry. These three industries make up more than 55 per cent of the national econ-omy and last year generated almost 90 per cent of economic growth. However, all these industries slowed down consider-ably in 2012. In addition, the transport and storage sector, which is another cornerstone of the Lithuanian economy, has also performed worse lately.
ExPoRts havE DRivEn thE nationaL EConomy
Lithuanian exports of goods and services at constant prices went up by 14.1 per cent in 2011 and then by 5.3 per cent in the first half of this year (see Diagram 1.1). Between January and June, visible and invisible exports per capita stood at EUR 567 and EUR 117 respectively per month. According to these indi-cators, Lithuania ranks 18th and 21st respectively in the EU. Although exports of services are relatively less developed in our country, their annual growth was one of the strongest in the EU in the first half of 2012. Despite the continuous growth of exports, trade balance was negative in Lithuania both last and this year. Compared to 2007, trade deficit contracted consid-erably and is quite small but remains in the negative territory
1. Lithuania
because the country has to import mineral fuel during the cold season.
The EU has been the major trading partner of Lithuania for some time now. In the first 8 months of this year, 61 per cent of imports came from and 56 per cent of exports went to the EU and both indicators did not change much from the previous year. On the other hand, the share of exports to the CIS coun-tries rose by almost 2 percentage points to nearly 30 per cent, while the relative weight of imports stayed at 36 per cent for some time now. Russia remained the largest trading partner of our country. Exports to this country, excluding mineral fuel (MF), went up by 35 per cent last year and grew by about a fifth this year. In 2012, the comparative weight of Russia reached almost 25 per cent in the export structure. Just a fraction of exports going to Russia originate in Lithuania as the country is the primary destination for re-exports. Lithuania’s exports to EU countries rose by a more modest margin of 20 per cent last year, while the EU accounted for 55 per cent of exports (net of MF) this year, down from 62 per cent in 2009. We believe that growth in the European Union will be negligible in the coming years (next year, the EU is likely to go into recession) and sales in the region will show a modest growth at best. As a result, the importance of the EU will continue to decline in the trading structure. Currently, Germany is the major trading partner of Lithuania (excluding MF) in the EU and it accounted for 10 per cent of exports this year (16 per cent of exports originating in Lithuania). It was followed by Latvia (9.6 per cent), Poland (5 per cent) and Sweden (4.4 per cent). Although exports of our country are quite diversified in order to secure more stable and sustainable growth, it needs to find
Diagram 1.1Lithuania’s FoREiGn tRaDE at CuRREnt PRiCEs, EuR mm
��,���
��,���
��,���
��,���
�
�,���
�,���
�,���
�,���
I II III IV I II III IV I II III IV I II III IV I II III IV I II
���� ���� ���� ���� ���� ����
��,���
��,���
��,���
��,���
�
�,���
�,���
�,���
�,���
Export Import Trade balance
LIThUANIA
�

ways to access the fastest rising foreign markets in South Eastern Asia, Latin America, etc. This requires more input from the government for the development and implementation of foreign trade strategies and more sizeable foreign direct investment (FDI).
LaCk oF invEstmEnt thREatEns sustainaBLE GRoWth oF thE EConomy
The Lithuanian economy is very short of capital invest-ments. This year, the expenditure on core capital formation accounted for just 15.5 per cent of GDP which is almost half the indicator of 2007 (28.1 per cent) and even less than a year ago (17.8 per cent) (see Diagram 1.2). Latest developments in investment flows are also a source of concern. Last year, investments at constant prices went up by 18.3 per cent but rose by a mere 2 per cent in the first half of this year and the annual indicator was even negative in the second quarter. Another disconcerting factor is the ratio between produc-tive investments (i.e. investments in vehicles and equipment) and the size of the economy which stood at just 5 per cent in the first half of the year. The indicator is much lower than in Estonia (10.7 per cent), Latvia (12.1 per cent) or the EU average (6.3 per cent). The flow of productive investments has been at a similar level for some time now and there are little if any signs of improvement.
Last year, foreign direct investment indicators were much better. The flow of investments stood at nearly LTL 3.6 billion in Lithuania and was up by 60 per cent from 2010, the FDI balance was also similar. However, the net FDI flow was negative in the first half of this year. In addition, investments into share capital fell from LTL 603 million last year to LTL 262 million this year. In terms of relative indicators, we are still far behind our neighbours. In the second quarter of 2012, accrued FDI per capita made up EUR 3,700 in Lithuania, EUR 4,700 in Latvia and EUR 10,200 in Estonia.
Diagram 1.2FixED invEstmEnt in Lithuania at CuRREnt PRiCEs, PER CEnt oF GDP
�
�
��
��
��
��
��
I II III IV I II III IV I II III IV I II III IV I II III IV I II
���� ���� ���� ���� ���� ����
�
�
��
��
��
��
��
Into machinery and equipment Other Total
RECovERy oF thE LaBouR maRkEt WiLL REmain sLoW
The number of jobless people, which rose close to 300,000 at the peak of the crisis, has been falling for a year and a half now. In the second quarter of this year, it stood at 223,000 and dropped by 16 per cent year-on-year. The unemployment rate declined to 13.3 per cent which is the best indicator in three years. In a year, youth unemployment went down by more than 8 percentage points to 25 per cent but was still considerably higher than the EU average (21 per cent). Although the unem-ployment rate has been declining, employment has not grown as fast as it could. The number of employed people which rose by 2 per cent last year increased by just 1.6 per cent in the first half of this year and stood at 1.4 million in the second quarter. It means that both new jobs and relentless emigration contrib-uted to the falling unemployment. In the first 10 months of this year, the number of emigrants exceeded that of immigrants by 19,000 in Lithuania, even though more people came to Lithuania this year and fewer left (see Diagram 1.3).
In Lithuania, the growth of wages remains the slowest among the Baltic States. Last year, the nominal net monthly wage grew by 2.4 per cent and added 2 per cent in the first half of this year rising to LTL 1,637 (EUR 484). However, since prices rose faster than wages, the real income of the population contracted by 1.6 per cent last year and by 0.7 per cent in 2012. Currently its level is slightly below the level of the beginning of 2007.
Still, the real income of the population should finally begin to grow in the second half of this year as prices are expected to rise at a more modest pace. The average annual inflation stood at 4.1 per cent last year and was at 3.4 per cent this September. This year, just like last year, the highest increase was in the prices of heating and gas. Lately, the cost of housing rent has also increased considerably. Prices of food rose much more slowly in 2012.
Diagram 1.3 Lithuania’s miGRation inDiCatoRs, thsD.
��.� ��.� ��.� ��.� ��.� ��.� ��.�
��.�
��.���.���.�
��.���.�
��.� ��.� �.���.�
��.� ��.� ��.� ��.� ��.� ��.� ��.� ��.����.� ���.�
���� ���� ���� ���� ���� ���� ���� ���� ���� ����
�� m.Immigrants Emigrants who have not declared their departure
Emigrants who have declared their departure
BALTIC ECONOMIC OUTLOOK | 2012
�

Encouraging financial results of companies suggest that there is room for wages to grow as the companies continued to boost their revenues and profits this year. Moreover, higher income of workers does not threaten the competitiveness of our economy because improvements in labour productivity have been outpacing the growth of wages for three consecu-tive years. It increased by 6.82 per cent last year and rose by 5.1 per cent in the first half of this year.
PuBLiC FinanCE ConsoLiDatED in thE shoRt tERm: timE to aDDREss LonG-tERm imBaLanCEs
Last year, the government budget deficit of Lithuania shrank to 5.5 per cent of GDP. Although this indicator was among the worst in the EU, it can be viewed as an acceptable result given the severity of the crisis of 2009 and exceptionally high unem-ployment which led to a very unfavourable balance between social income and expenditure. In terms of the budget consoli-dation effort (deficit fell by 1.7 percentage points last year), Lithuania was somewhere in the middle among the EU coun-tries as the improving budget balance mainly relied on aggres-sive cost cutting. The government expenditure to GDP ratio fell from 43.7 per cent in 2009 to 37.4 per cent last year. Of course, the improvement was also supported by a clear growth of the national economy. Across the EU, the Lithuanian government accounts for almost the smallest share of the economy as only Bulgaria has a lower expenditure to GDP ratio and the EU aver-age is 49 per cent. Lithuanian budget revenues are the lowest in the EU and accounted for just 31.9 per cent of GDP last year (the lowest ratio in the entire union). The relevant indicator was 35 per cent in Latvia, 39.4 per cent in Estonia and the EU average was 44.7 per cent.
Lithuania enjoys a relatively small public debt which stood at just 38.5 per cent of GDP last year. By comparison, the EU aver-age is 82.5 per cent. Public debt of the country has increased by 23 percentage points from to the pre-crisis level. In the EU, it
was an average indicator so it cannot be claimed that Lithuania was in an exceptionally bad situation. Moreover, Lithuania managed to recover the trust of capital markets. The price of credit default swaps (CDS) for the Lithuanian government gradually decreased since July of last year despite the turmoil across the EU and has recently reached the lowest level since the spring of 2007. In May, the Lithuanian government placed a 10-year USD 1.5 billion bond issue that currently offers a yield of just 3.5 per cent. This year, the debt level should rise above 40 per cent of GDP but it is expected to stabilise soon and stand at around 41 per cent in 2013 if the government continues on the path of public finance consolidation. A more pressing problem will be the social budget deficit which will have a negative impact on public finance. The current pension system has no future given the falling population numbers and slow growth of employment. It must be reformed providing for a closer correlation between current contributions and income at the retirement.
so far, the Lithuanian economy has demonstrated excep-tional resistance to the debt crisis in the euro area as exports continued to grow despite the downturn across the Eu. this relied on our favourable export geography and competitive producer prices. unfortunately, both these components that have led to success are under a serious threat now. Growth has slowed down on major export markets of our country: Russia, Latvia, Estonia, Poland, even Germany are slowing. moreover, a low level of investment implies that the competitiveness of our companies may not be sustainable in the long term. as the growth of exports slows down, the recovery of the domestic market and employment will also decelerate. the GDP revival triggered by a record-high crop harvest is only temporary and we may see a slowdown in the economic growth by the end of this year already. We believe that the Lithuanian GDP will increase by 2 per cent next year, i.e. by a smaller margin than this year, because of challenges on foreign markets and slower growth of domestic consumption.
LIThUANIA
�
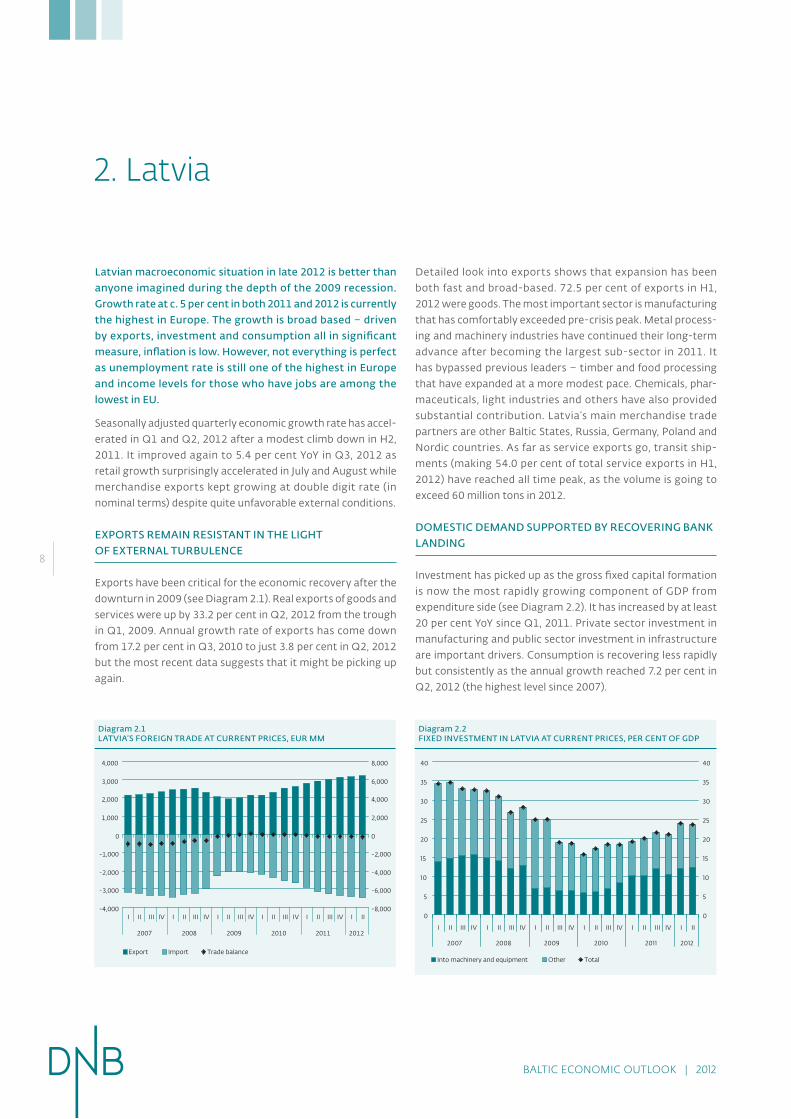
Latvian macroeconomic situation in late 2012 is better than anyone imagined during the depth of the 2009 recession. Growth rate at c. 5 per cent in both 2011 and 2012 is currently the highest in Europe. the growth is broad based – driven by exports, investment and consumption all in significant measure, inflation is low. however, not everything is perfect as unemployment rate is still one of the highest in Europe and income levels for those who have jobs are among the lowest in Eu.
Seasonally adjusted quarterly economic growth rate has accel-erated in Q1 and Q2, 2012 after a modest climb down in H2, 2011. It improved again to 5.4 per cent YoY in Q3, 2012 as retail growth surprisingly accelerated in July and August while merchandise exports kept growing at double digit rate (in nominal terms) despite quite unfavorable external conditions.
ExPoRts REmain REsistant in thE LiGht oF ExtERnaL tuRBuLEnCE
Exports have been critical for the economic recovery after the downturn in 2009 (see Diagram 2.1). Real exports of goods and services were up by 33.2 per cent in Q2, 2012 from the trough in Q1, 2009. Annual growth rate of exports has come down from 17.2 per cent in Q3, 2010 to just 3.8 per cent in Q2, 2012 but the most recent data suggests that it might be picking up again.
2. Latvia
Detailed look into exports shows that expansion has been both fast and broad-based. 72.5 per cent of exports in H1, 2012 were goods. The most important sector is manufacturing that has comfortably exceeded pre-crisis peak. Metal process-ing and machinery industries have continued their long-term advance after becoming the largest sub-sector in 2011. It has bypassed previous leaders – timber and food processing that have expanded at a more modest pace. Chemicals, phar-maceuticals, light industries and others have also provided substantial contribution. Latvia’s main merchandise trade partners are other Baltic States, Russia, Germany, Poland and Nordic countries. As far as service exports go, transit ship-ments (making 54.0 per cent of total service exports in H1, 2012) have reached all time peak, as the volume is going to exceed 60 million tons in 2012.
DomEstiC DEmanD suPPoRtED By RECovERinG Bank LanDinG
Investment has picked up as the gross fixed capital formation is now the most rapidly growing component of GDP from expenditure side (see Diagram 2.2). It has increased by at least 20 per cent YoY since Q1, 2011. Private sector investment in manufacturing and public sector investment in infrastructure are important drivers. Consumption is recovering less rapidly but consistently as the annual growth reached 7.2 per cent in Q2, 2012 (the highest level since 2007).
Diagram 2.1Latvia’s FoREiGn tRaDE at CuRREnt PRiCEs, EuR mm
��,���
��,���
��,���
��,���
�
�,���
�,���
�,���
�,���
I II III IV I II III IV I II III IV I II III IV I II III IV I II
���� ���� ���� ���� ���� ����
��,���
��,���
��,���
��,���
�
�,���
�,���
�,���
�,���
Export Import Trade balance
Diagram 2.2FixED invEstmEnt in Latvia at CuRREnt PRiCEs, PER CEnt oF GDP
�
�
��
��
��
��
��
��
��
I II III IV I II III IV I II III IV I II III IV I II III IV I II
���� ���� ���� ���� ���� ����
�
�
��
��
��
��
��
��
��
Into machinery and equipment Other Total
BALTIC ECONOMIC OUTLOOK | 2012
�

Both investment and consumption have benefited from the changing trends in the financial sector. Deleveraging of busi-nesses that followed the financial crisis in 2009 looks to be over – loan portfolio to non-financial institutions has expanded since June. Total loans to residents declined from LVL 16 625m in October 2008 to LVL 11 840m in May 2012 before climbing back to LVL 12 093m in September. In reality the loan portfolio growth might have started earlier as statistics is affected by write-downs of non-performing loans. However, deleveraging in the household sector is continuing because of a still very high risk aversion, cautious outlook for real estate prices and limited earning capacity. Still, we believe that the growth of private loan portfolio will restart sooner or later. This will add to posi-tive feedback loops already operating in the economy.
LaBoR maRkEt RECovERs But REaL WaGEs staGnatE
Headline unemployment numbers are still high – registered unemployment was 11.0 per cent in September. At the same time there is a sprawling debate about the meaning of this data. There are widespread reports about the shortage of labour among companies, pointing at structural unem-ployment problem that has several elements – geography, mismatch of skills and also confusion about “fair” wage level in some professions.
Wage growth so far has been very moderate. In fact, real annual wage growth exceeds 1 per cent only in Q2, 2012. Thus, most gains from the recovery have so far been accrued by the people exiting unemployment and business owners. Ratio of wages to GDP from expenditure side has continued to fall as the bargaining power in the labour market is still on the side of employers. Ratio has fallen to 40 per cent from 42 per cent a year ago while it exceeded 50 per cent in 2008.
Lowering of VAT rate by 1 p.p. from July 1, 2012 has led to decline of annual inflation rate below 2 per cent where it has remained at least till September (see Diagram 2.3). Nevertheless, moder-ation of commodity prices as well as still substantial slack in the labour market has supported disinflation as well.
FisCaL ConsoLiDation yiELDED siGniFiCant REsuLts
One of the most remarkable events has been the improvement of general government budget balance by LVL398.8mm or 3.6 p.p. of GDP in 9 months of 2012 compared to the same period last year. Budget surplus continued to grow in September despite additional spending measures. While seasonal spend-ing increases will shift the balance into deficit in Q4, it is likely to be at ca. 1 per cent of GDP and not 1.9 per cent as planned. Latvian fiscal policy will be the most growth-friendly among EU countries in 2013 when government aims to achieve 1.4 per cent of GDP deficit.
Despite cautious forecasts being proven wrong repeatedly, the risk of deepening euro area recession is very substantial and prudence requires to allow for a possibility of substantial growth slowdown in Latvia in 2013. The critical question for the near term outlook is whether the economy can maintain the growth momentum in the face of adverse external envi-ronment. Internal sectors of the economy employ most of the working population and even if exports fall at some point in time most people will not be affected unless the fall is going to last.
Diagram 2.3avERaGE annuaL inFLation in Latvia anD maastRiCht CRitERia, PER CEnt
��
�
�
�
�
��
��
��
����
/��
����
/��
����
/��
����
/��
����
/��
����
/��
����
/��
����
/��
����
/��
����
/��
����
/��
����
/��
����
/��
����
/��
Maastricht criteria Latvia VAT rate reduced from July
LATvIA
�

Estonian GDP went up by 8.3 per cent last year – the fastest growth rate in the Eu last year. in the first nine months of this year, the national economy grew by 3 per cent which again is one of the best indicators in the Eu. investment expen-diture has grown very strongly this year and the volume of exports also rose sharply. Last year, the nominal GDP stood at almost EuR 16 billion and was just fractionally below the pre-crisis level, while this year’s indicator will exceed it already. measured in purchasing power standards, the Estonian GDP per capita made up 67 per cent of the Eu average, hence the income gap has narrowed down considerably from 57 per cent of the Eu average in 2004.
ExPoRts havE DiPPED But ContinuE to DRivE thE EConomy
A small and open Estonian economy has been driven by exports for some time now. In the first eight months of this year, exports of goods from the country rose by 4.7 per cent year-on-year and grew at a much slower pace than a year ago (37.5 per cent). The considerable slowdown was mostly caused by declining exports of electronic goods to Sweden and USA. At the same time, the weight of these countries in the export structure also decreased. On the other hand, exports to Russia grew strongly this year and increased by a quarter. More goods were also exported to Lithuania and Latvia. Major export markets for Estonian goods this year were Sweden (15.9 per cent of total exports), Finland (14.9 per cent), Russia (11.8 per cent), Latvia (8.2 per cent) and Lithuania (5.3 per cent). Estonia’s attempts to broaden the diversification of its export portfolio and enter more exotic markets have yielded different results. Sales in Turkey, Mexico, Singapore and South Korea rose sharply this year but exports to China and Nigeria fell.
Estonia is still far ahead of the neighbours in terms of its rela-tive indicators. Last year, exports of services per capita stood at EUR 3,000 and were considerably higher than in Lithuania (EUR 1,600) or Latvia (EUR 1,200). The transport industry accounts for almost 40 per cent of invisible exports of Estonia. Besides, the country also enjoys much stronger exports of travel, communications, construction and business services compared to its neighbours. Therefore, it is hardly surprising that Estonia has a positive services trade balance. Last year, the surplus made up 7.8 per cent of GDP and rose to 8 per cent in the first half of this year. The positive balance of services trade
3. Estonia
has helped offset the balance of goods which has been nega-tive so far, and the total balance of trade was positive for the fourth consecutive year (see Diagram 3.1). For a while, Estonia also enjoyed a positive balance of the current account. In recent years, however, the indicator has been negative mostly due to income repatriation by foreign investors.
housEhoLD sPEnDinG Was CuRBED By BaD nEWs FRom thE Eu
Household consumption increased by 3.5 per cent at constant prices last year in Estonia and rose by another 3 per cent year-on-year in the first six months of this year. This growth was supported by gradually rising employment, decreasing saving rate and increasing nominal wages which grew faster than inflation and facilitated the improvement of real income. In addition, pensions paid by the state increased by 4.4 per cent in April. Still, household consumption has not recovered fully yet and is still by around 15 per cent lower than the peak of 2007–2008. A faster improvement of consumption has been curbed by rather pessimistic mood of households as the consumer sentiment index began deteriorating in the middle of last year. And even though the index has regained much of its strength since the beginning of 2012, the indicators are still worse than a year ago. Further reduction of the unemployment rate, continuing but slower rise of wages and improving mood will create favourable conditions for continuing recovery of household spending.
Diagram 3.1Estonia’s FoREiGn tRaDE at CuRREnt PRiCEs, EuR mm
��,���
��,���
��,���
��,���
��,���
�
�,���
�,���
�,���
�,���
�,���
I II III IV I II III IV I II III IV I II III IV I II III IV I II
���� ���� ���� ���� ���� ����
��,���
��,���
��,���
��,���
�
�,���
�,���
�,���
�,���
Export Import Trade balance
BALTIC ECONOMIC OUTLOOK | 2012
10

been a significant improvement this year and investment flows have almost reached the previous levels.
LaBouR maRkEt RECovERs, WaGE GRoWth outPaCEs PRiCE inFLation
During the crisis, unemployment rose from 3.9 per cent in early 2008 to 18.9 per cent in the first quarter of 2010 in Estonia. Since then, however, it has been gradually going down. Last year, the average unemployment rate was 12.4 per cent in Estonia and was markedly lower than in Lithuania (15.4 per cent) and Latvia (16.3 per cent). According to the latest statistics, unem-ployment fell below 10 per cent in Estonia in the third quarter of this year. Although the unemployment rate is still quite high, the number of vacant jobs is also considerable pointing at the potential of structural unemployment. Estonia has enjoyed the strongest growth of employment in the Baltic trio. In the first half of this year, the number of employed people increased by 3.7 per cent year-on-year (see Diagram 3.3). During the same period, the indicator increased by 1.6 per cent in Lithuania and 2.4 per cent in Latvia. Most new jobs were created in the public sector in Estonia. The average wage in Estonia continued to grow last year and went up by 5.8 per cent to EUR 691 (net). It added 4.5 per cent more in the first half of this year. At the same time, labour productivity improved by 4.1 per cent last year and 3.4 per cent in the first half of this year, so the price competi-tiveness of the labour force has stagnated. The nominal growth of earnings was stronger than inflation in the middle of last year, which means that the real wage began to grow after a break of several years. It increased by 0.2 per cent last year and rose by 1.4 per cent in the first half of this year.
Estonia continues to be tormented by a high inflation rate. Last year, the average annual inflation rate stood at 5.1 per cent in the country and was the highest in the Baltic states and one of the highest across the EU. This September it was still at 4.3 per cent. Lately, the steepest increase was in the prices of housing rent, car fuel, heating, services of hotels and restau-
PuBLiC invEstmEnt Boom WiLL EnD nExt yEaR
The level of investment in core capital formation is still lower than before the crisis by more than a third. And yet, invest-ments have grown at a remarkable rate in Estonia lately. Last year, the volume of capital investments rose by 25.7 per cent and increased by 23.2 per cent this year (see Diagram 3.2). Estonia was once again among the leaders in Europe in terms of productive investments (i.e. investments in vehicles and equipment). In the first half of this year, its productive invest-ments to GDP ratio stood at 10.7 per cent and was well above the EU average of 6.3 per cent.
Investments grew on the back of better financial situation of companies. Corporate indicators improved quite rapidly in 2011 and in the first half of this year as sales and profits were on the up. Moreover, companies have been more actively look-ing for external funding lately, and the portfolio of bank loans to the private sector finally began to grow last spring after the fall which lasted for 3.5 years. The debt ratio of the private sector, which is close to 80 per cent of GDP, is is much higher than in Lithuania and Latvia. Still, the indicator is not that high compared to Western European countries and it will pose no deleveraging threat in the nearest future, especially as the private sector is optimistic and eager to borrow.
This year, growth was particularly strong in public investments related to energy efficiency financed from the sale of carbon credits. Unfortunately, this boom is only temporary in nature as it is backed by one-off factors and these types of investments are very likely to fall next year.
Estonia has been an undisputed leader among the Baltic states in terms of its ability to attract foreign direct investment (FDI). In the middle of this year, accrued FDI per capita made up EUR 10,200 in Estonia (just EUR 3,700 in Lithuania and EUR 4,700 in Latvia). It has to be said though that the FDI flows have been quite modest in Estonia lately. Last year’s FDI flows were distorted by one major deal. If that deal is excluded, the FDI inflow dropped by 35 per cent last year. However, there has
Diagram 3.3EmPLoymEnt in Estonia By EConomiC aCtivity, annuaL ChanGE, PER CEnt
��.�
�.��.�
��.�
�.�
��.���.�
���.�
��.�
��.�
��.�
���.����.�
��.�
�.�
��.���.�
�.�
��.�
�.�
��.�
�.��.�
��.�
�.� �.� �.�
���.�
���� ���� ���� ���� H�
Total AgricultureManufacturing Construction
Domestic trade, transportation and storage Public sector
Other
Diagram 3.2FixED invEstmEnt in Estonia at CuRREnt PRiCEs, PER CEnt oF GDP
�
�
��
��
��
��
��
��
��
I II III IV I II III IV I II III IV I II III IV I II III IV I II
���� ���� ���� ���� ���� ����
�
�
��
��
��
��
��
��
��
Into machinery and equipment Other Total
ESTONIA
11

rants. At the same time, prices of food rose by a much smaller margin compared to the previous years. Next year, inflation in Estonia is expected to remain above 3 per cent as it will be supported by by rising wages and by increasing excise rates. On the other hand, inflation should no longer be fuelled by growing prices of raw materials in the coming years. Moreover, public transport has just become free in Tallinn.
PuBLiC FinanCE REmains vERy sounD
As Estonia has focused on improving the effectiveness of its public sector in recent years, the role of government began to weaken in the economy. In 2009, the government spending to GDP ratio stood at 43.5 per cent, fell to just 39 per cent last year and was much smaller than the EU average (44.7 per cent). Moreover, the budget balance was positive (1.2 per cent of the GDP) for the second year in a row mostly because of rapidly improving employment, income from the sale of carbon cred-its and delays in related investment projects. This year, the Estonian budget balance will be negative and deficit will be around 1 per cent as a result of restored budget payments to second pillar pension funds and increase of pensions. Next year, the budget balance will be affected negatively by ongoing one-
off investment projects and plans to raise wages in the public sector. Deficit is expected to make up about 1 per cent in 2013. Estonia continues to enjoy one of the smallest government debts in the EU. At the end of this year, it will stand at around 10 per cent of GDP, which is a perfect illustration of the sound financial situation in the country.
the Estonian economy has been driven by exports of services which are much better developed than in Latvia and Lithuania. unfortunately, the country has already faced weaker demand in some product groups and may expect a more modest growth of exports next year. it must also be kept in mind that the price competitiveness of workforce has not improved lately because the growth of wages was slightly faster than the improvement of labour productivity. although domestic consumption has recovered considerably, weaker growth of the economy will slow down the recovery of the labour market and will affect the development of household consumption. moreover, investment expenditure, which has exploded in recent years, is likely to grow more modestly next year. all these factors indicate that economic growth in the country will be more moderate at the end of this year and in 2013 compared to the last eighteen months.
BALTIC ECONOMIC OUTLOOK | 2012
12

Economic research unit
Lithuania
Rokas BancevičiusSenior [email protected]+370 5 2393 402
Mindaugas [email protected]+370 5 2 393 369
Latvia
Peteris Strautiņš[email protected]+371 6 7 777 266 1�