Baltic Household Outlook: Little change in household income 2011

Baltic
economic
outlook
Mārtiņš Āboliņš Economist

Global economy remains in a moderate cyclical slowdown in growth. OECD leading indicators show signs of stabilization.
Manufacturing and world trade remain the weakest link in the global economy. The China-US agreement has reduced the risks associated with world trade.
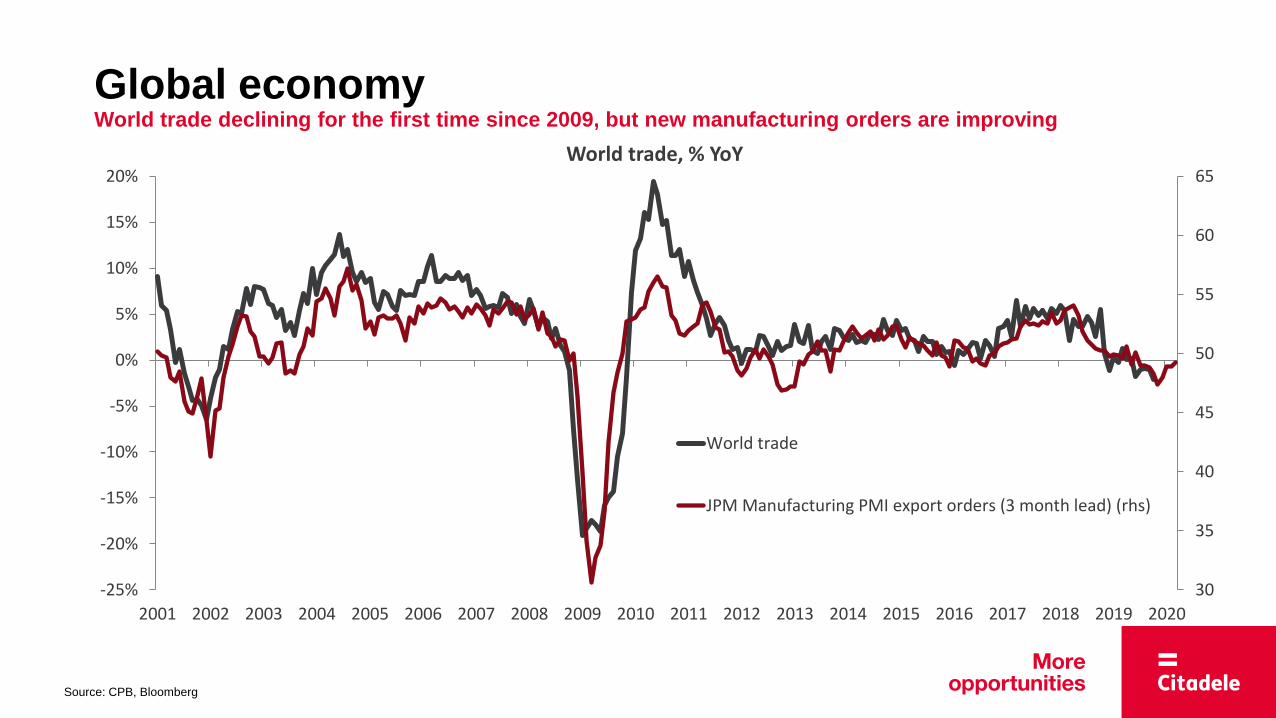
Service sectors and labour markets have not yet been affected by weakness in global manufacturing. However, these indicators respond to economic cycle fluctuations with a delay.
Concerns about the recession have not yet materialized, but risks remain and are still largely negative.
Most major central banks have cut interest rates and resumed stimulus measures in 2019, but fiscal policy will become less expansionary in 2020.
Financial markets are generally very positive. In the absence of negative surprises, global economic growth should pick up in the second half of the year.
Global economy The global economy is showing some signs of stabilization
95
96
97
98
99
100
101
102
103
1995199719992001200320052007200920112013201520172019
OECD composite leading indicator (100=long term average)
Source: OECD

Source: Bloomberg
Global economy Manufacturing remains the weakest link in the global economy
30
35
40
45
50
55
60
65
70
Ap
r-0
6
Au
g-0
6
De
c-0
6
Apr-
07
Au
g-0
7
De
c-0
7
Ap
r-0
8
Au
g-0
8
De
c-0
8
Ap
r-0
9
Au
g-0
9
De
c-0
9
Apr-
10
Au
g-1
0
De
c-1
0
Ap
r-1
1
Au
g-1
1
De
c-1
1
Ap
r-1
2
Au
g-1
2
De
c-1
2
Apr-
13
Au
g-1
3
De
c-1
3
Ap
r-1
4
Au
g-1
4
De
c-1
4
Ap
r-1
5
Au
g-1
5
De
c-1
5
Apr-
16
Au
g-1
6
De
c-1
6
Ap
r-1
7
Au
g-1
7
De
c-1
7
Ap
r-1
8
Au
g-1
8
De
c-1
8
Apr-
19
Au
g-1
9
De
c-1
9
Manufacturing PMI (values above 50 indicate expansion)
China Euro area US
30
35
40
45
50
55
60
65
-25%
-20%
-15%
-10%
-5%
0%
5%
10%
15%
20%
2001 2002 2003 2004 2005 2006 2007 2008 2009 2010 2011 2012 2013 2014 2015 2016 2017 2018 2019 2020
World trade, % YoY
World trade
JPM Manufacturing PMI export orders (3 month lead) (rhs)
Source: CPB, Bloomberg
Global economy World trade declining for the first time since 2009, but new manufacturing orders are improving
Global economy Weakness in manufacturing so far has not affected service sectors
Source: Eurostat, Bloomberg
30
35
40
45
50
55
60
65
70
-40
-30
-20
-10
0
10
20
30
40
2000 2001 2002 2003 2004 2005 2006 2007 2008 2009 2010 2011 2012 2013 2014 2015 2016 2017 2018 2019
Services confidence
Euro area
US (rhs)

7.6
3.6
0
2
4
6
8
10
12
14
1999 2000 2001 2002 2003 2004 2005 2006 2007 2008 2009 2010 2011 2012 2013 2014 2015 2016 2017 2018 2019
Unemployment rate, %
Euro area
United States
Source: Eurostat
Global economy Unemployment in the world has reached its lowest level in recent decades

Global economy Central banks have resumed monetary stimulus and the era of low interest rates is continuing
Source: Bloomberg
-5
0
5
10
15
20
25Benchmark policy rates
US UK Japan Euro area

Global economy GDP projections have been revised downwards, but a slight acceleration in growth is expected in 2020
Source: IMF, Bloomberg
3.4
3.8 3.6
3 3.1
1.6
2.4
2.9
2.3
1.9
6.7 6.8 6.6
6.1 5.9
1.9
2.5
1.9
1.2 1.0
2.2 2.5
1.5
0.5 0.6
2.4 2.4 2.3
1.2 1.2
2.8 3.0
1.7 1.45
1.2
2.4 2.3
1.5
2
1.5
0.3
1.6
2.3
1.2
1.7
0.0
1.0
2.0
3.0
4.0
5.0
6.0
7.0
8.0
2016
2017
2018
2019
2020
2016
2017
2018
2019
2020
2016
2017
2018
2019
2020
2016
2017
2018
2019
2020
2016
2017
2018
2019
2020
2016
2017
2018
2019
2020
2016
2017
2018
2019
2020
2016
2017
2018
2019
2020
2016
2017
2018
2019
2020
GDP in constant prices, % YoY
World USA China Euro area Germany Sweden Finland Denmark Russia

Source: Eurostat
4.2%
2.9%
3.7%
-1%
0%
1%
2%
3%
4%
5%
6%
7%
8%
201120122013201420152016201720182019Q1
2019Q2
2019Q3
Real GDP, % annual change
Euro area Estonia
Latvia Lithuania
Baltic region Strong growth continues in the Baltic region, but the Latvian economy has become significantly cooler
7.6%
-6.3%
8.3%
4.8%
6.9%
8.0%
16.1%
23.3%
-14.3%
5.9%
-0.9%
4.1%
2.0%
6.1%
-0.3%
13.4%
1.0%
5.2%
3.7%
3.7%
4.4%
4.0%
4.2%
10.8%
-20% -10% 0% 10% 20% 30%
Finance and insurance
Construction
Taxes on production
Manufacturing
Trade and transport
Professional services
Information andcommunication
Agriculture
GDP growth in Q3 2019, % YoY
Lithuania
Latvia
Estonia

Economic sentiment Weaker external environment has adverse impact on economic sentiment
Source: DG ECFIN
60
70
80
90
100
110
120
2000 2001 2002 2003 2004 2005 2006 2007 2008 2009 2010 2011 2012 2013 2014 2015 2016 2017 2018 2019
Economic sentiment index
Estonia Latvia
Lithuania Euro area

Lending Domestic lending in the Baltics is financed from domestic savings
0
5000
10000
15000
20000
25000
2008 2010 2012 2014 2016 2018
Loans to resident households and non-financial companies, MEUR
Estonia Latvia Lithuania
0%
50%
100%
150%
200%
250%
300%
350%
2008 2010 2012 2014 2016 2018
Resident loan-to-deposit ratio, %
Estonia Latvia Lithuania
Source: Bank of Latvia, Bank of Lithuania, Bank of Estonia

10.3
5.8
20.5
4.8
14.0
6.4
0
5
10
15
20
25
2004 2006 2008 2010 2012 2014 2016 2018
Price to income ratio in Baltic capitals, (Apartment prices relative to average annual gross salary)
Estonia Latvia Lithuania
-60%
-40%
-20%
0%
20%
40%
60%
2007 2009 2011 2013 2015 2017 2019
Real estate prices, % YoY
Estonia Latvia Lithuania
Real estate Real estate prices in the Baltics continue to grow, but mostly in line with wages
Source: Oberhaus, CSB, Statistics Estonia, Statistics Lithuania, Citadele calculations

External trade Trade balance in the Baltics has shifted from large deficits to surpluses
-25%
-20%
-15%
-10%
-5%
0%
5%
10%
2000 2001 2002 2003 2004 2005 2006 2007 2008 2009 2010 2011 2012 2013 2014 2015 2016 2017 2018 2019
External trade blanace, % GDP
Latvija
Igaunija
Lietuva
Source: Bank of Latvia, Bank of Estonia, Bank of Lithuania, Eurostat

-20%
-15%
-10%
-5%
0%
5%
10%
15%
20%
25%
2013 2014 2015 2016 2017 2018 2019
Export of goods, current prices (3m MA), % y-o-y
Estonia Latvia Lithuania World trade
External trade Exports in Baltics moving in line with global trade
Source: Eurostat, CPB Netherlands

Manufacturing The resilience of the Baltic manufacturing to the weakening of external demand is not unlimited
Source: Eurostat
-10%
-5%
0%
5%
10%
15%
20%
2012 2013 2014 2015 2016 2017 2018 2019
Manufacturing, % YoY (3 month MA)
Estonia Latvia Lithuania Germany

-10% -5% 0% 5% 10% 15% 20% 25%
Food products
Furniture
Chemicals
Cars and car parts
Wood products
Machinery and equipment
Textiles and apparel
Rubber, plastics, non-metalic minerals
Manufacturing (total)
Fabricated metal products
Computers, electronics and optics
Manufacturing by sectors I-XI 2019, % YoY
Lithuania
Latvia
Estonia
Manufacturing Electronics and metal products remain the best performing sectors
Source: Eurostat

New orders New industrial orders in Baltics declining in line with Germany and Scandinavia
-60
-40
-20
0
20
40
60
2001 2003 2005 2007 2009 2011 2013 2015 2017 2019
New industrial orders
Estonia Latvia Lithuania Scandinavia Germany
Source: DG ECFIN

Manufacturing Engineering industries are among the fastest growing sectors in the Baltics
0.5% 2.6%
5.2% 5.3% 5.9% 6.5% 6.6%
12.1% 12.8% 13.0% 13.7%
17.3% 18.2%
20.6% 23.0%
30.9% 31.7%
32.9% 34.3%
46.3% 47.3%
60.9%
0.0% 30.0% 60.0% 90.0%
United KingdomNorwayGreeceFrance
GermanyEU-28
ItalySpain
NetherlandsSweden
DenmarkCzechiaPortugalFinlandEstoniaPoland
RomaniaHungaryBulgaria
LatviaIreland
Lithuania
Industrial production in metal products, electronics, car parts and machinery 2019 comapred to 2015, %
Source: Eurostat

Services Business and ICT services remain the strongest performing sectors in the Baltics
-5.0%
0.4%
5.3%
4.4%
-2.4%
11.8%
6.6%
-50.6%
1.2%
5.2%
7.2%
14.6%
17.1%
36.8%
6.8%
3.5%
23.4%
23.1%
42.1%
20.8%
42.5%
-60% -40% -20% 0% 20% 40%
Finance
Tourism
Transport
Services (total)
Construction
IT and Telecoms
Business services
Export of services in Q3 2019, % YoY
Lithuania
Latvia
Estonia
0
100
200
300
400
500
600
700
2005 2007 2009 2011 2013 2015 2017 2019
Export of ICT and business services, MEUR/Q
Estonia Latvia Lithuania
Source: Bank of Latvia, Bank of Lithuania, Bank of Estonia

Construction Construction sector in the Baltics is past cyclical peak and growth is slowing down
-30%
-20%
-10%
0%
10%
20%
30%
40%
50%
2011 2012 2013 2014 2015 2016 2017 2018 2019
Construction, % YoY
Estonia Latvia Lithuania
Source: Eurostat

Construction The sentiment of construction companies indicates weak growth or a slight decline in construction in 2020
-100
-80
-60
-40
-20
0
20
40
60
80
2004 2005 2006 2007 2008 2009 2010 2011 2012 2013 2014 2015 2016 2017 2018 2019
Construction sentiment – activity in the last 3 months
Estonia Latvia Lithuania
Source: DG ECFIN

Trade Retail sales growth in the Baltics has slowed, but overall domestic consumption remains strong
-5%
0%
5%
10%
15%
20%
2011 2012 2013 2014 2015 2016 2017 2018 2019
Retail trade turnover in euros, % YoY (3 month average)
Estonia Latvia Lithuania
Source: Eurostat

Consumer confidence Slower economic growth has not yet affected consumer sentiment
-60
-50
-40
-30
-20
-10
0
10
20ja
nv.-
07
ma
ijs-0
7
se
pt.-0
7
janv.-
08
ma
ijs-0
8
sept.-0
8
jan
v.-
09
maijs
-09
se
pt.-0
9
jan
v.-
10
ma
ijs-1
0
se
pt.-1
0
jan
v.-
11
ma
ijs-1
1
se
pt.-1
1
jan
v.-
12
ma
ijs-1
2
se
pt.-1
2
jan
v.-
13
ma
ijs-1
3
se
pt.-1
3
jan
v.-
14
ma
ijs-1
4
se
pt.-1
4
jan
v.-
15
ma
ijs-1
5
se
pt.-1
5
jan
v.-
16
ma
ijs-1
6
se
pt.-1
6
jan
v.-
17
ma
ijs-1
7
se
pt.-1
7
jan
v.-
18
ma
ijs-1
8
se
pt.-1
8
jan
v.-
19
ma
ijs-1
9
se
pt.-1
9
Consumer confidence
Estonia Latvia Lithuania
Source: DG ECFIN

Inflation Consumer price inflation remains moderate
-6%
-4%
-2%
0%
2%
4%
6%
8%
2010 2011 2012 2013 2014 2015 2016 2017 2018 2019
Inflation (HICP), % y-o-y
Estonia Latvia Lithuania Euro area
Source: Eurostat

Labour market Unemployment in the Baltics is close to pre-crisis lows
0
5
10
15
20
25
2008 2010 2012 2014 2016 2018
Unemployment rate, %
-15%
-10%
-5%
0%
5%
10%
15%
2009 2011 2013 2015 2017 2019
Average gross monthly wage, % YoY
Estonia Latvia Lithuania
Source: Eurostat

Darba tirgus Household unemployment expectations have risen slightly but remain at a low level
-40
-20
0
20
40
60
80
100
2004 2005 2006 2007 2008 2009 2010 2011 2012 2013 2014 2015 2016 2017 2018 2019
Household unemployment expectations
Estonia Latvia Lithuania
Source: DG ECFIN

Global economy remains in a moderate cyclical slowdown in growth, but concerns about the
recession have not materialized. Short-term indicators point to a stabilization of the situation.
Business sentiment in the Baltics has deteriorated, the export sector is adversely affected by
weaker external demand and economic growth is likely to slow down. Short-term macroeconomic
indicators remain better than in 2016.
There is currently no significant macroeconomic imbalance in the Baltic States and concerns
about significant crisis are unfounded. Foreign trade is balanced, lending is financed by local
deposits and real estate prices relative to wages are significantly lower than in the pre-crisis period.
In 2019 Latvian economy was affected by several one-off factors. For example, the decrease in
transit freight, the negative impact of weather conditions on the energy sector, the sharp fall in wood
prices, changes in Estonian excise duties and tighter fiscal policy.
Economic growth in the Baltics in 2020 will continue to be supported by IT and business
services as well as domestic consumption sectors. Meanwhile, manufacturing will be negatively
affected by external factors, while slower activity in construction will be due to fluctuations in the EU
funds financing cycle.
In the medium term, the demographic situation and rapid wage growth remain the greatest
risks to the economic development of the Baltic region.
Conclusions Lead indicators signal further slowdown in growth

Thank you for attention!
AS “Citadele banka”
Republikas laukums 2A
Rīga, Latvija