
Economic outlook for ports · 2020. 2. 26. · Economic outlook for ports Theo Notteboom President...
20
Economic outlook for Economic outlook for ports ports Theo Notteboom President and professor, ITMMA - University of Antwerp, Belgium ESPO 2013- The European Sea Ports Conference Varna, Bulgaria – 30-31 May 2013
Transcript of Economic outlook for ports · 2020. 2. 26. · Economic outlook for ports Theo Notteboom President...
Economic outlook for Economic outlook for portsports Theo Notteboom President and professor, ITMMA - University of Antwerp, Belgium
ESPO 2013- The European Sea Ports Conference Varna, Bulgaria – 30-31 May 2013
EUROPEAN PORT TRAFFIC: SURPASSING PRE-CRISIS VOLUMES?

-20%
-15%
-10%
-5%
0%
5%
10%
15%
2006 2007 2008 2009 2010 2011 2012 Q1 2013
Pe
rcen
tage
gro
wth
co
mp
ared
to
th
e p
rrev
iou
s ye
ar
Total throughput
GDP growth EU27
Year-on-year growth in total EU port traffic (basis = ton) and EU GDP
Ports still ‘overreact’ to swings in economic growth
Traffic decline in 2012: -2% to 3.79 billion tons
Note: growth figures 2012 and Q1 2013 are estimates based on a sample of about 60 European ports
Traffic peaked in 2008: 4.18 billion tons

A weakening GDP multiplier?
Source: Alphaliner Weekly Newsletter, vol. 2013, issue 17, April 2013

The GDP multiplier in the EU container port system?
0.00
1.00
2.00
3.00
4.00
5.00
6.00
-10%
-05%
00%
05%
10%
15%
20%
2006 2007 2008 2009 2010 2011 2012 Q1 2013
TEU growth
GDP growth EU27
GDP Multiplier (right axis)New situation = negative GDP
growth combined with growth in
container volumes
Complexity behind TEU growth: Derived (economic activity) Substitution (containerisation) Incidental (traffic imbalances) Induced (transhipment)

-20%
-15%
-10%
-5%
0%
5%
10%
15%
2006 2007 2008 2009 2010 2011 2012 Q12013
Pe
rcen
tage
gro
wth
co
mp
ared
to
th
e p
rrev
iou
s ye
ar
Containers
Liquid bulk
Dry bulk
Conventional general cargo
Roro traffic
Total throughput
GDP growth EU27
Year-on-year growth in total EU port traffic (basis = ton) for cargo groups
The shock effect of 2009 and 2010 Mixed growth pattern after 2010
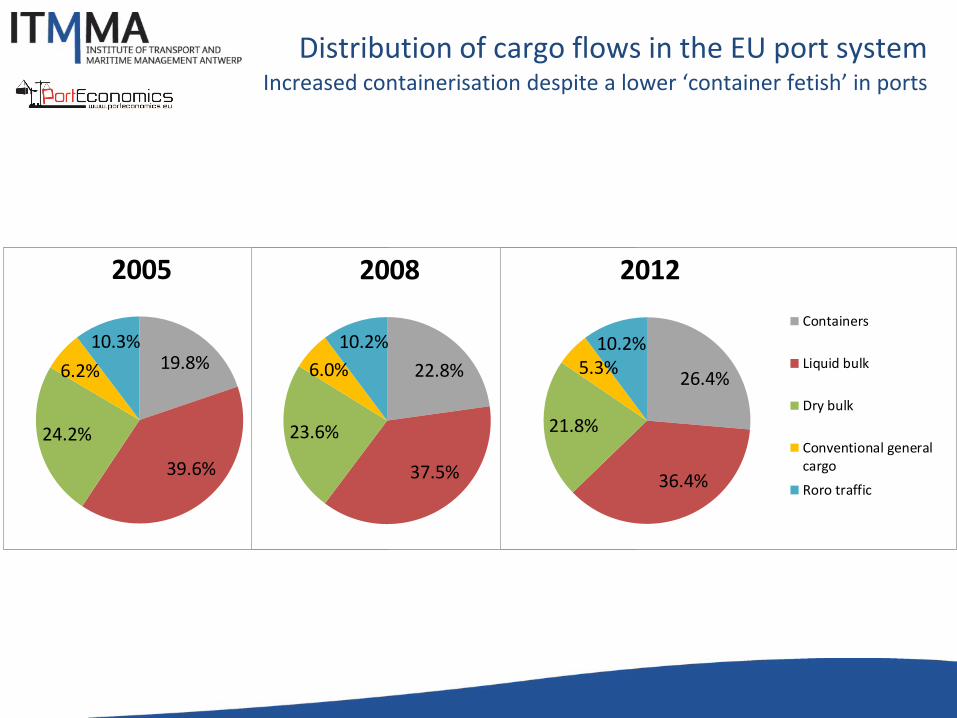
Distribution of cargo flows in the EU port system Increased containerisation despite a lower ‘container fetish’ in ports
19.8%
39.6%
24.2%
6.2%
10.3%
2005
Containers
Liquid bulk
Dry bulk
Conventional general cargo
Roro traffic
22.8%
37.5%
23.6%
6.0%
10.2%
2008
Containers
Liquid bulk
Dry bulk
Conventional general cargo
Roro traffic
26.4%
36.4%
21.8%
5.3%10.2%
2012
Containers
Liquid bulk
Dry bulk
Conventional generalcargo
Roro traffic

75
80
85
90
95
100
105
110
115
2005 2006 2007 2008 2009 2010 2011 2012 Q1 2013
Ind
ex e
volu
tio
n -
20
08
= 1
00
Containers
Liquid bulk
Dry bulk
Conventional general cargo
Roro traffic
Total
Are we back at pre-crisis traffic levels? Index evolution of throughput in the EU port system (2008=100)
Only container volumes managed to get above the 2008 level (+5% in 2012)
Liquid bulk saw a minor drop in 2009, but
records further traffic decline after 2009
Dry bulk and conventional general cargo
remain 15 to 20% below 2008 levels.
Total throughput is still about 10% below the 2008 level
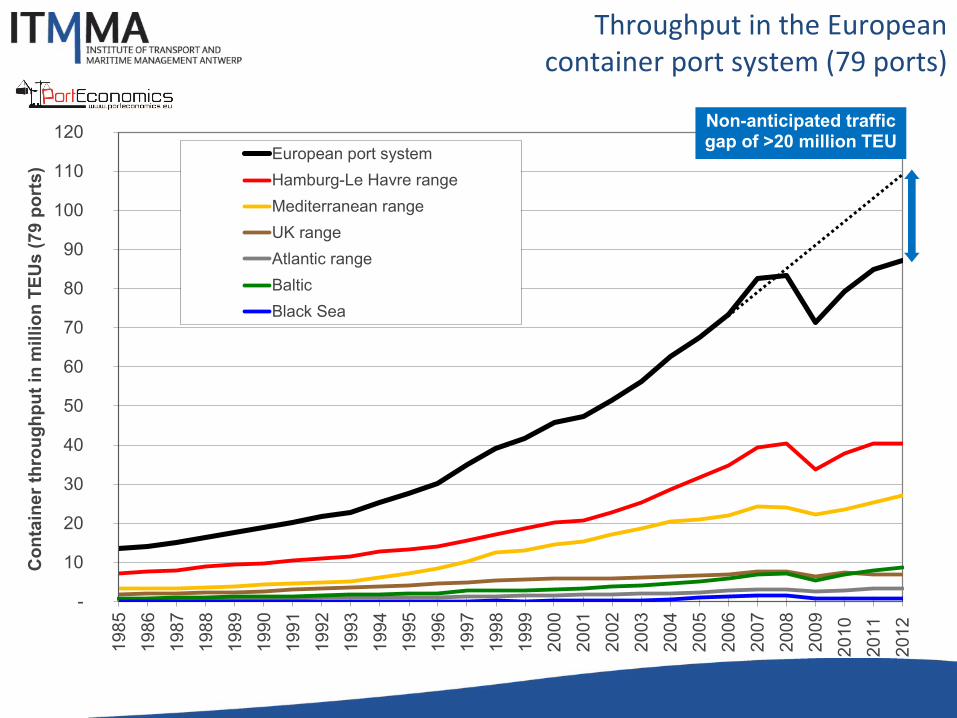
Throughput in the European container port system (79 ports)
-
10
20
30
40
50
60
70
80
90
100
110
1201985
1986
1987
1988
1989
1990
1991
1992
1993
1994
1995
1996
1997
1998
1999
2000
2001
2002
2003
2004
2005
2006
2007
2008
2009
2010
2011
2012
Co
nta
iner
thro
ug
hp
ut
in m
illi
on
TE
Us (
79 p
ort
s)
European port system
Hamburg-Le Havre range
Mediterranean range
UK range
Atlantic range
Baltic
Black Sea
Non-anticipated traffic gap of >20 million TEU
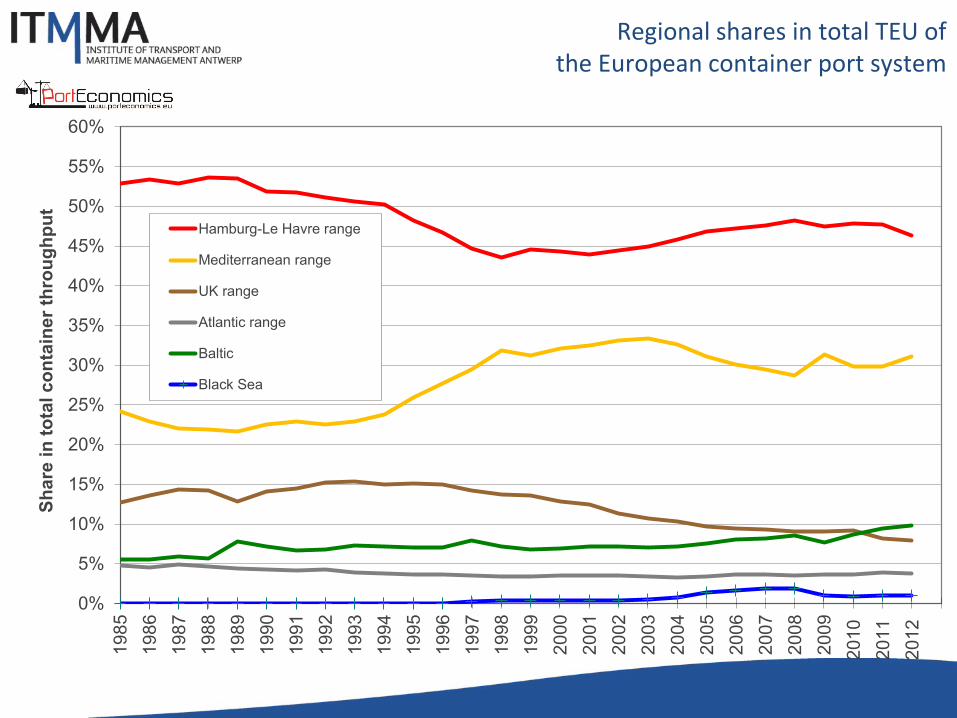
Regional shares in total TEU of the European container port system
0%
5%
10%
15%
20%
25%
30%
35%
40%
45%
50%
55%
60%1985
1986
1987
1988
1989
1990
1991
1992
1993
1994
1995
1996
1997
1998
1999
2000
2001
2002
2003
2004
2005
2006
2007
2008
2009
2010
2011
2012
Sh
are
in
to
tal co
nta
iner
thro
ug
hp
ut
Hamburg-Le Havre range
Mediterranean range
UK range
Atlantic range
Baltic
Black Sea

Middle East – Far East
Main shipping route
Americas
Americas
Transhipment/interlining port (transhipment incidence >75%)
Multi-port gateway region
Main shipping route
Gateway port
Gateway port also handling substantial transhipment flows
1
2
9
3
6
7
5
4
10
8
11
12
Main stand-alone gateways
2013 - T. Notteboom – ITMMA, University of Antwerp
UK
Germany
France
Belg.
NL
Ireland
Romania
Sweden
Spain
Croatia
Hungary
Czech Republic Slovakia
Serbia Bosnia&
Herz.
Alb.
Greece
Bulgaria
Turkey
Lithuania
Latvia
Estonia
Norway
Finland
Ukraine
Belarus
Russia
Portugal
Mace.
Den.
Austria
Switz.
Italy
Poland
Multi-port gateway regions (% in European TEU traffic)
Nantes-St-Nazaire
Bordeaux
Bilbao
Brest
Marseille-Fos
Sines
Lisbon
Leixoes
Valencia
Malaga Algeciras Cadiz
Barcelona
Tarragona
Cagliari
Gioia Tauro
Taranto Naples
Thessaloniki
Piraeus
Constantza
Le Havre
Rouen
Marsaxlokk
Genoa
Livorno
La Spezia Savona
Venice
Ravenna
Trieste Koper
Varna
Burga
s Vigo
Gijon Santander Ferrol (A) Antwerp
(B) Zeebrugge (C) Ghent (D) Rotterdam (E) Amsterdam (F) Dunkirk (G) Southampton (H) Felixstowe (I) Thamesport (J)Tilbury (K) Bremerhaven (L) Kotka (M) Hamina (N) Helsinki (O) Wilhelmshaven
(A) (B)
(C)
(D)
(E)
(F) (G)
(H)
(I) (J)
Lübeck Gdansk Gdynia
Hamburg (K)
Teesport
Hull
Grangemouth
Belfast
Dublin
Cork
Liverpool
Aarhus
Göteborg
Szczecin
Copenhagen
Malmö
Helsingborg
Oslo Bergen
Tallinn
Klaipeda
St-Petersburg
Ventspils Riga
Rauma
Turku
Stockholm
(L) (M)
(N)
Sevilla
Morocco Algeria Tunisia
Cyprus
Malta
(O)
Rijeka
2008 2012
1. Rhine-Scheldt Delta 24.7% 24.1%
2. Helgoland Bay 16.8% 15.8%
3. Seine Estuary 2.9% 2.6%
4. Portugese Range 1.4% 1.8%
5. Spanish Med range 6.9% 6.7%
6. Ligurian Range 4.5% 4.1%
7. North Adriatic 1.6% 1.9%
8. UK Southeast Coast 7.4% 6.3%
9. Gdansk Bay 0.9% 1.7%
10. Black Sea West 1.7% 0.9%
11. South Finland 1.6% 1.3%
12. Kattegat/The Sound 1.9% 1.8%
All 12 multi-port gateway regions 72.1% 69.0%
Stand-alone gatew ays 8.6% 11.8%
West Med hubs 11.3% 10.7%
Profile map of European seaport system
CONTAINERS
-80.00%-60.00%
-40.00%-20.00%
0.00%20.00%40.00%60.00%80.00%
100.00%120.00%140.00%160.00%
Pir
aeu
s
Gd
ansk
Sin
es
Cag
liari
Rig
a
Ko
pe
r
Leix
os
Rau
ma
The
ssal
on
iki
Talli
n
Mar
seill
e
Val
en
cia
Alg
ecir
as
Trie
ste
Du
nki
rk
Gen
oa
Nap
els
Ve
nic
e
Bre
me
n
Gd
ynia
Ro
tte
rdam
Mar
saxl
okk
Rije
ka
Go
the
nb
urg
Kla
ipe
da
Ko
tka
La s
pe
zia
An
twer
p
Rav
enn
a
Le H
avre
Ham
bu
rg
Zeeb
rugg
e
Lisb
on
Gio
ia T
auro
Legh
orn
Bar
celo
na
Co
nst
antz
a
Tara
nto
Savo
na
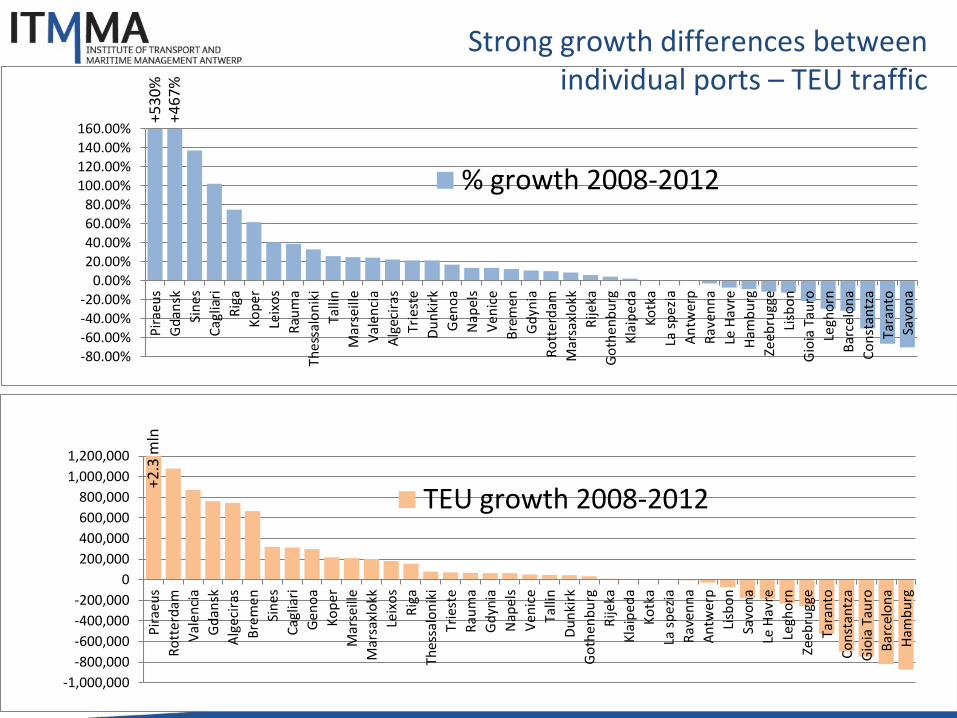
% growth 2008-2012+5
30
%+4
67
%
-1,000,000
-800,000
-600,000
-400,000
-200,000
0
200,000
400,000
600,000
800,000
1,000,000
1,200,000
Pir
aeu
s
Ro
tte
rdam
Val
en
cia
Gd
ansk
Alg
ecir
as
Bre
me
n
Sin
es
Cag
liari
Gen
oa
Ko
pe
r
Mar
seill
e
Mar
saxl
okk
Leix
os
Rig
a
The
ssal
on
iki
Trie
ste
Rau
ma
Gd
ynia
Nap
els
Ve
nic
e
Talli
n
Du
nki
rk
Go
the
nb
urg
Rije
ka
Kla
ipe
da
Ko
tka
La s
pe
zia
Rav
enn
a
An
twer
p
Lisb
on
Savo
na
Le H
avre
Legh
orn
Zeeb
rugg
e
Tara
nto
Co
nst
antz
a
Gio
ia T
auro
Bar
celo
na
Ham
bu
rg
TEU growth 2008-2012
+2.3
mln
Strong growth differences between individual ports – TEU traffic

MARKET CONDITIONS AND COMPETITION

Market volatility and uncertainty
• Uncertainty is not a new phenomenon but the related intensity seems to be changing;
• Non-linear developments, market volatility, trend breaks, ‘wild cards’, ‘Black Swans’
• Market volatility has exogenous (e.g. economic cycles) and endogenous causes (actions of market players)
IMPLICATIONSIMPLICATIONS Ports as buffers – “uncertainty is the mother of inventory” (M. Christopher) Traditional forecasting techniques and port planning/investment tools? Need for flexibility (via adaptive planning tools), resilience and agility

A snapshot of the current and short-term future market conditions and competitive pressures
Using Porter’s five forces model on competition
Pressure on margins Higher service levels for same or lower price Pressure towards differentiation and integration Hedging and spreading of risks
Challenge: how to increase a company’s share in the
cake?
Logistics sector has hardly any
influence on the size of the
cake
Consolidation results in less players trying to get a piece of the cake

A snapshot of the current and short-term future market conditions and competitive pressures
Using Porter’s five forces model on competition
‘Buyers’ of port services look for supply chain solutions and develop a strong network focus Ports operate in buyers’ markets: Shippers > logistics service providers > shipping lines > terminal operators and ports
However, margins are lowest for shipping lines: Refusal rate problem and GRIs + (forced) divestment in terminals and other activities

A snapshot of the current and short-term future market conditions and competitive pressures
Using Porter’s five forces model on competition
Incumbents defense of market share Market-based barriers to entry Capital requirements and access to capital Economies of scale (cf. container shipping) Less barriers in times of abundance, more barriers when players are facing hard times Threat of government (shelter) policies
Leader/follower Slow steaming Daily service? Impact on no. of ports of call

20
New kids on the block? Container market in Hamburg-Le Havre range
BELGIUMGERMANY
NETHERLANDS
Amsterdam
Rotterdam
AntwerpGhent
OstendZeebrugge
Flushing
Wilhelmshaven
Emden Bremerhaven
Hamburg
Dunkirk
Rouen
Le Havre
Entrants in other regions: - Rise of Gdansk (impact on
H-LH range) - Revival of Piraeus - London Gateway ? - Etc..
Wilhelmshaven JadeWeserPort (opened in Summer 2012)
25,000 TEU in 2012 Prospects for 2013 ?
Amsterdam Ceres Paragon Terminal – later renamed to ACT
(open in 2001 – closed in 2012)
Flushing WCT Window of opportunity ?

Conclusions
• EU port traffic volumes are still below 2008 levels (except for containers), although big differences exist between ports
• Ports are facing a multi-layered buyers’ market situation
• No signs that we will move to a sellers’ market in the short or medium term (cf. economic activity, capacity in the market)
• Ports that do not respond adequately to the buyers’ market imperatives will lose ground.
• Guarantee ports’ autonomy and adaptive capabilities to develop appropriate responses to volatility in the market and requirements of ‘buyers’.