Balanced scorecard presentation rev 0
35
Jennifer Allen Vincent Wedelich
-
Upload
vincent-wedelich-pe-mba -
Category
Business
-
view
31 -
download
2
Transcript of Balanced scorecard presentation rev 0

Jennifer AllenVincent Wedelich

Balanced Scorecard overview
Construction of BSC◦ Financial ◦ Customer◦ Internal-Business Process◦ Learning and Growth
Linking BCS Measures to Your Strategy
Structure and Strategy

• Managers, like pilots, require instrumentation to monitor the journey toward future success
• Balanced Scorecard provides the instrumentation

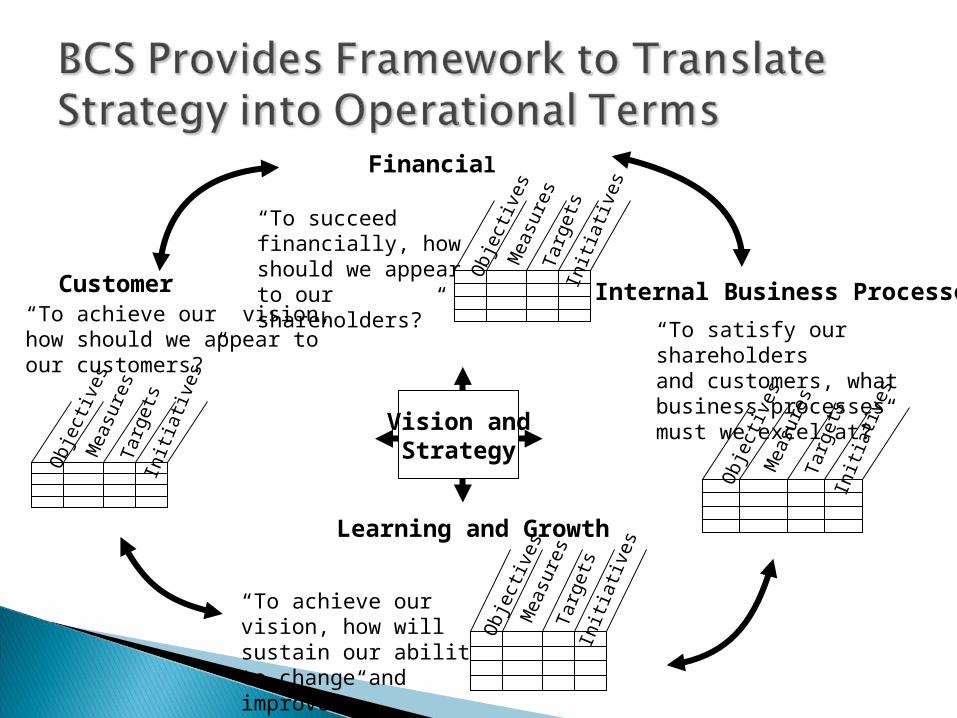
• Balanced Scorecard - translates mission and strategy into a comprehensive set of performance measures that provides the framework for a strategic measurement and management system.
• Typically organized into four different perspectives• Financial• Customer• Internal Business Processes• Learning and Growth
Obj
ectiv
esM
easu
res
Tar
gets
Initi
ativ
esVision andStrategy
Financial
Internal Business Processes
Learning and Growth
Customer
“To succeed financially, how should we appear to our shareholders?”
“To satisfy our shareholders and customers, what business processes must we excel at?”
“To achieve our vision, how will sustain our ability to change and improve?”
“To achieve our vision, how should we appear to our customers?”
Obj
ectiv
esM
easu
res
Tar
gets
Initi
ativ
es
Obj
ectiv
esM
easu
res
Tar
gets
Initi
ativ
es
Obj
ectiv
esM
easu
res
Tar
gets
Initi
ativ
es

BSC is for strategy implementation, not strategy formulation
Four perspectives are not concrete
BSC is best implemented at SBU level
BCS is built on cause-and-effect relationships
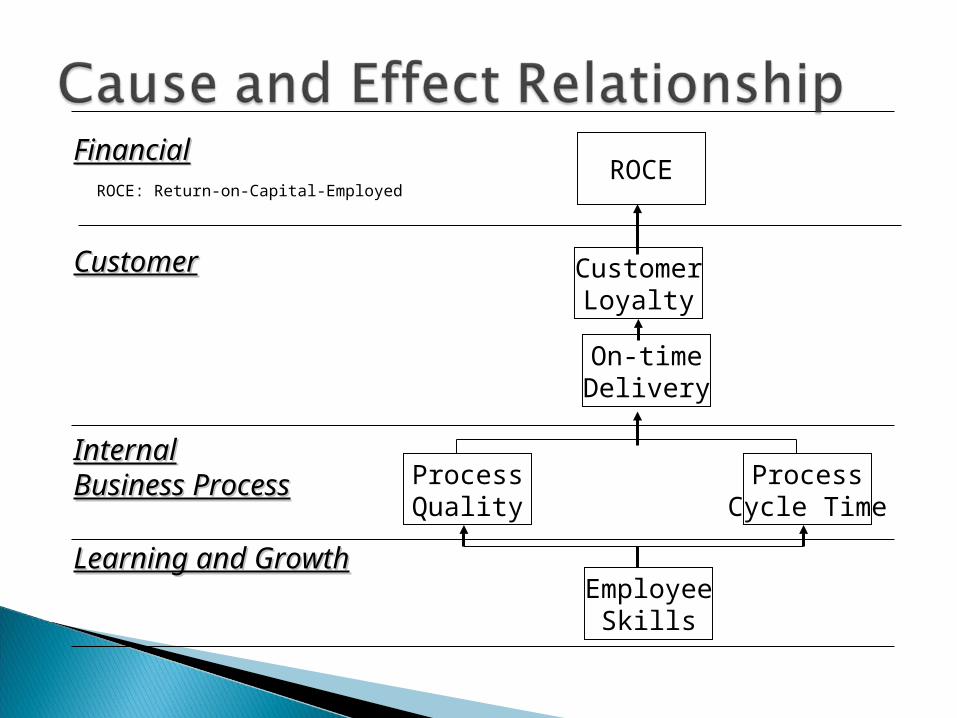
ROCE
On-timeDelivery
CustomerLoyalty
ProcessCycle Time
ProcessQuality
EmployeeSkills
FinancialFinancial
CustomerCustomer
InternalInternalBusiness ProcessBusiness Process
Learning and GrowthLearning and Growth
ROCE: Return-on-Capital-Employed
Is it necessary to have a financial perspective?
Why have any others?

Scorecard should start by CEO and CFO establishing long-run financial objectives
Financial objectives may change due to technology, market, or regulations
Financial objectives for all business units should be reviewed periodically
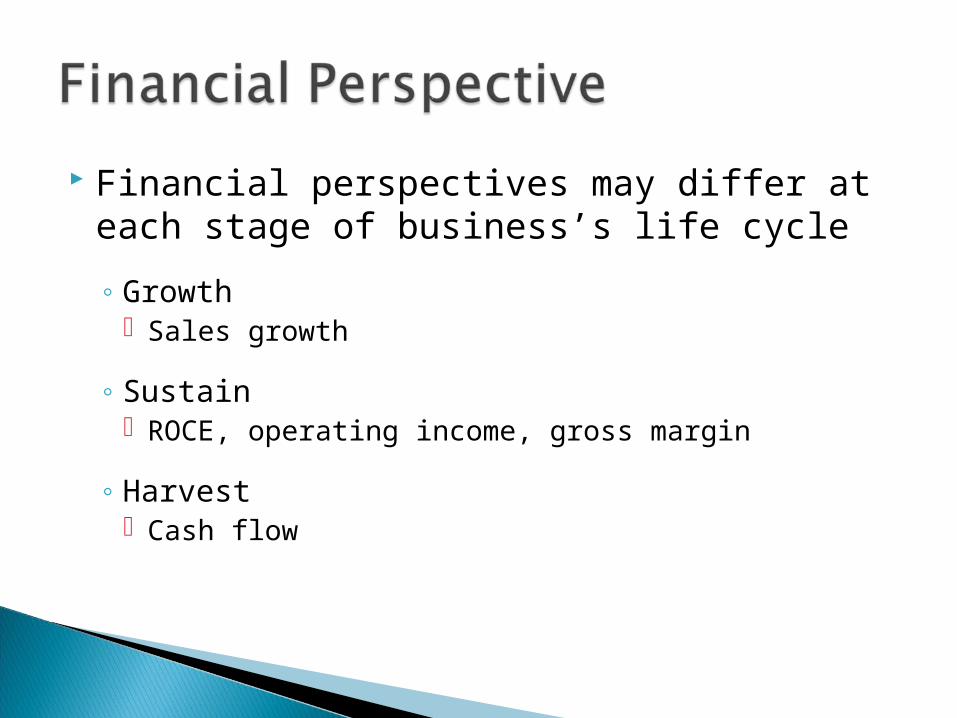
Financial perspectives may differ at each stage of business’s life cycle
◦ Growth Sales growth
◦ Sustain ROCE, operating income, gross margin
◦ Harvest Cash flow
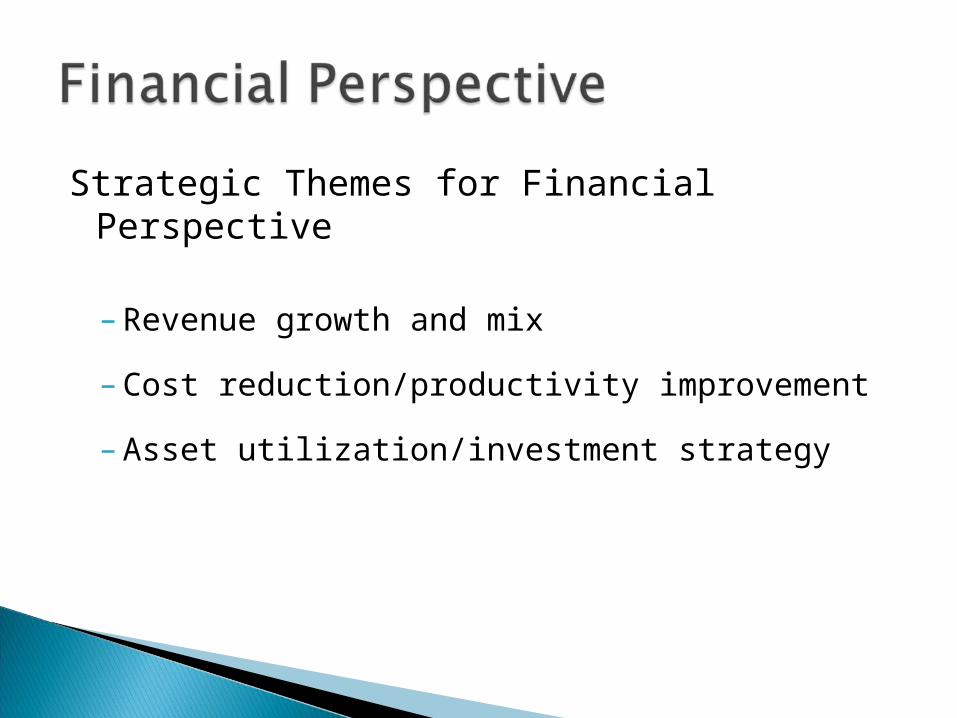
Strategic Themes for Financial Perspective
– Revenue growth and mix
– Cost reduction/productivity improvement
– Asset utilization/investment strategy
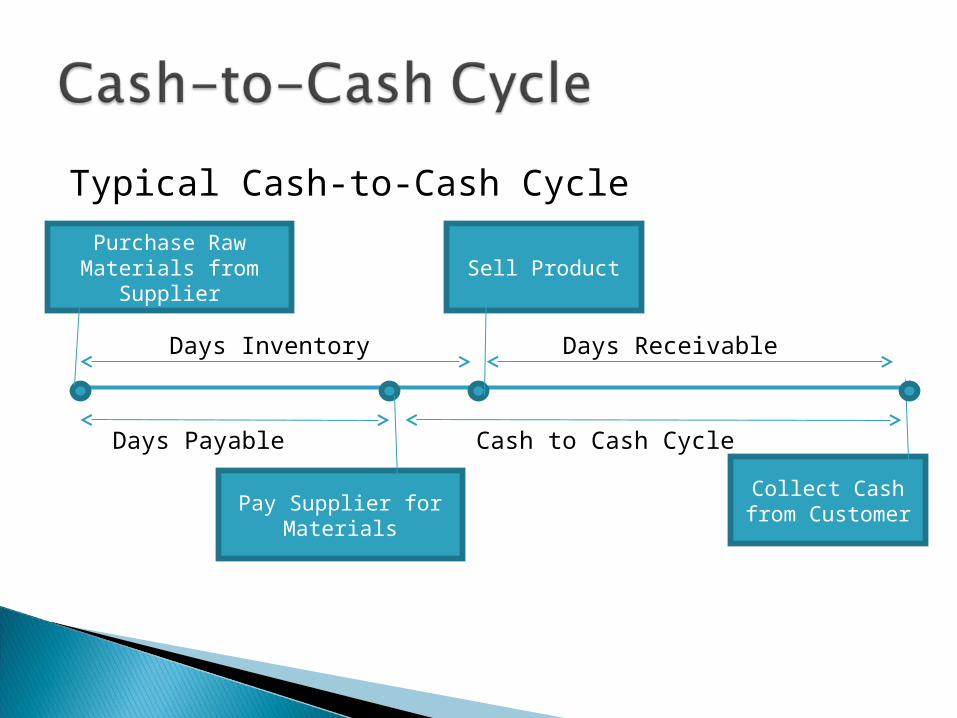
Typical Cash-to-Cash Cycle
Purchase Raw Materials from
SupplierSell Product
Pay Supplier for Materials
Collect Cash from Customer
Days Inventory Days Receivable
Days Payable Cash to Cash Cycle

Sell Product
Pay Supplier for Materials
Collect Cash from Customer
NegativeCash to Cash Cycle
Purchase Raw Materials from
Supplier
Dell Cash-to-Cash Cycle


Internal Business Process Perspective
Identifies specific internal processes that the firm should focus on
Goal: attract & keep customers (customer satisfaction), also satisfy shareholders (meet financial goals)
This approach helps identify new processes the firm may not have implemented or thought to put into place
Slide Developed by Dr. Papadopoulos.

Internal Business Process Perspective
The internal business process perspective model encompasses three principal business process:
Innovation process
Operations process
Postsale service Process
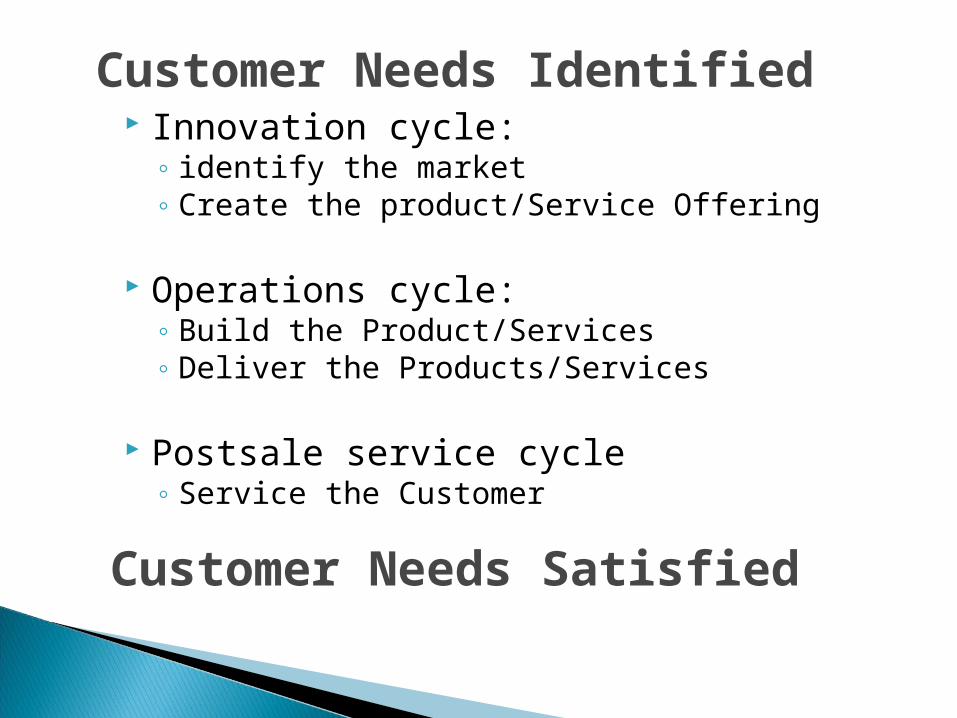
Customer Needs Identified Innovation cycle:
◦ identify the market◦ Create the product/Service Offering
Operations cycle:◦ Build the Product/Services◦ Deliver the Products/Services
Postsale service cycle◦ Service the Customer
Customer Needs Satisfied

Internal Business Process Perspective
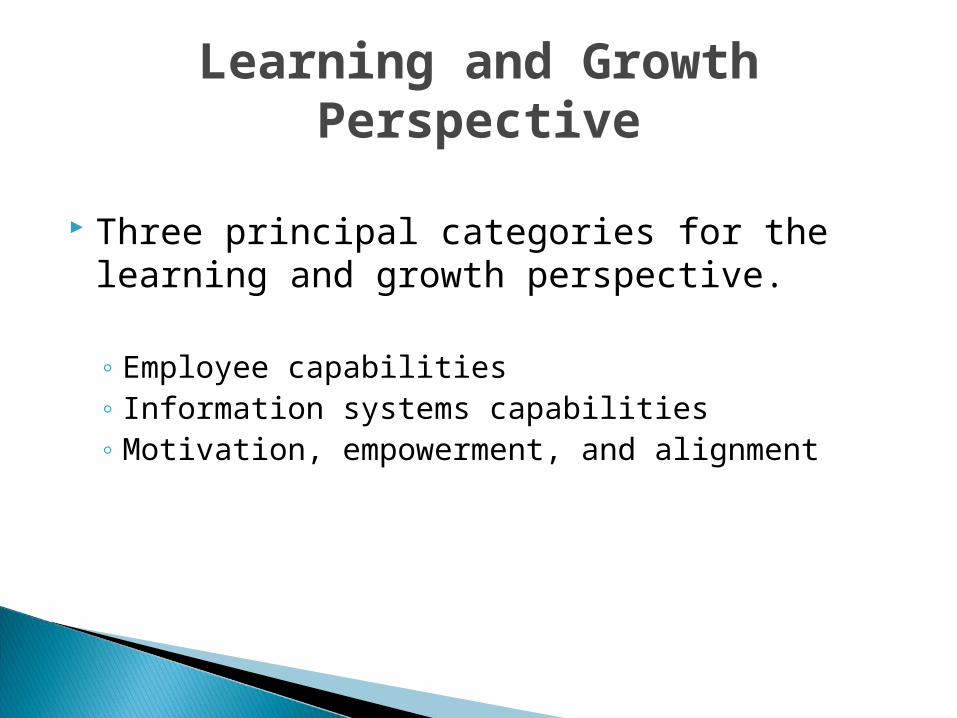
Learning and Growth Perspective
Three principal categories for the learning and growth perspective.
◦ Employee capabilities◦ Information systems capabilities◦ Motivation, empowerment, and alignment
Learning and Growth Perspective
Helps to build and maintain the needed infrastructure a firm must have to grow and improve
3 sources:◦ People (skills and training)◦ Systems (technology)◦ Organizational procedures (aligns employee
incentives with the firm’s goals)
Slide Developed by Dr. Papadopoulos.
Learning and Growth Perspective
Core employee measurement group◦ Employee satisfaction◦ Employee retention◦ Employee productivity
Put the graph on page 129 here.
Learning and Growth Perspective
Employee Satisfaction
◦ Involvement with decision.◦ Recognition for doing a good job.◦ Access to sufficient information to do the job well.◦ Active encouragement to be creative and use
initiative◦ Support level from staff functions◦ Overall satisfaction with company

Learning and Growth Perspective
Employee retention captures an objective to retain those employees in whom the organization has a long term interest.
Employee productivity is an outcome measure of the aggregate impact from enhancing:
◦ Employee skills◦ Morale◦ Innovation◦ Improving processes◦ Satisfying customers
Learning and Growth Perspective
Add pictures from book
Page 133 Page 134 Page 135 Page 140

Linking Balanced Scorecard Measures to Your Strategy
The scorecard describes the organizations vision of the future to the entire organization.
The scorecard creates a holistic model enabling everyone in the organization to contribute to the success of the company.
The scorecard focuses change efforts. If the right objectives and measures are identified, successful implementation will likely occur.

Linking Balanced Scorecard Measures to Your Strategy
The BSC should be linked to the strategy.
1) Cause and Effect Relationships.
2) Performance drivers.
3) Linkage to financials.
Linking Balanced Scorecard Measures to Your Strategy
Cause and Effect
A strategy is a set of hypothesis about cause and effect. Cause and effect relationships can be expressed by a sequence of if-then statements.
Linking Balanced Scorecard Measures to Your Strategy
Outcomes and Performance Drivers
The generic outcome measures tend to be lag indicators.
◦ Profitability◦ Market-Share◦ Customer satisfaction◦ Customer retention◦ Employee Skills

Linking Balanced Scorecard Measures to Your Strategy
Outcomes and Performance Drivers
The performance drivers tend to be lead indicators, these are unique for each business.
◦ Financial drivers of profitability◦ The market segment in which the unit chooses to
compete◦ The particular internal processes and learning and
growth objectives that will deliver the value propositions to target customers and market segments.
Linking Balanced Scorecard Measures to Your Strategy
A good balanced Scorecard should have an appropriate mix of outcomes (lagging indicators) and performance drivers (leading indicators) that have been customized to the business unit’s strategy.
Linking Balanced Scorecard Measures to Your Strategy
Page 154 Page 155 Page 157 Page 160
Structure and Strategy This chapter illustrates the development of
scorecards for organizations that are structurally different than business units:
◦ Corporations that consist of a collection of strategic business units.
◦ Joint Ventures◦ Support departments in corporations and
business units◦ Not-for-profit and governmental enterprises
Structure and Strategy A corporate scorecard requires an explicit
corporate level strategy that articulates the theory of how the corporation adds value to its collection of strategic business units.
Structure and Strategy A balanced scorecard can also provide substantial
focus, motivation, and accountability in government and not-for-profit organizations.
The scorecard provides rationale for their existence (serving customers and constituents, not simply containing spending to within budgetary constraints), and communicating to external constituents and internal employees the outcomes and performance drivers by which the organization will achieve its mission and strategic objectives.

Structure and Strategy Page 171 Page 174 Page 177 Page 178 Page 182