Balanced Scorecard
88
BALANCED SCORECARD AS PERFORMANCE MANAGEMENT TOOL By VELUSAMY.NP (REG. NO. 0929170) A PROJECT REPORT Submitted to the CRESCENT BUSINESS SCHOOL in partial fulfillment of the requirements for the award of the degree of MASTER OF BUSINESS ADMINISTRATION APRIL 2011
Transcript of Balanced Scorecard
BALANCED SCORECARD AS PERFORMANCE MANAGEMENT TOOL
By
VELUSAMY.NP
(REG. NO. 0929170)
A PROJECT REPORT
Submitted to the
CRESCENT BUSINESS SCHOOL
in partial fulfillment of the requirements
for the award of the degree of
MASTER OF BUSINESS ADMINISTRATION
APRIL 2011
BONAFIDE CERTIFICATE
Certified that the project report titled “Balanced Scorecard as Performance
Management Tool” is the bonafide work of Velusamy.NP who carried out the research
under my supervision. Certified further, that to the best of my knowledge the work
reported herein does not form part of any other project report or dissertation on the basis
of which a degree or award was conferred on earlier occasion on this or any other
candidate.
L.ARAVIND KUMARAN Dr. MIRZA S. SAIYADAIN VIJAY SAMPATH
Associate professor, CBS Dean, CBS External Guide
Internal Guide
ACKNOWLEDGEMENT
I express my profound thanks to our respected Vice-Chancellor Dr. P.
KANNIAPPAN, M.Sc. Ph.D., and our Registrar Dr. V.M. PERIASAMY, B.E., M.E.,
Ph.D., for their enthusiastic support and help in providing all resources behind the scenes.
I wish to regard my sincere thanks to Dr. MIRZA S. SAIYADAIN, M.A., Ph.D.,
Professor and Dean, Crescent Business School, B.S. Abdur Rahman University,
Vandalur, Chennai – 600048.
I would like to thank to my guide L.ARAVIND KUMARAN, Assistant Professor,
Crescent Business School, for her full involvement in every part of my project.
My sincere thanks to SUVANDHU MAHAPATRA, Assistant vice President,
Operational Excellence, Zenta Knowledge Service for permitting me to pursue my
summer project at Company name. I would like to thank my external guide VIJAY
SAMPATH, Senior Manager, Operational Excellence, Zenta Knowledge Service. For his
morale support and encouragement, which helped me in carrying out the project
successfully.
I sincerely thank all the staff members of the Crescent Business School for their
valuable advice and kind cooperation, without which the project would not have emerged
as a successful one.
It is once again a pleasure to acknowledge to my parents, friends and family members
for their constructive and valuable suggestions towards improvement of this project.
VELUSAMY.NP
ABSTRACT
The Balanced Scorecard is the strategic planning and management system. It
helps to align business activities to the vision and strategy of the organization; it
improves internal and external communication, and monitor organization performance
against strategic goals. Zenta follows various metric to measure the overall performance
of the organization this project I am trying to fit all of the Zenta metric to a balanced
scorecard framework. This helps to measure and control and to align all business
activities into vision and strategy of the organization.
In balanced scorecard all the four perspectives of Kaplan and Norton is
considered and analysis is preceded according to these perspectives. In Zenta all
measured metrics are considered as strategic objective. And according to these strategic
objectives strategic measurement is done with the help Lagging and Leading indicator
As the balanced scorecard is the performance management tool it will consider
the Cause and Effect relationship for all the metric along with this performance drivers
and outcomes for each and every strategy which is formulated are measured, which will
show the performance of the strategy after it is implemented. So it makes mangers to
make right decision which results in organizational growth and development.
Normally balanced scorecard follows Top to Bottom approach of management all
the decisions are made at higher level and it is communicated to the lower level. Goals
framed according to the vision and it is classified and personal goals are aligned and
communicated to the employees. So in single scorecard all the aspects are considered and
performance of each and every strategy are measured this made to call balanced
scorecard as effective performance management tool. This entire project this is taken as
base line project is proceeded.
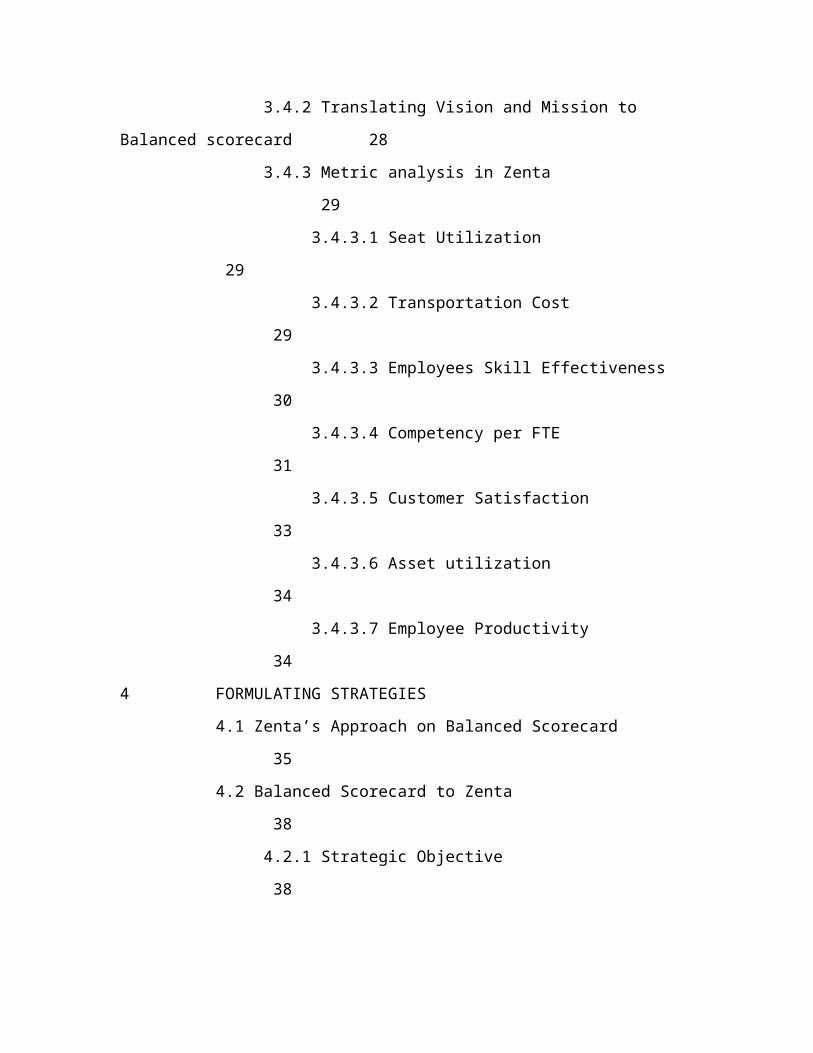
TABLE OF CONTENTS
CH NO CONTENTS PAGE NO
1 INTRODUCTION
1.1 company profile 1
1.1.1 Quality certification 2
1.1.2 Corporate philosophy 2
1.2 Introduction to balanced scorecard 4
1.2.1 History 4
1.3 Need of study 6
1.4 Objectives of balanced scorecard 7
1.5 Scope of balanced scorecard as performance Management tool 8
2 LITERATURE
2.1 Review of literature 9
2.1.1 Kaplan and Norton Approach of Balanced scorecard 9
2.1.1.1 Perspectives of Kaplan and Norton
11
2.1.1.2 Linking the Balanced Scorecard Measures
to Strategic Metric 13
2.1.1.3 Benefits of balanced scorecard 15
2.1.2 Performance Management system 16
2.1.2.1 Benefits of performance management system 17
3 MEASURING BUSINESS STRATEGIES
3.1 designs of balanced scorecard 19
3.1.1 Improved design method of Kaplan and Norton 20
3.2 Key measures of balanced scorecard 21
CH NO CONTENTS PAGE NO
3.3 Data collection method 25
3.4 Zenta business measurement System 26
3.4.1 Goal Flow 26
3.4.2 Translating Vision and Mission to Balanced scorecard 28
3.4.3 Metric analysis in Zenta 29
3.4.3.1 Seat Utilization 29
3.4.3.2 Transportation Cost 29
3.4.3.3 Employees Skill Effectiveness 30
3.4.3.4 Competency per FTE 31
3.4.3.5 Customer Satisfaction 33
3.4.3.6 Asset utilization 34
3.4.3.7 Employee Productivity 34
4 FORMULATING STRATEGIES
4.1 Zenta’s Approach on Balanced Scorecard 35
4.2 Balanced Scorecard to Zenta 38
4.2.1 Strategic Objective 38
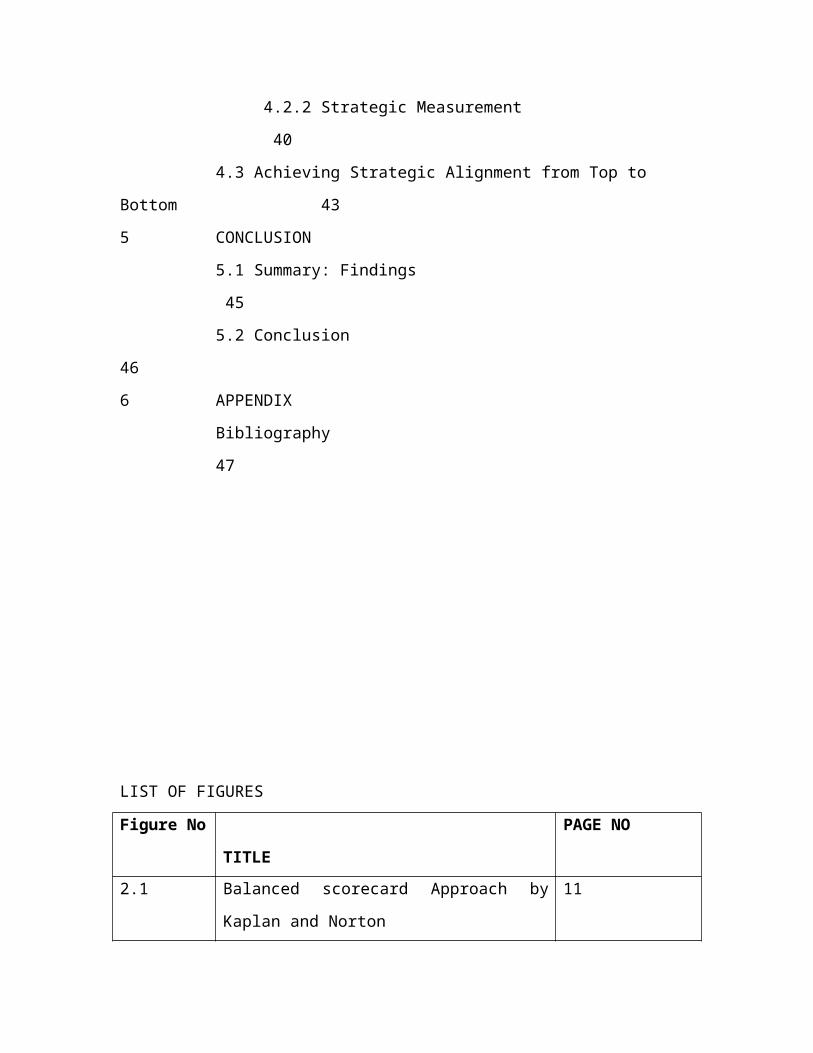
4.2.2 Strategic Measurement 40
4.3 Achieving Strategic Alignment from Top to Bottom 43
5 CONCLUSION
5.1 Summary: Findings 45
5.2 Conclusion 46
6 APPENDIX
Bibliography 47
LIST OF FIGURES
Figure No TITLE PAGE NO
2.1 Balanced scorecard Approach by Kaplan and
Norton
11
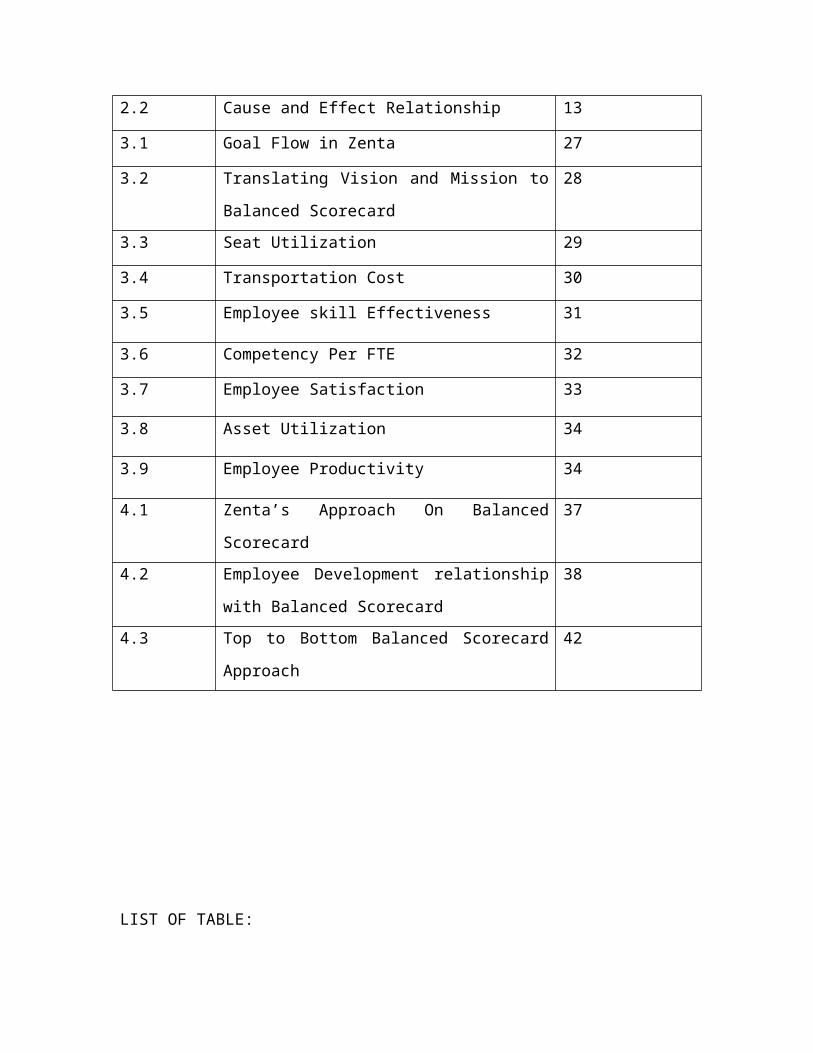
2.2 Cause and Effect Relationship 13
3.1 Goal Flow in Zenta 27
3.2 Translating Vision and Mission to Balanced
Scorecard
28
3.3 Seat Utilization 29
3.4 Transportation Cost 30
3.5 Employee skill Effectiveness 31
3.6 Competency Per FTE 32
3.7 Employee Satisfaction 33
3.8 Asset Utilization 34
3.9 Employee Productivity 34
4.1 Zenta’s Approach On Balanced Scorecard 37
4.2 Employee Development relationship with
Balanced Scorecard
38
4.3 Top to Bottom Balanced Scorecard Approach 42
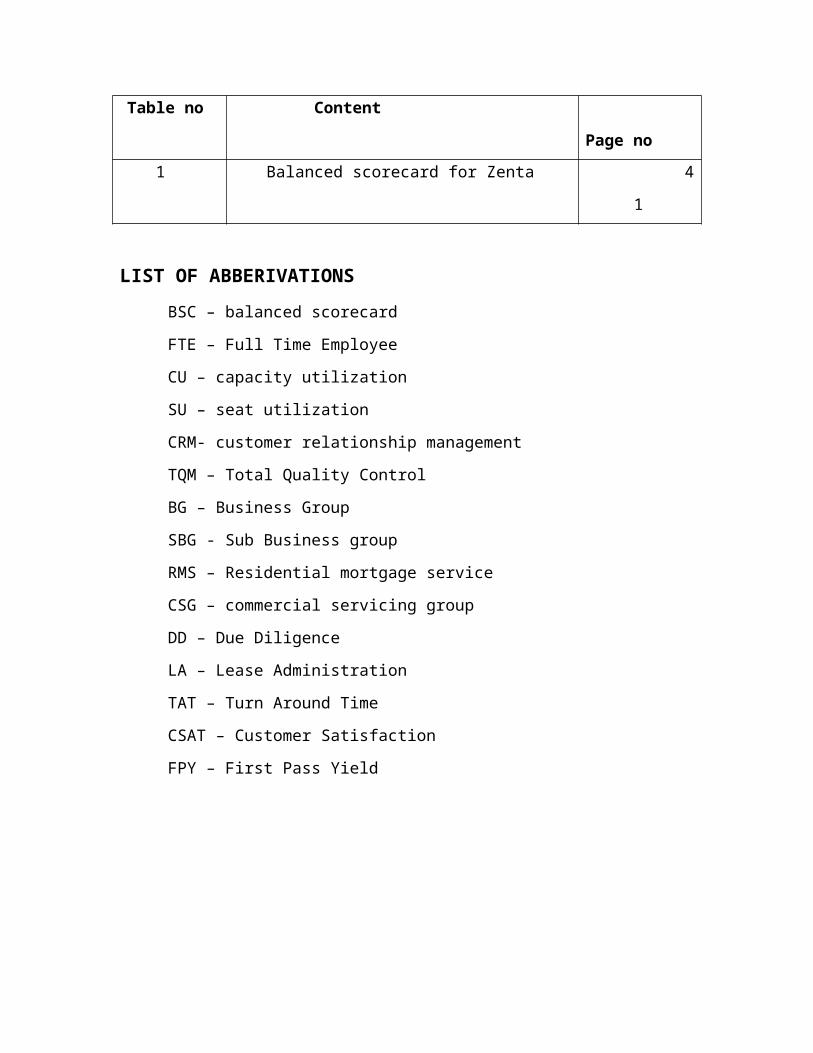
LIST OF TABLE:
Table no Content Page no
1 Balanced scorecard for Zenta 41
LIST OF ABBERIVATIONS
BSC – balanced scorecard
FTE – Full Time Employee
CU – capacity utilization
SU – seat utilization
CRM- customer relationship management
TQM – Total Quality Control
BG – Business Group
SBG - Sub Business group
RMS – Residential mortgage service
CSG – commercial servicing group
DD – Due Diligence
LA – Lease Administration
TAT – Turn Around Time
CSAT – Customer Satisfaction
FPY – First Pass Yield
CHAPTER – 1
1.1INDUSTRY PROFILE:
US Real Estate Industry:
Real estate in United States is one of the largest markets in the world. In fact, it is so
significant to world economic activity that the availability of easy money and the
subsequent Housing Bubble triggered the Sub-Prime Crisis and eventually the global
Financial Crisis of 2008 - 2009 that brought the world's economy to its knees. The US
real estate market is divided into 2 sectors: commercial real estate and residential real
estate. Most discussion tends to focus on residential real estate (i.e. houses), but
commercial real estate is also a critical sector of the economy, and is made up of offices,
shopping malls, factories, warehouses and other commercial buildings.
In order to be successful in real estate investment, an investor needs to understand house
price trends, assess the condition and value of the investment property, and secure a
suitable mortgage or other form of real estate finance. The US real estate industry has
been experiencing wonderful growth due to the relatively steady good economy. In
2006, some markets had major gains in occupied space, others saw record sales
transactions. The market has begun to tighten, developers remained cautious possibly
eye toward the future, particularly predictions of escalating rental rates.
Major Participants in the Real Estate Industry
Developers
Development is an idea that comes to fruition when consumers – tenants or
owner- occupants acquire and use the space put in place by the development team. Land,
labor, capital management and entrepreneurship are needed to transform an idea into
reality. Developers balance the needs of diverse providers and consumers of the real
estate product. The developers have to demonstrate the project's feasibility to the capital
markets and pay interest or assign Equity positions in return for funding.
Appraisers
Appraisers can be a part of every stage of the property development process.
Appraisers are primarily responsible for valuation of the project. They estimate the
market value of the property and typically prepare a formal document called appraisal.
Appraisal may be necessary when a developer transfers ownership, seeks financing and
credit, resolves tax matters, and establishes just compensation in condemnation
proceedings. Appraisers can also evaluate a project as input to market studies and
feasibility studies. Some of the familiar names in the US Real Estate markets include CB
Richard Ellis, Cushman and Wakefield and Grubb and Ellis.
Property managers
Property managers focus on the day operation of the asset. Property managers
carry responsibility for all respects of the physical space in accordance with the asset
manager's plan. The responsibilities of a property manager include:
Marketing and leasing
Maintenance and repair
Tenant relations including rent collection
Insurance
Accounting
Human resource management
Providing timely information to the asset manager about events affecting the
property.
Some of the major property managers include Trammel Crow Company and Grubb and
Ellis Company.
Brokers/ Leasing Agents
Real Estate brokers and leasing agents are hired to act in the name of the
developer or asset manager in leasing and selling space to prospective tenants or buyers.
Their function, particularly in leasing large industrial and commercial spaces is to carry
out one of the most complex financial negotiations in the development process. Leasing
agents must balance all the various uses' individual needs against the developer's
financial model.
Lenders
A) Construction Lenders are usually commercial banks, which are responsible
for financial during project construction and for seeing that the developer completes the
project within the budget and according to the specifications.
B) Permanent lenders seek to originate safe loans generating the maximum
possible return. The market value of the completed project is very critical in that it serves
as the primary collateral for the loan.
1.2 COMPANY PROFILE
Zenta Knowledge Services Pvt. Ltd.,
Zenta was founded in 2001, Zenta is a world-class knowledge process outsourcing
(KPO) and business process outsourcing (BPO) and Company, offering a full range of
back-office, voice and on-site support solutions such as Credit Card Servicing, Consumer
Lending Servicing, Accounts Receivable Management, Mortgage Servicing and Real
Estate Capital Market Analytics. The Company serves the following verticals:
Consumer Credit, Insurance and Financial Services, and Commercial and Residential
Real estate
With 4,500+ employees worldwide, Zenta has operations in six locations across
three continents. Zenta is a preferred employer in India.
SOLUTIONS PROVIDED BY ZENTA
From origination and throughout the customer lifecycle, Zenta delivers deep, end-
to-end servicing solutions. Zenta's specialized focus on the financial services industry and
our management expertise and experience, are the reasons we have been chosen to
provide high-end business processing for some of the world's most prestigious banks and
financial institutions.
Instead of coordinating multiple vendors, Zenta's complete solution set makes it
possible for clients to work with one company only - providing a single source for all
their business processing needs.
Zenta's end-to-end solutions include:
Credit card servicing
Commercial Realty Services

Residential Realty Services
Account Receivables management , and
Healthcare Revenue Cycle Management
Residential Mortgage Services
1.1.1 Quality Certification:
ISO 9001:2008 certified:
ISO 9001 is a quality management standard. It applies to all types of
organizations. It doesn't matter what size they are or what they do. It can help
both product and service organizations achieve standards of quality that are
recognized and respected throughout the world.
SAS 70 Type II Assessed
Statement on Auditing Standards (SAS) No. 70, Service Organizations, is a
widely recognized auditing standard developed by the American Institute of
Certified Public Accountants (AICPA). SAS 70 Type II is for operating
effectively
1.1.2 Corporate Philosophy
Client Focused:
We're passionate about our clients and are easy to do business with. We sell our
clients what they want to buy, how they want to buy it. We are flexible and responsive,
tailoring our solutions to our clients' unique needs. And we honor our commitments.
Employee Centric:
We provide our employees with rewarding and satisfying career opportunities
based on their personal performance and contribution.
Cultural Compatibility:
Our clients are primarily in North America and Europe. Our operations are
primarily in India. We must be adept at managing and leading in multiple cultures. We
have assembled a diverse management team that understands the Western business
environment and the needs, aspirations and motivations of our global work force.
Ethics:
The line between right and wrong is not gray or blurred. It is a bright line and we
will not cross it, nor will we tolerate anyone who does
Operational Excellence:
We are committed to operational excellence. We employ a global work force. We
capture work anywhere in the world, move it to wherever in the world we can find the
right blend of cost and quality to work and deliver it back to our clients, wherever in the
world they may be
Accountability:
We hold ourselves accountable for results. We push decision-making to the
lowest possible level. When approvals are required, they are given as rapidly as possible.
Our business leaders are experienced outsourcing industry professionals from global
companies. We have an exceptional track record of attracting and retaining senior talent
with both global exposure and domain expertise to meet our clients' unique business n?
ends.
1.3 NEED FOR STUDY
1. Creating a winning strategy is only the first part of your Balanced Scorecard
implementation. The next part is measuring the success (or "failure") of your
strategy.
2. Besides the Balanced Scorecard, performance measurement systems have mainly
focused on lagging financial indicators. Although non-financial measures have
existed for long, their link to strategy and financial results has been vague at best.
On the contrary, the Balanced Scorecard provides predictive, forward-looking
views of the overall business that go beyond a focus on short-term bottom-line
results
3. Measuring your strategy enables you to confirm or set aside the assumed causes
and effects you have based your strategy on. This is vital information. Your
strategy is based on what you believe influences the perspectives the most.
Keeping track of the right measures and communicating the success or failure to
achieve the target values of such measures help everyone focus on the issues that
matters most.
4. If this doesn't happen, then the assumption on which our strategy is based may be
wrong and we may have to rewrite our strategy. Getting this kind of information
to your desk fast may save you from total embarrassment. Confirm or disprove
your ability to achieve what you have planned to achieve. Had the desired effect
on your ability to deliver internal processes end objectives
1.4 OBJECTIVES OF THE STUDY
Balanced scorecard was the one the key control tool to manage the organization
effectively according to the strategy which is implemented. Objectives are diversified
into primary and secondary
PRIMARY OBJECTIVE
1. To improves the bottom line by reducing process cost and improving
productivity and mission effectiveness.
2. It helps in measurement of process efficiency provides a rational basis for
selecting what business process improvements to make first.
3. It allows managers to identify best practices in an organization and expand their
usage elsewhere.
4. The visibility provided by a measurement system supports better and faster
budget decisions and control of processes in the organization. This means it can
reduce risk.
5. Visibility provides accountability and incentives based on real data, not
anecdotes and subjective judgments. This serves for reinforcement and the
motivation that comes from competition.
SECONDARY OBJECTIVE
1. It permits benchmarking of process performance against outside
organizations.
2. It can raise you agency's Baldrige score, which can serve to increase its long-
term chances of survival.
1.5 SCOPE OF THE STUDY “BALANCED SCORECARD AS PERFORMANCE
MANAGEMENT TOOL”
1. The Balanced Scorecard enables organizations to bridge the gap between strategy
and actions, engage a broader range of users in organizational planning, reflect the
most important aspects of the business, and respond immediately to progress,
feedback and changing business conditions. The Balanced Scorecard can be a
great help used as a strategic tool, a management methodology or / and a
measurement system.
2. The Balanced Scorecard provides organizations with the ability to clarify vision
and strategy and translate them into action. By focusing on future potential
success it becomes a dynamic management system that is able to reinforce,
implement and drive corporate strategy forward.
3. The Balanced Scorecard is based on performance measurement and derives its
objectives from vision and strategy. It enables shared understanding of the links
between strategy, critical success factors and actions while establishing
accountability
4. The concept of the Balanced Scorecard has achieved increasing popularity in the
business world. Many businesses had previously built their objectives around
financial targets and goals of little relevance to a long-term strategic vision, thus
typically leaving a gap between strategy development and implementation.
5. The Balanced Scorecard is based on performance measurement and derives its
objectives from vision and strategy. It enables shared understanding of the links
between strategy, critical success factors and actions while establishing
accountability
6. The Balanced Scorecard focuses on creating and communicating a total
comprehensive picture to all members of the organization from the top down,
taking a long-term view of what the company's strategic objectives really are,
making good use of knowledge gained through experience and maintaining the
required flexibility of such a system to cope with the fast-changing business
environment.
1.6 STUDY METHOD
A qualitative study was chosen because metric to be analyzed was vast. The study
is focused on how Zenta’s internal metrics can be fitted to the balanced scorecard
concept.
1.7 DATA COLLECTION METHOD
Kaplan and Norton’s book “balanced scorecard” is taken as base and collected data for
this project
A “General Observation Study” was made to know about the measurement
method followed in the company.
Got help from my senior colleagues in the office to get some data’s about the
process
Internal metrics measured in Zenta is used for further analysis.
CHAPTER 2
LITERATURE REVIEW
2.1 INTRODUCTION TO BALANCED SCORECARD
HISTORY
Throughout the history of contemporary management theories starting from the
ones that were introduced between the intrusion of the mass production in the beginning
of the 20th century and until today, all the gurus of management have been trying to find
uniform solutions on more efficient allocation and use of very limited resources available
to businesses.
In the down of the century, Frederick W. Taylor established the very concepts of
resource allocation in his Principles of Scientific Management. In 1920 it went around
assembly line and motion studies as the first experience from systematic mass production
had given theorists quite a lot of materials to be analyzed from the point of view of using
traditional by blue-collar employees more efficiently. In the 1930, the main topic was
motivation of employees, as it turned out that human nature does not enable to work long
hours on a repetitive tasks without frustration level getting so high enough to diminish
productivity. In the 1940 and 1950, the first statistical and linear methods were
introduced in trying to measure logistics of the operations management and its
implications to overall company success in financial-analysis side.
In the beginning of 1980, partly because of introduction of electronic data
processing equipment and quick development of computers, the whole array of
management techniques were initiated. The particular reasons for the vast development of
the new theories were catalyzed mainly by ever growing competition generated through
more systematic use of computers, and of course also by rapid growth of the importance
of human capital.
During the industrial age, the financial control systems were developed in major
companies to facilitate and monitor efficient allocations of financial and physical capital.
A summary financial measure such as return-on-capital-employed (ROCE) could both
direct a company’s internal capital to its most productive use and monitor the efficiency
by which operating divisions used financial and physical capital to create value for
shareholders.
The emergence of the information era, however, in the last decades of the 20 th
century, has made obsolete many of the fundamental assumptions of the industrial age
competition. The information age environment for both manufacturing and service
organizations requires new capabilities for competitive success. The ability of any
company to mobilize and exploit its intangible assets has become far more decisive that
investing and managing tangible, physical assets.
Today automation and productivity have increased the number of people
performing analytic functions: engineering, marketing, management and administration.
Therefore, these people are more viewed as problem solvers, not as variable costs. In
other words, information age ahs brought about the concept of knowledge management.
The shift to successful knowledge management has introduced a variety of improvement
initiatives such as; JIT, TQM, Lean enterprise, Time-based competition, Customer-
focused organizations etc. Some of those programmers have meant in practice real
breakthrough and improvement, others have proven to be in the best case just a short-
time disturbance, but in the worst cases total failures resulting in disarray or even
bankruptcy of a particular company. The main reason for that lies in five main
implementation problems:
1. Current performance measurement systems are based on the traditional financial
accounting model, which does not enable to objectively analyze information-age
companies;
2. If some non-financial performance measurement even is made, it is solely based
on employees’ tactical performance, not on strategic performance,
3. Majority of management and employee salary-based motivation schemes are only
short-run profit oriented, that does not enable to align towards long-run profit
oriented, that does not enable to align towards long-run goals;
4. Overall company strategy is not closely linked to organizational and personal
improvement programmers; and
5. Strategy is not generally linked to resource allocation, which results in under
financing some of the crucial parts of organization’s development.
As for today, superior financial performance and efficiency in production are just not
enough to gain sufficient competitive advantage but more and more attention needs to be
paid to intangible sides of business.
2.2 KAPLAN AND NORTAN APPORACH OF BALANCED SCORECARD
The balanced scorecard is a strategic planning and management system that is
used extensively in business and industry, government, and nonprofit organizations
worldwide to align business activities to the vision and strategy of the organization,
improve internal and external communications, and monitor organization performance
against strategic goals. It was originated by Drs. Robert Kaplan (Harvard Business
School) and David Norton as a performance measurement framework that added strategic
non-financial performance measures to traditional financial metrics to give managers and
executives a more 'balanced' view of organizational performance. While the phrase
balanced scorecard was coined in the early 1990s, the roots of the this type of approach
are deep, and include the pioneering work of General Electric on performance
measurement reporting in the 1950’s and the work of French process engineers (who
created the Tableau de Bord – literally, a "dashboard" of performance measures) in the
early part of the 20th century.
The balanced scorecard has evolved from its early use as a simple performance
measurement framework to a full strategic planning and management system. The “new”
balanced scorecard transforms an organization’s strategic plan from an attractive but
passive document into the "marching orders" for the organization on a daily basis. It
provides a framework that not only provides performance measurements, but helps
planners identify what should be done and measured. It enables executives to truly
execute their strategies.
This new approach to strategic management was first detailed in a series of
articles and books by Drs. Kaplan and Norton. Recognizing some of the weaknesses and
vagueness of previous management approaches, the balanced scorecard approach
provides a clear prescription as to what companies should measure in order to 'balance'
the financial perspective. The balanced scorecard is a management system (not only a
measurement system) that enables organizations to clarify their vision and strategy and
translate them into action. It provides feedback around both the internal business
processes and external outcomes in order to continuously improve strategic performance
and results. When fully deployed, the balanced scorecard transforms strategic planning
from an academic exercise into the nerve center of an enterprise.
Kaplan and Norton's first book, The Balanced Scorecard, remains their most
popular. The book reflects the earliest incarnations of Balanced Scorecard - effectively
restating the concept as described in the second Harvard Business Review article. Their
second book, The Strategy Focused Organization, echoed work by others (particularly in
Scandinavia) on the value of visually documenting the links between measures by
proposing the "Strategic Linkage Model" or “strategy map”. Since then Balanced
Scorecard books have become more common - in early 2010 Amazon was listing several
hundred titles in English which had Balanced Scorecard in the title.
Kaplan and Norton describe the innovation of the balanced scorecard as follows:
"The balanced scorecard retains traditional financial measures. But financial measures
tell the story of past events, an adequate story for industrial age companies for which
investments in long-term capabilities and customer relationships were not critical for
success. These financial measures are inadequate, however, for guiding and evaluating
the journey that information age companies must make to create future value through
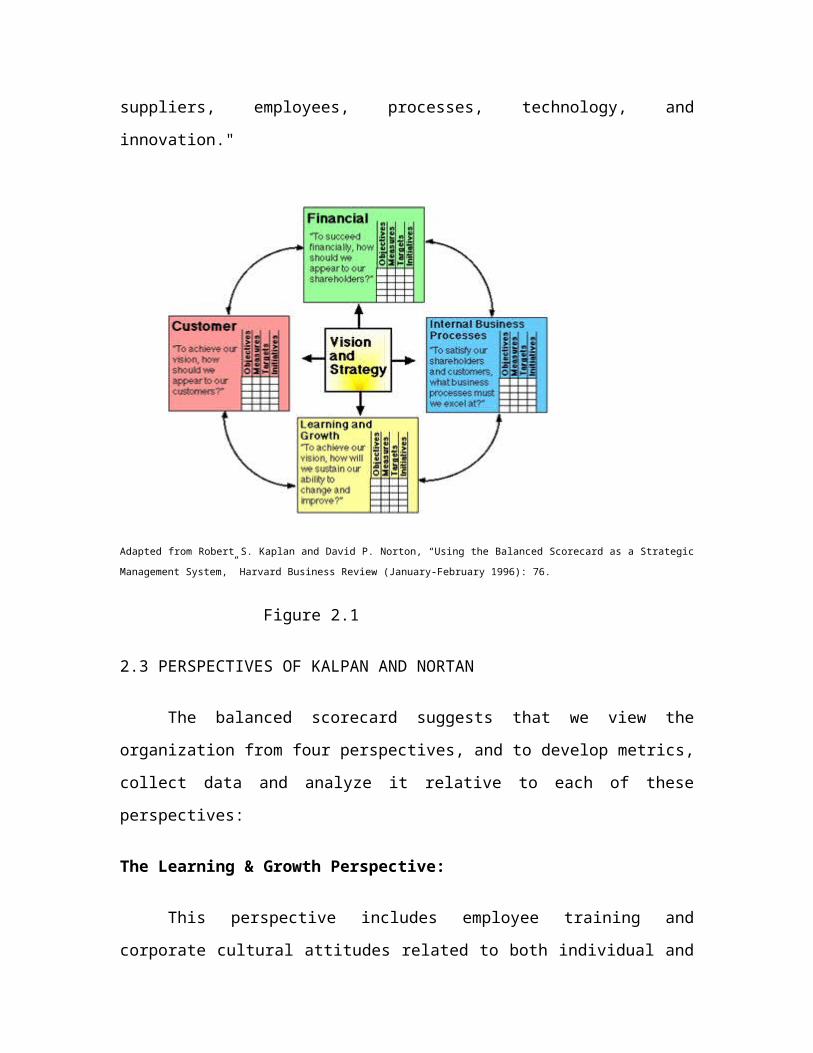
investment in customers, suppliers, employees, processes, technology, and innovation."
Adapted from Robert S. Kaplan and David P. Norton, “Using the Balanced Scorecard as a Strategic Management
System,” Harvard Business Review (January-February 1996): 76.
Figure 2.1
2.3 PERSPECTIVES OF KALPAN AND NORTAN
The balanced scorecard suggests that we view the organization from four
perspectives, and to develop metrics, collect data and analyze it relative to each of these
perspectives:
The Learning & Growth Perspective:
This perspective includes employee training and corporate cultural attitudes
related to both individual and corporate self-improvement. In a knowledge-worker
organization, people -- the only repository of knowledge -- are the main resource. In the
current climate of rapid technological change, it is becoming necessary for knowledge
workers to be in a continuous learning mode. Metrics can be put into place to guide
managers in focusing training funds where they can help the most. In any case, learning
and growth constitute the essential foundation for success of any knowledge-worker
organization.
Kaplan and Norton emphasize that 'learning' is more than 'training'; it also includes things
like mentors and tutors within the organization, as well as that ease of communication
among workers that allows them to readily get help on a problem when it is needed. It
also includes technological tools; what the Baldrige criteria call "high performance work
systems."
The Business Process Perspective:
This perspective refers to internal business processes. Metrics based on this
perspective allow the managers to know how well their business is running, and whether
its products and services conform to customer requirements (the mission). These metrics
have to be carefully designed by those who know these processes most intimately; with
our unique missions these are not something that can be developed by outside
consultants.
The Customer Perspective:
Recent management philosophy has shown an increasing realization of the
importance of customer focus and customer satisfaction in any business. These are
leading indicators: if customers are not satisfied, they will eventually find other suppliers
that will meet their needs. Poor performance from this perspective is thus a leading
indicator of future decline, even though the current financial picture may look good.
In developing metrics for satisfaction, customers should be analyzed in terms of kinds of
customers and the kinds of processes for which we are providing a product or service to
those customer groups.
The Financial Perspective:
Kaplan and Norton do not disregard the traditional need for financial data. Timely
and accurate funding data will always be a priority, and managers will do whatever
necessary to provide it. In fact, often there is more than enough handling and processing
of financial data. With the implementation of a corporate database, it is hoped that more
of the processing can be centralized and automated. But the point is that the current
emphasis on financials leads to the "unbalanced" situation with regard to other
perspectives. There is perhaps a need to include additional financial-related data, such as
risk assessment and cost-benefit data, in this category.
2.4 LINKING THE BALANCED SCORECARD MEARSURES TO STRATEGIC
METRIC
There are three principles which will enable the organization’s balanced scorecard to be
linked to its strategy
Cause and effect relationship
Performance drivers
Linkage to financials
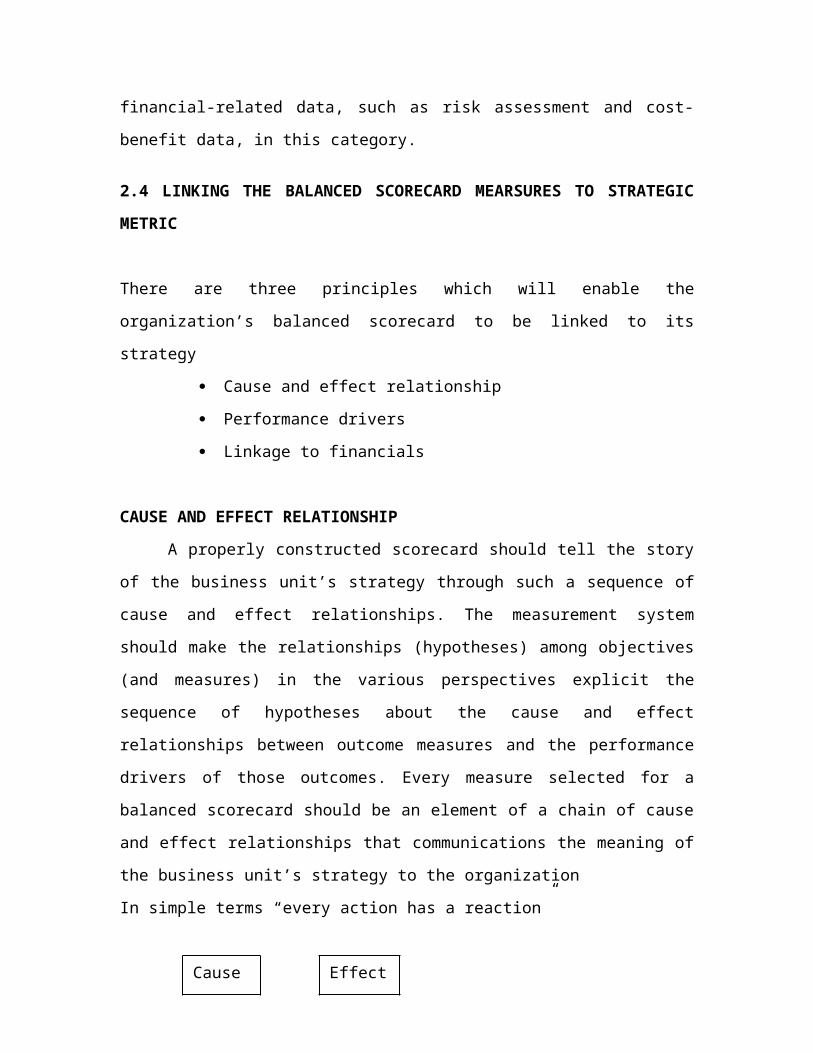
CAUSE AND EFFECT RELATIONSHIP
A properly constructed scorecard should tell the story of the business unit’s
strategy through such a sequence of cause and effect relationships. The measurement
system should make the relationships (hypotheses) among objectives (and measures) in
the various perspectives explicit the sequence of hypotheses about the cause and effect
relationships between outcome measures and the performance drivers of those outcomes.
Every measure selected for a balanced scorecard should be an element of a chain of cause
and effect relationships that communications the meaning of the business unit’s strategy
to the organization
In simple terms “every action has a reaction”
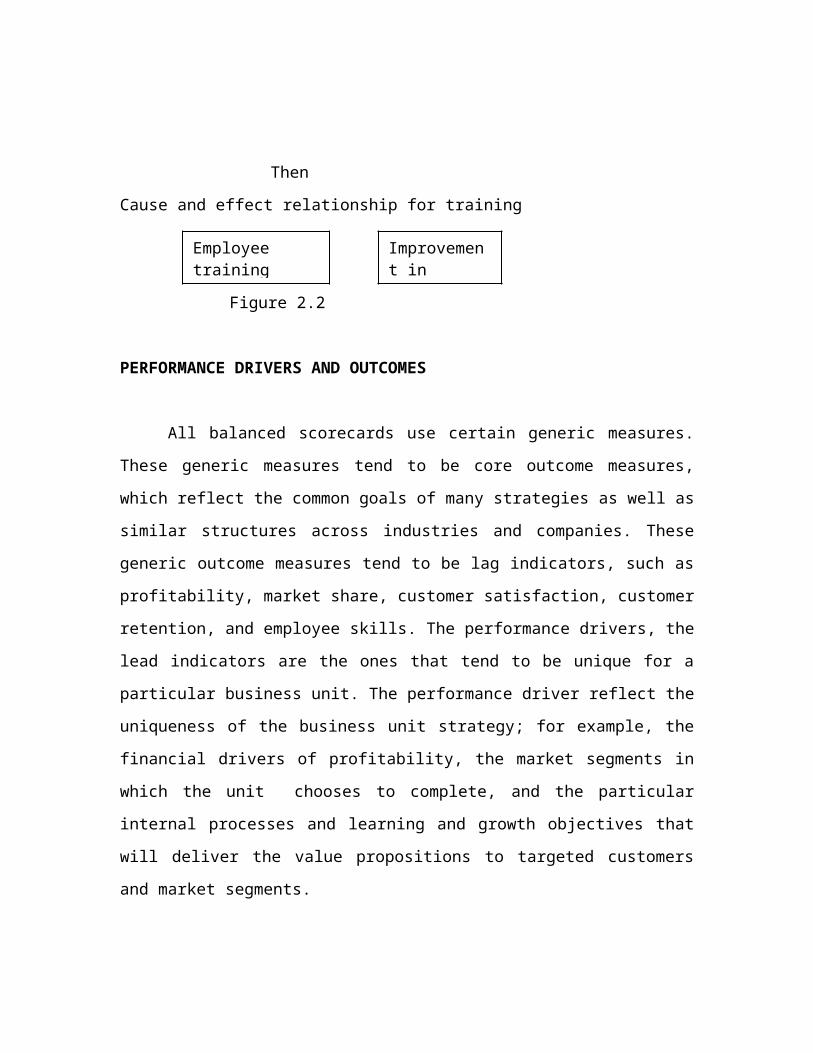
Then
Cause and effect relationship for training
Figure 2.2
Cause Effect
Employee training(Cause)
Improvement in process (Effect)
PERFORMANCE DRIVERS AND OUTCOMES
All balanced scorecards use certain generic measures. These generic measures
tend to be core outcome measures, which reflect the common goals of many strategies as
well as similar structures across industries and companies. These generic outcome
measures tend to be lag indicators, such as profitability, market share, customer
satisfaction, customer retention, and employee skills. The performance drivers, the lead
indicators are the ones that tend to be unique for a particular business unit. The
performance driver reflect the uniqueness of the business unit strategy; for example, the
financial drivers of profitability, the market segments in which the unit chooses to
complete, and the particular internal processes and learning and growth objectives that
will deliver the value propositions to targeted customers and market segments.
A good balanced scorecard should have a mix of outcome measures and
performance drivers. Outcome measures without performance drivers do not
communicate how the outcomes are achieved. They also do not provide an earlier
indication about whether the strategy is being implemented successfully. Conversely, the
performance drivers – such as cycle time and part-per million defect rated – without
outcome measures enable the business unit to achieve short operational improvements,
but will fail to reveal whether the operational improvements have been translated into
expanded business with existing and new customers, and eventually, to enhance the
financial performance. A good balanced scorecard should have an appropriate mix of
outcome (lagging indicators) and performance drivers (leading indicators) that have been
customized to the business unit strategy.
LINKAGE TO FINANCIALS
With the proliferation of change programs under way in most organization today
it is easy to become preoccupied with such goals as quality, customer satisfaction,
innovation, and employee empowerment for their own sake. Will those goals can lead to
improved business unit performance, they may not if these goals are taken as ends in
themselves. The financial problems of some recent Baldrige award winners give
testimony to the need to link operational improvements to economical results.

A good balanced scorecard must retain a strong emphasis on outcomes, especially
financial ones like return–on–capital-employed or economic value added. Many
managers fail to link programs, quality management, cycle time reduction, reengineering,
and employee empowerment, to outcomes the directly influence customers and that
deliver future financial performance in such organizations the improvement programs
have incorrectly been taken as the ultimate objective they have not been linked to specific
targets and eventually financial performance. The inevitable result in that such
organization eventually become disillusioned about the lack of tangible payoffs from
their change programs. Ultimately, casual paths from all the measures on a scorecard
should be linked to financial objectives.
2.5 PERFORMANCE MANAGEMENT SYSTEM
Performance Management involves the entire gamut of processes in identifying critical
dimensions of performance - setting work plans against laid down objectives, reviewing
the work done against indicators of performance and developing and enhancing
competencies for improved performance.
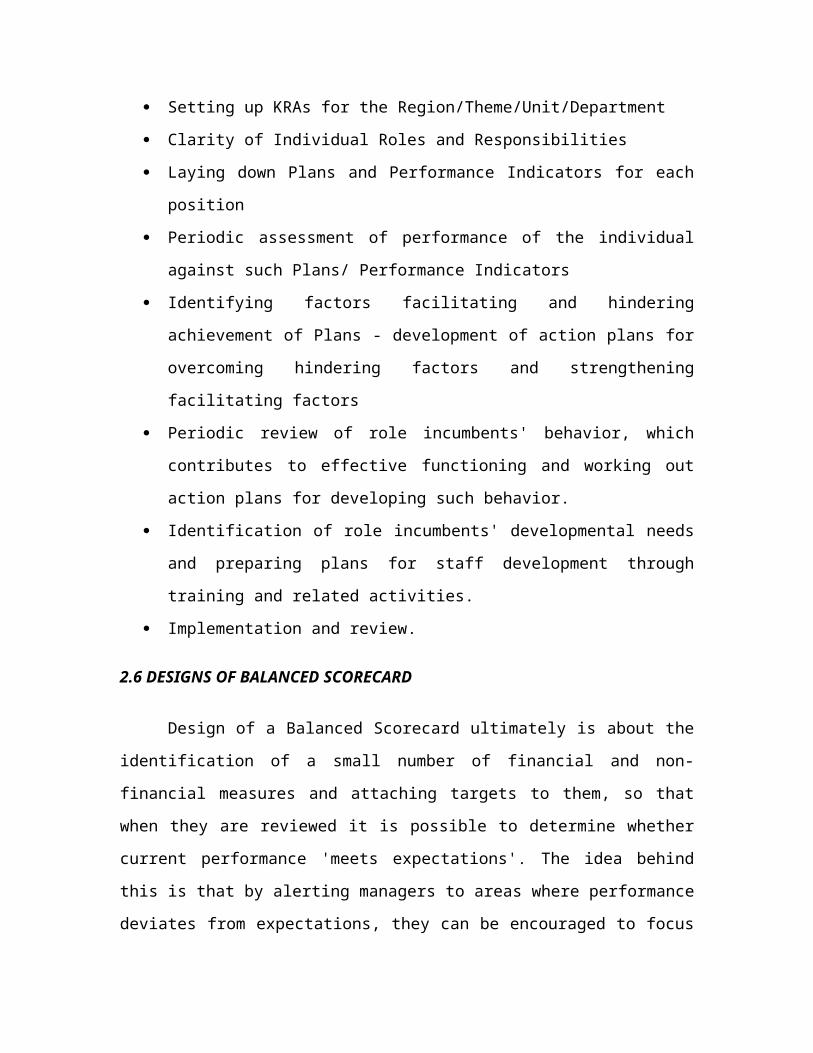
An effective Performance Management System should be based on:-
Setting up KRAs for the Region/Theme/Unit/Department
Clarity of Individual Roles and Responsibilities
Laying down Plans and Performance Indicators for each position
Periodic assessment of performance of the individual against such Plans/
Performance Indicators
Identifying factors facilitating and hindering achievement of Plans - development
of action plans for overcoming hindering factors and strengthening facilitating
factors
Periodic review of role incumbents' behavior, which contributes to effective
functioning and working out action plans for developing such behavior.
Identification of role incumbents' developmental needs and preparing plans for
staff development through training and related activities.
Implementation and review.
2.6 DESIGNS OF BALANCED SCORECARD
Design of a Balanced Scorecard ultimately is about the identification of a small
number of financial and non-financial measures and attaching targets to them, so that
when they are reviewed it is possible to determine whether current performance 'meets
expectations'. The idea behind this is that by alerting managers to areas where
performance deviates from expectations, they can be encouraged to focus their attention
on these areas, and hopefully as a result trigger improved performance within the part of
the organization they lead.
The original thinking behind Balanced Scorecard was for it to be focused on
information relating to the implementation of a strategy, and perhaps unsurprisingly over
time there has been a blurring of the boundaries between conventional strategic planning
and control activities and those required to design a Balanced Scorecard. This is
illustrated well by the four steps required to design a Balanced Scorecard included in
Kaplan & Norton's writing on the subject in the late 1990s, where they assert four steps
as being part of the Balanced Scorecard design process:
1. Translating the vision into operational goals;
2. Communicating the vision and link it to individual performance;
3. Business planning; index setting
4. Feedback and learning, and adjusting the strategy accordingly.
These steps go far beyond the simple task of identifying a small number of financial
and non-financial measures, but illustrate the requirement for whatever design process is
used to fit within broader thinking about how the resulting Balanced Scorecard will
integrate with the wider business management process. This is also illustrated by books
and articles referring to balanced scorecards confusing the design process elements and
the balanced scorecard itself. In particular, it is common for people to refer to a “strategic
linkage model” or “strategy map” as being a balanced scorecard.
Although it helps focus managers' attention on strategic issues and the management
of the implementation of strategy, it is important to remember that the balanced scorecard
itself has no role in the formation of strategy. In fact, balanced scorecards can
comfortably co-exist with strategic planning systems and other tools.
2.6.1 Improved design Method of Kaplan and Norton
In the mid 1990s, an improved design method emerged. In the new method,
measures are selected based on a set of "strategic objectives" plotted on a "strategic
linkage model" or "strategy map". With this modified approach, the strategic objectives
are distributed across the four measurement perspectives, so as to "connect the dots" to
form a visual presentation of strategy and measures.
To develop a strategy map, managers select a few strategic objectives within each
of the perspectives, and then define the cause-effect chain among these objectives by
drawing links between them. A balanced scorecard of strategic performance measures is
then derived directly from the strategic objectives. This type of approach provides greater
contextual justification for the measures chosen, and is generally easier for managers to
work through. This style of Balanced Scorecard has been commonly used since 1996 or
so: it is significantly different in approach to the methods originally proposed, and so can
be thought of as representing the "2nd Generation" of design approach adopted for
Balanced Scorecard since its introduction.
Several design issues still remain with this enhanced approach to Balanced Scorecard
design, but it has been much more successful than the design approach it superseded.
In the late 1990s, the design approach had evolved yet again. One problem with
the "2nd generation" design approach described above was that the plotting of causal
links amongst twenty or so medium-term strategic goals was still a relatively abstract
activity. In practice it ignored the fact that opportunities to intervene, to influence
strategic goals are, and need to be anchored in the "now;" in current and real management
activity. Secondly, the need to "roll forward" and test the impact of these goals
necessitated the creation of an additional design instrument; the Vision or Destination
Statement. This device was a statement of what "strategic success," or the "strategic end-
state" looked like. It was quickly realized, that if a Destination Statement was created at
the beginning of the design process then it was much easier to select strategic Activity
and Outcome objectives to respond to it. Measures and targets could then be selected to
track the achievement of these objectives. Design methods that incorporate a "Destination
Statement" or equivalent (e.g. the Results Based Management method proposed by the
UN in 2002) represent a tangibly different design approach to those that went before, and
have been proposed as representing a "3rd Generation" design method for Balanced
Scorecard.
Design methods for Balanced Scorecard continue to evolve and adapt to reflect
the deficiencies in the currently used methods, and the particular needs of communities of
interest (e.g. NGO's and Government Departments have found the 3rd Generation
methods embedded in Results Based Management more useful than 1st or 2nd
Generation design methods).
2.7 KEY MEASURES OF BALANCED SCORECARD
The Balanced Scorecard is currently a very trendy (and often misunderstood)
topic in business circles, but there are other measurement frameworks such as the
Performance Prism, the Quantum Performance Management Model and the Tableau de
Bord. All are useful, but none of them is the answer to everything despite what their
advocates may say.
Combining elements of various measurement frameworks yields the measurement model
below. It works as follows:
1. The needs and expectations of customers and stakeholders are the primary drivers
of strategies. Stakeholders include shareholders and employees, but suppliers, the
community, government entities and other organizations could also be important
stakeholders.
2. Strategy consists of defining your intended customers and how you are going to
compete for them. A company’s strategy is made up of individual strategies,
which are the key actions a company must take to achieve its vision and goals.
When developing strategies, all other elements of the model must be considered.
3. Operations include all direct and support business activities that execute strategies
and produce products and services for customers and stakeholders.
4. The capabilities of a company’s organization and infrastructure enable its
operations to efficiently satisfy customer and stakeholder requirements.
Stakeholder capabilities may also be important to a company’s operations. In the
short-term, capabilities can limit what strategies are feasible; in the long-term they
may need to be developed to implement certain strategies.
5. Stakeholder contributions include products or services that are essential to
operations. For example, suppliers may provide critical technical support for
designing products.
6. Products and services provided to customers create financial returns for
shareholders and perhaps other stakeholders as well.
Measurement and business success
All of the listed variables can be measured to a useful degree of accuracy and
some companies are doing it. Companies that have won the Baldrige Award or similar
state award have extensive measurement systems that include all of the above measures.
In reviewing numerous Baldrige-based quality award applications, I have found that a
good estimate of a company’s final score can be made by just examining the measures
being used. Why? Because the depth, breadth and underlying logic of a company’s
measures reflect management’s understanding of the business and how well it is being
managed.
Not surprisingly, over a five-year period ending in 1998, the winners of Baldrige and
similar awards did two to three times better than comparable companies in terms of their
growth in sales and operating income. That is a huge difference!
Determining what to measure
So how can you determine what your company should measure? As mentioned
before, there are several frameworks that can be used. Although they all have merit, some
have advantages in terms of their state of development, ease of use, and direct
relationship to common business practices.
I believe the best approach for developing company or business unit strategy and
related measures is to use the Balanced Scorecard methodology in conjunction with the
robust perspectives of the Performance Prism. Balanced Scorecard performance systems
have an established record of success, but one needs a disciplined way of building and
implementing the system to ensure that business strategies get executed and that the
necessary organization culture change gets implemented. One framework that is
becoming an international "best practice" is the Balanced Scorecard Institute's Nine-Step
Methodology for developing strategic themes, business strategies, strategic goals,
strategy maps, performance measures, targets, and new initiatives. The result is a
strategic management system that is comprehensive, logically sound, and supported by
the whole organization.
This does not assure the strategies will work, but the measures will provide timely
feedback about how well they are working so timely corrective action can be taken
regarding the strategies or their execution. Without the measures, a company’s strategy
and finances could get substantially off-track before any problems are even recognized.
But having good strategies is not enough to be successful. Operational excellence
is also needed to execute them. To achieve and maintain high levels of productivity,
quality, and customer service, comprehensive operations or process measurement
systems are needed to manage processes, departments and work units. These systems
would include the measures that are strategically important, but those measures alone are
insufficient for effectively managing operations.
For developing operational measures, I recommend the approach and model given
in my book Operational Performance Measurement: Increasing Total Productivity. No
doubt I am biased, but the book’s process measurement model is the only one I’ve seen
that meets three critical criteria: it is logically sound, it readily relates to real world
processes, and it has a record of successful application. The model is also consistent with
TQM and Six Sigma methodologies that contain many specialized techniques for
measuring and managing processes.
Becoming familiar with the Baldrige Criteria for Performance Excellence is also
recommended. Since it outlines general management best practices, it provides a very
helpful perspective on what a well-managed company should be measuring, as well as
what it should be doing.
Cascading measures
Corporate level measures are very important, but they aren’t going to have much
impact unless they are cascaded all the way down to front-line employees. The case for
cascading is simple: Do you want 10% of your employees working toward company
objectives or 100%?
With some exceptions, such as market share, what you measure at the top is what
must be measured at all levels. However, the specific measures will change with every
function and organizational level because managers doing different jobs need different
information to make different decisions.
The same methodologies used to develop measures at the corporate level can be
used to cascade the measures down to front-line managers, supervisors, and employees.
However, as you go down the organization chart, the focus is on operations or processes.
Strategy is incorporated into operational measures by giving more weight to the measures
that are strategically important. This communicates strategy to all employees by
translating it into operational terms - a primary objective of the Balanced Scorecard.
Implementing performance measures
Determining what to measure can take considerable effort, but it will probably be
less than one-third of the total effort required to implement an efficient and effective
measurement system. Data collection and processing systems will have to be
implemented to produce the measures; everyone will have to be trained in using the
systems and measures; and as the measures are used, some problems are sure to be
identified that will require changes to the system.
Perhaps the greatest challenge faced when implementing performance
measurement systems is changing an organization’s culture. Using performance measures
requires managers and employees to change the way they think and act. For most people,
this is relatively easy, but for some, changing old beliefs and habits is very difficult.
Overcoming such problems requires strong leadership to provide appropriate
direction and support. The best measurement system in the world will yield few benefits
if the right knowledge, skills, abilities, and values are not developed in a company. An
organization doesn’t just interface with a measurement system; it is part of the system.
CHAPTER 3
3.1 RESEARCH METHODOLOGY
Research Methodology is the way in which the data are collected for the research
project.
TYPE OF RESEARCH:
In this study, the type of research is “Qualitative Research”
QUALITATIVE RESEARCH MEANS:
Qualitative research seeks out the ‘why’, not the ‘how’ of its topic through the
analysis of unstructured information – things like interview transcripts, open ended
survey responses, emails, notes, feedback forms, photos and videos. It doesn’t just rely on
statistics or numbers, which are the domain of quantitative researchers.
Qualitative research is used to gain insight into people's attitudes, behaviors, value
systems, concerns, motivations, aspirations, culture or lifestyles. It’s used to inform
business decisions, policy formation, communication and research. Focus groups, in-
depth interviews, content analysis, ethnography, evaluation and semiotics are among the
many formal approaches that are used, but qualitative research also involves the analysis
of any unstructured material, including customer feedback forms, reports or media clips.
Collecting and analyzing this unstructured information can be messy and time
consuming using manual methods. When faced with volumes of materials, finding
themes and extracting meaning can be a daunting task.
3.2 LIMITATIONS OF THE STUDY:
Lack of top management support
No access to confidential data
Complexity of the process
Time consuming process
CHAPTER 4
4.1 ZENTA BUSINESS MEASUREMENT SYSTEM
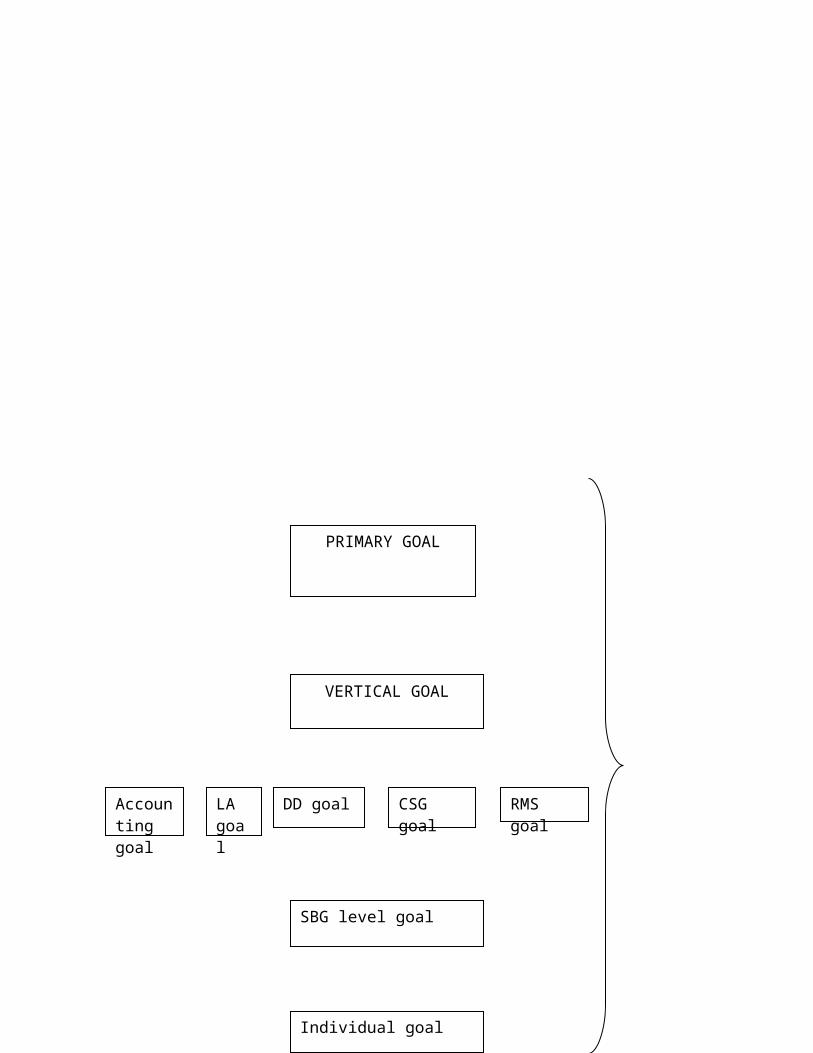
4.1.1 GOAL FLOW
In ZENTA all business process operates separately under different BG’s it is classified
according to the nature of business. In Zenta there are five business groups
Commercial Service group
Residential mortgage service
Due diligence
Financial service
Lease administration
All the business groups have separate goals but all the separate goals are linked with
corporate goal as shown the figure
Goal flow
Figure 3.1
Figure 4.1
Individual goal
PRIMARY GOAL
VERTICAL GOAL
SBG level goal
Accounting goal
DD goal CSG goal RMS goalLA goal
4.1.2 VISION AND MISSION BASED BALANCED SCORECARD
The May 2007 realignment of the Company’s services under the Zenta brand reflects the
new corporate vision of building a world-class Knowledge and Business Process
Outsourcing Company focused on the real estate and financial services industries. As a
fully integrated global enterprise, Zenta now offers real estate and financial services
customers a broad array of services from its centers of excellence around the globe.
Financial objective High return on
investment Borden revenue Mix
Customer objective Improve customer
retention Deliver high
quality serviceBusiness process(Innovation cycle)
Reduction in cycle time
Business process(Operational cycle)
Achieve high CU Improve FTE competency
Learning and growthObjective
vision communication Increase training Hrs
STAFF SKILLSImprovement
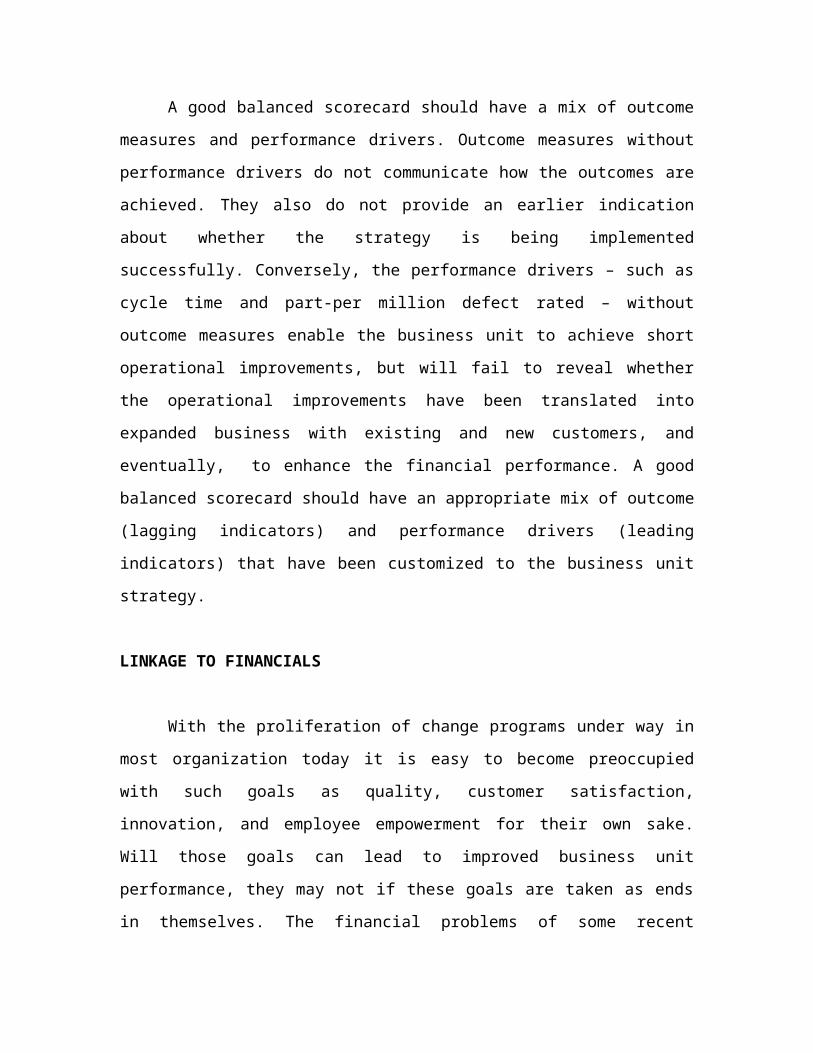
Figure 4.2
4.3 METRIC ANALYSIS IN ZENTA
4.3.1 SEAT UTILIZATION
Seat utilization mean occupancy of seat on work floor, this is calculated with the
head count of the current period. Seat utilization is considered as internal business metric
which is linked with the financial metric i.e. the cost of seat. When seat utilization was
high overall seat cost will go down this increase the profitability and on time delivery.
Seat utilization mainly depends on the seat management, where seat management
is a method of coordinating all the workstations in an enterprise network by overseeing
the installation, operation, and maintenance of hardware and software at each
workstation. This will greatly reduce the overall cost of operation compared with
unmanaged systems and it will improve overall performance of the organization.
Seat utilization is inversely proportional to seat cost, where it is directly
proportional to on time delivery.
Internal business process
Customer perspective
Financial perspective
Increase information asset
Seat cost
On time delivery
Seat utilization
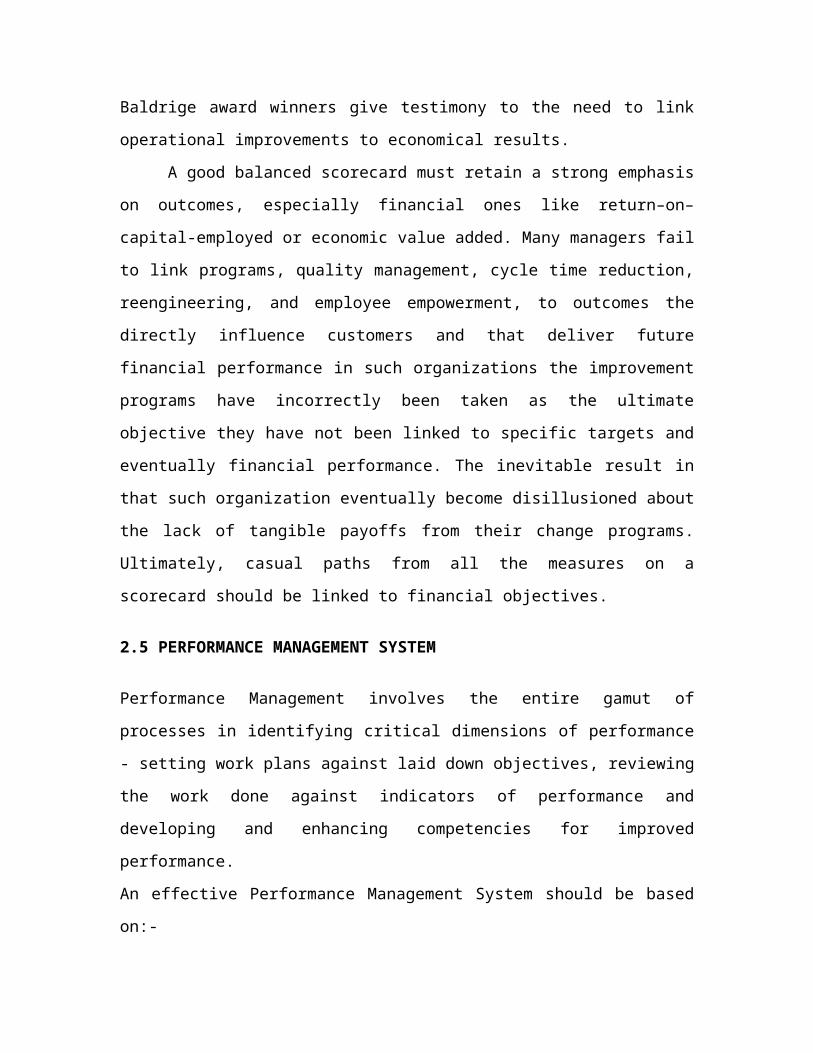
Figure 4.3
4.3.2 TRANSPORTATION COST
Transportation is simple metric but it will also impact in customer satisfaction and
retention. Transportation cost is considered as one of the key metric in financial
perspective of the company. Vehicle seat utilization is considered for knowing the total
number of employee using the company transport and how much the company paying for
it. Average travel time is calculated to identify to satisfaction level of the employee.
Average travel time: Time taken by the employee to reach destination from work place.
When average travel time for an employee is high it will lead to low employee morale.
Vehicle Seat Utilization: rate of occupancy of vehicles for a given route. If vehicle seat
utilization is high then transportation cost is lower but average travel time will be higher.
Customer perspective
Financial perspective
Internal business process
Figure 4.4
Vehicle Seat Utilization
Transportation Cost
Average Travel Time
4.3.3 EMPLOYEE SKILL EFFECTIVENESS
Employees are considered as important asset for any organization. Skill set for
any employee plays an important role in organizational development. All the employees
are trained according to the requirement of the respective business group. This training
makes the employee to be efficient in the work flow. Efficiency is considered as internal
business process metric when efficient employee is working in the process then there will
no deviation from turnaround time (TAT). With low skills of the FTE’s the process time
will be more and this will lead to increase in the TAT.
Learning and Growth
Internal business process
Customer perspective
Financial perspective
Skills per FTE (IT)
Efficiency of work
Deviation from TAT
RevenueGeneration
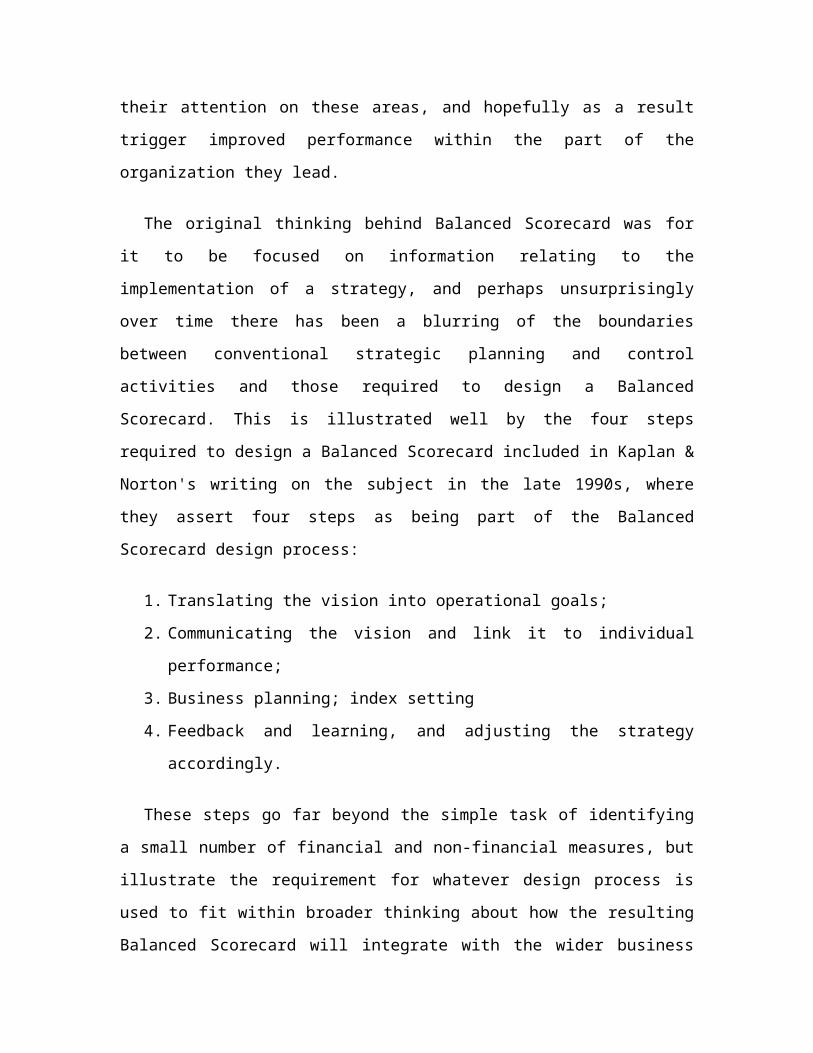
Figure 4.5
Skill per FTE (IT): the basic information technology skills which employees posses.
This will help in improving productivity or efficiency. The skill per FTE is increased
with help of training given by the organization.
Deviation from TAT: it refers to the increase in process time from the regular cycle
time. In order to meet desired TAT employees has to be trained as per requirement.
Revenue generation: Deviation from TAT is inversely proportional to revenue
generated. With the effective skills of employees the process time will get reduce, which
increases the workflow efficiency, which helps in revenue generation.
4.3.4 COMPETENCY PER FTE
Competence (or competency) is the ability of an individual to perform a job
properly. Some scholars see "competence" as a combination of knowledge, skills and
behavior used to improve performance; or as the state or quality of being adequately or
well qualified, having the ability to perform a specific role. Regardless of training,
competency would grow through experience and the extent of an individual to learn and
adapt.
Resource utilization: It is the process of utilizing the available resources with in the
organization effectively to increase efficiency of the work so that profitability of the
organization will be increased.
Profitability: It is a financial metrics that is used to assess a business's ability to
generate earnings as compared to its expenses and other relevant costs incurred during a
specific period of time. Profitability will be increased with increase in resource
utilization.
Learning and growth
Internal business process
Customer perspective
Financial perspective
Figure 4.6
4.3.5 CUSTOMER SATISFACTION
Customer satisfaction is a measure of how products and services supplied by a
company meet or surpass customer expectation. Customer satisfaction is defined as "the
number of customer or percentage of total customers, whose reported experience with a
firm, its products, or its services (ratings) exceeds specified satisfaction goals Customer
satisfaction provides a leading indicator of consumer purchase intentions and loyalty.
Customer satisfaction data are among the most frequently collected indicators of market
perceptions.
Profitability
Resource utilization
On time delivery
Competency per FTE
Remedial training : Specific remedial training for personnel may be required to
refresh and upgrade knowledge and skills related to their duties. A standard method of
implementing this training and evaluating the personnel involved should be established.
Zenta is following remedial training method to ensure efficiency in the process so that it
increases customer satisfaction.
Learning and Growth
Internal business process
Customer perspective
Financial perspective
Figure 4.7
Defective units
Cost of rework
Remedial training
CSAT
Cost of rework: Rework cost is the standard or actual cost that is spent on correcting
defective work. Rework cost is an unnecessary and additional cost for the organization,
which affects the overall operating cost.
4.3.6 ASSET UTILIZATION
Learning and growth Internal business process Customer perspective Financial
perspective
Figure 4.8
The term asset utilization means proper utilization of internal facilities to the greater
extent. Higher asset utilization increases the profitability and decreases the overall
expense incurred by the organization. All the internal facilities are more of IT related so
employees also should posses IT skills to use the facilities effectively. This will result in
increase in quality of service to the customer, which is the base line for any organization.
4.2 BALANCED SCORECARD ANALYSIS FOR ZENTA
The balanced scorecard framework for Zenta is formulated with the help of above
strategies given in the balanced scorecard approach figure. The final balanced scorecard
is shown in the table given below. This include two important strategies they are
Strategic objective
Strategic measurement
Strategic objective:
Asset utilization
IT skills per FTE
CSATBy quality of service Profitability
Strategic objective consist of four perspectives along with the metrics calculated
in Zenta this strategic objective is framed with help of vision and mission of the
company.
Financial perspective
In financial perspective balanced scorecard comprises of three important metric
which is considered in Zenta they are
Improve financial Returns
o Broaden Revenue Mix
o Reduce cost Structure
To achieve higher financial returns there should be more area for revenue generation
which also helps organization to grow. Reduce cost structure is productivity term to
control cost in organizational process high cost reduction will impact in quality of the
service provided to the customers this will the lagging indicator.
Customer perspective
In customer perspective table, increase in customer satisfaction through superior
execution is the strategic objective (These objectives are considered for Zenta). To
increase CSAT employee in the organization should be well trained how to handle the
customer. How to serve them but making proper relationship will be challenge so this
will be in lagging indicator. There should a proper execution of service this will result in
high customer retention so market share in the segment will go up this will the leading
indicator.
TABLE: 1 (BALANCED SCORECARD OF ZENTA)
Strategic ObjectiveStrategic Measurement
Lagging Indicators Leading Indicators
FINANCIAL PERSPECTIVE
Improve returns ROI
Broaden revenue Mix Revenue growth Revenue mix
Reduce cost Structure Quality reduction Process Improvement Through
Kaizen and Lean tool
CUSTOMER PESPECTIVE
Increase Customer Satisfaction
Through Superior Execution
CRM Share of the segment
INTERNAL BUSINESS
PROCESS
Understand Customer Segments Meeting Client Targets
High capacity utilization Business volume
Asset utilization No Tracking system
FTE competency Remedial training
Cycle time reduction Application Tracking Statistical Measure
Provide Rapid
Response(internal)
Application
Tracking(Track IT)
LEARNING AND GROWTH
Increase Employee Productivity Efficiency Drivers Application Support
Develop Strategic Skills Attrition Effective Work force
Access to Strategic Information Application
Restriction
Align Personal Goals Good Performance Appraisal
.
Internal business process
In Zenta I am considering six internal businesses metric to measure balanced
scorecard. The considered metric are
Understand Customer Segments
High Capacity Utilization
Asset Utilization
FTE Competency
Cycle Time Reduction
Provide Rapid Response
These metrics are considered is to cover all the business area in the company. Provide
rapid response is only for internal communication purpose, not with external customers.
Learning and Growth perspective
Learning and growth is one the key perspective which helps to improve the
bottom line of the company. To increase employee productivity training is important only
with training employee cannot become competent to make employee competent some
key metric are considered they are
Develop strategic skills
Access to strategic information
Align personal goals
Develop strategic skills
In order to make process improvement employee should be trained according to
the business requirement. When there is lack of training employee cannot perform their
job well so it leads to attrition. For effective performance in their job employee should be
well motivated and trained this will increase overall efficiency of the organization.
Access to strategic information
In Zenta all the process is application oriented and application controlled. All
employees cannot access all files they have a limit but some of the strategic information’s
are common to all. This kind of systematic procedure of allowing access to data will
motivate employee to achieve more in their work process.
Align personal goals
Each and every employee in the organization will be aligned with specific goals
as assigned by the business head. With the proper communication of goal employee can
work on it and achieve it.
STRATEGIC MEASUREMENT
Strategic measurement has to main parts which will access the all the metric of
strategic objective the two parts of strategic measurement are
Lagging Indicator
Leading Indicator
Lagging Indicator
In balanced scorecard outcomes are called lagging indicators. It will determine
what to be improved in the company so that company can earn more. Lagging indicators
are not measured as leading but measuring lagging indicator will help organization to
change it to leading indicator
Leading indicator
In balanced scorecard leading indicators are the performance drivers which makes
company profitable. The leading indicator makes company to act according to the
strengths this will help them to achieve more in the market place. In strategic
measurement leading indicator will tell the strength of the company which was shown in
table below.
4.4 ZENTA APPROACH ON BALANCED SCORECARD
The process of developing a balanced scorecard at Zenta is translated each of
these strategies into objectives and measures in the four perspectives. Particular emphasis
was placed on understanding and describing the cause and effect relationships on which
the strategy was based. A simplified version of the results of this effort is shown in the
figure (4.1).
REVENUE GROWTH STRATEGY PRODUCTIVITY STRATEGY
Financial perspective
Customer Perspective
Internal Perspective
Learning and Growth Perspective
Improve returns
Broaden Revenue Mix
Improve Operating Efficiency
Increase Customer Confidence in Our Financial Advice
Increase Customer Satisfaction Through Superior Execution
Understand Customer Segments
High capacity utilization
Asset utilization
FTE competency
Shift to Appropriate Channel
Cycle time reduction
Reduce compliance
Increase Employee Productivity
Develop Strategic Skills Access to
Strategic Information
Align Personal Goals
On the job training
For the revenue growth strategy, the financial perspective is to broaden the
revenue mix for the company. Strategically it is meant to increase the business process by
acquiring new clients and identifying new processes. In case of customer perspective,
increase customer confidence will be the key factor for the Zenta in customer retention.
Then the scorecard design focused on the internal business process perspective, Zenta has
three main objectives first is understanding customer segments, Zenta is an outsourcing
company understanding the customer needs and wants is important for better servicing.
All customers are not same so segmenting them according to there requirement and work
accordingly will increase their confidence. Second was to improve capacity utilization of
the company, CU is one of key metric measured in the company which helps to measure
the performance of the business group, there will a CU target which is to be achieved by
the all BG’s in the company but the target will be different according to the work flow of
the BG’s. High CU leads to higher revenue. Third will be the asset utilization this will
measure the resource utilization i.e. the internal facilities provided by the company to
their employees.
The next scorecard measure will be the productivity strategy, the financial
perspective is to improve the operating efficiency this achieved by implanting new
techniques which reduce the cost Zenta follows Kaizen tool as technique which helps to
reduce the production hours due to that cost is reduced. These both revenue growth
financial measure and productivity strategic financial measure will lead to more returns to
the company which helps to achieve the financial goal.
For customer perspective in productivity strategy is to improve the customer
satisfaction through superior execution this suggest that fulfilling customer wants and
needs with help of facilities available. In internal business process I am considering three
important productivity improvement strategies are measured they are
Improve Competency of FTE
Cycle time reduction this applicable for all business process
Compliance to organizational policies
CYCLE TIME REDUCTION:
Cycle Time Reduction is identifying and implementing more efficient ways to do
things. Reducing cycle time requires eliminating or reducing non-value-added activity,
which is defined as any activity that does not add value to the product. Examples of non-
value- added activity in which cycle time can be reduced or eliminated include repair due
to defects, machine set-up, inspection, test and schedule delays. Reducing cycle time will
have a significant impact on a company's bottom line when implemented.
COMPLIANCE:
Conformity to the organizational policies or requirements to meet the overall
objectives. A system or framework developed internally to implement the above either
manually or application which will help in controlling and monitoring of key metrics.
All this metrics in balanced scorecard will help organization to measure the
performance and effectiveness of the work flow process. These three strategies gives way
to next set of questions on this that is what kind competency to be improved? And how
cycle time reduction can be done? To answer this question there will proper training
program will be given. In this balanced scorecard there will be another perspective that is
learning and growth. This perspective is common base for both the revenue growth
strategy and productivity strategy. Learning and growth three important metric they are
first is develop strategic skills this is achieved with help of proper on the job training.
Second will be Access to strategic information should ensure that all employees can
access to the common goals, financial status of the company then new deal. This helps
them to improve the knowledge about the work flow. Third will be alignment of personal
goals. Each employee in the company should have a goal this goal should be
communicated to the individual through training and development team in the company.
All these strategies lead to increase in employee productivity. This employee productivity
helps in improvement above mentioned strategies that is revenue growth and
productivity.
4.5 ACHIVING STRATEGIC ALIGNMENT: FROM TOP TO BOTTOM
Implementation of balanced scorecard begins by educating people who is
involving in executing it. Some organizations hold their strategy to top management to
make it secret that is shared among the senior executive and control group. Implement
group is controlled and commanded by top management but this is only for centralized
management company. Now a day’s all the organization is customer driven so all are
included in implementing and all are allocated with different strategy that is to be
implemented.
when balanced scorecard is implemented in an organization their management
system will get varied it will follow Top to Bottom level of management system. And a
different management system will be followed that is communicating and linking which
is shown in the figure
Figure 4.10
There are three distinct mechanisms are used in this method they are
Clarifying and
Translating the
Vision and Strategy
Strategic feedback
and learning System
Planning and Target
Setting
Communicating
and LinkingBalanced
scorecard
1. Communication and education programs. A prerequisite for implementing
strategy is that all employees, senior corporate executives, and the board of
directors understand the strategy and the required behavior to achieve the strategic
objectives. A consistent and continuing program to educate the organization on
the components of the strategy, as well as reinforcing this education with
feedback on actual performance.
2. Goal-setting programs. Once a base level of understanding exists, individuals and
teams throughout the business unit must translate the higher level strategic
objectives into personal and team objectives. The traditional management by
objectives (MBO) programs used by most organizations should be linked to the
objectives and measures articulated in the balanced scorecard.
3. Reward linkage system. Alignment of the organization towards the strategy must
ultimately be motivated through the incentives and reward. In this system its
incorporated in strategy itself
Key Features of this management strategy-
Goal alignment exists from top to bottom
Education and open communication about strategy are basis for employee
empowerment
Compensation is linked to strategy.
For formulating a balanced scorecard that links a business unit’s mission and strategy to
explicit objectives and measures is only the start of using the scorecard as a management
system. the balanced scorecard must be communicated to all the employees including top
level to bottom level reason for communicating this to all employees is to align all
employees with the organization as well as individuals to whom the business unit is
accountable to the strategy. The knowledge and alignment among these constituents will
facilitate local goal setting, feedback, and accountability to the SBG’s strategic path.
Alignment and accountability will clearly be enhanced when individual
contribution to achieving scorecard objectives are linked to recognition, promotion and
compensation programs. Whether such linkage should be explicit, based on
predetermined formulas, or applied judgmentally, using the heighted visibility and
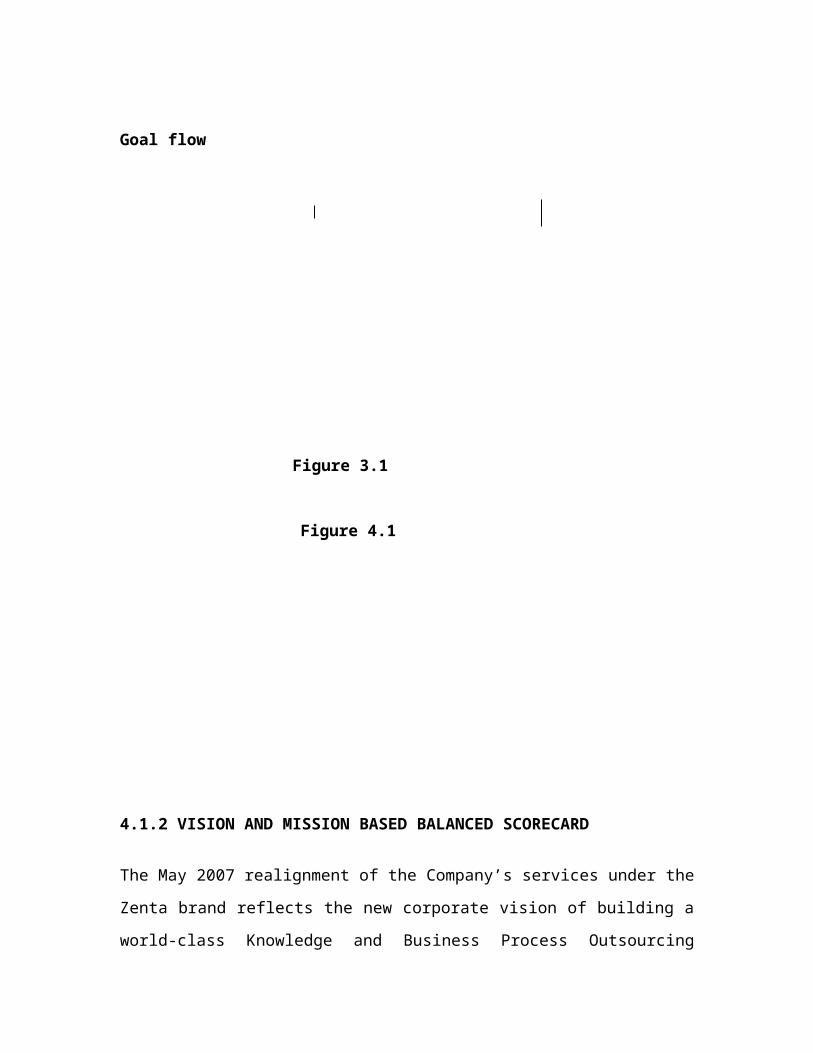
observability gained from formulation, more knowledge about benefits and costs of
explicit linkages will undoubtedly continue to be accumulated in the years ahead.
CHAPTER 5
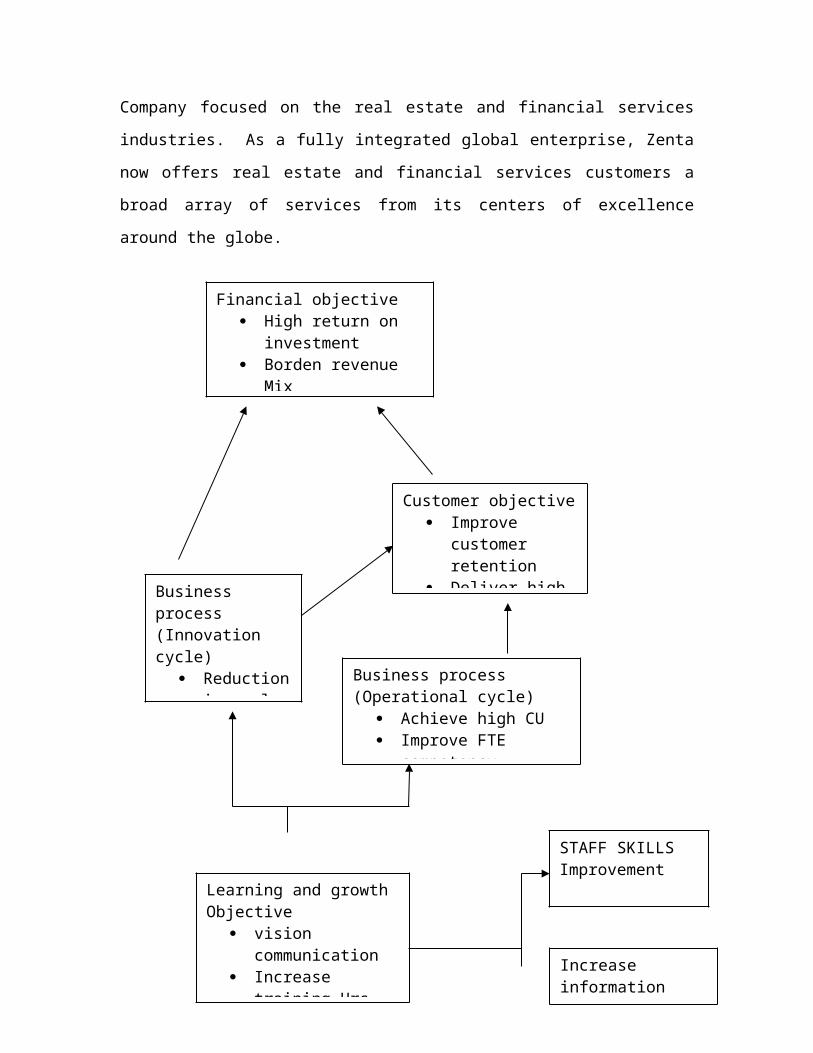
5.1 SUMMARY: FINDINGS
Companies initially adopt the balanced scorecard for various reasons which include
clarifying and gaining consensus on the strategy, focusing organizational change
initiatives, and developing leadership capabilities at strategic business units and how
effectively they manage and coordinate with other business units. In Zenta there are five
business groups which have lack of communication between each other this will one
major reason why Zenta will go for balanced scorecard in future. The balanced scorecard
can be a cornerstone for any organization’s management system because it aligns and
supports some of the key process they are
Communicate the strategy throughout the organization
Align goals to all departments and employees
Linking all the available strategies in the organization
Aligns a new kind of performance management system
It take cares both internal and external side of the organization
If an organization which is implemented balanced scorecard what to quick transition,
from vision to action plan mean they will feel the real excitement and gain of real value
of balanced scorecard because it mobilizes the system according to the new vision and
make quick change in the performance system which will suit the new vision. So it will
become very comfortable and easier to change the entire management system in short
period.
5.2 BENEFITS OF “BALANCED SCORECARD AS PERFORMANCE
MANAGEMENT TOOL”
It will line up strategic initiatives that follow "best practices" methodologies
cascade through the entire organization.
It will leads to increased creativity and unexpected Ideas
The Balanced Scorecard helps to align key performance measures with strategy at
all levels of an organization
It (balanced scorecard as performance management tool) will provide
management with a comprehensive picture of business operations
Balanced scorecard methodology will facilitate communication and understanding
of business goals and strategies at all levels of an organization
It leads to maximized Cooperation - Team members are focused on helping one
another succeed
Early identification of problems and opportunities;
Usable Results - Transforms strategy into action and desired behaviors
It leads to a cohesive organization working toward common goals.
The Balanced Scorecard concept provides strategic feedback and learning
A cross organizational team - More open channels of communications -
Enthusiastic People
Increased productivity, quality, and customer service can be achieved
Initiatives are continually measured and evaluated against industry standards
Balanced Scorecard helps reduce the vast amount of information that the
organization's IT systems process into essentials
Unique Competitive Advantage
Reduced Time-frames
Improved Decisions and Better Solutions
Improved Processes
5.3 CONCLUSION
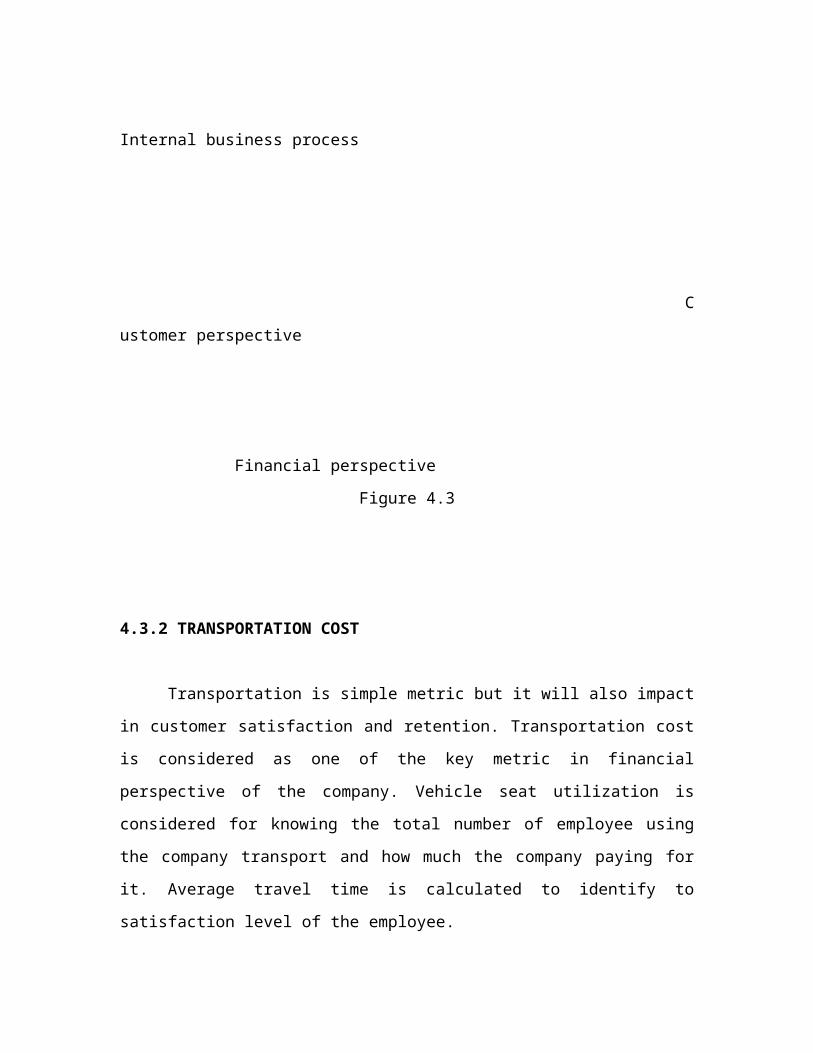
Controlling is an extraneous task in any organization, as it is to include various
aspects of Business – like Client Management, Process Management, Support
Management etc. Hence, it is important to implement control measures systematically.
KAPLAN AND NORTAN came up with a tool which helps achieving this, which is
called “Balanced Scorecard”. All the process in an organization has to function in a
manner which achieves the organization objectives ultimately. “Balanced Scorecard” is
an effective tool to align this taking a “Top Bottom” approach
In Zenta, I have made an attempt to do a Quantitative study of how “Balanced
Scorecard” can be in built to the process and as a Performance Management tool. The
outcome has been very interesting & further scope can be explored.
CHAPTER 6
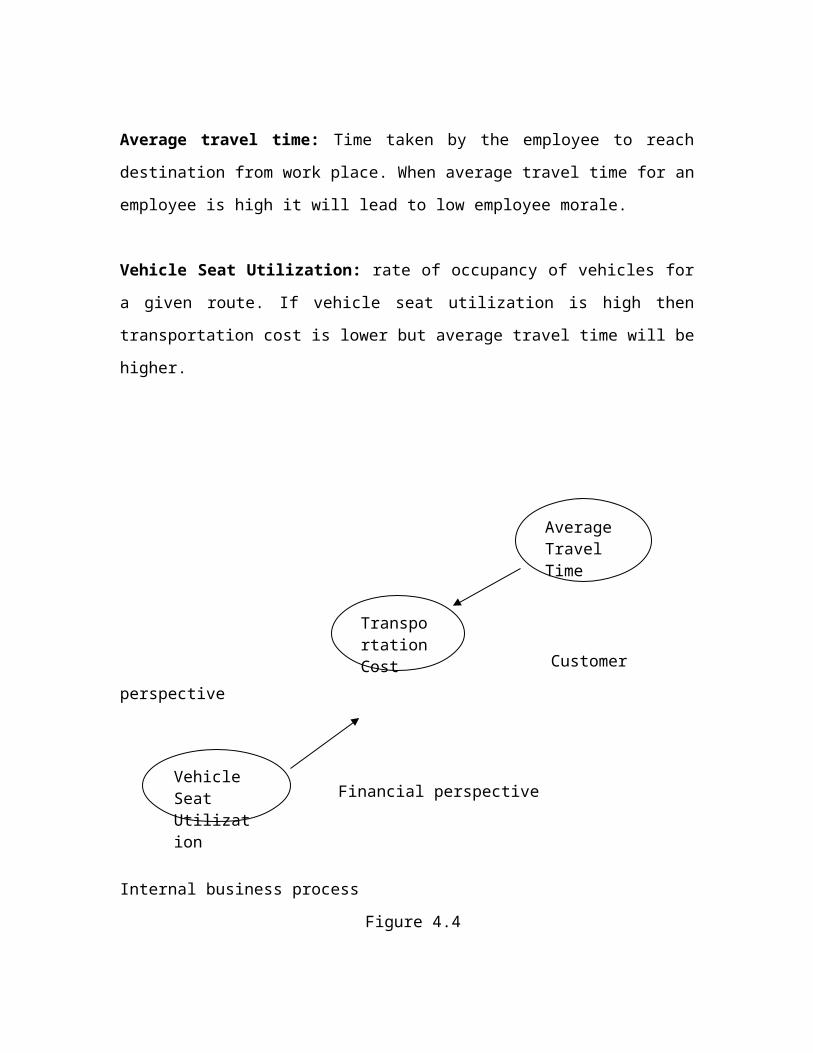
APPENDIX
BIBLIOGRAPHY
The balanced scorecard “translating strategy into action” by Robert S. Kaplan and
David P. Norton
www.balancedscorecard.org/.../AbouttheBalancedScorecard/.../Default.aspx -
en.wikipedia.org/wiki/Balanced_scorecard
http://management.energy.gov/documents/
http://www.qsrinternational.com/