
BALANCED SCORECARD MODEL OF “ABN AMRO
24
www.ijcrt.org © 2017 IJCRT | Volume 5, Issue 3 July 2017 | ISSN: 2320-2882 IJCRT1033024 International Journal of Creative Research Thoughts (IJCRT) www.ijcrt.org 160 BALANCED SCORECARD MODEL OF “ABN AMRO” Author: Dr. Sagar R. Dave Associate professor, Department of Accountancy JG College of Commerce, Ahmedabad
Transcript of BALANCED SCORECARD MODEL OF “ABN AMRO
www.ijcrt.org © 2017 IJCRT | Volume 5, Issue 3 July 2017 | ISSN: 2320-2882
IJCRT1033024 International Journal of Creative Research Thoughts (IJCRT) www.ijcrt.org 160
BALANCED SCORECARD MODEL OF “ABN
AMRO”
Author: Dr. Sagar R. Dave
Associate professor, Department of Accountancy
JG College of Commerce,
Ahmedabad

www.ijcrt.org © 2017 IJCRT | Volume 5, Issue 3 July 2017 | ISSN: 2320-2882
IJCRT1033024 International Journal of Creative Research Thoughts (IJCRT) www.ijcrt.org 161
BALANCED SCORECARD MODEL OF “ABN AMRO”
ABSTRACT
Panel data spread over twelve years from 2005 to 2016 and 29 indicators of the bank, are used for the
purpose. The initial discussion relating to the significance of measurement of intangible assets and
integration of contingencies in performance evaluation establish the need to design a comprehensive
performance evaluation system for the Indian banks. It is found that being a part of the service sector,
long-term strategic planning in a bank needs to concentrate on such a system. However, implementing this
technique becomes complicated due to the difficulties in measurement of the intangible assets, existence of
the interrelations among these indicators, differences in the significance assigned to various indicators
within the organization and trouble in setting the linkages between the employee performance and the
reward mechanism. Paper evaluates the significance of intangible aspects as a tool for performance
measurement in the Indian banking sector, with a special focus on the foreign bank – the ABN AMRO. This
is done by constructing a Balanced Scorecard for the bank, and then evaluating the performance of the
bank through this BSC.
ABN AMRO AS A LEADING FOREIGN BANK:
ABN AMRO is one of the leading foreign bank of India. First, it is a prominent international bank with
history going back to the Netherlands of 1824. ABN AMRO ranks the eighth in the Europe and the 12th in
the world based on total assets, with more than 3500 branches in 76 countries, a staff of more than 1,00,000
full-time equivalents and total assets of US $ 504 billion. ABN's Indian assets are estimated to be over
Rs.23500 crore, making it the fourth largest foreign bank in India. Second, ABN AMRO (India) has had a
long-standing presence in India, having been in Kolkata and Mumbai since 1920. Traditionally known as
the “diamond-financing bank”, it has transformed itself from a bank focusing on the corporate business
segment into a bank providing a comprehensive range of services across multiple channels. Third, after
the merger of ABN and AMRO worldwide, the bank started expanding in a big way in India, 1991 onwards.
Currently it has 23 branches across 21 cities, with a focus on the consumer and commercial clients business,
and a microfinance programme making it a foreign bank of great interest in India.
BANKS VISION STATEMENT:

www.ijcrt.org © 2017 IJCRT | Volume 5, Issue 3 July 2017 | ISSN: 2320-2882
IJCRT1033024 International Journal of Creative Research Thoughts (IJCRT) www.ijcrt.org 162
Excellence of service to the clients and leadership in the chosen markets, while adhering to its corporate
values, are of paramount importance to the long term success of the bank.
BANKS MISSION STATEMENT
To create maximum economic value for shareholders through a constant relationship focus on the financial
services needs of the chosen client segments and a strict adherence to the financial targets. The mission
statement indicates that financial and customer perspectives bear more weight in the developmental strategy
of the bank. The SWOT analysis of the bank supports this notion, whereas technological and internal
business process perspectives appear to be a stronghold of the bank.
The bank operates in three principal customer segments – consumer, commercial and private banking
activities, with the objectives mentioned below:
Maximize the value of each of the above stated businesses as well as the synergies between them
Develop its operations in India as a subsidiary
Increasingly focus on off-shoring business processes to tap the human resources and reduce the cost
of operations in other countries
ABN AMRO functions with the strategy to build on its strong position with mid-market clients and to
provide clients in this segment with high-quality and innovative products and services from across the
Group. In other words, the strategy of the bank is aimed at combining local client intimacy and global
product excellence. The bank focuses on consumer, commercial and private banking activities. Its business
mix gives a competitive edge in its chosen markets and client segments. The clients are the prime
beneficiaries of the relationship banking approach implemented through the Business Units of the bank.
INDICATORS OF THE BANK
The data given in table 4.5 must be analysed with a caution. The reason is that although ABN AMRO is
the fourth largest foreign bank in India, its operations are very limited as compared to both Indian
nationalized banks and Indian private sector banks on one hand and other foreign banks operating in India
on the other.
A. Financial Perspective:
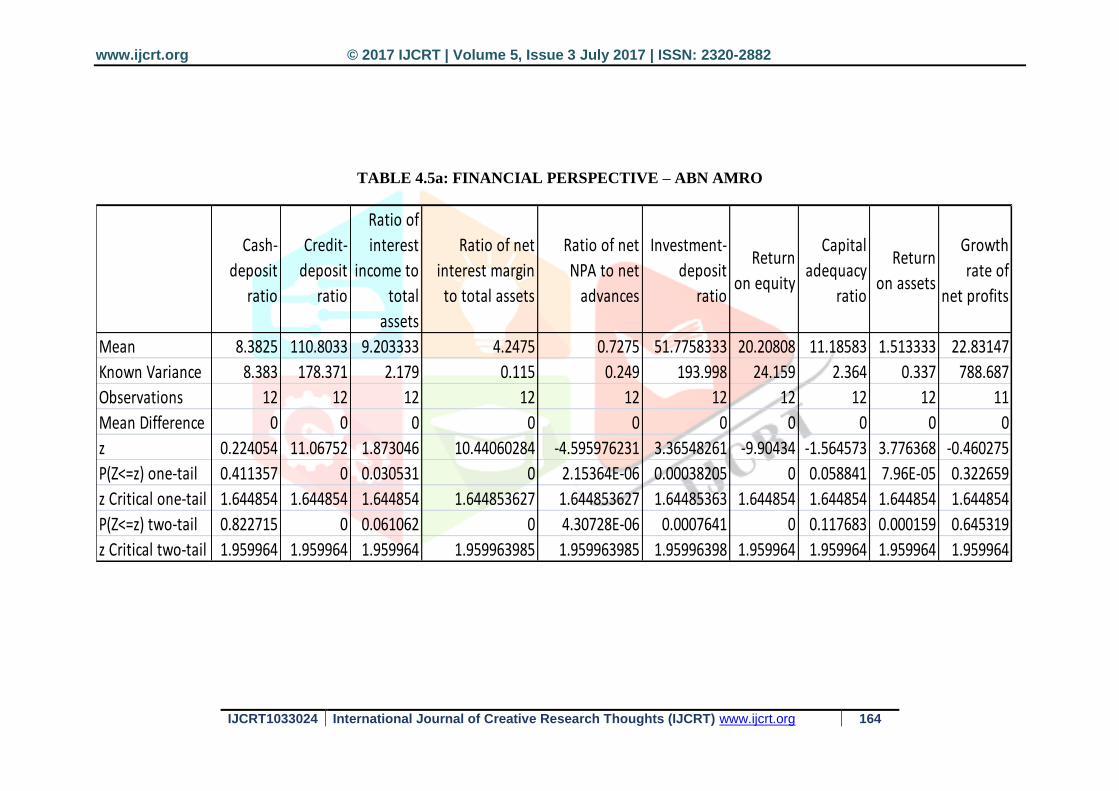
Table 4.5a indicates that all indicators of financial perspective except cash-deposit ratio and the growth rate
of net profits are statistically significant. Chart 4.17 shows that the financial indicators for ABN AMRO
www.ijcrt.org © 2017 IJCRT | Volume 5, Issue 3 July 2017 | ISSN: 2320-2882
IJCRT1033024 International Journal of Creative Research Thoughts (IJCRT) www.ijcrt.org 163
are not highly volatile. Hence, performance of the bank is considered to be more stable, which is important
considering the fact that as a foreign bank it has to face more stringent RBI norms. The cash-deposit ratio
declined continuously from 10.92 in 2005 to 6.41 in 2014, following the declining cash reserve
requirements by the RBI. However, after that the ratio increased again to reach the level of 11.31 by 2016.
Though the average cash-deposit ratio maintained by the bank is 8.383 and it is slightly higher as compared
to all commercial banks in general, the difference is not significant. This indicates that the bank is confident
about its own financial performance and its image among the customers, unlike some other private and
foreign banks who maintain relatively higher cash-deposit ratio to meet a sudden run on the bank by the
depositors. Moreover, lower cash-deposit ratio is also an indicator of higher credit creation by the bank.
This is evident from the fact that the credit-deposit ratio of ABN AMRO has increased from 102.62 in 2005
to 140.00 in 2013, before declining to 107.77 in 2016. The mean value of 110.803 is almost double
compared to the mean of all commercial banks, resulting in high statistical significance.
www.ijcrt.org © 2017 IJCRT | Volume 5, Issue 3 July 2017 | ISSN: 2320-2882
IJCRT1033024 International Journal of Creative Research Thoughts (IJCRT) www.ijcrt.org 164
Cash-
deposit
ratio
Credit-
deposit
ratio
Ratio of
interest
income to
total
assets
Ratio of net
interest margin
to total assets
Ratio of net
NPA to net
advances
Investment-
deposit
ratio
Return
on equity
Capital
adequacy
ratio
Return
on assets
Growth
rate of
net profits
Mean 8.3825 110.8033 9.203333 4.2475 0.7275 51.7758333 20.20808 11.18583 1.513333 22.83147
Known Variance 8.383 178.371 2.179 0.115 0.249 193.998 24.159 2.364 0.337 788.687
Observations 12 12 12 12 12 12 12 12 12 11
Mean Difference 0 0 0 0 0 0 0 0 0 0
z 0.224054 11.06752 1.873046 10.44060284 -4.595976231 3.36548261 -9.90434 -1.564573 3.776368 -0.460275
P(Z<=z) one-tail 0.411357 0 0.030531 0 2.15364E-06 0.00038205 0 0.058841 7.96E-05 0.322659
z Critical one-tail 1.644854 1.644854 1.644854 1.644853627 1.644853627 1.64485363 1.644854 1.644854 1.644854 1.644854
P(Z<=z) two-tail 0.822715 0 0.061062 0 4.30728E-06 0.0007641 0 0.117683 0.000159 0.645319
z Critical two-tail 1.959964 1.959964 1.959964 1.959963985 1.959963985 1.95996398 1.959964 1.959964 1.959964 1.959964
TABLE 4.5a: FINANCIAL PERSPECTIVE – ABN AMRO

www.ijcrt.org © 2017 IJCRT | Volume 5, Issue 3 July 2017 | ISSN: 2320-2882
IJCRT1033024 International Journal of Creative Research Thoughts (IJCRT) www.ijcrt.org 165
Growth
rate of
total
credit
Ratio of
term loan
to total
advances
Ratio of
priority
sector
advances
to total
advances
Transactions
outside India
Growth in total
deposits
Ratio of
term
deposits to
total
deposits
Ratio of
deposits
to total
liabilities
Marketing
expenses
Growth
in volume
of
business
Marketing
expenses
to volume
of
business
Mean 31.66639 36.1756 32.27636 157453.5 31.18494606 61.3683333 53.13641 1532.167 31.21981 0.099791
Known Variance 574.403 74.506 18.781 42000000000 597.559 148.387 33.612 1839209 526.873 0.001896
Observations 11 12 11 12 11 12 12 12 11 12
Mean Difference 0 0 0 0 0 0 0 0 0 0
z 1.337515 -2.1998 -0.210757 -0.041460476 1.79430559 -0.37107218 -15.1287 1.934468 1.68295 -1516.196
P(Z<=z) one-tail 0.090527 0.013911 0.416539 0.483464401 0.036382203 0.35529189 0 0.026528 0.046192 0
z Critical one-tail 1.644854 1.644854 1.644854 1.644853627 1.644853627 1.64485363 1.644854 1.644854 1.644854 1.644854
P(Z<=z) two-tail 0.181055 0.027821 0.833077 0.966928801 0.072764406 0.71058377 0 0.053056 0.092385 0
z Critical two-tail 1.959964 1.959964 1.959964 1.959963985 1.959963985 1.95996398 1.959964 1.959964 1.959964 1.959964
TABLE 4.5b: CUSTOMER PERSPECTIVE – ABN AMRO

www.ijcrt.org © 2017 IJCRT | Volume 5, Issue 3 July 2017 | ISSN: 2320-2882
IJCRT1033024 International Journal of Creative Research Thoughts (IJCRT) www.ijcrt.org 166
Business
per
employee
Profit per
employee
Ratio of
wage bills
to total
income
Ratio of wage
bills to total
expense
Ratio of wage
bills to
intermediation
cost
Mean 878.415 11.324 9.134332 13.09048842 30.62968499
Known Variance 10111.34 16.197 12.789 25.191 24.754
Observations 10 10 12 12 12
Mean Difference 0 0 0 0 0
z 10.19841 7.128591 -5.086507 -3.533646311 -14.11320152
P(Z<=z) one-tail 0 5.07E-13 1.82E-07 0.000204935 0
z Critical one-tail 1.644854 1.644854 1.644854 1.644853627 1.644853627
P(Z<=z) two-tail 0 1.01E-12 3.65E-07 0.000409869 0
z Critical two-tail 1.959964 1.959964 1.959964 1.959963985 1.959963985
YEARNumber
of atms
Number
of Debit
cards
Number
of credit
cards
Expenditure on
training of
employees
Number of
skilled
employees
2005
2006 Mean 14904.41667 30.1629182
2007 Known Variance 259000000 686.788
2008 Observations 12 6
2009 Mean Difference 0 0
2010 z -1.000501124 2.41478301
2011 1.25 P(Z<=z) one-tail 0.158534027 0.00787229
2012 3 4 z Critical one-tail 1.644853627 1.64485363
2013 3.9 7 P(Z<=z) two-tail 0.317068054 0.01574459
2014 6.3 10.1 z Critical two-tail 1.959963985 1.95996398
2015 110 10.73 16.5
2016 116 11 15
TABLE 4.5c: INTERNAL BUSINESS PROCESSES – ABN AMRO TABLE 4.5d: LEARNING & GROWTH PERSPECTIVE – ABN AMRO
www.ijcrt.org © 2017 IJCRT | Volume 5, Issue 3 July 2017 | ISSN: 2320-2882
IJCRT1033024 International Journal of Creative Research Thoughts (IJCRT) www.ijcrt.org 167
0.00
5.00
10.00
15.00
20.00
25.00
30.00
35.00
- 40.00
- 20.00
0.00
20.00
40.00
60.00
80.00
100.00
120.00
140.00
160.00
2005 2006 2007 2008 2009 2010 2011 2012 2013 2014 2015 2016
RATIOS IN PERCENTA GE RATIOS IN PERCENTA GE
YEAR
CHART 4.17 ABN AMRO ON FINANCIAL PERSPECTIVE
Credit - deposit ratio Investment - deposit ratio Growth rate of net profits
Cash - deposit ratio Ratio of interest income to total assets Ratio of net interest margin to total assets
Return on assets Return on equity Capital adequacy ratio
Ratio of net NPA to net advances

www.ijcrt.org © 2017 IJCRT | Volume 5, Issue 3 July 2017 | ISSN: 2320-2882
IJCRT1033024 International Journal of Creative Research Thoughts (IJCRT) www.ijcrt.org 168
Out of the five bank sample selected here, this is the only bank having greater volume
of credit creation as compared to the deposits mobilized. This implies that the bank
utilizes its deposit base more efficiently as compared to the other banks. Moreover,
with a greater focus on commercial activities, it can be expected that the bank has been
able to grant more credit as compared to the deposits mobilized by it.
The impact of high credit-deposit ratio is visible in higher ratio of interest income total
assets. Although the ratio showed a declining trend from 11.05 in 2005 to 6.94 in 2014,
it increased again to 9.33 by 2016. And, the mean value of 9.203 is significant as
compared to the interest income to total assets ratio for all commercial banks at 8.219
per cent level. The marginal decline in the ratio indicates that the share of other
components of total assets has increased at a faster speed. This could be mainly due to
declining interest rates charged by the bank in the wake of declining real rates of interest
in the economy, and corresponding expansion of credit advances.
The ratio of net interest margin to total assets has remained almost stable. It reached
the lowest level of 3.56 in 2014, before rising again to a comfortable level of 4.85, the
highest among the five banks chosen here. This renders the ratio of net interest margin
to total assets much greater significance with the mean value 4.248 being higher than
the mean for all commercial banks. This indicates that while the share of interest
income has declined, the share of net interest margin has not declined much. This is
due to the fact that the interest expenditure has not increased much as compared to the
decline in the interest revenue. It should also be noted that the ratio has the highest
mean value compared to all the banks included in the sample here and a relatively lower
variance of 0.114. Thus, while other banks seem to have suffered from a loss in net
interest income, ABN AMRO has not suffered as much loss, which indicates financial

www.ijcrt.org © 2017 IJCRT | Volume 5, Issue 3 July 2017 | ISSN: 2320-2882
IJCRT1033024 International Journal of Creative Research Thoughts (IJCRT) www.ijcrt.org 169
soundness of the bank. This prompts to a possibility of lower net NPA to net advances
ratio. Data analysis reveals that the ratio decreased initially from 1.15 in 2005 to 0.30
in 2008, before rising again up to 1.54 in 2011 and then declined again to 0.11 by 2014.
It increased to 0.85 by 2016. The mean value of 0.728 and the variance of 0.249 are
both significantly low as compared to the mean and variance of all commercial banks,
which are 4.459 and 7.66 respectively. One of the reasons behind such sound
performance can be limited existence of the bank in the country. Moreover, being a
foreign bank, it must be extra cautious about its lending activities as well as its
compliance with stringent RBI norms regarding the functioning of foreign banks in
India. Nevertheless, as the bank tries to expand its activities in the country in future,
this is bound to have a positive impact. Another positive performance indicator is
relatively high and statistically significant investment-deposit ratio. This ratio
increased from a low value of 30.83 in 2005 to the peak of 79.38 in 2008. It reached
the low level of 40.05 in 2015, before rising to 62.28 in 2016. Nevertheless, it is quite
high with a mean value of 51.776 against the mean of all commercial banks 37.966.
The variance is also very high at 193.998. This indicates that the bank constantly tries
to balance well between the two major assets: credit and investment. At the same time,
it needs to pay more attention to the declining investment-deposit ratio of late, if it
wants to continue its balanced approach towards asset creation. Sound financial
performance in the above indicators is bound to translate into high profitability as well.
This is evident from very high values of both return on equity and return on assets,
although both the trends have been downward. The return on equity declined from
22.27 to 12.93 during the last decade with the mean value of 20.208 and a variance of
24.159, both of which are more than the figures for the all commercial banks. The
difference between the two mean values is highly significant, though the declining trend
www.ijcrt.org © 2017 IJCRT | Volume 5, Issue 3 July 2017 | ISSN: 2320-2882
IJCRT1033024 International Journal of Creative Research Thoughts (IJCRT) www.ijcrt.org 170
may be a matter of concern for the bank. On the other hand, return on assets declined
from 2.08 to 0.78, with the mean of 1.51 and variance of 0.337. Again, the mean is
significantly high when compared with all commercial banks. The significance of both
these ratios indicates that the bank has done profitable business. However, with
increasing competition and decreasing interest rates, the profit margin may have
declined, which has caused reduction in both the ratios over the past decade. The full
range of decline in profitability is evident from data on growth rate of net profits. The
performance of the bank appears to be quite erratic here, as the growth rate declined
from 67.82 per cent in 2006 to -8.79 percent in 2009, and then increased up to 33.38
per cent in 2012. However, the growth rate declined again to 0.22 per cent in 2013 and
then increased to 59.44 per cent in 2015. Once again it went into red in 2016, when the
bank registered a negative growth rate of -27.164 per cent. This erratic behavior
resulted into a lower average growth rate of net profits, that is, only 22.83, as compared
to all commercial banks, which is 28.837. And, although the variance is not very high,
the growth rate of net profits is not a statistically significant performance indicator as
far as ABN AMRO is concerned. Finally, the capital adequacy ratio of the bank
increased from a low value of 9.16 in 2005 to the highest value of 13.48 in 2012, before
declining again to 12.92 in 2016. The average capital adequacy maintained by the bank
is 11.186, which is the lowest in the selected sample and also lower as compared to the
average of all commercial banks. With the variance of 2.364, the ratio is significant at
5.88 per cent, which is a better performance compared to the private sector banks
included in the sample. The bank has diligently complied with the capital adequacy
norms of the RBI for foreign banks, that is, minimum nine per cent. The present capital
adequacy is also higher than the BASEL II requirement of nine per cent. This indicates
that the bank has confidence in the performance of its assets, and believes in taking
www.ijcrt.org © 2017 IJCRT | Volume 5, Issue 3 July 2017 | ISSN: 2320-2882
IJCRT1033024 International Journal of Creative Research Thoughts (IJCRT) www.ijcrt.org 171
enough risk to translate its liabilities into assets. Such a policy is based on lower NPAs
and the past history of sound financial performance. In the light of recent fluctuations
in the growth rate of net profits, the bank may prefer to be more vigilant and opt to
maintain higher capital adequacy to balance the risk assets in a better way.
B. Customer Perspective:
Chart 4.18a indicates the performance of the indicators on customer perspective for
ABN AMRO. Initially the growth rate declined from 34.57 per cent in 2006 to 5.93
per cent in 2010, but then it increased continuously up to 53.24 per cent in 2014, before
decreasing again to 10.84 in 2016. With the mean value of 31.67 and variance of
574.40, the ratio is significant at 9.05 per cent level when compared with all commercial
banks. Although the growth rate of total credit is lower compared to the private sector
banks considered here, performance of ABN AMRO is better since the variance is much
lower compared to these banks. As the bank expands its operations in India, it can
concentrate further on increasing credit creation through better marketing and lower
interest charges. Further analysis shows that the ratio of term loans to total advances
has shown a downward trend from 41.42 in 2005 to 26.74 in 2010. However, the ratio
has increased considerably since then to reach the level of 50.81 by 2016. With the
mean value of 36.176 and variance of 74.505, the ratio is significantly below the
average of all commercial banks. This implies that so far the bank has refrained from
granting large amount of long term loans. This may be due to overly cautious approach
of the foreign bank to avoid large amount of NPAs and customers behaving shyly in
approaching a foreign bank for their credit needs. Interestingly, the ratio of priority
sector advances to total advances continuously increased from 28.83 in 2005 to 36.55
in 2016. The average of 32.276 is not significantly different from the average of
commercial banks, in spite of a relatively higher variance. This indicates that the bank

www.ijcrt.org © 2017 IJCRT | Volume 5, Issue 3 July 2017 | ISSN: 2320-2882
IJCRT1033024 International Journal of Creative Research Thoughts (IJCRT) www.ijcrt.org 172
has paid more attention to granting credit to the priority sector, which is commendable
considering that ABN AMRO is a foreign bank. Also, it must be noted that in spite of
being a foreign bank, ABN AMRO has been granting much higher proportion of total
credit to the priority sector, especially in the field of microfinance. This proves the
concern this foreign bank has towards the development of the grass roots level of the
economy.

www.ijcrt.org © 2017 IJCRT | Volume 5, Issue 3 July 2017 | ISSN: 2320-2882
IJCRT1033024 International Journal of Creative Research Thoughts (IJCRT) www.ijcrt.org 173
0.0000
0.0500
0.1000
0.1500
0.2000
0.2500
0.00
10.00
20.00
30.00
40.00
50.00
60.00
70.00
80.00
90.00
100.00
2005 2006 2007 2008 2009 2010 2011 2012 2013 2014 2015 2016
RATIOS IN PERCANTA GE
YEAR
CHART 4.18a ABN AMRO ON CUSTOMER PERSPECTIVE
Ratio of deposits to total liabilities Ratio of term deposits to total deposits
Ratio of priority sector advances to total advances Ratio of term loan to total advances
Growth rate of total credit Growth in total deposits
Growth in volume of business Marketing expenses to volume of business
www.ijcrt.org © 2017 IJCRT | Volume 5, Issue 3 July 2017 | ISSN: 2320-2882
IJCRT1033024 International Journal of Creative Research Thoughts (IJCRT) www.ijcrt.org 174
0
100000
200000
300000
400000
500000
600000
700000
2005 2006 2007 2008 2009 2010 2011 2012 2013 2014 2015 2016
10415 34446
6272 18133 48205
1546
124847
0
293289
386706
343798.00
621785.00
TRANSACTIONS OUTSIDE India IN RS LAKH
YEAR
CHART 4.18b ABN AMRO ON CUSTOMER PERSPECTIVE
Transactions outside India (in Rs. lakh)

www.ijcrt.org © 2017 IJCRT | Volume 5, Issue 3 July 2017 | ISSN: 2320-2882
IJCRT1033024 International Journal of Creative Research Thoughts (IJCRT) www.ijcrt.org 175
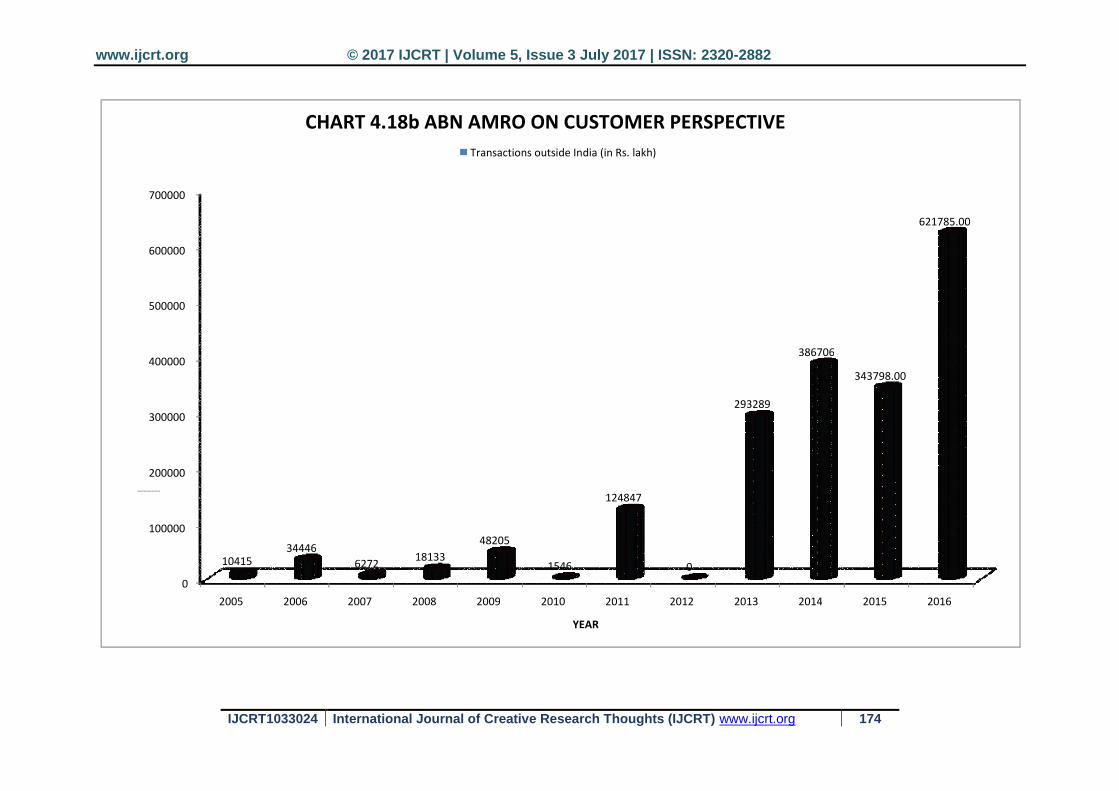
The bank is not much involved in transactions outside India. This indicator has shown
very high variance, although the volume of transactions outside India seems to have
increased lately. All these transactions involve borrowings from other countries, which
have increased from Rs.10415 lakh in 2005 to Rs.621785 lakh in 2016, with the mean
value of Rs.157453.5 lakh. This is not significantly different from the average of all
commercial banks. Except for HDFC Bank, all other banks are involved in foreign
transactions of much larger proportions. One of the reasons why ABN AMRO is not
involved in transactions outside India is because it is a foreign bank, and only the Indian
subsidiary is under consideration here. The bank seems to have performed well in the
area of mobilization of deposits. The average growth rate of deposits is 31.185 per cent,
which is significantly high compared to the average of all commercial banks, which is
merely 17.755 per cent. However, the bank can aim at greater volume of deposits across
all categories by expanding its banking activities in India. It is also important to
concentrate on stabilizing the growth rate of total deposits, as the last decade has shown
much volatility and a clear trend is absent, as the growth rate ranged between the lowest
level of 3.23 per cent and 81.97 per cent.
The ratio of term deposits to total deposits is not significant with the mean value of
61.368 and a very high variance of 148.387. The ratio declined from 77.12 in 2005 to
42.04 in 2013, and then increased to 60.29 in 2016. This implies that the majority of
the deposits collected by the bank are long term deposits, as the long term deposit rates
may be quite competitive, and a long history of sound business allows customers to
trust the performance of the bank in the future. Still, the bank can improve upon this
through greater focus on long term deposit mobilization from across the economy. The
ratio of deposits to total liabilities is the lowest among all banks selected here, with the
mean value being only 53.136. This is significantly lower than the average of all

www.ijcrt.org © 2017 IJCRT | Volume 5, Issue 3 July 2017 | ISSN: 2320-2882
IJCRT1033024 International Journal of Creative Research Thoughts (IJCRT) www.ijcrt.org 176
commercial banks as well. The trend shows much volatility, with the ratio declining
initially from 59.99 in 2005 to 45.54 in 2008, and then picking up to 65.33 in 2010,
before declining again to the level of 45.64 by 2013. The ratio increased to 51.65 by
2016. It remains to be seen whether the bank is able to maintain this upward trend for
long in future or not.
Overall growth in the volume of business also declined from 32.40 per cent in 2006 to
5.73 per cent in 2010. This increased to 59.746 per cent by 2014, before declining again
to 14.27 by 2016. Chart 4.18a shows that the growth rate of volume of business moves
is in high correlation with growth rate of total credit and growth rate of total deposits.
This is inevitable since volume of business is defined as the sum total of credit
advancements and deposits. Moreover, annual growth rates of both credit and deposit
have moved very closely over the last decade. The average growth rate of volume of
business is 31.22 per cent, which is significantly high as compared to the average
growth rate for all commercial banks. Relatively higher growth rate of credit and
deposits has resulted in higher growth rate of volume of business. On the other hand,
total marketing expenses have increased continuously from Rs.132 lakh to Rs.2748
lakh, with an average of Rs.1532.17 lakh. This average is significantly higher
compared to the aggregate mean value of all commercial banks. Consequently, the
ratio of marketing expenses to volume of business has also increased considerably from
0.0581 in 2005 to 0.1259 in 2013. Although the ratio declined considerably to 0.0699
in 2016. The mean value of 0.09979 is significantly high as compared to the mean
value of all commercial banks. Moreover, the ratio is much higher compared to all the
banks under consideration here, except the HDFC Bank. This indicates that ABN
AMRO has paid a lot of attention to marketing its products, which is essential for
successful expansion of its business in the long run.

www.ijcrt.org © 2017 IJCRT | Volume 5, Issue 3 July 2017 | ISSN: 2320-2882
IJCRT1033024 International Journal of Creative Research Thoughts (IJCRT) www.ijcrt.org 177
C. Internal Business Processes:
Chart 4.19a indicates performance of the indicators related to the wage bills of the
employees. Ratio of wage bills to total income shows an upward trend from 5.42 in
2005 to 14.97 in 2016. The mean value is 9.134, which is significantly lower compared
to the aggregate average of all commercial banks. This implies that either less
expenditure is incurred on the wages of employees or the revenue generation is very
high. Considering that the bank has very limited spread in India, and mostly in
merchant banking, both these reasons seem to be valid. This is evident from fairly high
amount of business per employee and profit per employee. On the other hand, the ratio
of wage bills to total expenses has increased in a slightly greater proportion, from 7.89
in 2005 to 19.92 in 2016. The mean of the ratio is 13.09, which is again significantly
lower compared to the average of all commercial banks. It is interesting to note that
both these ratios are lower compared to the nationalized banks like the SBI and BOI,
but higher than the Indian private sector banks like HDFC and ICICI. This implies that
a foreign bank like ABN AMRO may chose to spend more on the wage bill for its
offshore business activities compared to domestic private banks. Lower values of both
these ratios compared to the commercial banks in general also indicates that the
efficiency of the employees is much higher compared to an average employees in a
typical commercial bank. This points towards the soundness of internal business
processes of the bank.
www.ijcrt.org © 2017 IJCRT | Volume 5, Issue 3 July 2017 | ISSN: 2320-2882
IJCRT1033024 International Journal of Creative Research Thoughts (IJCRT) www.ijcrt.org 178
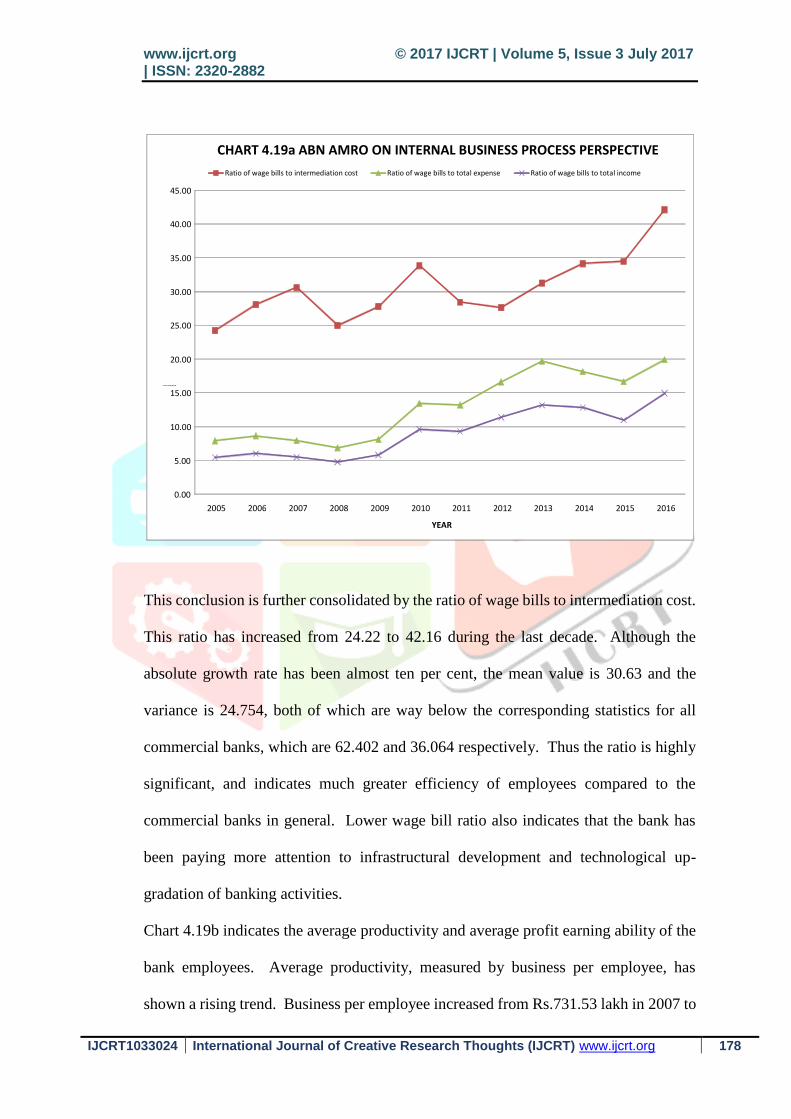
This conclusion is further consolidated by the ratio of wage bills to intermediation cost.
This ratio has increased from 24.22 to 42.16 during the last decade. Although the
absolute growth rate has been almost ten per cent, the mean value is 30.63 and the
variance is 24.754, both of which are way below the corresponding statistics for all
commercial banks, which are 62.402 and 36.064 respectively. Thus the ratio is highly
significant, and indicates much greater efficiency of employees compared to the
commercial banks in general. Lower wage bill ratio also indicates that the bank has
been paying more attention to infrastructural development and technological up-
gradation of banking activities.
Chart 4.19b indicates the average productivity and average profit earning ability of the
bank employees. Average productivity, measured by business per employee, has
shown a rising trend. Business per employee increased from Rs.731.53 lakh in 2007 to
0.00
5.00
10.00
15.00
20.00
25.00
30.00
35.00
40.00
45.00
2005 2006 2007 2008 2009 2010 2011 2012 2013 2014 2015 2016
RATIOS IN PERCENTA GE
YEAR
CHART 4.19a ABN AMRO ON INTERNAL BUSINESS PROCESS PERSPECTIVE
Ratio of wage bills to intermediation cost Ratio of wage bills to total expense Ratio of wage bills to total income
www.ijcrt.org © 2017 IJCRT | Volume 5, Issue 3 July 2017 | ISSN: 2320-2882
IJCRT1033024 International Journal of Creative Research Thoughts (IJCRT) www.ijcrt.org 179
Rs.1070.26 lakh in 2016, which is a 46 per cent growth in ten years. The mean value
is Rs.878.415 lakh, which is very high, compared to the aggregate of all commercial
banks, rendering the indicator very high level of significance. Even the variance is
quite low at 10111.338, the lowest among all the banks considered here as well as all
commercial banks in general, pointing towards the high capabilities of the employees
to generate high volume of business. In fact ABN AMRO employees have been able
to generate largest volume of business in India, as compared to the remaining four banks
included in the sample.
Profit per employee shows much greater volatility, as it decreased from Rs.17.55 lakh
in 2007 to Rs.3.80 lakh in 2009, and then increased to Rs.15.22 lakh in 2012, only to
decline again to Rs.8.15 lakh in 2014. It again settled down to 7.66 lakh in 2016. The
average profit per employee is 11.324 lakh, which is largest among all the banks
selected in this sample and significantly greater compared to all commercial banks
aggregate. The only area of concern is the high variance of 16.197, which is way above
the rest of variances measured for this indicator. If the bank wants to ensure sound
performance in future when it aims to expand its business in India, it needs to maintain
stable profit levels, since it is clear that the volatility is more due to fluctuations in the
profit levels rather than the increase in number of employees.
D. Learning & Growth Perspective:
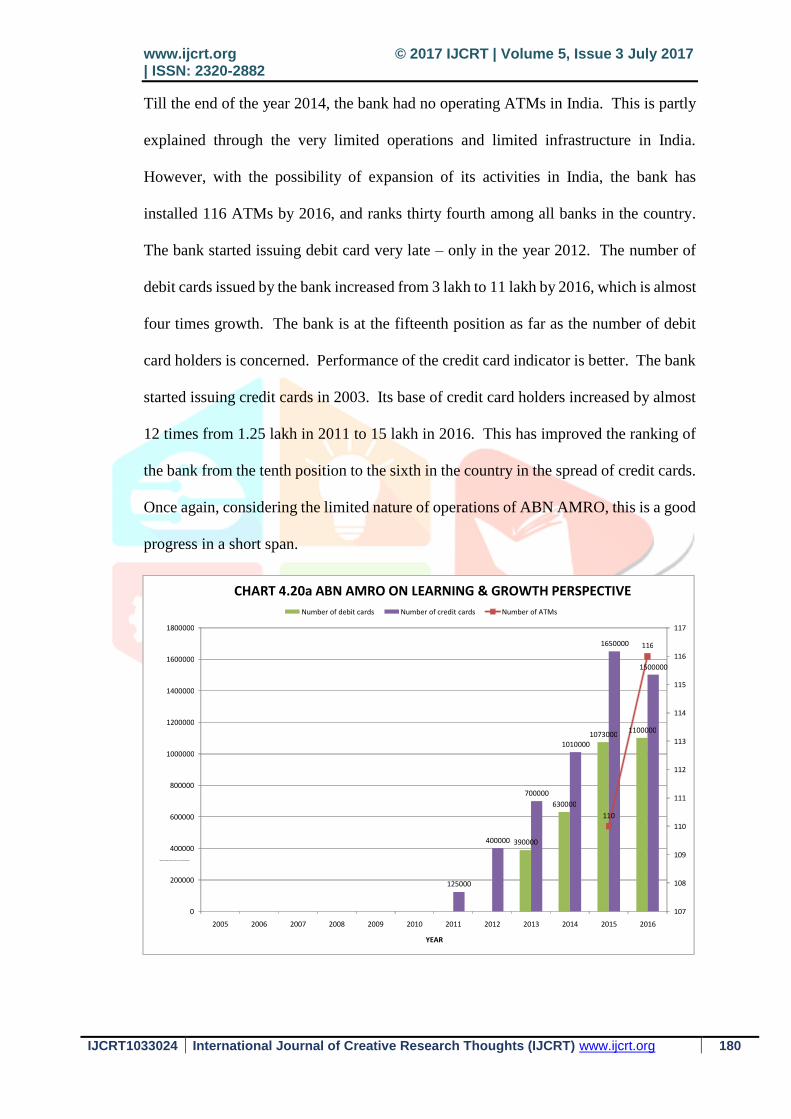
Chart 4.20a shows progress of the bank as far as adoption of modern methods of
monetary transactions is concerned. The chart reveals that the bank has been little slow
and a late starter in this field.
www.ijcrt.org © 2017 IJCRT | Volume 5, Issue 3 July 2017 | ISSN: 2320-2882
IJCRT1033024 International Journal of Creative Research Thoughts (IJCRT) www.ijcrt.org 180
Till the end of the year 2014, the bank had no operating ATMs in India. This is partly
explained through the very limited operations and limited infrastructure in India.
However, with the possibility of expansion of its activities in India, the bank has
installed 116 ATMs by 2016, and ranks thirty fourth among all banks in the country.
The bank started issuing debit card very late – only in the year 2012. The number of
debit cards issued by the bank increased from 3 lakh to 11 lakh by 2016, which is almost
four times growth. The bank is at the fifteenth position as far as the number of debit
card holders is concerned. Performance of the credit card indicator is better. The bank
started issuing credit cards in 2003. Its base of credit card holders increased by almost
12 times from 1.25 lakh in 2011 to 15 lakh in 2016. This has improved the ranking of
the bank from the tenth position to the sixth in the country in the spread of credit cards.
Once again, considering the limited nature of operations of ABN AMRO, this is a good
progress in a short span.
390000
630000
1073000 1100000
125000
400000
700000
1010000
1650000
1500000
110
116
107
108
109
110
111
112
113
114
115
116
117
0
200000
400000
600000
800000
1000000
1200000
1400000
1600000
1800000
2005 2006 2007 2008 2009 2010 2011 2012 2013 2014 2015 2016
BANK AUT OMAT ION AND BACK OFFICE INNOVATIONS
YEAR
CHART 4.20a ABN AMRO ON LEARNING & GROWTH PERSPECTIVE
Number of debit cards Number of credit cards Number of ATMs
www.ijcrt.org © 2017 IJCRT | Volume 5, Issue 3 July 2017 | ISSN: 2320-2882
IJCRT1033024 International Journal of Creative Research Thoughts (IJCRT) www.ijcrt.org 181
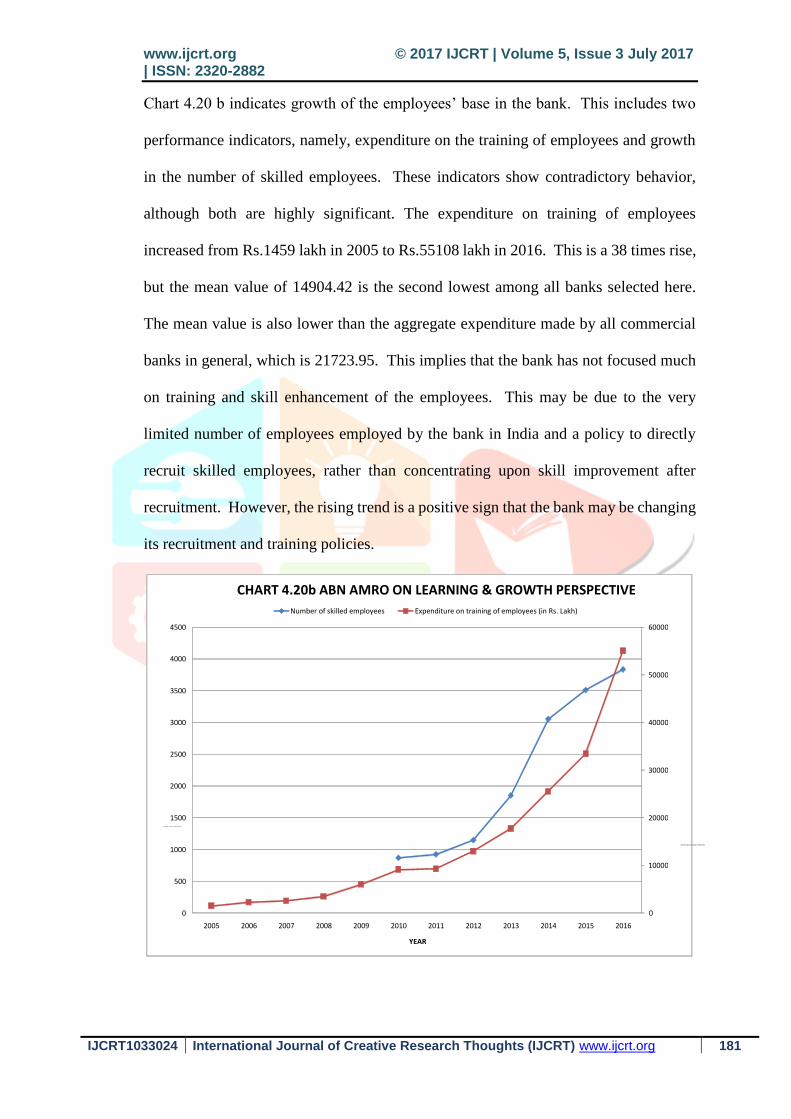
Chart 4.20 b indicates growth of the employees’ base in the bank. This includes two
performance indicators, namely, expenditure on the training of employees and growth
in the number of skilled employees. These indicators show contradictory behavior,
although both are highly significant. The expenditure on training of employees
increased from Rs.1459 lakh in 2005 to Rs.55108 lakh in 2016. This is a 38 times rise,
but the mean value of 14904.42 is the second lowest among all banks selected here.
The mean value is also lower than the aggregate expenditure made by all commercial
banks in general, which is 21723.95. This implies that the bank has not focused much
on training and skill enhancement of the employees. This may be due to the very
limited number of employees employed by the bank in India and a policy to directly
recruit skilled employees, rather than concentrating upon skill improvement after
recruitment. However, the rising trend is a positive sign that the bank may be changing
its recruitment and training policies.
0
10000
20000
30000
40000
50000
60000
0
500
1000
1500
2000
2500
3000
3500
4000
4500
2005 2006 2007 2008 2009 2010 2011 2012 2013 2014 2015 2016
EXPE NDIT URE ON TRAINING OF E MPLOYEES NUM BER OF SKILLED EM PLOYEES
YEAR
CHART 4.20b ABN AMRO ON LEARNING & GROWTH PERSPECTIVE
Number of skilled employees Expenditure on training of employees (in Rs. Lakh)

www.ijcrt.org © 2017 IJCRT | Volume 5, Issue 3 July 2017 | ISSN: 2320-2882
IJCRT1033024 International Journal of Creative Research Thoughts (IJCRT) www.ijcrt.org 182
The number of skilled employees of the bank offices in India increased from 868 in
2010 to 3832 in 2016. In absolute terms, this is the smallest number of highly skilled
employees among the five banks’ sample selected here. However, the growth rate in
skilled employees has shown much better performance as it increased from 6.45 per
cent in 2011 to 64.92 per cent in 2014, before declining to 9.24 with the mean value of
30.163. The mean growth rate of skilled employees is significantly greater than the
mean of all commercial banks. This clearly indicates that with the focus on expansion
of its offshore banking activities as mentioned in its objectives, the bank has indulged
into recruitment of highly skilled, specialized banking officials in India. This is bound
to help the bank in attaining its long term vision.
CONCLUSION:
Analysis of the Balanced Scorecard for ABN AMRO bank shows that constructing a
BSC performance system brings to the fore the strategic thinking of the banking
organization, and links the role and responsibilities of the people within it. This is
essential since financial performance alone does not give a clear picture of how the
bank has progressed. Including other performance indicators in the analysis brings a
refreshing change in the way tasks are performed as new policies and procedures are
developed and implemented in a bank. This leads to a conclusion that BSC is more
advanced and efficient tool for performance evaluation and strategic management in a
bank – be it a nationalized bank, a private bank or a foreign bank operating in the
country. A comparative analysis of the conventional performance indicators, which
mainly include financial indicators, on one hand and performance indicators included
in the BSC on the other, is needed to prove this point.
www.ijcrt.org © 2017 IJCRT | Volume 5, Issue 3 July 2017 | ISSN: 2320-2882
IJCRT1033024 International Journal of Creative Research Thoughts (IJCRT) www.ijcrt.org 183
REFERENCES:
1. Bhimani, Alnoor (ed.) (2005). Contemporary Issues in Management Accounting:
Oxford University Press.
2. Chang. H. and Pizzini, M. (2004). The balance scorecard: judgmental effects and
performance measures linked to strategy. Accounting Review, 79 (1): 1 – 23.
3. Gerdin, J. and Greve, J. (2004). Forms of Contingency Fit in Managerial
Accounting Research – a Critical Review. Accounting, Organizations and Society,
29 (3-4): 303–26.
4. Ghose, D. (2005). Alternative Measures of Managers’ Performance,
Controllability, and the Outcome Effect. Behavioral Research in Accounting, 17:
55–70.
5. Hoque, Z. and James W. (2000). Linking Balanced Scorecard Measures to size and
Market Factors Impact on Organizational Performance. Journal of Management
Accounting Research, 12: 1– 17.
6. Ittner, C., Larcker, D. and Randell, T. (2003). Performance implications of strategic
performance measurement in financial services firms. Accounting, Organizations
and Society, 28(7 – 9): 715 – 41.
7. Kaplan, R.S., Atkinson, A. (1998). Advanced Management Accounting 3ed.
Prentice Hall Inc, New Jersey.
8. Kaplan, R.S., Norton, D.P. (1992). The Balanced Scorecard – measures that drive
performance. Harvard Business Review: January-February, 71 – 79.
9. _______ (1996). The Balanced Scorecard: Translating Strategy into Action.
Boston: Harvard Business School Press.
10. _______ (2001a). Transforming the Balanced Scorecard from Performance
Measurement to Strategic Management: Part-I. Accounting Horizons: March, 87–
104
11. _______ (2001b). Leading change with the Balanced Scorecard. Financial
Executive Accounting & Tax Periodicals September: 64 – 66.