BACHELOR THESIS -...
75
BACHELOR THESIS Consumers’ Perception of CSR Within the Fashion Industry Carin Byström Sofie Mälstad 2013 Bachelor of Science in Business and Economics Business Administration Luleå University of Technology Department of Business Administration, Technology and Social Sciences
Transcript of BACHELOR THESIS -...

BACHELOR THESIS
Consumers’ Perception of CSR Within theFashion Industry
Carin ByströmSofie Mälstad
2013
Bachelor of Science in Business and EconomicsBusiness Administration
Luleå University of TechnologyDepartment of Business Administration, Technology and Social Sciences

Acknowledgement
This thesis has pushed us in ways we did not think possible. Not only has it been a
tremendous challenge but it has also emerged us into the world of academia. During
the last few weeks we ate, slept, dreamt and loved literature. For two months we have
rejected party invitations, days at the beach and festivities and truly isolated ourselves
from the world. Now that summer is here and we are done with our bachelor thesis it
is safe to say that we are relieved and happy of our freedom but also contemplate our
next chapter in life.
This thesis would not have been possible without our supervisor Maria Ek Styven.
Not only has she been patient with us, but also very helpful with her critique and
feedback. For these reasons, we would like to give her a big thank you. Another thank
you goes out to those who took the time to participate in our survey. One last thank is
directed to the huge support from our family and friends during this time.
Since, CSR is evolving each and every day and growing with intense speed it is
important to be aware of factors concerning consumer perceptions of CSR. We hope
this thesis will give the reader some insight into the differences among consumers in
Spain and Sweden.
Stockholm, May 2013
Sofie Mälstad & Carin Byström

Abstract
The purpose of this research was to measure and describe consumers’ willingness to
purchase clothing from fashion companies who are involved with CSR. Furthermore,
it aimed at describing customers’ perceived importance of each layer of CSR:
Economic, legal, ethical, and philanthropic. These were then compared in two
samples and also to each other. We chose two markets to test our proposed
hypotheses on, Sweden and Spain. We did this in the hope of identifying relationships
and differences among the two markets. We conducted this research using a
quantitative study, where we mainly used a descriptive approach to analyse our
collected data. A survey was sent out to university students in both Sweden and
Spain. Our means of reaching our sample was done via email, Facebook, and personal
interviews. Moreover, our collected data were mostly derived from university
students from our home university and students in Universitat de Valencia.
Thereafter, the collected data was analysed in order to test the proposed hypotheses
using a variety of t-tests.
The obtained results show as we hypothesized, Spanish consumers support socially
responsible companies to a larger extent than Swedish consumers. The other results
which were statistically significant revealed that Swedish consumers place more
importance to the economic dimension of CSR than to the philanthropic dimension.
Another one of our obtained results showed that Spanish consumers do not allocate
more importance to the legal dimension than Swedish consumers. Furthermore, we
also found that Swedish consumers place a larger importance to the legal dimension
of CSR than to the economic dimension. These findings were then discussed using
Hofstede’s cultural framework presented in chapter two. Finally, overall conclusions
and implications were done with a presentation of the limitations of this study.
Sammanfattning
Syftet med denna forskning var att mäta och förklara konsumenters villighet att köpa
kläder från samhällsansvariga modeföretag. Dessutom syftar studien till att beskriva
kundens upplevda betydelse av de fyra dimensionerna av CSR: ekonomiska,
juridiska, etiska och filantropiska. Dessa jämfördes sedan i två olika urval och även
mot varandra. Vi valde två marknader för att testa våra föreslagna hypoteser, Sverige
och Spanien. Vi gjorde detta i hopp om att identifiera samband och skillnader mellan
de två marknaderna. Vi genomförde forskning med hjälp av en kvantitativ studie där
vi främst använnde en deskriptiv metod för att analysera datan vi samlade in. Vi
skickade ut en enkät till studenter i både Sverige och Spanien. För att nå ut till så
många studenter som möjligt skickade vi ut enkäten genom email och Facebook men
använde oss även av personliga möten där vi stod utanför ett universitet i Spanien och
delade ut enkäten till studenter. Därefter analyserades den insamlade datan med hjälp
av två olika t-tester.
Det erhållna resultatet visade att spanska studenter stöder socialt ansvarstagande
företag i större utsträckning än svenska studenter. Resultatet visade även att Svenska
studenter lägger mer vikt vid den ekonomiska dimensionen av ett företags sociala
ansvar än vid den philantropiska dimensionen. Våra ytterligare resultat visade också
att Spanska studenter inte lägger större vikt vid den lagliga dimensionen än vad
Svenska studenter gör men att Svenska studenter lägger större vikt vid den lagliga
dimensionen än den ekonomiska dimensionen. Alla resultat är diskuterade utifrån
Hofstedes kulturdimensioner som är presenterade i kapitel två. I slutet av uppsatsen
har vi kommit fram till våra olika slutsatser samt begrännsningar.

Table of Contents ...................................................................................................................................................................................... 1 Consumers’ Perception of CSR Within the Fashion Industry ....................................................... 1 A study of Sweden and Spain ........................................................................................................................... 1 SOFIE MÄLSTAD CARIN BYSTRÖM ......................................................................................................... 1 Abstract ..................................................................................................................................................................... 3 Sammanfattning ................................................................................................................................................... 4
1 Introduction .............................................................................................................................. 1 1.1 Background ............................................................................................................................................ 1 1.2 Problem Discussion............................................................................................................................. 4 1.3 Purpose .................................................................................................................................................... 6 1.4 Demarcations ........................................................................................................................................ 7 1.5 Outline of Study .................................................................................................................................... 7
2 Review of Literature .............................................................................................................. 8 2.1 Consumer Responses to CSR ........................................................................................................... 8
2.1.1 Core factors ............................................................................................................................... 9 2.1.2 Central factors ...................................................................................................................... 10 2.1.3 Peripheral factors ................................................................................................................ 11
2.2 Cross-Cultural Differences in Consumers’ Perceptions of CSR...................................... 12 2.2.1 Maignan’s study ................................................................................................................... 12 2.2.2 Ramasamy & Yeung’s study ............................................................................................ 13
2.3 National Culture ................................................................................................................................ 15 2.3.1 Hofstede’s Framework ...................................................................................................... 15
2.4 Conceptual Framework .................................................................................................................. 17 2.4.1 Hypothesis Development ................................................................................................. 18
3 Methodology ...........................................................................................................................21 3.4 Purpose of Research ......................................................................................................................... 21 3.5 Research approach ........................................................................................................................... 22 3.6 Research Strategy ............................................................................................................................. 23 3.7 Data Collection ................................................................................................................................... 24
3.7.1 Data collection method ..................................................................................................... 25 3.7.2 Questionnaire Development ........................................................................................... 29
3.8 Sample Selection ................................................................................................................................ 29 3.9 Method of analysis ............................................................................................................................ 31
3.9.1 Statistics .................................................................................................................................. 32 3.9.2 Testing the Hypotheses .................................................................................................... 32
3.10 Reliability and Validity ................................................................................................................... 33
4 Empirical Data & Data Analysis .......................................................................................36 4.4 Empirical Data ................................................................................................................................... 36 4.5 Reliability of Measurements ......................................................................................................... 37 4.6 Hypothesis Testing ............................................................................................................................ 38
4.6.1 Support for CSR across borders .................................................................................... 38 4.6.2 Evaluation of CSR in each country................................................................................ 39 4.6.3 Comparison of CSR across countries ........................................................................... 40
5 Findings & Conclusions .......................................................................................................45 5.1 Conclusion ............................................................................................................................................. 45
5.1.1 General Reflections ............................................................................................................. 47

5.1 .............................................................................................................................................................................. 47 5.2 Implications for Theory .................................................................................................................. 47 5.3 Implications for Practitioners ..................................................................................................... 47 5.4 Implications for Future Research .............................................................................................. 49 5.5 Limitations ........................................................................................................................................... 49
References.........................................................................................................................................51
APPENDICES 1-3 APPENDIX 1 A-B: SURVEY QUESTIONS (ENGLISH AND SWEDISH) APPENDIX 2: ANSWERS OF QUESTION 1-5 APPENDIX 3: ANSWERS OF QUESTION 6-21

LISTS OF FIGURES AND TABLES List of figures
Figure 1 CSR Pyramid ………………………………………………..2
Figure 2 Outline of Study……………………………………………...7
Figure 3 Hofstede’s Framework………………………………………16
Figure 4 Hofstede's Framework Comparing Spain and Sweden……...17
Figure 5 Data Collection Methods……………………………………25
List of tables Table 1 Three Different Purposes of Research…………………...….21
Table 2 Advantage and Disadvantage with Surveys…....………........24
Table 3 Comparative Evaluation of Survey Methods………………..27
Table 4 Strengths and Weaknesses with Internet Interviews………...28
Table 5 Strengths and Weaknesses with Face-to-Face Interviews......29
Table 6 Cronbach Alpha……………………………………………..34
Table 7 Profile of respondents……………………………………….36
Table 8 Reliability (Cronbach Alpha)………………………………..37
Table 9 Means of results……………………………………………..38
Table 10 Two-Sample T-Teste question 1-5………………………….39
Table 11 Paird T-Test Spain…………………………………………..39
Table 12 Paird T-Test Sweden………………………………………...40
Table 13 Two-Sample T-Test question 6-21………………………….41
Table 14 Summary of study findings………………………………….42

1
1 Introduction
This chapter will provide background information for the thesis, where definitions
and terms used will be defined. Thereafter, a problem discussion of consumer
perception of CSR will be presented in order to introduce the reader to the problem
area. After the problem area has been introduced the purpose of the thesis will be
discussed. Moreover, the demarcations will be presented in this section with an
outline of the thesis.
1.1 Background
Corporate Social Responsibility (CSR) is a term with many different definitions. CSR
has evolved over the last years, yet the issue of how to define it has still not been
resolved. The concept CSR dates back to the 1950’s where Bowen (1953) defines
social responsibility of businessmen as “the obligations of businessmen to pursue
those policies, to make those decisions, or to follow those lines of action which are
desirable in terms of the objectives and values of our society” (1953, p.6). Moreover,
The European Commission (2001) defines CSR as “a concept whereby companies
integrate social and environmental concerns in their business operations and in their
interaction with their stakeholders on a voluntary basis” (2001, p. 3). Furthermore,
Carroll (1979), a well-known pioneer in the field defines CSR as “the social
responsibility of business encompasses the economic, legal, ethical, and discretionary
expectations that society has of organizations at a given point in time” (1979, p.500).
Carroll (1991) then went on to modify his definition and stated that “the total
corporate social responsibility of business entails the simultaneous fulfilment of the
firm's economic, legal, ethical and philanthropic responsibilities. Stated in more
pragmatic and managerial terms, the CSR firm should strive to make a profit, obey
the law, be ethical, and be a good corporate citizen” (1991, p. 3).
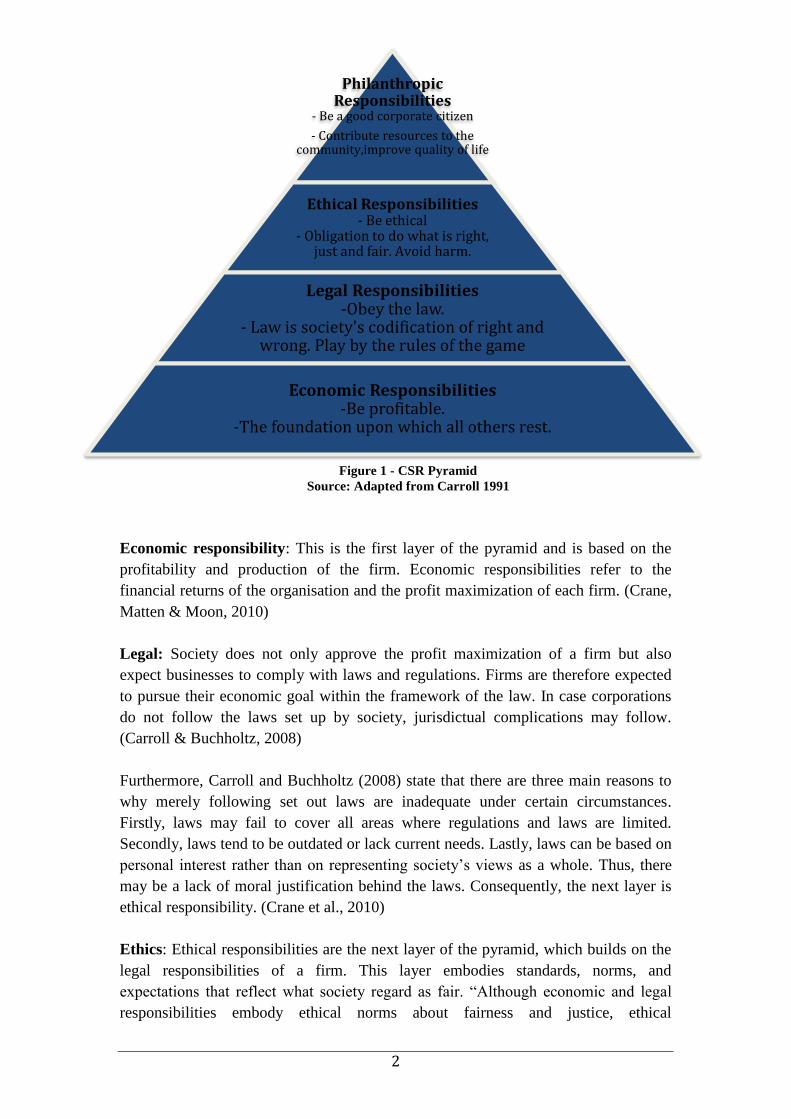
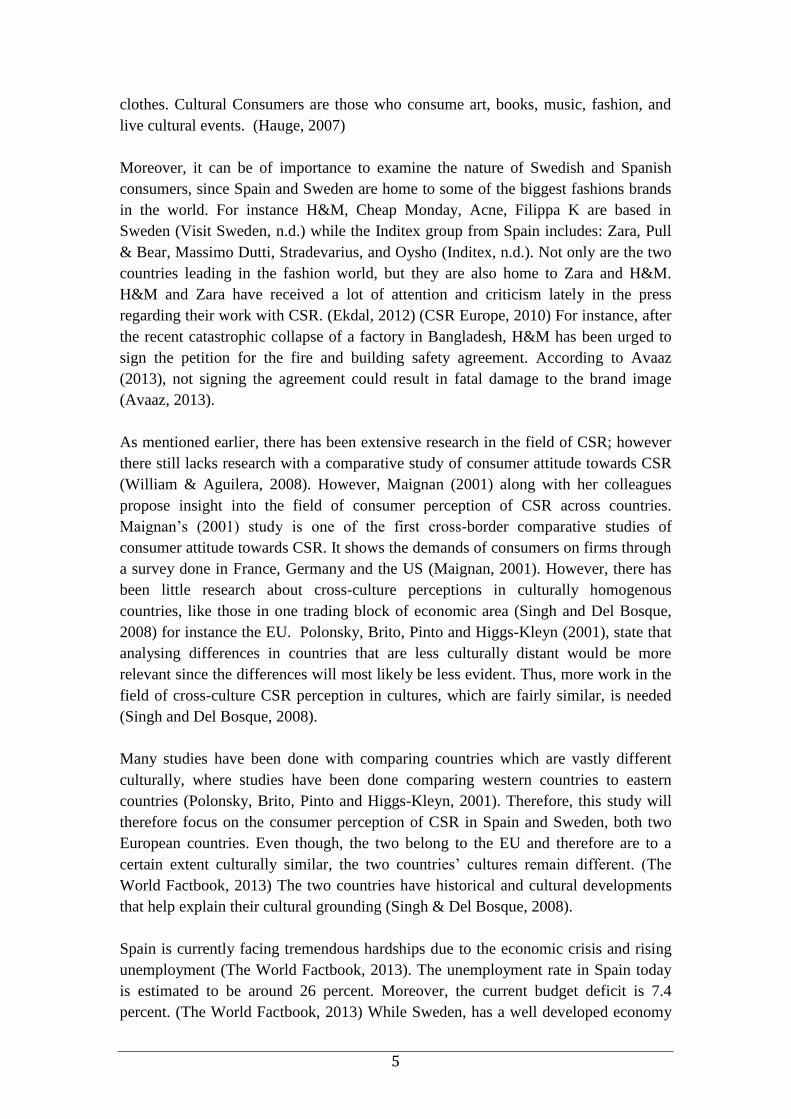
In marketing, many researchers base their effort on Carroll’s pyramid conception of
CSR (Arli & Lasmono, 2010). Carroll developed one of the most established and
accepted concepts of CSR in 1979. Carroll’s (1979) model states that there are four
layers of social responsibilities, which establish CSR as a whole: economic, legal,
ethical and philanthropic. These four factors are portrayed as a pyramid, which can be
seen below. The pyramid encompasses the entire range of responsibilities of a
business (Carroll, 1991).
2
Philanthropic Responsibilities
- Be a good corporate citizen
- Contribute resources to the community,improve quality of life
Ethical Responsibilities - Be ethical
- Obligation to do what is right, just and fair. Avoid harm.
Legal Responsibilities -Obey the law.
- Law is society's codification of right and wrong. Play by the rules of the game
Economic Responsibilities -Be profitable.
-The foundation upon which all others rest.
Economic responsibility: This is the first layer of the pyramid and is based on the
profitability and production of the firm. Economic responsibilities refer to the
financial returns of the organisation and the profit maximization of each firm. (Crane,
Matten & Moon, 2010)
Legal: Society does not only approve the profit maximization of a firm but also
expect businesses to comply with laws and regulations. Firms are therefore expected
to pursue their economic goal within the framework of the law. In case corporations
do not follow the laws set up by society, jurisdictual complications may follow.
(Carroll & Buchholtz, 2008)
Furthermore, Carroll and Buchholtz (2008) state that there are three main reasons to
why merely following set out laws are inadequate under certain circumstances.
Firstly, laws may fail to cover all areas where regulations and laws are limited.
Secondly, laws tend to be outdated or lack current needs. Lastly, laws can be based on
personal interest rather than on representing society’s views as a whole. Thus, there
may be a lack of moral justification behind the laws. Consequently, the next layer is
ethical responsibility. (Crane et al., 2010)
Ethics: Ethical responsibilities are the next layer of the pyramid, which builds on the
legal responsibilities of a firm. This layer embodies standards, norms, and
expectations that reflect what society regard as fair. “Although economic and legal
responsibilities embody ethical norms about fairness and justice, ethical
Figure 1 - CSR Pyramid
Source: Adapted from Carroll 1991
3
responsibilities embrace those activities and practices that are expected or prohibited
by societal members even though they are not codified into law” (Carroll, 1991. p.41).
Ethical responsibilities can also be described as the responsibilities of corporations to
do what is right, just, and fair even though they are not required by law to do so
(Crane et al., 2010).
Philanthropic: Philanthropic responsibilities include corporate actions based on
society’s expectations that businesses should be good corporate citizens. Examples
include programs promoting human welfare and goodwill. (Carroll, 1991)
Philanthropic responsibilities are voluntary and discretionary responsibilities, and are
done through a corporations desire to endorse social welfare rather than succumb to
society’s expectations. (Carroll, 1991) Further, Crane et al (2010) describe
philanthropic responsibilities as the “discretion to improve the quality of life of
employees, local communities, and ultimately society in general” (2010, p. 54).
The model is shaped like a pyramid in order to present the layering of each level. It
suggests that each consecutive layer is necessary in order to be fully socially
responsible, which is when all four layers are met. The first two layers are said to be
required by society while the following two concerning ethical and philanthropic
responsibilities are desired and expected by society. (Crane et al., 2010)
There are three reasons why ethical behaviour among businesses has gained
prominence over the years. First, as consumers’ level of income increases companies
must differentiate their goods in every way that they can. Further, CSR can be used to
boost the image of a company. In addition, due to globalisation issues, where
companies expand worldwide and increase in size results in more influence and a
greater responsibility expected from each globalised company. Lastly, the rising of
information technology along with countries moving towards democracy has led a
more transparent view of companies and thus consumers can more easily criticise the
work of companies. (Ramasamy &Yeung, 2009)
Nowadays, consumers’ perception of CSR has become an important factor to study.
There has been an increase in attention from managers and researchers in the area of
consumer perception of CSR (Arli & Lasmono, 2010), with an increasing number of
articles dedicated to the field (Ramasamy & Yeung, 2009). Studies have also been
conducted in the hope of investigating how CSR can help market products to
consumers (Maignan, 2001). Yet, most of the studies in the field have been done in
the USA; therefore it is essential for businesses to understand how CSR is perceived
across nations due to its international scope (Maignan, 2001). In addition, research
suggests that there is a positive relationship between a company’s CSR activity and
consumer reaction to the activity adding to the importance of CSR (Smith, 2003).
Additionally, CSR has become a way for brands to differentiate themselves on the
market (Maignan, Ferrell O. C., & Ferrell, L, 2005). Good work with CSR could

4
result in a favourable image that positively influences consumer’s evaluation of the
firm. (Loureiro, Sardinha & Reijnders, 2012) Research has also shown that even
though consumers are willing to support socially responsible companies there still
lacks knowledge of the characteristics which are perceived by the consumers as
significant of social responsibility (Maignan, 2001). Moreover, since mass
consumption prevails in Western societies, factors such as: fair trade, responsible
consumption, recycled products and sustainable development have risen in
importance for purchasing decisions (Goig, 2007). One must also keep in mind that
studies indicate that consumers do not have the same preferences and needs across
nations, thus sensitivity to local consumer needs is vital (Hyllegard, Eckman,
Descales & Borja, 2005). Since CSR has become a worldwide phenomenon with an
increase of importance, it is crucial for companies to know how CSR is perceived
across national borders (Maignan, 2001).
1.2 Problem Discussion
Evidently, the world is becoming more and more globalised each day resulting in
greater heterogeneity of consumers (Blodgett, Bakir & Rose, 2008). Globalisation on
the other hand does not only change the aspect of the world but also our way of
perceiving it (Goig, 2007). These differences can for the most part be explained by
the differences across national cultures. Consequently, various dimensions of culture
can be used to explain the differences in consumer perception. (Blodgett et al., 2008)
Several businesses across a multitude of industries integrate CSR into their business
model, including the fashion industry. The fashion industry is described as one with a
high degree of globalisation, where much of its business is done through outsourcing.
Work done in a globalised company must take into account certain rules and
standards in each respective country. Thus, questions regarding CSR are crucial in the
fashion industry. (Laudal, 2010) Even though the fashion industry has made
tremendous steps towards being a socially responsible industry, CSR catastrophes still
prevail (Ellis & Friedman, 2012). For example, H&M (Ekdal, 2012) and Zara, two of
the largest fashion brands in the world have been accused for abusing its outsourcing
position (Burgen & Phillips, 2011) Moreover, Johanna Hofring a Swedish specialist
in eco-garments states:
“When I found out what goes on in the clothing production cycle, I started to move
away from it. Live animals are subjected to chemical baths to soften their wool and
clean it. When their fibers are spun and woven into fabric, textile mills vent pollution
into the air and pump poisons into the water table. The textiles get sent to Third-
World sweatshops where workers endure human rights violations.” (Cited from
Bradley Quinn, 2007)
Fashion is one of the industries, which is often labelled as a “cultural industry”. When
examining different countries, Swedish consumers are cultural consumers who tend to
be dedicated to following trends, who are willing to spend both time and money on
5
clothes. Cultural Consumers are those who consume art, books, music, fashion, and
live cultural events. (Hauge, 2007)
Moreover, it can be of importance to examine the nature of Swedish and Spanish
consumers, since Spain and Sweden are home to some of the biggest fashions brands
in the world. For instance H&M, Cheap Monday, Acne, Filippa K are based in
Sweden (Visit Sweden, n.d.) while the Inditex group from Spain includes: Zara, Pull
& Bear, Massimo Dutti, Stradevarius, and Oysho (Inditex, n.d.). Not only are the two
countries leading in the fashion world, but they are also home to Zara and H&M.
H&M and Zara have received a lot of attention and criticism lately in the press
regarding their work with CSR. (Ekdal, 2012) (CSR Europe, 2010) For instance, after
the recent catastrophic collapse of a factory in Bangladesh, H&M has been urged to
sign the petition for the fire and building safety agreement. According to Avaaz
(2013), not signing the agreement could result in fatal damage to the brand image
(Avaaz, 2013).
As mentioned earlier, there has been extensive research in the field of CSR; however
there still lacks research with a comparative study of consumer attitude towards CSR
(William & Aguilera, 2008). However, Maignan (2001) along with her colleagues
propose insight into the field of consumer perception of CSR across countries.
Maignan’s (2001) study is one of the first cross-border comparative studies of
consumer attitude towards CSR. It shows the demands of consumers on firms through
a survey done in France, Germany and the US (Maignan, 2001). However, there has
been little research about cross-culture perceptions in culturally homogenous
countries, like those in one trading block of economic area (Singh and Del Bosque,
2008) for instance the EU. Polonsky, Brito, Pinto and Higgs-Kleyn (2001), state that
analysing differences in countries that are less culturally distant would be more
relevant since the differences will most likely be less evident. Thus, more work in the
field of cross-culture CSR perception in cultures, which are fairly similar, is needed
(Singh and Del Bosque, 2008).
Many studies have been done with comparing countries which are vastly different
culturally, where studies have been done comparing western countries to eastern
countries (Polonsky, Brito, Pinto and Higgs-Kleyn, 2001). Therefore, this study will
therefore focus on the consumer perception of CSR in Spain and Sweden, both two
European countries. Even though, the two belong to the EU and therefore are to a
certain extent culturally similar, the two countries’ cultures remain different. (The
World Factbook, 2013) The two countries have historical and cultural developments
that help explain their cultural grounding (Singh & Del Bosque, 2008).
Spain is currently facing tremendous hardships due to the economic crisis and rising
unemployment (The World Factbook, 2013). The unemployment rate in Spain today
is estimated to be around 26 percent. Moreover, the current budget deficit is 7.4
percent. (The World Factbook, 2013) While Sweden, has a well developed economy

6
with a high standard of living. Comparitively, Sweden has an unemployment rate of
7.5 percent and a budget deficit of a mere 0.3 percent. (The World Factbook, 2013)
Moreover, Spain has a long way to go when it comes to the degree of public
awareness of CSR. However, CSR is present in the vision, mission and strategy in
most of the large companies in Spain, where almost 80% of them have policies in the
area of CSR. It is estimated that around 48% of Spanish consumers could identify the
term CSR. Furthermore, one of the main challenges of CSR is to generate greater
consumer awareness. Comparatively, in Sweden public awareness of CSR is
constantly growing. University courses on CSR and heavy media coverage are
responsible for the awareness of CSR in Sweden. Moreover, some of the main
challenges of CSR in Sweden include climate change, demographic change and
integration into the labour market. In general, Sweden is said to be ahead of Spain
regarding work with CSR, as Spain was late in this area. (CSR Europe, 2010)
As mentioned earlier, there have been a number of studies that has established a link
between CSR and corporate brand performance. For decades, the relationship
between businesses and CSR has been discussed in the context of CSR (Carroll,
1979) and stakeholder’s theory (Freeman, 1984). However, not much is known of
how consumer perception of CSR influences the purchasing decisions (Singh & Del
Bosque, 2008). Since, consumers are one of the most important stakeholders for a
company when dealing with issues regarding CSR, the pressure and need for being a
socially responsible company is crucial. Marketers believe that corporate social
performance information forms consumer intentions. (Brown & Dacin, 1997; Creyer
& Ross, 1997) Thus, this paper will analyse and compare consumer perception of
CSR in Spain and Sweden in the fashion industry.
1.3 Purpose
The purpose of this thesis is:
- To describe consumers’ willingness to purchase clothes from socially
responsible brands in both Sweden and Spain.
- To describe costumers’ perceived importance of each layer of responsibility
presented by Carroll (1991), in both Sweden and Spain.
- To describe the differences between Swedish and Spanish consumer
perception of CSR.
The term socially responsible used refers to those companies who follow the four
dimensions: economic, legal, ethical, philanthropic responsibilities (Carroll, 1979).
Further, a company should encompass all four components in order to be considered
socially responsible (Carroll, 1979).

7
Introduction
Review of Literature
Methodology
Emperical Data & Data Analysis
Findings & Conclusions
1.4 Demarcations
In order to narrow down the scope of our study we have chosen to focus our research
on the fashion industry. With the fashion industry we specifically mean, the apparel
industry. This has been done because of the frequent issues brought up in media
discussing fashion brands social responsibility and the scope of globalisation within
this industry. We will also use Carroll’s definition of CSR as our main definition of
CSR. Moreover, we will focus our study towards two countries, Sweden and Spain.
These countries have been chosen since they are home to some of the most successful
fashion labels in the world. In addition, the economic situation in these countries can
be interesting to explore as a possible explanation of consumer perception. Besides,
there is also a lack of research of consumer perception of CSR in countries that are
somewhat culturally similar. Consequently, the study will focus on consumer
perception of CSR in the fashion industry in Sweden and Spain.
1.5 Outline of Study
The thesis consists of 5 chapters, shown in Figure 2 below. The first chapter is the
introduction with a background to the subject along with a problem discussion. The
next chapter will present relevant theories from previous research in order to answer
our purpose and to help build the hypotheses. Theories presented will include: CSR
and how CSR connects to consumer perception, as well as Hofstede’s
framework. How the research was conducted will be presented in the third chapter,
Methodology. Chapter four will provide the collected data, where presented theories
will be evaluated towards the data. This chapter will also include the analysis of the
data where the hypotheses will be tested and analysed. Lastly, Chapter five will
consists of our findings and conclusions. Identified implications will also be presented
in this chapter.
Figure 2 - Chapter Structure

8
2 Review of Literature
This chapter aims at presenting previous research in the field of CSR and how it
connects to consumer perception. Relevant theories related to our purpose will also
be discussed. First, theories regarding consumer response to CSR will be explained.
Thereafter, Maignan´s research in the field will be explored along with Ramasamy
and Yeung’s research. Next, a presentation of Hofstede´s cultural dimensions will be
introduced and used in the conceptual framework in order to create the hypothese
relevant for the purpose of this thesis.
2.1 Consumer Responses to CSR
During the last 10 years, CSR has been a highly debated issue with an increasing
amount of research. Much of the research in the field has focused in on the area of
investigating how corporate social responsibility can benefit the reputation of a
business as well as its products to consumers. The first researchers to do this were
Robin and Reidenbach in 1988 together with Varadarajan and Menon in 1988.
Thereafter, research increased tremendously. Though, there is very little research on
the extent to which consumers are willing to support socially responsible
organizations and to what extent consumers are willing to punish unreliable business.
However, an academic inquiry has been made by Brown and Dacin (1997) where they
showed that bad work with CSR in a business is associated with a negative perception
while, good CSR work in a business is associated with a positive perception. Other
researchers within experimental studies were Handelman and Arnold (1999), who
suggest that marketing actions directed towards social dimensions generate consumer
support. Smith (1996) did an industry survey where he provided evidence that
consumers where more willing to buy from an organization that was engaged in
corporate social responsibility. He also found that 88 percent of U.S consumers
support organizations with good CSR; this study only considered corporate social
responsibility in general and did not take into account consumer perspectives. (Smith,
1996)
On the other hand, Pomering and Dolnicar (2009), state that companies engaged in
CSR will always result in positive outcomes. Research also indicates that CSR only
has a positive effect on consumer’s purchasing intentions if the consumer is
concerned over questions regarding CSR (Sen & Bhattacharya, 2001). Moreover,
consumers tend to not change their attitude or behaviour when a company at a later
stage implements positive work with CSR. Also, it has been found that irresponsible
behaviour will have a greater impact on consumers than responsible corporate
behaviour will. Furthermore, there must also be a so-called “good fit” between the
business and the company’s CSR activity. (Sen, Bhattacharya & Korschun, 2006)
Moreover, it is said that consumers may not boycott products coming from a brand
9
with a bad reputation regarding their work with CSR but instead expect a lower price
for the products. (Creyer & Ross, 1997)
Likewise, consumer purchase intentions can be influenced by CSR either in a direct
or indirect way. The indirect effect is when purchasing intentions from a corporate
context are created, in other words when the consumer is aware of the company’s
work with CSR. A company’s work with CSR can also directly influence the
purchasing decisions of consumers. (Öberseder, Schlegelmilch & Gruber, 2011)
Moreover, consumers who tend to have a more positive response to CSR have been
found to take more responsible purchasing decisions (Mohr and Webb, 2005).
Intristingly, consumer’s response towards CSR can be defined by explaining the
different consumer specific factors. Consumer specific factors can be divided into
three factors. The first factor is the core factor, where consumer awareness,
information and personal concerns are explained. The second factor is described as
the central factor representing consumer price perception. Lastly, the third factor is
the peripheral factor, which includes the image of the company as well as the
influence of peer groups. (Öberseder et al., 2011)
Obviously, CSR alone will not trigger a purchasing decision; however there are
several determinants, which will increase the likelihood of taking CSR into
consideration during purchasing decisions. These determinants are dispersed among
the differences between the core, central and peripheral factors. Core factors include
information and personal concern, which determine whether CSR is taken into
account during a purchase transaction. The central factor is the consumer perception
of the financial situation of a buyer. Finally, consumer perception of the credibility of
CSR, the image of the company, and the influence of peer groups are the peripheral
factors. Below we will discuss the three factors further. (Öberseder et al., 2011)
2.1.1 Core factors
Core factors help determine whether CSR is taken into account during purchasing
decisions; these include awareness, information, and personal concerns. In most
cases, if consumers meet these factors, CSR will not play a role in the purchasing
decisions. (Öberseder et al., 2011)
Awareness: According to Pomering and Dolnicar (2009), CSR will affect consumers’
purchasing behaviour if the consumer is aware of the company’s work with CSR.
However, several studies show that consumer’s awareness of CSR in an organization
is very low (Boulstridge & Carrigan, 2000; Carrigan & Attalla, 2001; Du,
Bhattacharya & Sen 2007; Sen et al., 2006). The low awareness of CSR can cause
problems for companies to generate revenue based on its CSR activities (Du,
Bhattacharya & Sen, 2010). There are also studies that indicate that information
regarding a company’s CSR may not necessarily lead to increasing sustainable
responsibility when buying a product or service (Boulstridge & Carrigan, 2000;

10
Carrigan & Attalla, 2001). Moreover, an overwhelming amount of information
regarding the work with CSR in a company can have a negative impact on the
consumer perception of the company. On the other hand, more approachable
information about CSR can be a reason for consumers to purchase products from that
company. (Carrigan & Attalla 2001) In 2006, Sen et al. conducted a study suggesting
that there is a relationship between purchasing decisions and the awareness of
CSR.
Information: Information is the most important and complex factor of a company’s
CSR position. Previous research brings attention to the fact that information is
necessary for consumers when considering ethical features of a product. (e.g., Bray,
Johns & Kilburn, 2011; Devinney, Auger, Eckhardt & Birtchnell, 2006). There are
two dimensions of information: the level of information and the type of information.
The level of information describes the extent of knowledge consumer have about a
company’s work with CSR, while the type of information focuses on the positive or
negative impact of information regarding CSR. (Öberseder et al., 2011) The following
two statements illustrate how the type of information shapes consumers’ perceptions:
“Zotter chocolate is expensive, but also really delicious, and it is a fair trade product.
I also know that the company is looking after the employees; and the employees have
their own cook, and they can also bring their children and other family members to
eat with them, also as relief for the women working there (female, 22).” (Öberseder et
al., 2011. p. 453)
“This problematic nature is, of course, well-known, and you heard often about child
labor at Nike, Adidas, and Puma and all of these manufacturers of sports equipment.
It is a constantly-recurring issue there (male, 23).” (Öberseder et al., 2011. P. 453)
Personal Concern: According to Du et al., 2010, people evaluate themselves and
others differently. By looking at a person´s social value orientation a connection to
CSR can be made. There are three individual social value orientations; the first one is
called pro-social (cares about other people as much as they care about themselves).
The second one is called individualistic (people care about themselves more than they
care about others) and the last one is called competitive (that person is in the centre,
takes advantage of others). A consumer that is a pro-socialist, most likely supports
CSR to a higher degree than other consumers. (ibid)
2.1.2 Central factors
Öberseder et al., (2011) define the central factors as “the consumer respondents
perceive the financial situation of a buyer as a central factor that determines the
assessment of CSR as a purchase criterion” (2011, p. 455).
Consumers price perception: Öberseder et al., (2011) argue that in order for
consumers to consider CSR as a purchase criterion the two core factors as well as the
central factors have to be met. Previous research suggest that consumer’s purchasing
11
decisions are based on companies social engagement (Creyer & Ross, 1997), while
other indicated that they are based on price, quality, convenience and brand
(Bouldstrige & Carrigan 2000; Carrigan & Attalla, 2001). However, Öberseder et al.,
(2011) discovered that price was a very important criterion, where the financial
situation of the consumer is of huge relevance during purchasing decisions. In other
words, sufficient financial resources are a requirement during a purchase decision.
(ibid)
In addition, consumers seem to assume that products from a socially responsible
company are more expensive, thus price is only a justification for not considering
socially responsible companies. Consumers tend to be willing to purchase products
from a socially responsible company as long as they are not more expensive than
“regular” products. Problematically, consumers tend to make wrong assumptions
believing they are not able to afford products from socially responsible companies.
However, there are a vast number of products from socially responsible companies,
which are not more expensive. On the other hand, there are companies that include
their work with CSR into the price, such as fair trade products. Consequently, there
are consumers who are not able to buy these products due to the increase in price. In
most cases, if there was only a slight alteration in price, consumer would prefer to
purchase the product from a socially responsible company. (Öberseder et al., 2011)
The respondents of the study also state that the assessment of the core and central
factors is more complex than for example, brand familiarity. This helps to explain the
minor importance of CSR as a criterion during a purchase decision. Since, the core,
central and peripheral factors follow a hierarchical structure the central factors will
not matter as long as the core factors are not met. However, when all the core and
central factors are met, CSR comes into account in the purchase decision-making.
(Öberseder et al., 2011)
2.1.3 Peripheral factors
Consumers’ perceptions of the credibility of CSR, the image of the company, as well
as the influence of peer groups are the peripheral factors, which can have an impact
on CSR as a purchase criterion. Peripheral factors alone are not able to trigger CSR as
a criterion in the decision making process. When all core and central factors are met
the three peripheral factors must also be met in order to consider CSR. These three
factors will be discussed separately below. (Öberseder et al., 2011)
The credibility of CSR initiatives is influenced by the company’s CSR initiatives and
its core business. Consumers tend to consider a CSR initiative credible only if it is
aligned with the company’s core business. If the CSR initiative has nothing to do with
the business it can be perceived as a marketing trick. Secondly, the image is another
factor, which influences the impact on CSR as purchase criterion. A positive
perception of a company’s image suggests that the company is socially responsible.
This in turn can increase the likelihood for consumers to choose a company’s product
12
and thus support its CSR efforts. Finally, the last peripheral factor is the influence of
peer groups. A company’s image is closely related to this, where a company’s image
is often developed through the interaction with friends and family. Peer groups may
even directly influence consumers in either a dissuading or encouraging manner. Peer
groups can therefore lead to the refrain or support for buying products from a specific
company. (Öberseder et al., 2011)
2.2 Cross-Cultural Differences in Consumers’ Perceptions of CSR
Other studies regarding consumers’ perception of CSR have been made, Maignan
(2001) and Maignan and Ferrell (2003) suggest through their research that cultural
aspects could change the way people perceive CSR. As mentioned earlier, Maignan
(2001) studied how French and German consumers compared with U.S consumers
perceive CSR, where they found that both German and French consumers were more
willing to support CSR in an organization compared with the U.S consumers. (ibid)
Ramasamy and Yeung (2009) researched within this area as well, where they
conducted a study based on Maignan´s (2001) study. However, they compared
consumers’ perception in Shanghai and Hongkong instead.
2.2.1 Maignan’s study
Maignan´s study aimed at investigating if there were any differences between
consumers’ willingness to support socially responsible business as well as examining
the respondent’s evaluation of economic, legal, ethical and philanthropic obligations
of an organisation. Maignan based her study on Carroll´s (1979) pyramid. She divided
the study into different parts for each group of hypotheses. Firstly, she estimated
which consumers that were prepared to support socially responsible companies to a
larger extent than the other sample. The next step in the study was to examine how
consumers in German, France and the U.S.A. evaluate economic, legal, ethical and
philanthropic obligations of an organization. (Maignan, 2001) Lastly, Maignan (2001)
discussed the difference in consumers’ evaluation between the three countries. She
based her hypotheses on the cultural grounding of the three countries.
As a means of a testing her hypothesis she constructed a survey measuring managers’
evaluation of Carroll's Pyramid. Maignan´s study was based on a scale that was
developed by Maignan and Ferrell in 2000, where the questions were constructed in
order to answer organization´s commitment in the U.S.A. and France to corporate
social citizenship. Maignan’s (2001) survey started with 5 questions about the
willingness of consumers to support socially responsible companies. The respondents
had to rate the statements on a seven-point scale (from strongly disagree to strongly
agree). Maignan (2001) developed the following five questions: “(1) I would pay
more to buy products from a socially responsible company; (2) I consider the ethical
reputation of businesses when I shop; (3) I avoid buying products from companies
that have engaged in immoral actions; (4) I would pay more to buy the products of a
company that shows caring for the well-being of our society; (5) If the price and

13
quality of two products are the same, I would buy from the firm that has a socially
responsible reputation” (2001, p. 62.). The second section of the survey was
developed in order to measure consumers evaluation of Carroll’s (1979) pyramid,
where respondents had to rate the following statement: “I believe that businesses must
. . .” (Maignan, 2001. p. 63) based on a seven point scale (from strongly disagree to
strongly agree) (ibid). She developed 16 questions, four for each responsibility in
Carroll’s pyramid. Demographic questions were also included in the survey to be able
to segment the respondents. (ibid) A professional translator translated Maignan’s
(2001) survey into German and French and thereafter translated the survey back into
English. When sending out the survey, Maignan had contacted persons in all levels of
an organization. The contact person then passed 200 surveys around to as many
departments as possible. 169 French, 94 German and 145 U.S. surveys were returned.
(ibid)
According to Maignan (2001), her finding shows that there is a potential gain from
positioning the corporation as socially responsible. The French and German market
proved to be more likely to support socially responsible companies when they shop.
Nevertheless, consumers in all countries were willing to support companies engaged
in CSR. Thus, her findings show that CSR is an important instrument for companies
to market. However, she emphasised the need to better understand how consumers in
different countries define CSR activities. (ibid)
The study showed that all three countries could distinguish all the four dimensions of
CSR. Interestingly, the philanthropic responsibilities were not significantly associated
to the other responsibilities in France, which challenge the conceptualisation done by
Maignan, Ferrell and Hult in 1999. Therefore, managers and consumers have different
definitions of CSR. The study questions the economic responsibilities to the other
responsibilities. Generally, Maignan (2001) study disputed Carroll´s (1979) layers of
CSR to consumers. Both the French and the German market rated the economic
responsibilities as the least important factor of CSR. However, consumers in the US
rated economic and legal responsibilities as the foremost responsibilities of a firm,
further questioning Carroll´s pyramid. Moreover, Germany and France rated legal and
ethical responsibilities as the most important reflecting the communitarian norms of
the national ideologies. Overall, a constant communication of CSR across borders will
be difficult due to the differences in consumer perception across the nations.
(Maignan, 2001)
2.2.2 Ramasamy & Yeung’s study
In 2009, Ramasamy and Yeung conducted a study based on Maignan (2001) in
Shanghai and Hong Kong. The two researchers wanted to provide insight into the
following questions: “(1) To what extent are Chinese consumers willing to support
firms that are socially responsible in their purchasing decisions? (2) How, why and to
what extent are there variations in this support among the Chinese compared to their
Western counterparts? (3) Are Chinese consumers able to differentiate between the

14
various responsibilities of businesses as laid out by Carrol (1979)? In particular, are
the underlying factors/measures of CSR found in Western countries, i.e. economic,
legal, ethical and philanthropic responsibilities apply to Chinese consumers? (4) How
and why does the relative importance among these factors in China differ from the
Western context?” (Ramasamy & Yeung, 2009, p. 120)
Ramasamy and Yeung (2009) go on to describe that the degree of economic and
social development can help explain consumers’ perception of CSR. “The level of
economic development influences the extent of CSR awareness and the degree to
which consumers demand for CSR from firms.” (ibid, p. 122) It is believed that
consumers in developing countries that have lower income underestimate their role in
the market, thus failing to recognise CSR. Moreover, Kemp’s (2001) study indicates
that in developing countries consumers tend to emphasize the economic responsibility
of businesses since this will secure jobs and income. Accordingly, in developing
nations there is a tendency to rely on governments to exert pressures towards
businesses for being socially responsible rather than consumer pressure. (Ramasamy
& Yeung, 2009)
Ramasamy and Yeung (2009) state that the institutional development of a country can
effect consumer expectations businesses in a society. In developing nations rule of
law may be ambiguous and consumer may therefore expect business to voluntarily
adhere to rules. However, arguments also show that consumers may realize that
corrupt practices are a way of life in these nations and therefore are more forgiving to
business role in society. (ibid)
In the research regarding consumers’ perception of CSR, Ramasamy and Yeung
(2009) relied heavily on Maignan’s (2001) survey in order to answer their research
questions. Their research suggests that CSR is important among Chinese customer,
where the collectivism of the Chinese culture reflects on their support for CSR.
Moreover, findings also show that the support of CSR is not dependent on the
economic development of a country. Furthermore, their findings show that Chinese
consumers were able to differentiate between Carroll’s (1979) four dimensions.
However, respondents from Shanghai do not consider economic responsibilities as a
social responsibility of a company. Moreover, the economic responsibility was the
most important to Chinese consumers. Contrary to Maigan’s (2001) theory where it
was believed that the more individualistic cultures place more importance to the
economic responsibilities. There were however, huge differences between the two
cities, which indicate that multinationals need to adapt their CSR strategy to local
needs. (Ramasamy & Yeung, 2009)
15
2.3 National Culture
Lodge (1990) suggests that the underlying ideology of a country encourages firms to
adapt strategies linked to that ideology. Moreover, consumer perception of CSR can
be expected to reflect the country´s ideology (ibid). On the other hand, Hofstede
considers the values of a culture which in hand is linked to the values held by
individuals (Maignan, 2001). Culture is said to be one of the most important
variables, which influence ethical decision making (Rawwas, 2001; Rawwas, Ziad &
Mine, 2005). Correspondingly, consumer ethics vary from nation to nation due to
different patterns of behaviour (Babakus, Cornwell, Mitchell & Schlegelmilch, 1994)
concepts, norms, and values (Rawwas et al., 2005).
Hofstede’s framework has been used widely to compare cultures and it is the most
used national cultural framework in marketing studies. Therefore, it is useful in
comparative cross-culture studies. (Soares, Farhangmehr & Shoham, 2007) Both
Maignan (2001) and Ramasamy and Yeung (2009) used Hofstede’s cultural
framework to develop the hypotheses, which they aimed to test. Thus, a description of
Hofstede’s cultural framework will be presented below.
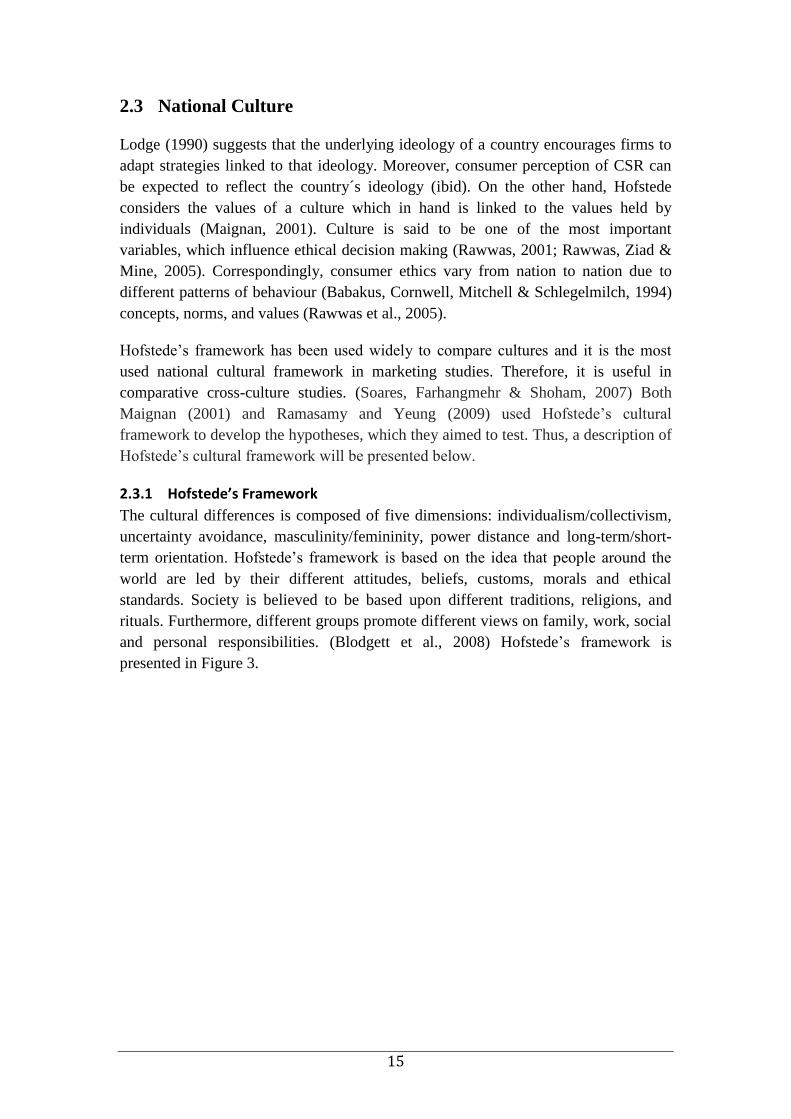
2.3.1 Hofstede’s Framework
The cultural differences is composed of five dimensions: individualism/collectivism,
uncertainty avoidance, masculinity/femininity, power distance and long-term/short-
term orientation. Hofstede’s framework is based on the idea that people around the
world are led by their different attitudes, beliefs, customs, morals and ethical
standards. Society is believed to be based upon different traditions, religions, and
rituals. Furthermore, different groups promote different views on family, work, social
and personal responsibilities. (Blodgett et al., 2008) Hofstede’s framework is
presented in Figure 3.

16
Figure 3 - Hofsted's Framework
Source: Hofstede (1983)
Individual/Collectivism (IDV): individualism is defined as a preference for a loosely
knit social framework where individuals care about themselves and their immediate
family. Collectivism refers to tightly knit society, where individuals expect relatives
to look after them in return for loyalty. (The Hofstede Center, n.d.) Lodge states that
individualistic communities idolise the short-term betterment while the
communitarianism emphasise the betterment of the community as a whole (Lodge,
1990).
Masculinity/Femininity (MAS): the masculine side of the spectrum represents the
preference for achievement, heroism, effectiveness and material reward for success
while the feminine side represents the preference for cooperation, modesty, and
quality of life. (The Hofstede Center, n.d.)
Uncertainty avoidance (UAI): expresses the degree to which members of a society
feel uncomfortable with uncertainty and ambiguity. Fundamentally, it is how a society
deals with the fact that the future is unknown. (The Hofstede Center, n.d.)
Long-term/Short-term orientation (LTO): Societies with short-term orientation
tend to have a strong concern with establishing the absolute truth; they are normative
thinkers and have great respect for tradition. Long-term orientation on the other hand,
CULTURAL DIFFERENCES
Individual/Collectivism
Masculinity/Femininity
Uncertainty avoidance Long-term/short-term
orientation
Power distance

17
believes that truth depends on the situation, context and time. (The Hofstede Center,
n.d.)
Power distance (PDI): this dimension explains the degree to which less powerful
people of society accept and expect that power is distributed unequally, it is how a
society handles inequalities. (The Hofstede Center, n.d.)
2.4 Conceptual Framework
To be able to reach a conclusion regarding the purpose of this study, an explanation of
how we will collect our data is necessary. Furthermore, all concepts in the conceptual
framework will be chosen based on their relevance and strength for our data
collection, known as conceptualisation. Miles and Huberman (1994) refer to a
conceptual framework as an explanation in either a graphical or narrative form of the
main things to be explored. Therefore, we will start with developing hypotheses for
our study. Our hypotheses will be based on Hofstede´s (1983) cultural framework as
well as certain facts concerning each country. Moreover, conclusions reached in both
Maignon and Yeung´s study will be used to base our hypothesis on. Thus, the
conceptual framework will be divided into separate sections for each segment of the
proposed hypotheses.
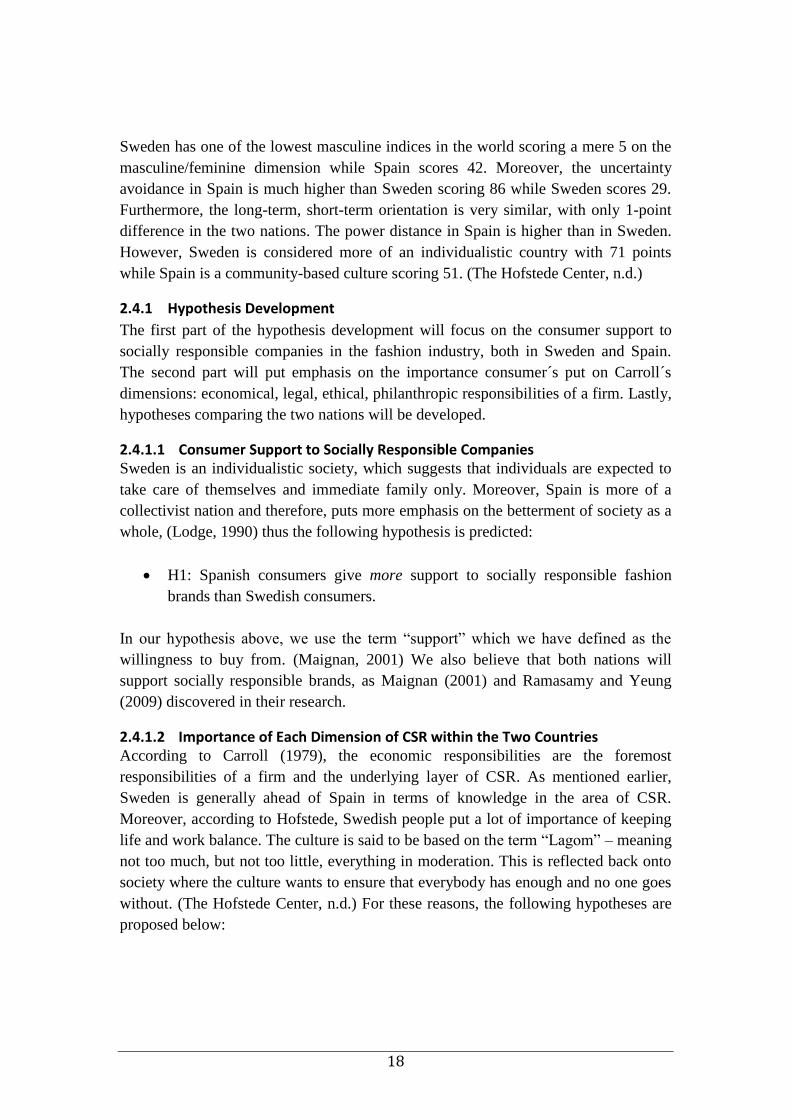
Figure 4 below is a graph presenting the different dimensions of Hofstede’s
framework. The blue bars represent Spain while the red represent Sweden. (The
Hofstede Center, n.d.)
57 51
42
86
19
31
71
5
29
20
PDI IDV MAS UAI LTO
Spain vs Sweden
Spain
Sweden
Figure 4 - Hofstede's Framework comparing Spain and Sweden
Source: Adapted from The Hofstede Center, n.d.
18
Sweden has one of the lowest masculine indices in the world scoring a mere 5 on the
masculine/feminine dimension while Spain scores 42. Moreover, the uncertainty
avoidance in Spain is much higher than Sweden scoring 86 while Sweden scores 29.
Furthermore, the long-term, short-term orientation is very similar, with only 1-point
difference in the two nations. The power distance in Spain is higher than in Sweden.
However, Sweden is considered more of an individualistic country with 71 points
while Spain is a community-based culture scoring 51. (The Hofstede Center, n.d.)
2.4.1 Hypothesis Development
The first part of the hypothesis development will focus on the consumer support to
socially responsible companies in the fashion industry, both in Sweden and Spain.
The second part will put emphasis on the importance consumer´s put on Carroll´s
dimensions: economical, legal, ethical, philanthropic responsibilities of a firm. Lastly,
hypotheses comparing the two nations will be developed.
2.4.1.1 Consumer Support to Socially Responsible Companies Sweden is an individualistic society, which suggests that individuals are expected to
take care of themselves and immediate family only. Moreover, Spain is more of a
collectivist nation and therefore, puts more emphasis on the betterment of society as a
whole, (Lodge, 1990) thus the following hypothesis is predicted:
H1: Spanish consumers give more support to socially responsible fashion
brands than Swedish consumers.
In our hypothesis above, we use the term “support” which we have defined as the
willingness to buy from. (Maignan, 2001) We also believe that both nations will
support socially responsible brands, as Maignan (2001) and Ramasamy and Yeung
(2009) discovered in their research.
2.4.1.2 Importance of Each Dimension of CSR within the Two Countries According to Carroll (1979), the economic responsibilities are the foremost
responsibilities of a firm and the underlying layer of CSR. As mentioned earlier,
Sweden is generally ahead of Spain in terms of knowledge in the area of CSR.
Moreover, according to Hofstede, Swedish people put a lot of importance of keeping
life and work balance. The culture is said to be based on the term “Lagom” – meaning
not too much, but not too little, everything in moderation. This is reflected back onto
society where the culture wants to ensure that everybody has enough and no one goes
without. (The Hofstede Center, n.d.) For these reasons, the following hypotheses are
proposed below:

19
Spanish consumers allocate more importance to economic responsibilities than
to
· H2: … philanthropic responsibilities
· H3: … ethical responsibilities
· H4: … legal responsibilities
Swedish consumers will allocate less importance to economic responsibilities
than to
· H5: … philanthropic responsibilities
· H6: … ethical responsibilities
· H7: … legal responsibilities
2.4.1.3 Importance of the CSR Dimensions in a Comparitive Perspective The crisis in Spain may highly influence consumer´s perception and values regarding
a firm’s work (The World Factbook, 2013). Moreover, Ramasamy and Yeung (2009)
mention that countries better off economically will place less importance on the
economic responsibilities than countries, which are less developed. Thus, the
following hypothesis was developed:
H8: Spanish consumers allocate more importance to economic responsibilities
than Swedish consumers.
The uncertainty avoidance is a good dimension to define the Spanish culture. Spanish
people tend to like having set rules for everything, where change can cause stress.
Moreover, confrontation is generally avoided; concerns arise when changes and
ambiguous situations occur. On the contrary, the uncertainty avoidance in Sweden is
low, where practice counts more than principals. (The Hofstede Center, n.d.)
Furthermore, much like Maignan (2001) established in her results, more
communitarian cultures tend to put more emphasis on legal responsibilities.
Consequently, the following hypothesis was proposed:
H9: Spanish consumers allocate more importance to legal responsibilities than
Swedish consumers.
Spanish people are known to live in the moment, with little concern about the future.
In Spain, people like quick results. While people in Sweden value equality, solidarity
and quality in their working lives. Furthermore, Swedish people tend not to boast or
lift themselves above others. (The Hofstede Center, n.d.) According to the Hofstede
Center, s.a, Sweden is the most feminine country in the world, where Hofstede (1983)
means that the people generally put “relationships with people before money, minding
the quality of life and the preservation of the environment, helping others, in
particular the weak, and small is beautiful” (1983, p. 85). Furthermore, Ramasamy
and Yeung (2009) explain that countries, which are more economically developed, are

20
more individualistic and low in power distance, which influences the perception of
social issues, just as Sweden is according to the graph above. Thus, the following two
statements were proposed:
H10: Swedish consumers allocate more importance to ethical responsibilities
than Spanish consumers.
H11: Swedish consumers allocate more importance to philanthropic
responsibilities than Spanish consumers.
Summary:
This chapter has provided a literature review of previous research in the field of CSR,
where studies concerning consumer perception of CSR have been presented. Further a
conceptual framework was explained using Hofstede´s cultural framework as a mean
of creating hypotheses for the study. Since our hypotheses have further narrowed
down the purpose of the study, it will be the base for our data collection. We will now
move on to chapter 3, where we will discuss how we will collect the data for the
research.

21
3 Methodology
This chapter will present how data was collected in order to reach an answer to the
purpose of the thesis. The research purpose will be presented at first while the
research approach and research strategy will follow. Furthermore, a presentation of
how the data was collected and how the sampling was conducted will be given.
Lastly, the analytical strategy used along with the validity and reliability of the data
will be discussed.
3.4 Purpose of Research
There are three types of research purposes of a study, the first is called exploratory
study, the second is called explanatory study and the third is a descriptive study.
(Marshall and Rossman, 1995) The overall strategy and data collection methods are
determined by deciding on which research strategy to conduct. (Malhotra, 2007)
Below in Table 1 the different purposes are described.
Table 1 – Three Different Purposes of Research
Exploratory Explanatory Descriptive
To investigate little
understood phenomena
To identify/discover
important variables
To generate
hypotheses for further
research
To explain the forces
causing the
phenomenon in
question to identify
plausible casual
networks shaping the
phenomenon
To document the
phenomenon of
interest
Source: Adapted from Marshall and Rossman (1995, p. 56)
Exploratory
Exploratory study is a study that aims to explore something through a problem or
situation in order to better understand a phenomenon (Malhotra, 2007). An
exploratory study uses case studies and field studies as a research strategy. Some
examples of data collection techniques are participant observations, in depth
interviewing and elite interviews. (Marshall and Rossman, 1995)

22
Explanatory
Explanatory study is a study that aims to explain something. An explanatory study
uses case studies, history, field studies and etnography as a research strategy. This
will normally be done by participant observations, in depth interviewing, document
analysis and survey questionnaire. (Marshall and Rossman, 1995)
Descriptive
A descriptive study aims to describe something (usually market research
characteristics or functions) (Malhotra, 2007). The main diffence between exploratory
studies and descriptive studies is that descriptive studies are usually characterized by
specific hypotheses done on a large sample. Moreover, descriptive research is usually
a strict structured study where detailed information is presented with a specific
problem. A descriptive study can collect data by surveys, panels, secondary data or
observations. (ibid) Malhotra (2007) states that there are two different descriptive
methods, one is called cross-sectional design and the second is called longitudinal
design. Cross-sectional design is the most common method of a descriptive study
where the data is collected only once from the respondents. Conversely, longitudinal
design is when a fixed sample group of population elements are measured continually
over the same variables. (ibid)
With respect to the discussion above, we have choosen to use a descriptive approach.
This study aims to describe the different relationships regarding the dimensions of
CSR within each respective country as well as comparatively. Therefore, an
explanatory approach would be misleading since we do not aim to present the reasons
or shapements of a certain phenomenon. Arguably, an exploratory approach was used
in the first chapters of this study, where previous research in the field helped us create
hypotheses to test. Thus, a descriptive approach was the most appropriate approach
since we wish to describe the different consumer perceptions of two markets. Further,
a descriptive approach was helpful to test our proposed hypotheses with a larger
sample size. Since our aim was to collect information from the given sample of the
population just once, a cross-sectional design was used.
3.5 Research approach
A qualitative approach is a relatively unstructured measurement “that permit a range
of possible responses, and they are a creative means of ascertaining consumer
perceptions that may otherwise be difficult to uncover” (Kotler & Keller, 2009. p. 66).
Zikmund (2009) defines qualitative marketing research as “research that addresses
marketing objectives through techniques that allow the researcher to provide elaborate
interpretations of market phenomena without depending on numeric measurements;
its focus is on discovering true inner meaning and new insights” (2009, p. 84).
In contrast, quantitative research is defined as “research that addresses research
objectives through empirical assessments that involve numerical measurement and
23
analysis” (Zikmund, 2009. p.83). It is used to quantify the data, and usually applies
statistics (Malhotra, 2007).
The research method used should be based on the purpose of the research. In order to
test our hypotheses we had no other choice than to use a quantifiable approach, thus a
quantitative study. On a side note, we also chose to generalize results in the hope of
finding relationships between our two test markets using different statistical measures.
To do this, we need a large number of research units and obviously a quantitative
approach was used to gather data.
3.6 Research Strategy
Kotler and Keller (2009) describe five different ways of collecting primary data, they
are by: observation, focus groups, surveys, behavioural data, and experiments. A
discussion of each strategy is presented below.
Observational research – data can be collected through observations of the
relevant setttings and persons. For example, ethnographic research is where
anthropologic observations are used to describe how people live and work.
(Kotler & Keller, 2009)
Focus group research – focus groups are when a gathering of six to ten people
is selected based on certain criteria. This may include demographic or
psychographic factors. The people are brought together to deeply discuss
topics of interest given by the researcher. (ibid)
Survey research – survey’s enable companies to learn about people’s beliefs,
knowledge, preferences as well as satisfactions. These can be measured due to
the large size of collected data. (ibid)
Behavioural data – consumers leave traces of their behaviour through many
means such as online purchasing records and customer databases. This data
can be analysed in order to get a deeper understanding of customers’
preferences. (idid)
Experimental research- experimental research is done when cause and effect
relationships want to be explored. It is the most scientific valid research, and is
done by eliminating competing explanations of the observed findings. (ibid)
According to Malhotra (2007) the survey method of collecting information to the
research will be based on questioning of the respondents. Respondents will answer
different questions concerning their behaviour, intentions, attitudes, motivations,
awareness, and demographic/lifestyle personalities. A survey approach is the most
used method of conducting information within marketing research. In Table 2 the
advantages and disadvantages are presented. (ibid)

24
Table 2 - Advantage and Disadvantage with Surveys
Advantage: Disadvantage:
Source: Malhotra (2007)
We have chosen to conduct a survey for our research. This was done in order to
answer the purpose of our study. We want to identify the beliefs concerning CSR is
Students in Sweden and Spain. Since, we wish to identify beliefs of an entire
population the survey was the best choice. Therefore, a questionnaire was developed
using a set of close-ended questions (Kotler & Keller, 2009). These questions were
based on prior research in the field and have therefore already been fully developed
and tested (ibid). The biggest advantages of conducting a survey can be studied
above. We believe a survey was the best choice for us because, it simplified the
means of collecting data, enabled us to reach a large sample, data is reliable with a
reduction of variability and the interpretation of the data will be simplified. When
examining the possible disadvantages, we counteracted them firstly through face to
face interviews when we did not receive the number of respondents necessary.
Secondly, we used an already tested survey, therefore only wording was challenge
during the translation phase.
3.7 Data Collection
Data collection can be done either through collecting primary or secondary data
(Saunders, Lewis & Thornhill, 2009). It is important to consider these two variables
in a research process based on the kind of research the author aims to do. When
collecting primary data, the researcher collects information by him/herself and for a
specific purpose. When collecting secondary data, the researcher collects data from
other sources that already exist. (Saunders et al., 2009)
Questionnaires are simple to
administer
Data is reliable
Reduce the variability in the
result
Coding, analysis and
interpretation of data is easy
Respondents are unable or
unwilling to deliver the wanted
information
Respondents may be unwilling to
answer if the survey is too personal
or sensitive
Loss of validity such as beliefs and
feelings due to structured and fixed
response questions
Wording questions properly is hard

25
In this thesis, we based our research by collecting information through primary data.
According to Zikmund (2009) primary data can be collected by various methods
where the main methods are described below.
1. Questionnaires
2. Interviews
3. Observations
4. Focus group interviews
5. Case studies
6. Diaries
7. Critical incidents
8. Portfolios
As described above in the section “research strategy” we used questionnaires in form
of a survey to collect primary data.
3.7.1 Data collection method
According to Malhotra (2007) a questionnaire survey can be divided into four major
models; Telephone interviews, personal interviews, mail interviews and electronic
interviews as shown in Figure 5.
One way of doing a survey can be by traditional telephone interviewing. Traditional
telephone interviewing is when researchers phone a sample of respondents and ask
questions regarding the thesis subject. (Malhotra, 2007)
Questionnarie Survey
Telephone Interviews
Personal Interviews
Mail Interviews
Electronic Interviews
Figure 5 - Data Collection Methods
Source: Adapted from Malhotra (2007, p. 184)

26
The second way of conducting information by a survey can be by personal interviews.
Personal interviews can be categorized as in home, mall intercepts or computer
assisted interview. (Malhotra, 2007)
Mail interviews can be conducted by mail or a mail panel. The traditional mail
interview is when the questions are sent out by mail to potential respondents, after
having completed the survey the answers are sent back to the interviewer. Mail panel
interviews are samples of households that have agreed to participate periodically in
mail questions, telephone questions and product tests. (Malhotra, 2007)
Electronic interviews are when the questionnaire are sent out and answered by email,
on the Internet or by the web. Email interviews need the potential respondents’ email
addresses otherwise this method is impossible. The surveys are sent out by email over
the internet and the respondents answer the questions. After answering they click
“send” and the data is collected and tabulated. Interviews over the Internet or the web
use a “hypertext mark-up language (HTML)” and are published on a website.
Moreover, links to the surveys are uploaded or sent out as an invitation to the
respondents and the respondents are asked to click on the link and answer the
questions. The answers are then entered and tabulated. (Malhotra, 2007) In Table 3
the different survey methods are compared with each other by a variety of criteria.
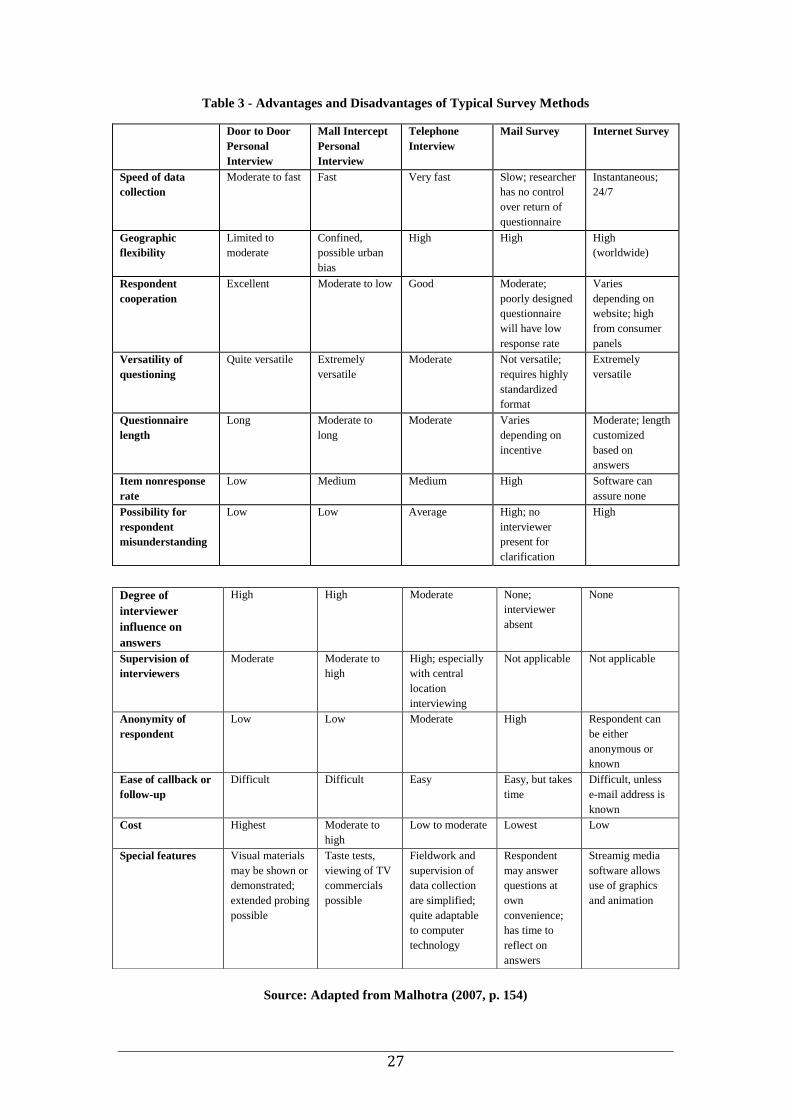
27
Table 3 - Advantages and Disadvantages of Typical Survey Methods
Door to Door
Personal
Interview
Mall Intercept
Personal
Interview
Telephone
Interview
Mail Survey Internet Survey
Speed of data
collection
Moderate to fast Fast Very fast Slow; researcher
has no control
over return of
questionnaire
Instantaneous;
24/7
Geographic
flexibility
Limited to
moderate
Confined,
possible urban
bias
High High High
(worldwide)
Respondent
cooperation
Excellent Moderate to low Good Moderate;
poorly designed
questionnaire
will have low
response rate
Varies
depending on
website; high
from consumer
panels
Versatility of
questioning
Quite versatile Extremely
versatile
Moderate Not versatile;
requires highly
standardized
format
Extremely
versatile
Questionnaire
length
Long Moderate to
long
Moderate Varies
depending on
incentive
Moderate; length
customized
based on
answers
Item nonresponse
rate
Low Medium Medium High Software can
assure none
Possibility for
respondent
misunderstanding
Low Low Average High; no
interviewer
present for
clarification
High
Source: Adapted from Malhotra (2007, p. 154)
Degree of
interviewer
influence on
answers
High High Moderate None;
interviewer
absent
None
Supervision of
interviewers
Moderate Moderate to
high
High; especially
with central
location
interviewing
Not applicable Not applicable
Anonymity of
respondent
Low Low Moderate High Respondent can
be either
anonymous or
known
Ease of callback or
follow-up
Difficult Difficult Easy Easy, but takes
time
Difficult, unless
e-mail address is
known
Cost Highest Moderate to
high
Low to moderate Lowest Low
Special features Visual materials
may be shown or
demonstrated;
extended probing
possible
Taste tests,
viewing of TV
commercials
possible
Fieldwork and
supervision of
data collection
are simplified;
quite adaptable
to computer
technology
Respondent
may answer
questions at
own
convenience;
has time to
reflect on
answers
Streamig media
software allows
use of graphics
and animation

28
In this thesis we used a so-called Mixed-mode survey, where electronic interviews
and face-to-face interviews took place. Within the electronic interviews sent out the
survey by email and by Facebook. We chose Internet surveys in order to ease the
means of getting in contact with students in each country. Due to our connection to
the universities in Spain and Sweden, university email addresses and Facebook was
used to send out the survey. The survey was constructed on the Internet via Google
Doc. The respondents email addresses were collected by previous course email lists
and by friends’ course email lists in the respective countries. Facebook enabled us to
reach a larger group of students, where we created an open Facebook event in order to
pass out our survey. When the respondents received the link they had to open it and
answer the questions, thereafter they sent the answers in which were documented into
our Google Doc. In Table 4 the strengths and weaknesses with Internet interviews are
presented.
Table 4 - Strengths and Weaknesses with Internet Interviews
Strengths: Weaknesses:
Source: Adapted from Malhotra (2007, p. 156)
We also used face-to-face interviews due to the challenge of collecting data from the
Spanish sample. Face-to-Face interviews were done in Valencia at the University of
Valencia, to be able to get contact with as many Spanish students as possible. In Spain
we estimated to receive about 50 percent of the respondents via mail and the other 50
through face-to-face interviews. However, these numbers were not met and will be
discussed in a latter stage (see section 3.10, p.34). In Table 5 the strengths and
weaknesses with Face-to-Face interviews are presented.
Time and cost effective
Easy to analyse
Control over the answers when answering
Direct data registration by clicking ”send”
Familiar with questionnaires, rarely need to be
discussed in detail
Reduces the risk of impartiality
Not as intrusive as phone or face to face
interviews
Answer frequency can be low
Does not have the ability to
penetrate deeper into the
responses
Problems with e-mail adresses
Failure due to technical
problems and unfamiliarity
Access limited conclusions
Risk of personal privacy
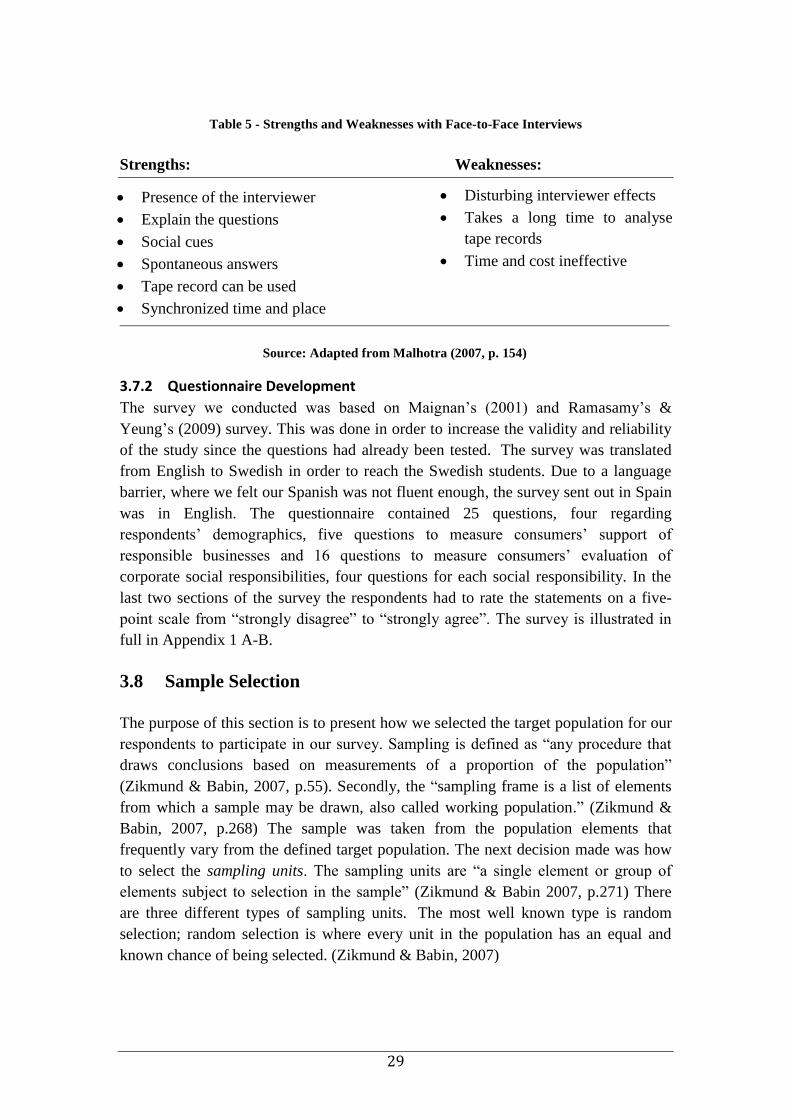
29
Table 5 - Strengths and Weaknesses with Face-to-Face Interviews
Strengths: Weaknesses:
Source: Adapted from Malhotra (2007, p. 154)
3.7.2 Questionnaire Development
The survey we conducted was based on Maignan’s (2001) and Ramasamy’s &
Yeung’s (2009) survey. This was done in order to increase the validity and reliability
of the study since the questions had already been tested. The survey was translated
from English to Swedish in order to reach the Swedish students. Due to a language
barrier, where we felt our Spanish was not fluent enough, the survey sent out in Spain
was in English. The questionnaire contained 25 questions, four regarding
respondents’ demographics, five questions to measure consumers’ support of
responsible businesses and 16 questions to measure consumers’ evaluation of
corporate social responsibilities, four questions for each social responsibility. In the
last two sections of the survey the respondents had to rate the statements on a five-
point scale from “strongly disagree” to “strongly agree”. The survey is illustrated in
full in Appendix 1 A-B.
3.8 Sample Selection
The purpose of this section is to present how we selected the target population for our
respondents to participate in our survey. Sampling is defined as “any procedure that
draws conclusions based on measurements of a proportion of the population”
(Zikmund & Babin, 2007, p.55). Secondly, the “sampling frame is a list of elements
from which a sample may be drawn, also called working population.” (Zikmund &
Babin, 2007, p.268) The sample was taken from the population elements that
frequently vary from the defined target population. The next decision made was how
to select the sampling units. The sampling units are “a single element or group of
elements subject to selection in the sample” (Zikmund & Babin 2007, p.271) There
are three different types of sampling units. The most well known type is random
selection; random selection is where every unit in the population has an equal and
known chance of being selected. (Zikmund & Babin, 2007)
Presence of the interviewer
Explain the questions
Social cues
Spontaneous answers
Tape record can be used
Synchronized time and place
Disturbing interviewer effects
Takes a long time to analyse
tape records
Time and cost ineffective

30
Non-probability sampling is a sampling technique where “units of the sample are
selected on the basis of personal judgment or convenience; the probability of any
particular member of the population being chosen is unknown” (Zikmund & Babin
2007, p. 273) Convenience sampling, judgment sampling, quota sampling, and
snowball sampling are techniques that can be used for non-probability sampling.
(Zikmund & Babin, 2007)
Probability sampling is a “sampling technique in which every member of the
population has a known, nonzero probability of selection” (Zikmund & Babin, 2007,
p. 273) All probability techniques are based on chance selection, thus random
selection. There are five different techniques involving probability sampling. The first
technique is a simple random sampling; this technique assures that each element in
the population has an equal chance of being selected. Some examples include raffle
tickets or drawing names out of a hat. Systematic sampling is the second technique,
where a starting point is selected, and thereafter every nth
number on the list is
selected. Another technique possible is stratified sampling, where simple random
subsamples that are more or less the same on a certain characteristic are drawn from
each subgroup of the population. Moreover, a cluster-sampling type can be used in
order to reduce costs and make data gathering more efficient. A cluster-sampling is a
procedure that selects an area rather than individual units in a population, thus
reducing costs. Lastly, multistage area sampling involves using a combination of two
or more probability sampling techniques. (Zikmund & Babin, 2007)
The degree of accuracy, resources, time, and the advanced knowledge of the
population all influence the procedure of sampling. The degree of accuracy relates to
how a representative sample is chosen. Further, the cost associated with sampling
differs vastly depending on the sample. For example, a student writing a thesis will
not have the resources to do a national survey. Moreover, time can be a constraint if
the researcher has a deadline to meet. Advance knowledge of the population can also
be of importance when sampling, for example lists of population members may
simplify the process. In addition, geographical proximity of the population will also
influence the sample design, where cluster samples may be used if the population is
unequally distributed. (Zikmund & Babin 2007)
In this research, the population we studied are university students in both Spain and
Sweden. Random selection for our study would have been beneficial, however due to
the complexity of random selection we are afraid it was not a plausible strategy to
tackle. Moreover, non- probability samples were ruled out due to the fact that
statistical analysis cannot be projected using this method. Therefore, we chose to use
a probability sampling method. However, due to time and cost constraints we used a
cluster sample method to send out the surveys to more efficiently get the necessary
number of answers. This was done in Sweden through universities we had contact
with, either through friends or directly. In Spain, we focused our study to Valencia
where Carin has previously studied at the University of Valencia and therefore had

31
contact with students and the university. Lists were used to mail out the surveys to
university students in both Luleå University of Technology in Sweden and Universitat
de Valencia in Spain. Moreover, we used an open facebook group as a mean of
reaching university students across the entire nation in both Sweden and Spain. We
created an event where we invited students from Sweden to participate in our survey.
In addition, connections with friends in different universities were used as a means of
reaching more university students across the two nations.
The next issue to tackle was the size to which the sample selection should be. Since, it
is unrealistic to examine every single unit in the target market a selected sample must
be done. Though, larger samples are more precise. However, a smaller proportion can
also be used if selected in a proper manner in order to give a reliable measure as a
whole. There are two main ways for determining the sample size, either through
calculation or through good judgment. By using good judgement, one may for
example, use sample sizes similar to those used in previous studies. This would
provide the inexperienced researcher with a comparison to well-known research in the
same area. (Zikmund & Babin, 2007)
With the above statement in mind, we chose to select our sample size based on
judgment. This has been done through analysing other surveys in the area of cross
cultural consumer conception of CSR. We have mainly based this on Maignan and
Yeung’s work, where Maignan had 94 from the German sample 169 from the French
and 145 from the U.S. sample. In addition, Yeung had 134 from the Shanghai sample
and 121 from the Hong Kong sample. Based on their sample sizes we therefore aimed
at receiving 100 participants in each respective country. Even though a larger sample
would have increased the reliability and validity of our research, we limited ourselves
to reaching around 100 participants in each country due to time and cost constraints.
Moreover, having a sample size close to that of well-established authors in the field
will help us to make comparisons to their research in the conclusion chapter of this
thesis.
3.9 Method of analysis
According to Patel and Davidson (2003) there are two methods used to reach a
conclusion regarding the collected data in a research, qualitative and quantitative
methods. In this case, our research was based on a quantitative method where
statistical methods were used. In a quantitative study there are two types of statistical
methods which can be used, one is called descriptive statistics and the other is called
inferential statistics. Descriptive statistic are those, which describe, display and
organize collected data using graphs, tables and summary measures. Inferential
statistic describes and draws conclusions of the sample results. (Newbold, Carlson &
Thorne, 2010) In this thesis both methods were used in order to present and analyse
the collected answers.
32
We used a descriptive method when describing our empirical data in order to better
organize and present the collected answers. Thereafter, the program, minitab was used
to show the summary measures with calculated percentages of each question as well
as the demographics in each sample. Furthermore inferential statistics was conducted
to analyse the relationship between the different variables. T-tests were calculated to
see if certain demographics seemed to have an impact on the different support factors.
The relationships between the variables are shown through different t-tests
compairing the means, while Cronbach’s alpha was used to measure the reliability of
the questions.
3.9.1 Statistics
T-tests: The t-test is used when one does not know the standard deviation, and instead
the sample standard deviation can be used. A normal distribution is assumed of the
population. When testing the null hypothesis the population mean is the same as the
value of µ. There are different kinds of t-tests, the independent t-test and the
dependent t-test. The independent t-test is used when two separate sets of independent
and identically distributed samples are collected where one from each of the
population are compared. The dependent t-test is where one includes the two separate
sample variances in the calculation. Moreover, one sample t-tests can be used test the
null hypothesis of one variable within one sample. If one wishes to test the null
hypothesis from two samples, a two-sample t-test should be used. Paired sample t-test
can also be used in order to test the null hypothesis for two variables within one
sample. For our purposes we will make use of the two-sample t-test as well as the
paired sample t-test. (Levine, Berenson & Stephan, 2008)
3.9.2 Testing the Hypotheses
Definition of hypotheses testing: A hypothesis is a statement of a population
parameter and the objectives are to decide which of the two complementary
hypotheses that is true based on the sample. The two matching hyphothesis are called
null hypothesis (H0) and alternative hypothesis (H1). (Berger & Casella, 2002)
In order to test each hypothesis, different t-tests were used; each t-test is presented
below in the data analysis chapter. However, if we failed to reject the null hypothesis
then either the null hypothesis or the alternative hypothesis is correct, which indicates
that the evalutaions are not strong enough to reject the null hypothesis. The P-value
was used in order to come to a conclusion on whether or not to reject the null
hypothesis. The P-value is “the smallest significance level at which a null hypothesis
can be rejected” (Newbold, 2007. p.385)
3.9.2.1 Support to corporate social responsibilities across borders
In order to determine the support students had on corporate social responsibility
across borders the program minitab was used. An analysis of an independent two-
sample t-test was used to test the null hypotheses of H1. To test the support factor

33
(first five questions of the survey) to the nationality our results are based on if the P-
Value is less than 0.05.
3.9.2.2 Evaluation of corporate social responsibilities in each country
Evaluation of the corporate social responsibility in each country was explored by
conducting paired sample t-tests using minitab. The paired sample t-test was used to
test the null hypotheses of H2 to H7. The null hypothesis will as above states be
rejected if the P-Value is less than 0.05.
3.9.2.3 Comparison of corporate social responsibilities across countries
To compare the corporate social responsibilities across the countries a two-sample t-
test was used to test the null hypotheses of H8 to H11 using minitab. The different
dimensions of CSR were thus tested comparatively in the two samples. In the case of
rejecting the null hypothesis, the same rule follows in this case as the above.
3.10 Reliability and Validity
There are three major criteria for assessing measurements; reliability, validity and
sensitivity. Reliability is “an indicator of a measure´s internal consistency” (Zikmund
and Babi, 2007, p. 210) and how precise the measure is. In other words, reliability is
“the extent to which a scale produces consistent results if repeated measurements are
made on the characteristics” (Malhotra, 2004, p. 267). Simply, a measure is reliable if
different attempts at measuring something result in the same answers. Random error
produces inconsistency and thus negatively affects the reliability of the research.
(Malhotra, 2004)
Similarly, Validity is the “accuracy of a measure or the extent to which a score
truthfully represents a concept” (Zikmund and Babin 2007, p. 210). Accuracy refers
to the fact that the measurement should reflect reality. Malhotra (2007) defines
validity as “the extent to which differences in observed scale scores reflect true
differences among objects on the characteristic being measures, rather than systematic
error” (2007, p. 269). For example, a relationship between a professor and a student
can affect the student’s grade. (Zikmund and Babin, 2007) Researchers can assess the
validity through, content validity, criterion validity, and construct validity. Content
validity evaluates the representativeness of the content to be measured. Criterion
validity measures whether the scale performs as expected in relation to other
variables. Criterion variables include demographics, behavioural measures, and
psychographic characteristics. Construct validity addresses the characteristic of what
the scale is measuring. Moreover, if a measure is perfectly valid then it is also
perfectly reliable, therefore unreliability indicates invalidity. (Malhotra, 2004)

34
Lastly, sensitivity refers to “an instrument´s ability to accurately measure variability
in a concept” (Zikmund, 2007, p. 211). A simple survey with a response category
only containing “agree” or “disagree” does not allow recording subtle changes. Thus,
adding more response options will increase the sensitivity of the study. (Zikmund and
Babin, 2007)
Our research aimed at receiving at least 100 answered surveys from both samples.
The larger the sample size, the larger the reliability of our study. The response rate in
the Swedish sample was around 40 percent where, around 300 suveys were sent out
using mail and facebook. The response rate in the Spanish sample was around 11
percent, where around 100 surveys were sent out and 11 were answered. Therefore,
we had to collect 92 of the surverys through personal interviews. Moreover, we
strengthened the validity of our research by taking previously tested questions from
Maignan´s study. Furthermore, our survey addresses each question by using a five-
point scale, instead of a simple “agree” or “disagree” option, thus increasing the
sensitivity of our study further. Moreover, Cronbach’s alpha was used to measure the
reliability of our data.
Cronbach’s alpha is a coefficient of internal consistency. It is used to measure the
reliability of a sample. It is widely used in social sciences as well as in businesses.
The measure will increase as the inter-correlations in the test items increase thus,
measuring the internal reliability of the test scores. The following scale in Table 6
shows the rule of thumb for describing internal consistency; however this should be
used with caution since a larger number of items can inflate the value while a narrow
number of items can deflate the value. (Develles, 1991)
Table 6 - Cronbach Alpha
Cronbach Alpha Internal Consistency
≥ 0,9 Excellent (High-Stakes testing)
0,8 ≤ < 0,9 Good (Low-Stakes testing)
0,7 ≤ < 0,8 Acceptable (Surveys)
0,6 ≤ < 0,7 Questionable
0,5 ≤ < 0,6 Poor
< 0,5 Unacceptable
Source: Adapted from DeVilles (2011)
35
Summary
We have chosen to conduct a survey for this research in order to quantify results and
to compare with previously mentioned research. Thus, a quantitative approach along
with a deductive reasoning was used. Moreover, we chose to use a cluster sample
method to gather information through a survey, which was sent out, both via mail,
Facebook and through Face-to-Face interviews. However, Face-to-Face interviews
were only conducted in Valencia. Similar to the previous research, we aimed at
receiving around 100 respondents in each market. After the data was collected, an
analysis was conducted using both inferential and descriptive approaches. Now that
the method of how to collect our data has been presented, we will go on to explain our
empirical data along with the obtained results and an analysis of the collected data.

36
4 Empirical Data & Data Analysis
This chapter will present the empirical data collected in order to answer our
presented hypotheses. The data was collected through surveys sent out in both
Sweden and in Spain. This chapter will also analyse the empirical data collected with
the theories presented in chapter 2. We will start with evaluation of the reliability of
the data. Thereafter, the analysis of the hypothesis tests will follow.
4.4 Empirical Data
The English survey is presented in Appendix 1 A, while the Swedish survey is
presented in Appendix 1 B. The results obtained in each sample are also presented in
the descriptive statistics in Appendix 2 and 3. Below in Table 7, a presentation of the
profile of the respondents is tabulated.
Table 7 - Profile of respondents
Sweden Spain
Number of respondents: 119 103
Age: Mean 24 22
Minimum 20 17
Maximum 46 48
Gender: Male 48% 55%
Female 52% 45%
Education: Bachelor 46% 91%
Magister 18% 0%
Master 34% 7%
PhD 2% 2%
Consumption
of clothing/month
(Euro): 0-50 44% 65%
51-100 40% 21%
101-150 10% 7%
151-200 4% 3%
201-250 1% 3%
251-300 1% 0%
301 + 0% 1%

37
4.5 Reliability of Measurements
As mentioned earlier, Cronbach’s Alpha was used to measure the reliability of the
measurements obtained from the results. Table 8 below presents Cronbach’s Alpha
for both Sweden and Spain. The Alpha was used to measure the internal consistency
of the first five questions of the survey - which represent the support for CSR, as well
as each of the four sets of responsibilities (question 6-21).
Table 8 - Reliability (Cronbach Alpha)
Question Sweden Spain
1-5: Support for CSR 0,81 0,68
6-21: Economic 0,77 0,70
Legal 0,87 0,54
Ethical 0,93 0,32
Philanthropic 0,88 0,61
As presented above, Cronbach’s Alpha in the Swedish sample for the support of CSR
in the fashion industry (question 1-5) was 0.81 indicating good, low-stake testing.
While in Spain the coefficient was lower, rating only at a 0.68. According to Malhotra
(2007), these results are questionable, thus lowering the reliability of the results
obtained regarding these questions.
Overall, the Swedish sample had a much higher Cronbach Alpha coefficient for all
four dimensions of CSR. The highest was the ethical dimension evaluated to a 0.92,
which indicates an excellent stake testing. On the other hand, the lowest obtained
score was in the economic dimension of CSR in the Swedish sample. Comparatively,
the Spanish sample is questionable in two of four of the CSR dimensions, the
philantropic and the economic dimension is evaluated to be acceptable. For example,
the lowest obtained Cronbach coefficient was a mere 0.32 regarding the ethical
dimension indicating an unacceptable stake testing. The low scores show that the
study conducted in Spain is at times highly unreliable. Causes and explanations for
the low reliability of the results will be discussed further in the conclusion chapter of
this thesis (see section 5.5, p.49).

38
4.6 Hypothesis Testing
To be able to answer the hypothesis the hypothesis needs to be tested. This was done
through different t-tests which are shown below.
4.6.1 Support for CSR across borders
In order to evaluate the support for CSR in each country we conducted a 2 sample
independent t-test to test H1in order to compare the two markets to each other. We
did this through analysing the support factor – the first 5 questions of the survey. This
was done by adding the means of each question and dividing the result by 5 in order
to calculate the overall mean, presented in Table 9. Thereafter a 2 sample independent
t-test was used to test the hypothesis. The result of the test is presented below in Table
10.
Table 9 - Means of results
Scale from 1 to 5 (strongly disagree to strongly agree)
Question Sweden Spain Sweden & Spain
1 3,37 3,42 3,39
2 2,61 3,35 2,95
3 2,57 3,45 2,96
4 3,45 3,82 3,62
5 4,19 4,14 4,17
6 3,22 3,50 3,35
7 3,69 3,73 3,71
8 4,24 3,89 4,08
9 3,24 3,62 3,42
10 4,45 4,28 4,37
11 4,45 3,57 4,04
12 4,55 3,22 3,94
13 4,45 3,94 4,21
14 4,02 3,47 3,76
15 3,30 3,96 3,61
16 3,89 4,16 4,01
17 3,82 2,96 3,42
18 3,32 4,17 3,72
19 3,09 3,37 3,22
20 3,19 3.58 3,37
21 3,44 3,95 3,68

39
Table 10 - Two-Sample T-Teste with 95% CI
Hypotheses Country N Mean T-value P-value
H1: Sweden 119 3,23 -2,56 0,011
Spain 103 3,63
The P-value is 0.011 while the T-value is -2.56. This indicates that at a 5 percent
significance level the difference in the mean is significant. With a P-value of 0.011,
we accept our proposed hypothesis. Accordingly, the results show that the Spanish
sample has a higher mean than the Swedish sample. Thus, we accept our hypothesis
that Spanish consumers support CSR to a higher degree than Swedish consumers.
4.6.2 Evaluation of CSR in each country
When evaluating CSR in each country we performed a paired sample t-test for each
hypothesis of the four dimensions of CSR. In other words, paired sample t-tests were
done in clusters according to which dimension of CSR each question was related to
through questions 6-21 in a similar manner as mentioned above. The obtained results
can be seen in Table 11 and 12 below.
Table 11 - Paird T-Test with 95% CI in Spain
Hypotheses Responsible N Mean T-value P-value
H2: Economic 410 3,68 -1,16 0,25
Philantropic 410 3,77
H3: Economic 410 3,68 0,64 0,54
Ethical 410 3,64
H4: Economic 410 3,68 -1,01 0,31
Legal 410 3,75
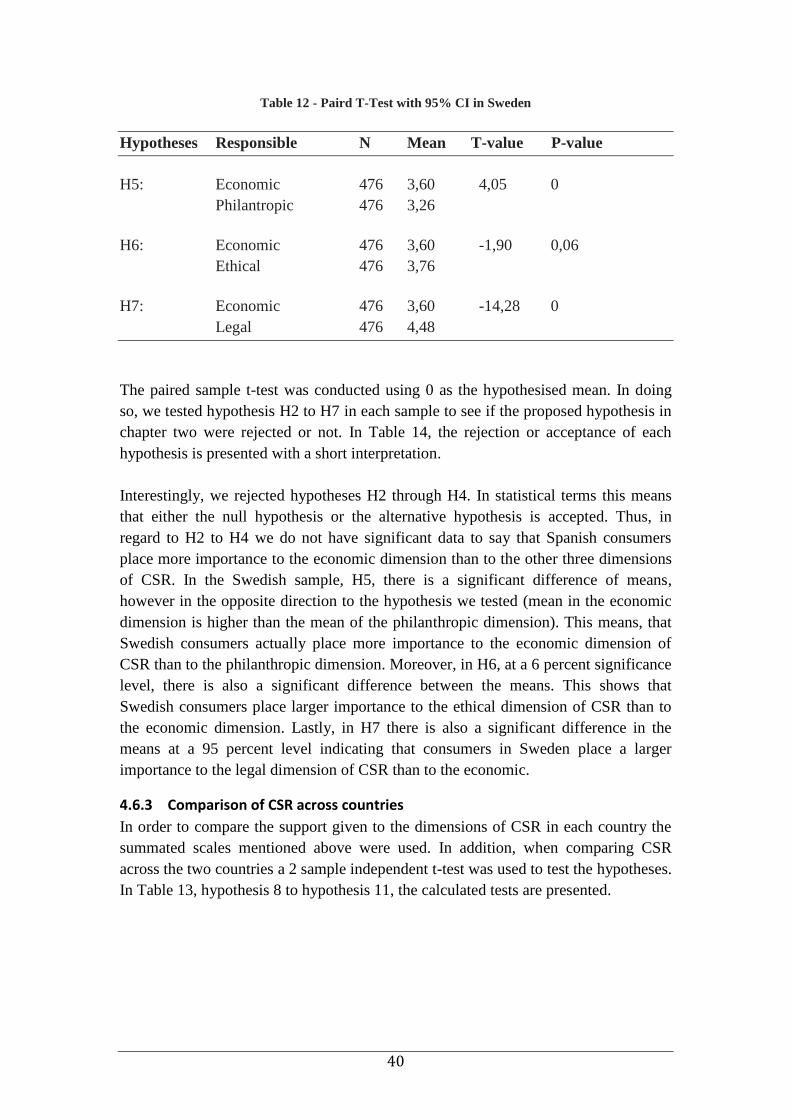
40
Table 12 - Paird T-Test with 95% CI in Sweden
Hypotheses Responsible N Mean T-value P-value
H5: Economic 476 3,60 4,05 0
Philantropic 476 3,26
H6: Economic 476 3,60 -1,90 0,06
Ethical 476 3,76
H7: Economic 476 3,60 -14,28 0
Legal 476 4,48
The paired sample t-test was conducted using 0 as the hypothesised mean. In doing
so, we tested hypothesis H2 to H7 in each sample to see if the proposed hypothesis in
chapter two were rejected or not. In Table 14, the rejection or acceptance of each
hypothesis is presented with a short interpretation.
Interestingly, we rejected hypotheses H2 through H4. In statistical terms this means
that either the null hypothesis or the alternative hypothesis is accepted. Thus, in
regard to H2 to H4 we do not have significant data to say that Spanish consumers
place more importance to the economic dimension than to the other three dimensions
of CSR. In the Swedish sample, H5, there is a significant difference of means,
however in the opposite direction to the hypothesis we tested (mean in the economic
dimension is higher than the mean of the philanthropic dimension). This means, that
Swedish consumers actually place more importance to the economic dimension of
CSR than to the philanthropic dimension. Moreover, in H6, at a 6 percent significance
level, there is also a significant difference between the means. This shows that
Swedish consumers place larger importance to the ethical dimension of CSR than to
the economic dimension. Lastly, in H7 there is also a significant difference in the
means at a 95 percent level indicating that consumers in Sweden place a larger
importance to the legal dimension of CSR than to the economic.
4.6.3 Comparison of CSR across countries
In order to compare the support given to the dimensions of CSR in each country the
summated scales mentioned above were used. In addition, when comparing CSR
across the two countries a 2 sample independent t-test was used to test the hypotheses.
In Table 13, hypothesis 8 to hypothesis 11, the calculated tests are presented.

41
Table 13 - Two-Sample T-Test with 95% CI
Hypotheses Country N Mean T-value P-value
H8: Sweden 119 3,60 -0,59 0,55
Spain 103 3,68
H9: Sweden 119 4,47 5,72 0
Spain 103 3,76
H10: Sweden 119 3,76 0,79 0,43
Spain 103 3,64
H11: Sweden 119 3,26 3,31 0,001
Spain 103 3,77
Fascinatingly, in H8 there may or may not be significantly more importance placed on
the economic dimension in the Spanish sample compared to the Swedish sample. This
is determined by the insignificant difference in the T-value. Further, as one may
observe the mean differences between the two samples do not appear to be highly
different. On the other hand, in H9 there appears to be a significant difference
between the two sample means. This is determined by the P-value. However, our
hypothesis was rejected since our results show that the significant difference is in the
opposite direction. With this we mean that the mean in the Swedish sample is higher
than the mean in the Spanish sample. The difference in means indicates that the
Spanish consumers do not allocate more importance to the legal dimension than
Swedish consumers. Furthermore, in H10, there does not seem to be a significant
difference between the means with a P-value of 0.43. Thus, we fail to accept the
hypothesis that Swedish consumers will allocate more importance to ethical
responsibilities than Spanish consumers. Lastly, H11 states that Swedish consumers
will allocate more importance to philanthropic responsibilities than Spanish
consumers. According to our findings, we see that there is a significant difference
between the means where the P-value is 0.001 indicating that Spain in fact allocates
more importance to philanthropic responsibilities than Swedish consumers.
Table 14 below shows the each hypothesis presented in chapter two with either a
rejection or an acceptance. Following each hypothesis a short interpretation is given.

42
Table 14 - Summary of Study Findings
Hypothesis Results Short Interpretation
Accept Hypothesis
Reject Hypothesis
Reject Hypothesis
Reject Hypothesis
Reject hypothesis
Reject Hypothesis
Accept Hypothesis
Accept Hypothesis
Spanish consumers support
socially responsible companies
to a larger extent than Swedish
consumers.
Not enough significant data to
say that Spanish consumers
place more importance to the
economic dimension than to
the other philanthropic
dimension.
Not enough significant data to
say that Spanish consumers
place more importance to the
economic dimension than to
the other ethical dimension.
Not enough significant data to
say that Spanish consumers
place more importance to the
economic dimension than to
the other legal dimension.
Swedish consumers place
more importance to the
economic dimension of CSR
than to the philanthropic
dimension.
At 6 percent significance
level Swedish consumers place
larger importance to the ethical
dimension of CSR than to the
economic dimension.
H1: Spanish consumers
give more support to
socially responsible
fashion brands than
Swedish consumers.
H2: Spanish consumers
allocate more
importance to economic
responsibilities than to
philanthropic
responsibilities.
H3: Spanish consumers
allocate more
importance to economic
responsibilities than to
ethical responsibilities.
H4: Spanish consumers
allocate more
importance to economic
responsibilities than to
legal responsibilities.
H5: Swedish consumers
will allocate less
importance to economic
responsibilities than to
philanthropic
responsibilities.
H6: Swedish consumers
will allocate less
importance to economic
responsibilities than to
ethical responsibilities.

43
Accept Hypothesis
Reject Hypothesis
Reject Hypothesis
Reject Hypothesis
Reject Hypothesis
Swedish consumers place a
larger importance to the legal
dimension of CSR than to the
economic dimension.
Not enough significant data
to state that Spanish
consumers allocate more
importance to economic
responsibilities than Swedish
consumers.
Spanish consumers do not
allocate more importance to
the legal dimension than
Swedish consumers.
Not enough significant data
to state that Swedish
consumers will allocate more
importance to ethical
responsibilities than Spanish
consumers.
Spanish consumers allocate
more importance to
philanthropic responsibilities
than Swedish consumers.
H7: Swedish consumers
will allocate less
importance to economic
responsibilities than to
legal responsibilities.
H8: Spanish consumers
allocate more
importance to economic
responsibilities than
Swedish consumers.
H9: Spanish consumers
allocate more
importance to legal
responsibilities than
Swedish consumers.
H10: Swedish
consumers allocate more
importance to ethical
responsibilities than
Spanish consumers.
H11: Swedish
consumers allocate more
importance to
philanthropic
responsibilities than
Spanish consumers.
44
Summary
In this chapter we have presented the empirical data as well as our analysis. The
empirical data has been presented in different tables both in the chapter and the
Appendix. In addition, analysis of the realiability and the validity of the data were
conducted. Our findings show that most of the data collected in the Swedish sample
was reliable while in the Spanish sample a large portion seemed to be highly
unrealiable. Lastly, we answered each hypothesis by either rejecting or accepting the
null hypotheses; this was done through our t-tests. We will now move onto the
conclusion part of the thesis, where we will be able to dig deeper into the reasons
behind the rejections and acceptances of each presented hypothesis. Consequently, we
will reach a detailed answer to the purpose of this thesis.
45
5 Findings & Conclusions In this chapter, the purpose presented in chapter 1 will be answered and each
hypothesis will be fully discussed, thus fulfilling the purpose of this thesis. Through
our analysis in the previous chapter, conclusions and findings drawn from our
empirical data will be presented. Thereafter, overall conclusions will be presented.
Finally, implications for theory, implications for practitioners, and implications for
future research along with limitations will be presented.
5.1 Conclusion
The purpose of this research was to measure and describe consumers’ willingness to
purchase clothes from socially responsible brands in both Sweden and Spain. The
second part of our research was to describe the customers’ perceived importance of
each layer of responsibility presented by Carroll (1991), in both Sweden and Spain.
Lastly, the study aimed to describe the differences between Spanish and Swedish
perception of CSR. In this chapter we will discuss the purpose of our research through
our proposed hypothesis and our findings in the analysis chapter. This will be done by
addressing the different cultural differences as well as previous work in the field. As
this has been done, the purpose of this research will have been reached.
When measuring consumer willingness to purchase clothes from a socially
responsible fashion brand, H1 was proposed: Spanish consumers will give more
support socially responsible fashion brands than Swedish consumers. According to
our findings above, our obtained results support our hypothesis. Through our
interpretation we believe that the cause of this can be explained by the communitarian
culture of Spain. As stated in chapter two, Hofstede explained that countries that are
more communitarian are believed to place a larger importance to the well being of a
society (The Hofstede Center, s.a.). Moreover, when comparing our results to
Maignan (2001) we also see that both countries; Sweden and Spain are willing to
support socially responsible companies. Another observation made is that even
though a country is going through an economic crisis, the economic responsibility of
CSR may not be the most important responsibility for companies to consider, the
other three seem just to be as important.
The second part of the purpose was to describe customers’ perceived importance of
each layer of responsibility of CSR. We aimed to reach a conclusion regarding this
with the hypothesis 2-7. Our results obtained for hypothesis 2-4 as stated in the
analysis, showed that we did not have significant evidence to state that Spanish
consumers place more importance to the economic responsibility of CSR than to the
philanthropic, ethical and legal responsibilities. These findings indicate as proposed in
Maignan’s (2001) study that communitarian cultures place more importance to the
wellbeing of a society than to the economic position. Moreover, this also shows

46
evidence towards the fact that a country facing economic hardships does not
necessarily indicate that the country will place more importance to the economic
responsibility of a firm than the other three layers of Carroll’s pyramid.
Hypothesis 5-7 regarded the Swedish sample. Our findings show that Swedish
consumers in fact place more importance to the economic responsibility of CSR than
to the philanthropic. This result was quite puzzling to us, however according to
Maignan (2001) as Sweden is an individualistic country; therefore they will place a
large importance on the economic responsibility of a firm. Moreover, the result
obtained from hypothesis 6 shows that Swedish consumers place a larger importance
to the ethical dimension of CSR than to the economic. This could be explained by
Hofstede’s cultural framework. As mentioned in the theoretical chapter of this thesis,
Sweden is a country of “Lagom” it means that everything comes in moderation
where, no one goes with too much or too little. Thus, this result could be reflected
back upon the ethical views of the Swedes. The last hypothesis in this segment
showed that Swedish consumers place a larger importance to the legal dimension of
CSR than to the economic. To us, this was not very puzzeling as firms are required to
follow the law. However, a plossible cause for this could be the Swede’s need for set
and defined rules as apposed to the Spanish laid back attitude to life.
The last part of the purpose was to describe the differences between Spanish and
Swedish perception of CSR, we did this through proposing hypothesis 8-11. The
result from hypothesis 8 showed that there is not enough significant evidence from
our data to state that Spanish consumers allocate more importance to economic
responsibilities than Swedish consumers. This is also an indication of the
communitarian aspect of the Spanish culture. Furthermore, hypothesis 9 showed that
Spanish consumers do not allocate more importance to the legal dimension than
Swedish consumers. The easy way of life in Spain has also seemed to put its traces on
consumer perception. The reality is that the importance of the legal responsibility is
not higher in Spain than Sweden which can be explained by the Spanish laidback
attitude to life. Moreover, hypothesis 10 showed that there is not significant evidence
to state that Swedish consumers will allocate more importance to ethical
responsibilities than Spanish consumers. Lastly, the results obtained for hypothesis 11
show that Spanish consumers allocates more importance to philanthropic
responsibilities than Swedish consumers. All these conclusions can be reflected back
upon the culture of the nations. As mentioned earlier the communitarian culture of
Spain indicates that they place well being of a society as a high priority. While, in
Sweden the individualistic society places more importance to the economic
responsibilities of firms.
In conclusion, through answering our proposed hypotheses we have been able to
reach the purpose of this research. In the next section we will conclude our overall
conclusion of the research we have conducted.

47
5.1.1 General Reflections
We would like to mention that conducting a survey has been a challenge for us not
only due to the statistical analysis but also on how to collect the data. However, we
believe that this experience has helped us enrich our studies further. Although this
research technique is usually not done in a bachelor paper, we believe it has given us
a good work experience for the future. The collection of data was hard due to the
short time span as well as the language barriers. Even though these barriers are most
likely the cause to our unreliable data we still believe that some of our findings
contribute to previous theory.
When conducting our survey, we walked around the University of Valencia to collect
90 percent of the respondents. There was no real mean of doing this randomly, but
simply to collect as many responses as possible. This has probably affected our
Spanish results, thus the reliability of the Spanish sample as mentioned in the
analysis. However, to our surprise we managed to receive about as many men as
women to answer our survey. On the other hand, we found that males were more open
and happy to partake in our research than females in Spain. As for the Swedish
sample there was no real way of assuring that only university students responded to
our survey hence, making us question the Swedish sample as well. In conclusion, we
understand that our results may be unreliable. Nevertheless, we still believe that this
research has given some contributions to the field of consumer perception of CSR
within the fashion industry in Sweden and Spain.
5.2 Implications for Theory
Our belief that we have contributed to previous research will be presented in this
section. Our research has provided insight into the Swedish and Spanish market of
consumer perception of CSR by disposing or accepting our proposed hypotheses. The
study has examined the fashion industry and has therefore, provided a niche of
research within theory of CSR. Moreover, the research shows the importance of CSR
for each market but also comparing which market places more importance to the
different dimensions of CSR. No other research has done this in the Swedish and
Spanish market yet. Though, our results may be questioned regarding its reliability
and validity. Nonetheless, the conclusions drawn from our research points out
different implications for companies and other organizations involved with CSR in
both Sweden in Spain in the fashion industry, which will be discussed below.
5.3 Implications for Practitioners
The implications for practitioners can be described as the advice we give to those who
are involved in the fashion industry in Sweden and Spain. This includes not only
Swedish and Spanish retail stores, but also those who have set up shops in the two
countries. Furthermore, advice to different organizations will be presented, for those
who practice work towards better engaging society into the field of CSR.

48
The implications are based on the analysis of our data as well as the conclusions
drawn from the collected data. We will focus on both the Swedish and Spanish
consumer base as a mean of expressing our advice. These views as already stated in
the literature review may influence the shopping behaviour and thus retail company’s
profits. Not only this, but in the long run even societies as a whole.
Firstly, our findings indicate that Spanish consumers support socially responsible
companies to a larger extent than Swedish consumers. This means that it may be
beneficial for companies in Spain to advertise their work with CSR. However, if they
are not involved with such work, it may also be important for them to start working
with CSR and incorporating it into their business model in order to attract more
customers. When addressing the implications for practitioners, the government in
Sweden could for example use media to inforce the importance of socially responsible
companies as to increase the support of socially responsible companies. Other
organizations such as Avaaz could put more pressure on this.
Secondly, as mentioned above our findings state that there is not enough significant
evidence to state that Spanish consumers place more importance to economic
responsibilities than to the other three dimensions of CSR. Thus, companies should
not only press their economic responsibilities in Spain but also the other three
dimensions into their business model.
Moreover, in the Swedish sample, consumers tend to place more importance to the
economic dimension of CSR than to the philanthropic. This indicates the need for
retail companies in Sweden to stress the importance of economic responsibilities over
the philanthropic responsibilies. Further, the ethical dimension seems to be more
important than the economic. Also, the legal dimension is more important than the
economic dimension of CSR in Sweden. This indicates the need for the fashion
industry in Sweden to take responsibility over their ethical and legal responsibilities
over their economic. For example, it could be important for H&M to address their
legal issues in Bangladesh as mentioned in Chapter one. This could in fact help better
the image of the company and in the end increase sales. However, it does not mean
that the economic responsibilities can be overlooked.
In addition, as mentioned earlier there is not significant evidence to state that Spanish
consumers allocate more importance to economic responsibilities than Swedish
consumers. Therefore, we would advice companies to operate and market their
economic responsibilities in both nations equally. They should also address the
economic responsibilities within their business model as well as to society.
Furthermore, Spanish consumers do not allocate more importance to legal
responsibilities than Swedish consumers do. This obviously indicates the need for
companies to fully abide by the law. H&M could take advantage of this opportunity
by signing the petition for the betterment for the Bangladesh factory and market this

49
in both Sweden and Spain. This may help increase sales, as consumers in both Spain
and Sweden allocate importance to the legal dimension. Likewise, the rejection of the
hypothesis: Swedish consumers will allocate more importance to ethical
responsibilities than Spanish consumers, indicates perhaps an equal need for ethical
responsibilities in both Sweden and Spain. Lastly, in Spain it may be beneficial for
fashion companies to partake in philanthropic activities as this dimension of CSR was
significantly more important in Spain than Sweden. Philanthropic activities could be
those where companies donate money or time to the betterment of a society. For
example, according to our findings campaigns supporting cancer research could be
used in Spain to a larger extent than in Sweden in the hope of increasing support and
sales for the fashion company.
5.4 Implications for Future Research
There are a few suggestions to future research based on this study. First, identify
whether Carroll’s definition of CSR is relevant. If so, questions regarding if that
definition is appropriate to measure consumers’ perception of CSR should be taken
into account. Secondly, the awareness of CSR with fashion consumers could also be
studied to investigate whether CSR even plays a role while shopping. Moreover,
future research should also take into account larger samples with a higher level of
sampling as well as professional translations of the developed survey. Lastly, research
examining consumer intent vs. behaviour could be of importance for companies since,
consumer intentions and behaviour during a purchase differs. Thus, studies
identifying these measures could be useful for companies when investigating their
work with CSR. For example, does work with CSR only influence consumer intent or
also the purchasing behaviour? Moreover, further studies could focus on any industry,
not only the fashion industry. Therefore, in a sense any global industry could be
examined between any countries either those which are somewhat culturally similar
or culturally very different.
5.5 Limitations
When conducting this research we stumbled upon a few limitations. The most evident
limitation is that the entire research is based on Carroll’s definition subsequently,
limiting the study. Other definitions may have been more appropriate to use when
basing the study on consumer perception of CSR. Furthermore, the sample size of our
study is not big enough to categorize an entire nation’s perception on. In addition, a
large portion of the sample in Sweden was from the university students at Luleå
University of Technology and the entire Spanish sample came from the University of
Valencia. Consequently, sampling was not done on a national level.
Further, the translation of the survey into Swedish may have caused some confusion
for participants and may not have conveyed the appropriate meaning. Additionally,
our Spanish was not at a level where we could appropriately translate the survey.

50
Therefore, respondents in Spain took the survey in English, which most likely caused
confusion and misunderstandings. As mentioned in the previous chapter, a large
portion of the data collected in Spain was unreliable which we believe is due to the
large language barrier, which presented itself. We believe the language barrier caused
several misunderstandings, which has skewed several answers and thus our overall
results. Another limitation was how to reach our sample. An open Facebook group
was used to reach as many university students as possible in Sweden; however on
second thought this enabled principally anyone to answer the survey, thus making us
question the collected data not only in Spain but also in Sweden.

51
References
(October 2010). A Guide to CSR in Europe: Country Insights by CSR
Europe’s National Partner Organisations. CSR Europe. Retrieved April 2013, From
http://www.csreurope.org/data/files/20091012_a_guide_to_csr_in_europe_final.pdf
Arli, D. I. and Lasmono, H. K. (2010), Consumers' perception of corporate
social responsibility in a developing country. International Journal of Consumer
Studies, 34: 46–51.
Avaaz, (2013). The World in Action. In To the CEOs of H&M, GAP, and
other fashion brands. Retrieved May 17, 2013.
Received from http://www.avaaz.org/en/crushed_to_make_our_clothes_loc/?fp
Babakus, E., B. Cornwell, V. Mitchell and B. Schlegelmilch (1994). Reactions
to Unethical Consumer Behavior Across Six Countries. Journal of Consumer
Marketing, 21(4), 254–263.
Berger R., Casella G. (2002). Statistical Inference. USA: Wadsworth Group
Blodgett, J. G., Bakir, A., & Rose, G. M. (2008). A test of the validity of
hofstede's cultural framework. The Journal of Consumer Marketing, 25(6), 339-349.
Boulstridge, E. & Carrigan, M. (2000). Do consumers really care about
corporate responsibility? Highlighting the attitude-behaviour gap. Journal of
Communication Management, 4, 355-368.
Bowen, H.R. (1953). Social responsibilities of the businessman. New York:
Harper & Row.
Bradley Quinn. (February 9, 2007). The Official Gateway to Sweden. In
Sustainable styles — can Swedish fashion save the planet?. Retrieved April 15, 2013,
from http://www.sweden.se/eng/Home/Lifestyle/Fashion-design/Reading/Sustainable-
Fashion/.
Bray, J., Johns, N., & Kilburn, D. (2011). An exploratory study into the factors
impeding ethical consumption. Journal of Business Ethics, 98(4), 597–608.
Brown, T. J., & Dacin, P. A. (1997). The company and the product
Burgen S. and Phillips T. (August 18, 2011). Zara accused in Brazil sweatshop
inquiry. In The Gaurdian. Retrieved April 20, 2013, from
http://www.guardian.co.uk/world/2011/aug/18/zara-brazil-sweatshop-accusation.

52
Carrigan, M. & Attalla, A. (2001). The myth of the ethical consumer – do
ethics matter in purchase behavior? Journal of Consumer Marketing, 18, 560-577.
Carroll, A.B. (1979) A three-dimensional conceptual model of corporate social
performance. Academy of Management Review, 4, 497-505
Carroll, A.B. (1991) The pyramid of corporate social responsibility: toward
the moral management of organizational stakeholders. Business Horizons, 34, 39–48.
Carroll, A.B., and A.K. Buchholtz. (2008). Business and society. Ethics and
stakeholder management. 7th ed: South-Western Cengage Learning.
Crane, A., Matten, D., & Moon, J. (2010). The emergence of corporate
citizenship: Historical development and alternative perspectives. Corporate
Citizenship in Deutschland (pp. 64-91).
Creyer, E. H. and W. T. Ross: 1997, ‘The Influence of Firm Behaviour an
Purchase Intention: Do Consumers Really Care About Business Ethics?’. Journal of
Con- sumer Marketing 14(6), 421–432.
Devinney, T. M., Auger, P., Eckhardt, G., & Birtchnell, T. (2006). The other
CSR: Consumer social responsibility. Stanford Social Innovation Review, Fall 2006.
Available at SSRN: http://ssrn. com/abstract=901863.
Develles R.F (1991). Scale Development. Sage Publications. pp. 24–33. ^
Cronbach LJ (1970). Essentials of Psychological Testing. Harper & Row. p. 161.
DeVellis, R. F. (2011). Scale development: Theory and applications (Vol.26).
Sage Publications, Incorporated.
Du, S., Bhattacharya, C. B., & Sen, S. (2007). Reaping relational rewards from
corporate social responsibility: The role of competitive positioning. International
Journal of Research in Marketing, 24, 224-241.
Du, S., Bhattacharya, C. B., & Sen, S. (2010). Maximizing Business Returns
to Corporate Social Responsibility (CSR): The Role of CSR Communication.
International Journal of Management Reviews, 12, 8-19.
Ekdal, L. (Producer). (2012) H&M och Stefan Persson. [Tv Program].
Sweden: Kalla Fakta.
Ellis, K., & Friedman, A. (2012). The challenges of CSR. WWD, 204(86), 1.
Retrieved from http://search.proquest.com/docview/1138742152?accountid=27917
Freeman, R.E (1984). “Strategic Management: A stakeholder Approach”.
Boston, MA: Pitman.
53
Goig, R. L. (2007), Fair trade and global cognitive orientation: a focus on
Spanish fair trade consumers. International Journal of Consumer Studies, 31: 468–
477.
Handelman, J. M., & Arnold, S. J. (1999). The role of marketing actions with
a social dimension: Appeals to the institutional environment. The Journal of
Marketing, 33-48.
Hauge, A. (2007). Dedicated Followers of Fashion: An Economic Geographic
Analysis of the Swedish Fashion Industry. (Doctoral dissertation). Uppsala:
Kulturgeografiska institutionen.
Hofstede, G. (1983) The cultural relativity of organizational practices and
theories. Journal of International Business Studies (Fall), pp. 75–89
Inditex. In Store around the World. Retrieved April 15, 2013, from
http://www.inditex.es/en/who_we_are/stores
Kemp, M.: 2001, Corporate Social Responsibility in Indone- sia: Quixotic
Dream or Confident Expectation?, Tech- nology, Business and Society Programme
Paper No. 6, United Nations Research Institute for Social Development, Geneva.
Kotler P. & Keller L. (2009). A framework for Marketing Management 4th
Edition. Upper Sadle River, New Jersey: Prentice Hall
Laudal, T. (2010). An attempt to determine the CSR potential of the
international clothing business. Journal of business ethics, 96(1), 63-77
Levine, D. M., Berenson, M. L., & Stephan, D. (2008). Statistics for managers
using Microsoft Excel (Vol. 660). Upper Saddle River, NJ: Prentice Hall.
Lodge, G. C. (1990). Comparative Business-Government Relations (Prentice-
Hall, Englewood Cliffs, NJ)
Loureiro, S., Sardinha, I., & Reijnders, L. (2012). The effect of corporate
social responsibility on consumer satisfaction and perceived value: the case of the
automobile industry sector in Portugal. Journal of Cleaner Production.
Maignan, I., Ferrell, O. C., & Hult, G. T. (1999). Corporate citizenship:
Cultural antecedents and business benefits. Journal of the Academy of Marketing
Science, 27(4), 455-469.
Maignan, I. and O. C. Ferrell: 2000, ‘Measuring Corporate Citizenship in Two
Countries: The Case of the United States and France’, Journal of Business Ethics 23,
54
283–297.
Maignan, I. (2001). Consumers' perceptions of corporate social
responsibilities: a cross-cultural comparison. Journal of Business Ethics, 30(1), 57-72.
Maignan, I., & Ferrell, O.C. (2003). Nature of corporate responsibilities:
Perspectives from American, French, and German consumers. Journal of Business
Research, 56, 55-67.
Maignan, I., Ferrell, O. C., & Ferrell, L. (2005). A stakeholder model for
implementing social responsibility in marketing. European Journal of
Marketing,39(9/10), 956-977.
Malhotra. K.N. (2004). Marketing Research: An Applied Approach. Upper
Saddle River, New Jersey: Pearson Education Inc.
Malhotra. N. (2007). Marketing Research: An Applied Orientation. Upper
Saddle River, New Jersey: Pearson Education Inc.
Marshall, C., & Rossman, G. B. (1995). Data collection methods. Designing
qualitative research, 2.
Miles, M. B., & Huberman, A. M. (1994). Qualitative data analysis: An
expanded sourcebook. Sage Publications, Incorporated.
Mohr, L. A. and Webb, D. (2005). The effects of corporate social
responsibility and price on consumer responses. Journal of Consumer Affairs 39 (1) :
20 – 37
Newbold, P., Carlson, W. L., & Thorne, B. (2007). Statistics for business and
economics. Pearson
Newbold, P., Carlson, W. L., & Thorne, B. (2010). Statistics for business and
economics. New Jersey: Prentice Hall
Patel, R., & Davidson, B. (2003). Forskningsmetodikens grunder. Att planera,
genomföra och rapportera en undersökning. Ort: Förlag
Polonsky, M. J., Brito, P. Q., Pinto, J., & Higgs-Kleyn, N. (2001). Consumer
ethics in the European Union: A comparison of northern and southern views. Journal
of Business Ethics, 31(2), 117–130.
Pomering, A., & Dolnicar, S. (2009). Assessing the prerequisite of successful
CSR implementation: Are consumers aware of CSR initiatives? Journal of Business
55
Ethics, 85, 285–301.
Ramasamy, B., & Yeung, M. (2009). Chinese consumers' perception of
corporate social responsibility (CSR). Journal of Business Ethics, 88, 119-132.
doi:http://dx.doi.org/10.1007/s10551-008-9825-x
Rawwas, M. Y. (2001). Culture, personality and morality: A typology of
international consumers’ ethical beliefs. International Marketing Review, 18(2), 188-
211.
Rawwas, M., S. Ziad and O. Mine. (2005). Consumer Ethics: A Cross-Cultural
Study of the Ethical Beliefs of Turkish and American Consumers, Journal of Business
Ethics 57(2), 183
Saunders, M., Lewis, P. & Thornhill, A. (2009). Research Methods for
Business Students. Fifth Edition. Harlow: Pearson Education Limited.
Sen, S. & Bhattacharya, C. B. (2001). Does Doing Good Always Lead to
Doing Better? Consumer Reactions to Corporate Social Responsibility. Journal of
Marketing Research, 38, 225-243.
Sen, S., Bhattacharya, C. B., & Korschun, D. (2006). The Role of Corporate
Social Responsibility in Strenghtening Multiple Stakeholder Relationships: A Field
Experience. Journal of Academy of Marketing Science, 34, 158-166.
Singh, J., & del Bosque, I. R. (2008). Understanding corporate social
responsibility and product perceptions in consumer markets: A cross-cultural
evaluation. Journal of Business Ethics, 80(3), 597-611.
Smith, N. Craig. (1996). ‘Corporate Citizens and Their Critics’, The New York
Times (September 8), 11.
Smith, N.Craig. (2003) Corporate social responsibility: whether or how?
California Management Review, 45, 52–76.
The European Commission, Plan, A. (2001). Communication from the
Commission to the European Parliament, the Council, the European Economic and
Social Committee and the Committee of the Regions.
The Hofstede Centre. In National Cultures Countries. Retrieved April 15,
2013. Received from http://geert-hofstede.com/spain.html
The Hofstede Centre. In National Culture Dimensions. Retrieved April 15,
2013. Received from http://geert-hofstede.com/dimensions.html
56
The World Factbook. In Spain. Retrieved April 20, 2013. Received from
https://www.cia.gov/library/publications/the-world-factbook/geos/sp.html
The World Factbook. In Sweden. Retrieved April 20, 2013. Received from
https://www.cia.gov/library/publications/the-world-factbook/geos/sw.html
Visit Sweden. In Swedish Fashion. Retrieved May 1, 2013, from
http://www.visitsweden.com/sweden/things-to-do/shopping/swedish-fashion/
Williams, C. A., & Aguilera, R. V. (2008). Corporate social responsibility in a
comparative perspective. Oxford handbook of corporate social responsibility, 452-72.
Zikmund, W. G., & Babin, B. J. (2007). Essentials of Marketing Research
(Book Only). South-Western Pub.
Zikmund, W. G., & Babin, B. J. (2009). Essentials of Marketing Research
(Book Only). South-Western Pub.
berseder, M., Schlegelmilch, B. B., ruber, V. (2011). “Why Don’t
Consumers Care About CSR?”: A Qualitative Study Exploring the Role of CSR in
Consumption Decisions. Journal of Business Ethics, 104, 449-460.

Appendix 1 A
Survey in English
Hi!
The purpose of this survey is to study if there are any differences in consumers’
perception of CSR. By participating in this survey you will help with important
information which will be used as the foundation of our research. (OBS, ONLY
SPANISH STUDENTS)
The questionnaire is constructed by two international business students writing their
final bachelor thesis at Luleå University of Technology in Sweden. All responses will
be anonymous and if you have any questions please contact us at:
Gender: Male
Woman
Age:…………
Education:
Ongoing education
Bachelor
Master
PhD
About how much do you spend on clothes per month?
0-50 Euro
51-100 Euro
101-150 Euro
151-200 Euro
201-250 Euro
251-300 Euro
300 + Euro

Fill in how much you agree with the following statements below:
The social responsibility of businesses encompasses the economic, legal, ethical, and
discretionary expectations that society has of organizations at a given point in time.
1. I would pay more to buy
products from a socially
responsible fashion
company
2. I consider the ethical
reputation of fashion
businesses when I shop
3. I avoid buying products
from fashion companies
that have engaged in
immoral actions
4. I would pay more to buy
products from fashion
companies that show
care for the well-being
of our society
5. If the price and quality
of two products were the
same, I would buy from
a fashion firm that has a
socially responsible
reputation
Strongly
Disagree Somewhat
Disagree Neutral
Somewhat
Agree Strongly
Agree

I belive that fashion companies must..
6. Maximize
profits.
7. Control their
production costs
strictly.
8. Plan for their
long-term
success.
9. Always improve
economic
performance.
10. Ensure that their
employees act
within the
standards defined
by the law.
11. Refrain from
putting aside
their contractual
obligations.
12. Refrain from
bending the law
even this helps
improve
performance.
13. Always submit
to the principles
defined by the
regulatory
system.
14. Permit ethical
concerns to
negatively affect
economic
performance.
15. Ensure that the
respect of ethical
principles has
priority over
economic
performance.
16. Be committed to
well-defined
Strongly
Disagree Somewhat
Disagree Neutral Somewhat
Agree Strongly
Agree

ethical
principles.
17. Avoid
compromising
ethical standards
in order to
achieve
corporate goals.
18. Help solve social
problems.
19. Participate in the
management of
public affairs.
20. Allocate some of
their resource to
philanthropic
activities.
21. Play a role in our
society that goes
beyond the mere
generation of
profits.
Your answer is registered! Thank you for your help/ Sofie & Carin

Appendix 1 B
Survey in Swedish
Din uppfattning om modeföretags samhällsansvar
Hej! Vi skriver just nu vår C-uppsats och det skulle uppskattas om ni kunde svara på
vår enkät! DOCK BARA FÖR UNIVERSITETS STUDENTER.
Syftet med enkäten är att undersöka konsumenters uppfattning om modeföretags
samhällsansvar (CSR). Genom ditt deltagande bidrar du med betydelsefulla
synpunkter som kommer att vara underlaget i vår forskning.
Enkäten är konstruerad av två ekonom-studenter som skriver sin slutliga
kandidatuppsats vid Luleå tekniska universitet. Alla svar kommer att vara anonyma
och om ni har några frågor var vänlig kontakta:
Sofie Mälstad (student vid Luleå tekniska universitet)
Mobil nr; 0725867686 eller genom mail: [email protected]
Kön: Man
Kvinna
Ålder:…………
Utbildning:
Pågående utbildning
Kandidat
Magister
Master
Doktorerar
Ungefär hur mycket pengar lägger du på kläder per månad?
0-500 Kr
501-1000 Kr
1001-1500 Kr
1501-2000 Kr
2001-2500 Kr
2501-3000 Kr
300 + Kr

Nedan följer några påståenden, fyll i hur mycket du håller med om respektive
påstående:
Företags samhällsansvar kallas idén att företag ska ta ansvar för hur de påverkar
samhället, ur såväl ett ekonomiskt, miljömässigt som socialt perspektiv.
1. Jag skulle kunna
tänka mig att betala mer
för produkter som är
tillverkade hos
modeföretag som är
samhällsansvariga
2. Jag tänker på
modeföretagets etiska
rykte när jag handlar
3. Jag undviker att köpa
produkter från
modeföretag som arbetar
omoraliskt
4. Jag skulle kunna tänka
mig att betala mer för
produkter producerade
av modeföretag som
visar omsorg för
samhället
5. Om pris och kvalitet på
två modeprodukter är
lika, skulle jag köpa från
det modeföretag som har
ett rykte att vara socialt
ansvarstagande
Instämmer
inte alls Instämmer
delvis inte Neutral Instämmer
delvis Instämmer
helt

Jag tycker att modeföretag måste…
6. Maximera
sin vinst
7. Kontrollera
produktions-
kostnaderna strikt
8. Planera långsiktigt
för sina
ekonomiska mål
9. Alltid förbättra sin
vinst
10. Se till att de
anställda följer
standarder som
regleras i lagen
11. Inte avstå från
avtalsförpliktelser
12. Inte avvika från
lagar även om det
kan ge
ekonomiska
fördelar
13. Alltid använda
de principer som
fastställts av
lagsystemet
14. Ta etiskt ansvar
även om det
påverkar det
ekonomiska
resultatet negativt
15. Se till att det
etiska ansvaret går
före det ekonomiska
resultatet
16. Följa etiska
principer (ex,
modeföretag
Instämmer
inte alls Instämmer
delvis inte Neutral Instämmer
delvis Instämmer
helt

måste bete sig etiskt
rätt)
17. Att inte frångå det
som är etiskt
riktigt för att uppnå
företagets mål
18. Hjälpa till att lösa
sociala problem
19. Engagera sig i vad
som händer i
offentlig förvaltning
20. Fördela en del av
sina resurser till att
förbättra samhället
(ex, donera pengar
till välgörenhet)
21. Spela en roll i vårt
samhälle som går
utöver att enbart
generera vinst
Ditt svar är registrerat. Tack för din medverkan/ Sofie & Carin

Appendix 2 Answers of Questions 1-5
Support for Corporate Social Responsibility in Each Country
Question: Sweden Spain
1. I would pay more to buy
products from a socially
responsible company: Strongly Disagree 13% 7%
Somewhat Disagree 10% 14%
Neutral 18% 21%
Somewhat Agree 46% 48%
Strongly Agree 13% 11%
2. I consider the ethical
reputation of fashion
businesses when I shop: Strongly Disagree 20% 7%
Somewhat Disagree 29% 13%
Neutral 24% 34%
Somewhat Agree 24% 34%
Strongly Agree 3% 13%
3. I avoid buying products
from fashion companies
that have engaged in
immoral actions: Strongly Disagree 24% 5%
Somewhat Disagree 33% 20%
Neutral 16% 22%
Somewhat Agree 21% 30%
Strongly Agree 7% 22%
4. I would pay more to buy
products from fashion
companies that show
care for the well-being
of our society: Strongly Disagree 9% 4%
Somewhat Disagree 13% 6%
Neutral 18% 20%
Somewhat Agree 45% 45%
Strongly Agree 16% 25%
5. If the price and quality of
two products are the same,
I would buy from a fashion
firm that has a socially
responsible reputation: Strongly Disagree 9% 4%
Somewhat Disagree 4% 8%
Neutral 5% 9%
Somewhat Agree 21% 29%
Strongly Agree 61% 50%

5.4.1.1 Appendix 3 Answers of Question 6-21
Evaluation of Corporate Social Responsibilities in Each Country
I believe fashion business must: Sweden Spain
6. Maximize profits: Strongly Disagree 12% 9%
Somewhat Disagree 18% 12%
Neutral 19% 18%
Somewhat Agree 37% 46%
Strongly Agree 13% 16%
7. Control their production
costs strictly: Strongly Disagree 3% 4%
Somewhat Disagree 8% 8%
Neutral 25% 28%
Somewhat Agree 45% 35%
Strongly Agree 19% 25%
8. Plan for their long term success: Strongly Disagree 2% 3%
Somewhat Disagree 3% 2%
Neutral 10% 26%
Somewhat Agree 39% 41%
Strongly Agree 46% 28%
9. Always improve economic
performance: Strongly Disagree 8% 1%
Somewhat Disagree 18% 13%
Neutral 32% 23%
Somewhat Agree 29% 45%
Strongly Agree 14% 18%
10. Ensure that their employees
act within the standards
defined by the law: Strongly Disagree 3% 1%
Somewhat Disagree 1% 3%
Neutral 8% 16%
Somewhat Agree 28% 29%
Strongly Agree 61% 51%
11. Refrain from putting aside their
contractual obligations: Strongly Disagree 1% 4%
Somewhat Disagree 4% 7%
Neutral 10% 39%
Somewhat Agree 19% 27%
Strongly Agree 66% 23%
12. Refrain from bending the law even
this helps improve performance: Strongly Disagree 2% 10%
Somewhat Disagree 3% 14%
Neutral 8% 37%
Somewhat Agree 13% 24%
Strongly Agree 74% 16%
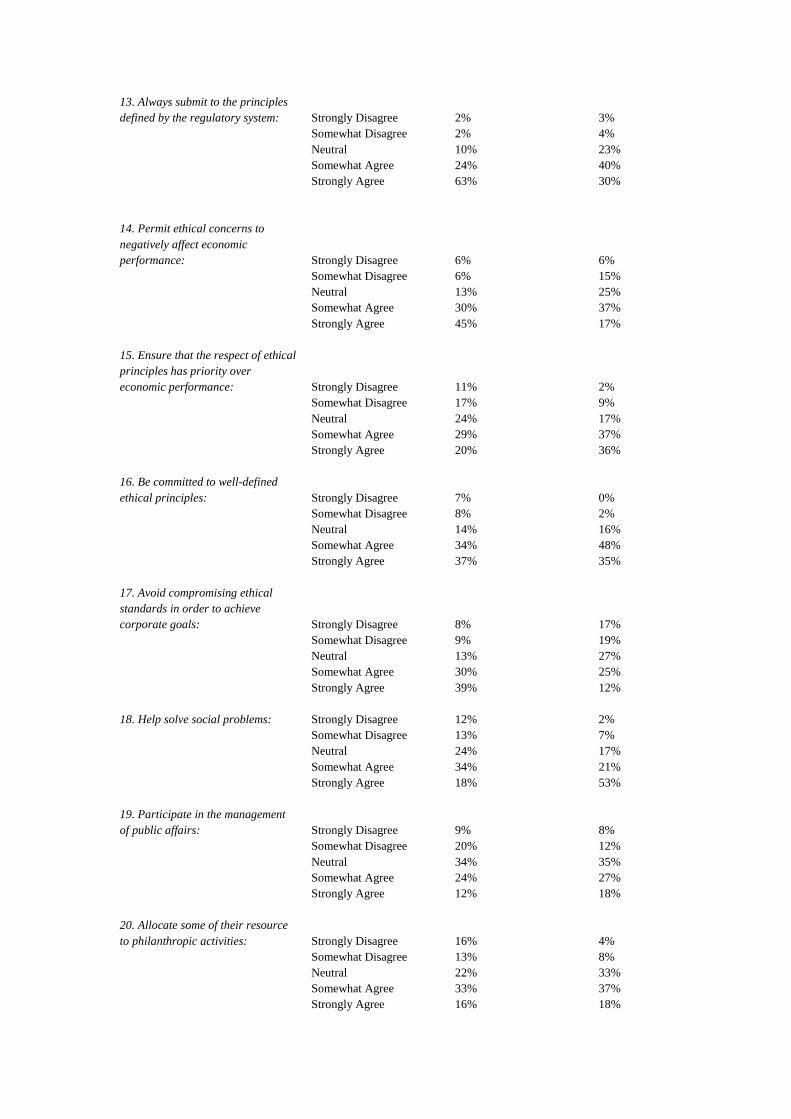
13. Always submit to the principles
defined by the regulatory system: Strongly Disagree 2% 3%
Somewhat Disagree 2% 4%
Neutral 10% 23%
Somewhat Agree 24% 40%
Strongly Agree 63% 30%
14. Permit ethical concerns to
negatively affect economic
performance: Strongly Disagree 6% 6%
Somewhat Disagree 6% 15%
Neutral 13% 25%
Somewhat Agree 30% 37%
Strongly Agree 45% 17%
15. Ensure that the respect of ethical
principles has priority over
economic performance: Strongly Disagree 11% 2%
Somewhat Disagree 17% 9%
Neutral 24% 17%
Somewhat Agree 29% 37%
Strongly Agree 20% 36%
16. Be committed to well-defined
ethical principles: Strongly Disagree 7% 0%
Somewhat Disagree 8% 2%
Neutral 14% 16%
Somewhat Agree 34% 48%
Strongly Agree 37% 35%
17. Avoid compromising ethical
standards in order to achieve
corporate goals: Strongly Disagree 8% 17%
Somewhat Disagree 9% 19%
Neutral 13% 27%
Somewhat Agree 30% 25%
Strongly Agree 39% 12%
18. Help solve social problems: Strongly Disagree 12% 2%
Somewhat Disagree 13% 7%
Neutral 24% 17%
Somewhat Agree 34% 21%
Strongly Agree 18% 53%
19. Participate in the management
of public affairs: Strongly Disagree 9% 8%
Somewhat Disagree 20% 12%
Neutral 34% 35%
Somewhat Agree 24% 27%
Strongly Agree 12% 18%
20. Allocate some of their resource
to philanthropic activities: Strongly Disagree 16% 4%
Somewhat Disagree 13% 8%
Neutral 22% 33%
Somewhat Agree 33% 37%
Strongly Agree 16% 18%

21. Play a role in our society that
goes beyond the mere generation
of profits: Strongly Disagree 10% 2%
Somewhat Disagree 10% 6%
Neutral 27% 21%
Somewhat Agree 32% 40%
Strongly Agree 21% 31%


![Commitment Issues 20160603 - DiVA portalmdh.diva-portal.org/smash/get/diva2:957148/FULLTEXT01.pdf · Bilaga 1 - Deskriptiv statistik ..... commitment, n. [kəˈmɪtm(ə)nt] 1) An](https://static.fdocuments.us/doc/165x107/5a75c8ef7f8b9a93088ca62c/commitment-issues-20160603-diva-957148fulltext01pdf-bilaga-1-deskriptiv.jpg)