Awilco LNG Q4 2012 results presentation
24
www.awilcolng.no - 1 - Q4 2012 Jon Skule Storheill Snorre Krogstad
-
Upload
tradewindsnews -
Category
Documents
-
view
231 -
download
0
Transcript of Awilco LNG Q4 2012 results presentation
www.awilcolng.no - 1 -
Q4
2012 Jon Skule Storheill
Snorre Krogstad
www.awilcolng.no - 2 -
This presentation may include certain forward-looking statements, forecasts, estimates, predictions, influences and projections regarding the intent, opinion, belief, various assumptions or current expectations of Awilco LNG (the “Company”) and it’s management with respect to, among other things, (i) goals and strategies, (ii) evaluation of the Company’s markets, competition and competitive position, and (iii) anticipated future performance and trends which may be expressed or implied by financial or other information or statements contained herein.
All statements, other than statements of historical facts, that address activities and events that will, should, could or may occur in the future are forward-looking statements. Words such as “may,” “could,” “should,” “would,” “expect,” “plan,” “anticipate,” “intend,” “forecast,” “believe,” “estimate,” “predict,” “propose,” “potential,” “continue” or the negative of these terms and similar expressions are intended to identify such forward-looking statements.
These forward-looking statements, forecasts, estimates, predictions, influences and projections are not guarantees of future performance and are subject to known and unknown risks, uncertainties and other factors because they relate to events and depend on circumstances that will occur in the future, some of which are beyond our control and difficult to predict. Therefore, actual outcomes and results may differ materially from what is expressed or forecasted in such forward-looking statements, and no representation is made as to the accuracy of these. Among the important factors that could cause actual results to differ materially from those in the forward-looking statements, forecasts, estimates, predictions, influences and projections are: changes in LNG transportation market trends; changes in the supply and demand for LNG; changes in trading patterns; changes in applicable maintenance and regulatory standards; changes in applicable regulations and laws; technological developments affecting gas and LNG demand; political events affecting production and consumption of LNG; changes in the financial stability of clients of the Company; the Company’s ability to secure employment for available vessels and newbuildings on order; increases in the Company’s cost base; failure by yards to comply with delivery schedules; changes to vessels’ useful lives and residual values; the Company’s ability to obtain financing of the newbuildings and lastly unpredictable or unknown factors with material adverse effects on forward-looking statements.
Neither the receipt of this presentation by any person, nor any information contained herein, constitutes, or shall be relied upon as constituting, any advice relating to the future performance of the Company. Each person should make their own independent assessment of the merits of the Company and its business and should consult their own professional advisors. The information and opinions contained in this presentation relate only as of the date of this presentation, and are subject to change without notice. Neither the Board of Directors of the Company or the Company and it’s management make any representation or warranty, express or implied, as to the accuracy or completeness of this presentation or of the information contained herein and none of such parties shall have any liability for the information contained in, or any omissions from, this presentation, nor for any of the written, electronic or oral communications transmitted to the recipient in the course of the recipient’s own investigation and evaluation of the Company or its business. Unless legally required, the Company assumes no responsibility or obligation to update publicly or review any of the forward-looking statements contained herein, whether as a result of new information, future events or otherwise.
Disclaimer
www.awilcolng.no - 3 -
Agenda 27/2
1. Company overview and Highlights Q4
2. Q4 Financials
3. Market update
4. Summary
www.awilcolng.no - 4 -
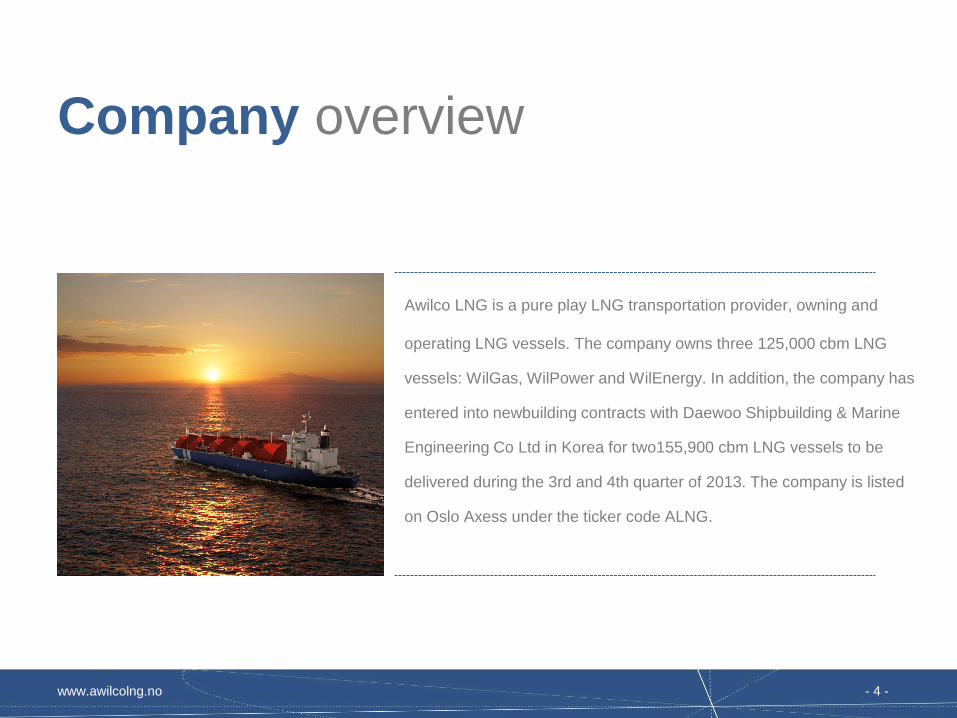
Company overview
Awilco LNG is a pure play LNG transportation provider, owning and
operating LNG vessels. The company owns three 125,000 cbm LNG
vessels: WilGas, WilPower and WilEnergy. In addition, the company has
entered into newbuilding contracts with Daewoo Shipbuilding & Marine
Engineering Co Ltd in Korea for two155,900 cbm LNG vessels to be
delivered during the 3rd and 4th quarter of 2013. The company is listed
on Oslo Axess under the ticker code ALNG.
www.awilcolng.no - 5 -
4th Quarter Highlights
4th quarter 2012
• Awilco LNG reported:
− Net freight income of MUSD 13.4 MUSD 12.3 in Q3 2012
− EBITDA of MUSD 8.0 MUSD 6.5 in Q3 2012
− Net profit of MUSD 6.3 MUSD 5.8 in Q2 2012
• WilGas commenced two year charter in November
• Newbuilding progressing as per schedule
• Vessel utilization of 67% same as last quarter
• Increased market activity and rates at the end of the quarter
Full year 2012
• Awilco LNG reported
- Net freight income of MUSD 52.3 MUSD 20.7 in 2011
- EBITDA MUSD 29.3 MUSD 4.0 in 2011
- Net profit MUSD 21.7 MUSD -3.3 in 2011
www.awilcolng.no - 6 -
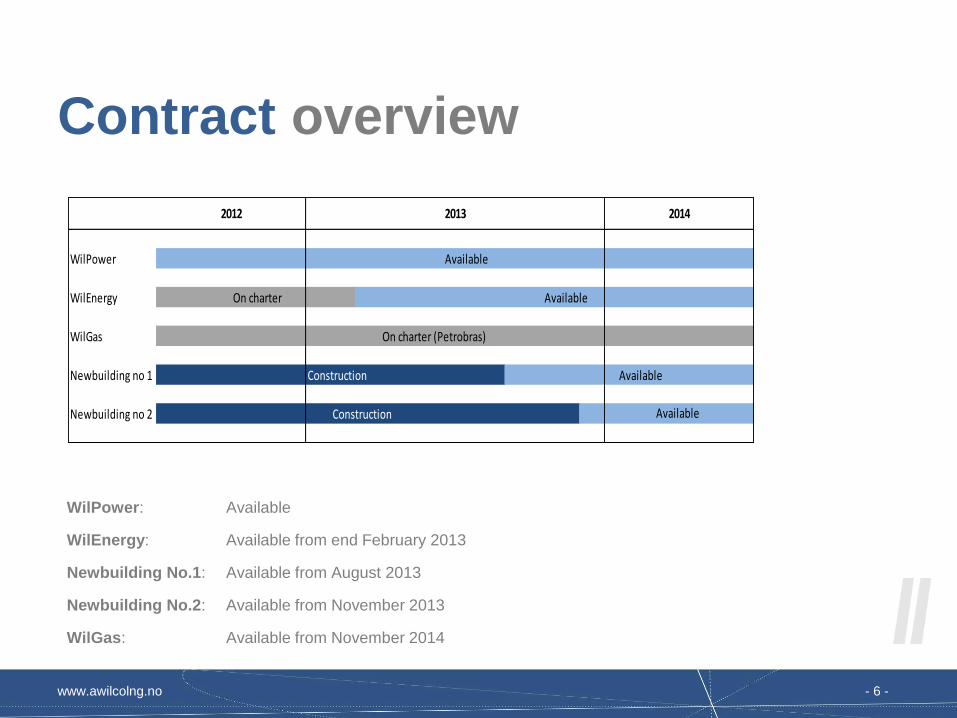
Contract overview
WilPower: Available
WilEnergy: Available from end February 2013
Newbuilding No.1: Available from August 2013
Newbuilding No.2: Available from November 2013
WilGas: Available from November 2014
WilPower Available
WilEnergy On charter Available
WilGas On charter (Petrobras)
Newbuilding no 1 Construction Available
Newbuilding no 2 Construction Available
20142012 2013
www.awilcolng.no - 7 -
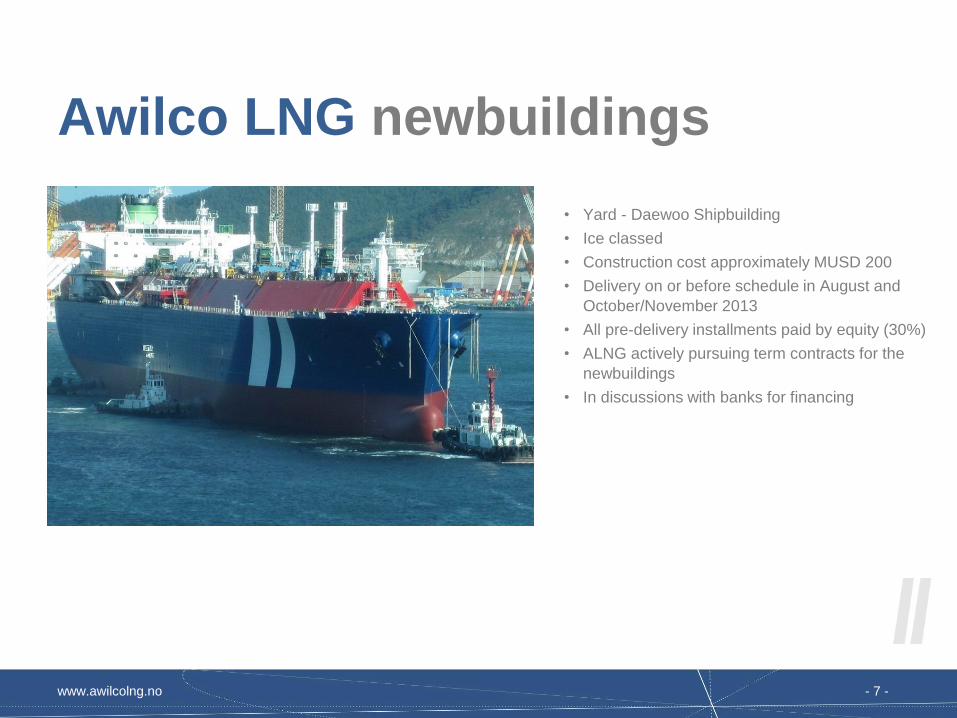
Awilco LNG newbuildings
• Yard - Daewoo Shipbuilding
• Ice classed
• Construction cost approximately MUSD 200
• Delivery on or before schedule in August and
October/November 2013
• All pre-delivery installments paid by equity (30%)
• ALNG actively pursuing term contracts for the
newbuildings
• In discussions with banks for financing
www.awilcolng.no - 8 -
Agenda 27/2
1. Company overview and Highlights Q4
2. Q4 Financials
3. Market update
4. Summary
www.awilcolng.no - 9 -
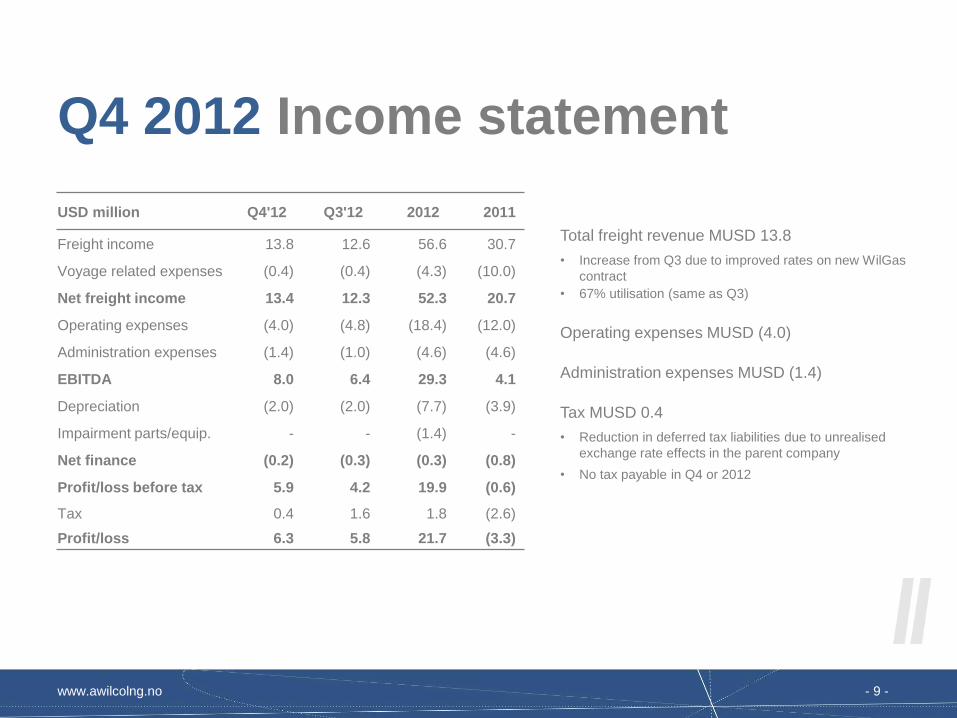
Q4 2012 Income statement
Total freight revenue MUSD 13.8
• Increase from Q3 due to improved rates on new WilGas
contract
• 67% utilisation (same as Q3)
Operating expenses MUSD (4.0)
Administration expenses MUSD (1.4)
Tax MUSD 0.4
• Reduction in deferred tax liabilities due to unrealised
exchange rate effects in the parent company
• No tax payable in Q4 or 2012
USD million Q4'12 Q3'12 2012 2011
Freight income 13.8 12.6 56.6 30.7
Voyage related expenses (0.4) (0.4) (4.3) (10.0)
Net freight income 13.4 12.3 52.3 20.7
Operating expenses (4.0) (4.8) (18.4) (12.0)
Administration expenses (1.4) (1.0) (4.6) (4.6)
EBITDA 8.0 6.4 29.3 4.1
Depreciation (2.0) (2.0) (7.7) (3.9)
Impairment parts/equip. - - (1.4) -
Net finance (0.2) (0.3) (0.3) (0.8)
Profit/loss before tax 5.9 4.2 19.9 (0.6)
Tax 0.4 1.6 1.8 (2.6)
Profit/loss 6.3 5.8 21.7 (3.3)
www.awilcolng.no - 10 -
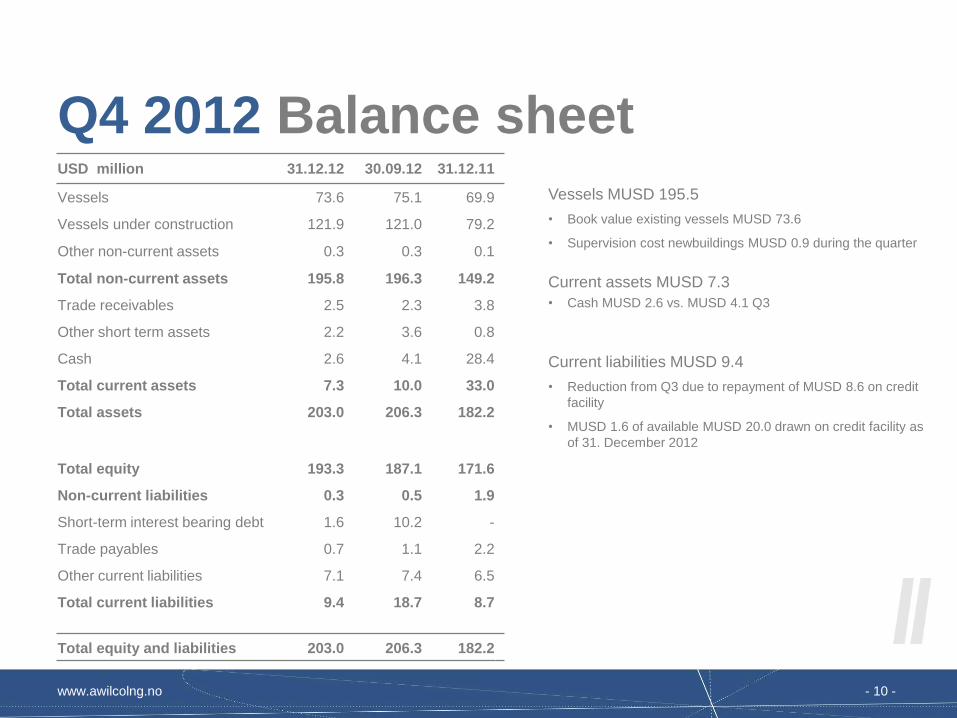
USD million 31.12.12 30.09.12 31.12.11
Vessels 73.6 75.1 69.9
Vessels under construction 121.9 121.0 79.2
Other non-current assets 0.3 0.3 0.1
Total non-current assets 195.8 196.3 149.2
Trade receivables 2.5 2.3 3.8
Other short term assets 2.2 3.6 0.8
Cash 2.6 4.1 28.4
Total current assets 7.3 10.0 33.0
Total assets 203.0 206.3 182.2
Total equity 193.3 187.1 171.6
Non-current liabilities 0.3 0.5 1.9
Short-term interest bearing debt 1.6 10.2 -
Trade payables 0.7 1.1 2.2
Other current liabilities 7.1 7.4 6.5
Total current liabilities 9.4 18.7 8.7
Total equity and liabilities 203.0 206.3 182.2
Q4 2012 Balance sheet
Vessels MUSD 195.5
• Book value existing vessels MUSD 73.6
• Supervision cost newbuildings MUSD 0.9 during the quarter
Current assets MUSD 7.3
• Cash MUSD 2.6 vs. MUSD 4.1 Q3
Current liabilities MUSD 9.4
• Reduction from Q3 due to repayment of MUSD 8.6 on credit
facility
• MUSD 1.6 of available MUSD 20.0 drawn on credit facility as
of 31. December 2012
www.awilcolng.no - 11 -
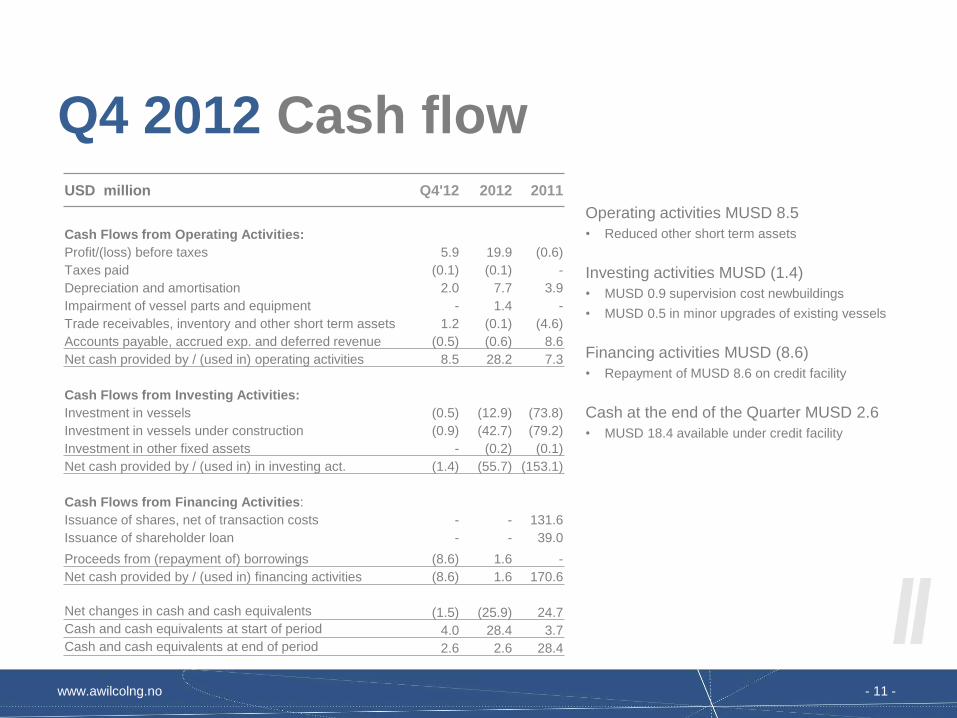
Q4 2012 Cash flow
Operating activities MUSD 8.5
• Reduced other short term assets
Investing activities MUSD (1.4)
• MUSD 0.9 supervision cost newbuildings
• MUSD 0.5 in minor upgrades of existing vessels
Financing activities MUSD (8.6)
• Repayment of MUSD 8.6 on credit facility
Cash at the end of the Quarter MUSD 2.6
• MUSD 18.4 available under credit facility
USD million Q4'12 2012 2011
Cash Flows from Operating Activities:
Profit/(loss) before taxes 5.9 19.9 (0.6)
Taxes paid (0.1) (0.1) -
Depreciation and amortisation 2.0 7.7 3.9
Impairment of vessel parts and equipment - 1.4 -
Trade receivables, inventory and other short term assets 1.2 (0.1) (4.6)
Accounts payable, accrued exp. and deferred revenue (0.5) (0.6) 8.6
Net cash provided by / (used in) operating activities 8.5 28.2 7.3
Cash Flows from Investing Activities:
Investment in vessels (0.5) (12.9) (73.8)
Investment in vessels under construction (0.9) (42.7) (79.2)
Investment in other fixed assets - (0.2) (0.1)
Net cash provided by / (used in) in investing act. (1.4) (55.7) (153.1)
Cash Flows from Financing Activities:
Issuance of shares, net of transaction costs - - 131.6
Issuance of shareholder loan - - 39.0
Proceeds from (repayment of) borrowings (8.6) 1.6 -
Net cash provided by / (used in) financing activities (8.6) 1.6 170.6
Net changes in cash and cash equivalents (1.5) (25.9) 24.7
Cash and cash equivalents at start of period 4.0 28.4 3.7
Cash and cash equivalents at end of period 2.6 2.6 28.4

www.awilcolng.no - 12 -
Agenda 27/2
1. Company overview and Highlights Q3
2. Q3 Financials
3. Market update
4. Summary

www.awilcolng.no - 13 -
• Gas price-spread re-bounced towards the end of the quarter and continued to be firm into the winter market
• Rates improved at the end of the quarter as a result of increased gas price-spread and cargo diversions
Source: Arctic Securities
Rates gas-spread
0
20 000
40 000
60 000
80 000
100 000
120 000
140 000
160 000
-1
1
3
5
7
9
11
1 3 5 7 9 11 1 3 5 7 9 11 1 3 5 7 9 11 1 2
2010 2011 2012 2013
USD/day USD/MMBTU
Gas spread vs. Spot rate
Spread LNG Spot Asia - NBP (Left)
LNG spot rate freight rate (Right)
www.awilcolng.no - 14 -
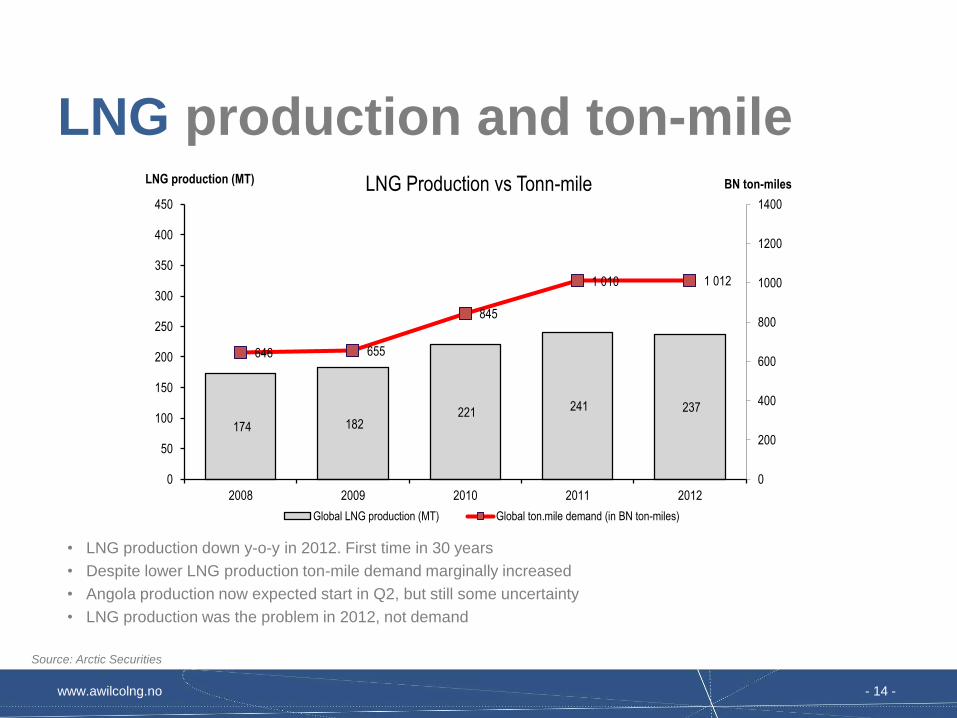
LNG production and ton-mile
• LNG production down y-o-y in 2012. First time in 30 years
• Despite lower LNG production ton-mile demand marginally increased
• Angola production now expected start in Q2, but still some uncertainty
• LNG production was the problem in 2012, not demand
Source: Arctic Securities
174 182 221 241 237
646 655
845
1 010 1 012
0
200
400
600
800
1000
1200
1400
0
50
100
150
200
250
300
350
400
450
2008 2009 2010 2011 2012
LNG production (MT) BN ton-miles LNG Production vs Tonn-mile
Global LNG production (MT) Global ton.mile demand (in BN ton-miles)
www.awilcolng.no - 15 -
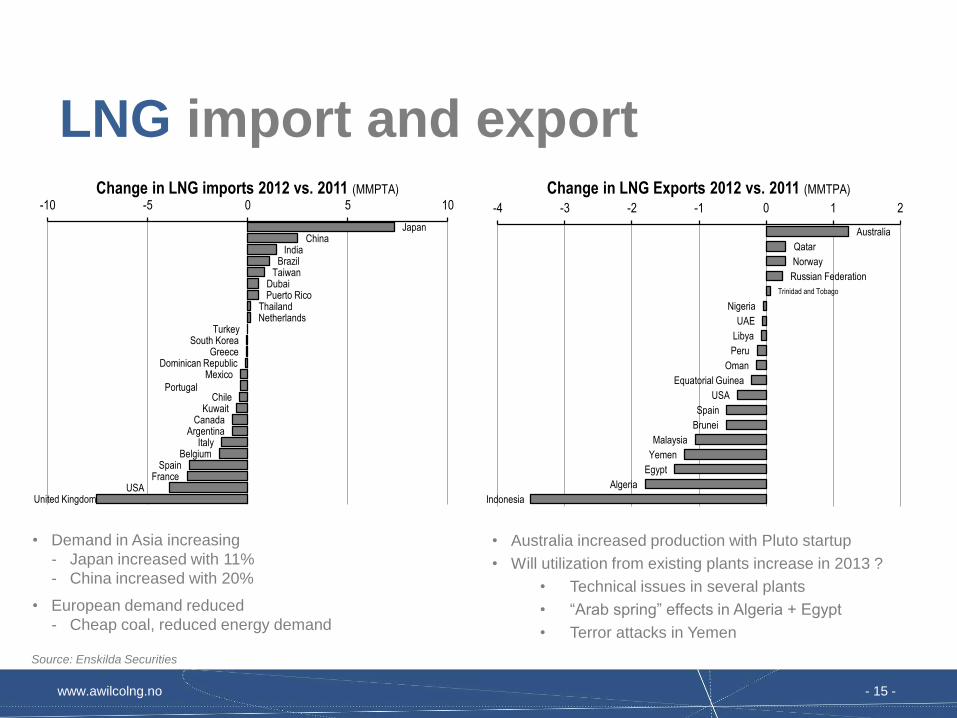
LNG import and export
Japan China
India Brazil
Taiwan Dubai Puerto Rico
Thailand Netherlands
Turkey South Korea
Greece Dominican Republic
Mexico
Portugal Chile
Kuwait Canada
Argentina Italy
Belgium Spain
France USA
United Kingdom
-10 -5 0 5 10
Change in LNG imports 2012 vs. 2011 (MMPTA)
• Demand in Asia increasing
- Japan increased with 11%
- China increased with 20%
• European demand reduced
- Cheap coal, reduced energy demand
Source: Enskilda Securities
Australia
Qatar
Norway
Russian Federation
Trinidad and Tobago
Nigeria
UAE
Libya
Peru
Oman
Equatorial Guinea
USA
Spain
Brunei
Malaysia
Yemen
Egypt
Algeria
Indonesia
-4 -3 -2 -1 0 1 2
Change in LNG Exports 2012 vs. 2011 (MMTPA)
• Australia increased production with Pluto startup
• Will utilization from existing plants increase in 2013 ?
• Technical issues in several plants
• “Arab spring” effects in Algeria + Egypt
• Terror attacks in Yemen
www.awilcolng.no - 16 -
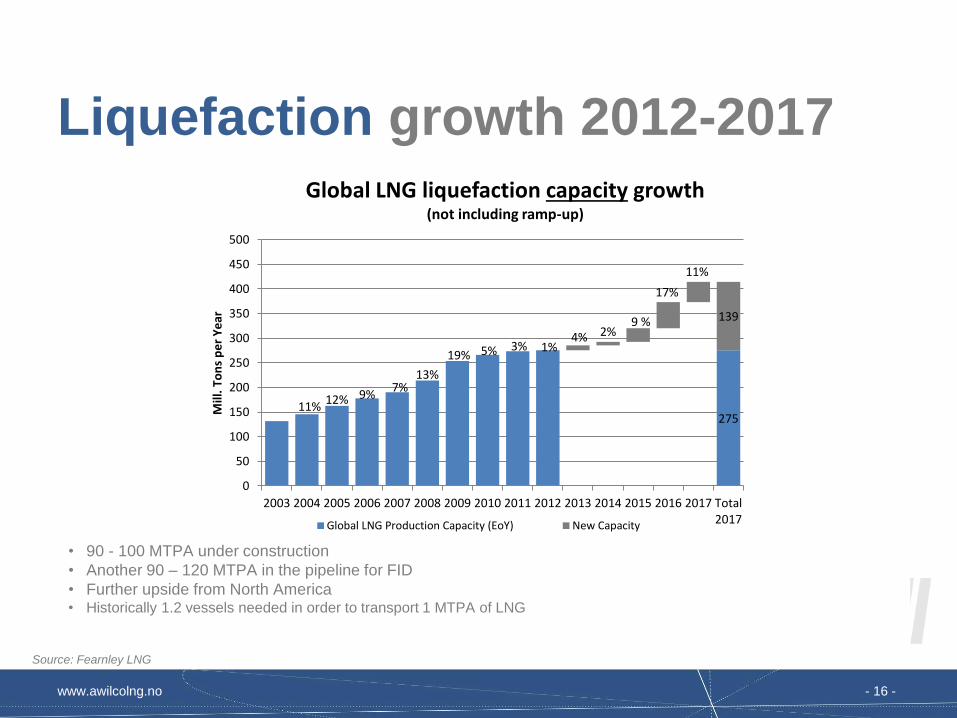
• 90 - 100 MTPA under construction
• Another 90 – 120 MTPA in the pipeline for FID
• Further upside from North America • Historically 1.2 vessels needed in order to transport 1 MTPA of LNG
Source: Fearnley LNG
Liquefaction growth 2012-2017
11% 12% 9%
7% 13%
19% 5% 3% 1%
275
4% 2% 9 %
17%
11%
139
0
50
100
150
200
250
300
350
400
450
500
2003 2004 2005 2006 2007 2008 2009 2010 2011 2012 2013 2014 2015 2016 2017 Total2017
Mill
. To
ns
pe
r Y
ear
Global LNG liquefaction capacity growth (not including ramp-up)
Global LNG Production Capacity (EoY) New Capacity
www.awilcolng.no - 17 -
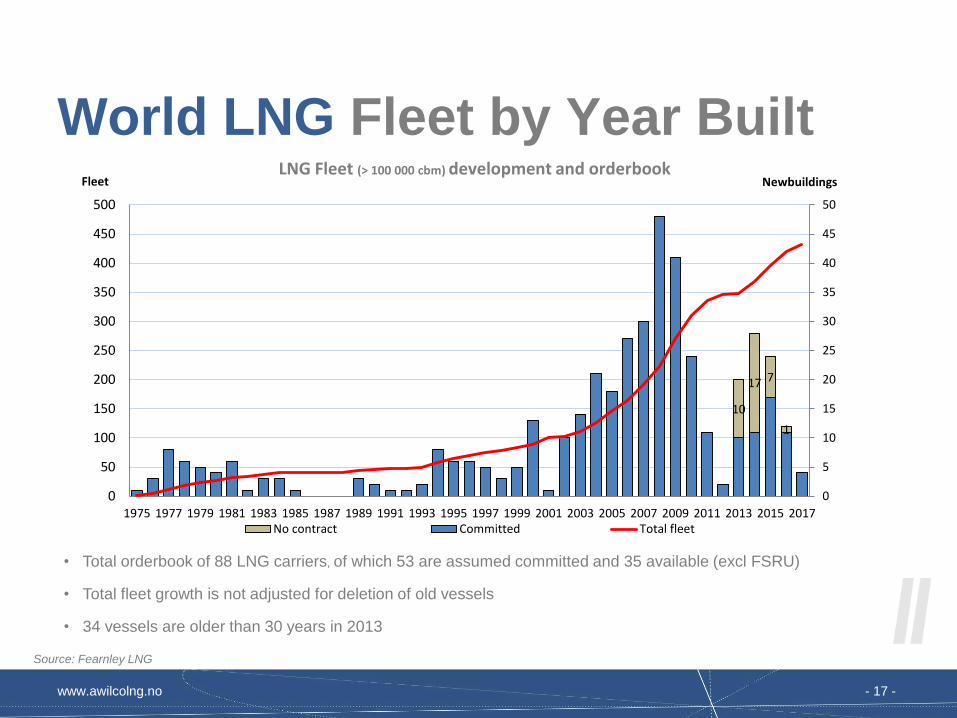
World LNG Fleet by Year Built
Source: Fearnley LNG
10
17 7
1
0
5
10
15
20
25
30
35
40
45
50
0
50
100
150
200
250
300
350
400
450
500
1975 1977 1979 1981 1983 1985 1987 1989 1991 1993 1995 1997 1999 2001 2003 2005 2007 2009 2011 2013 2015 2017
Fleet Newbuildings
No contract Committed Total fleet
LNG Fleet (> 100 000 cbm) development and orderbook
• Total orderbook of 88 LNG carriers, of which 53 are assumed committed and 35 available (excl FSRU)
• Total fleet growth is not adjusted for deletion of old vessels
• 34 vessels are older than 30 years in 2013
www.awilcolng.no - 18 -
Agenda 27/2
1. Company overview and Highlights Q4
2. Q4 Financials
3. Market update
4. Summary
www.awilcolng.no - 19 -
Summary Market • Short term market – will depend on LNG production
− Angola startup is important
− Disruption in production remains a factor
− Tonnage surplus is thin and could change rapidly with few new buildings until very end of 2013
− 1st + 2nd generation vessels more exposed to fluctuations in production
• Long term fundamentals - remains firm
− Gas demand is increasing and expected to outpace any other fossil fuel
− Liquefaction capacity is set for growth
- 90 MTPA under construction
- 90 – 120 MTPA potential FID expected in 2013 /2014
- Trading distances expected to increase in phase with US export
- Uncertainties linked to timing of newbuildings deliveries vs. new production capacity
www.awilcolng.no - 20 -
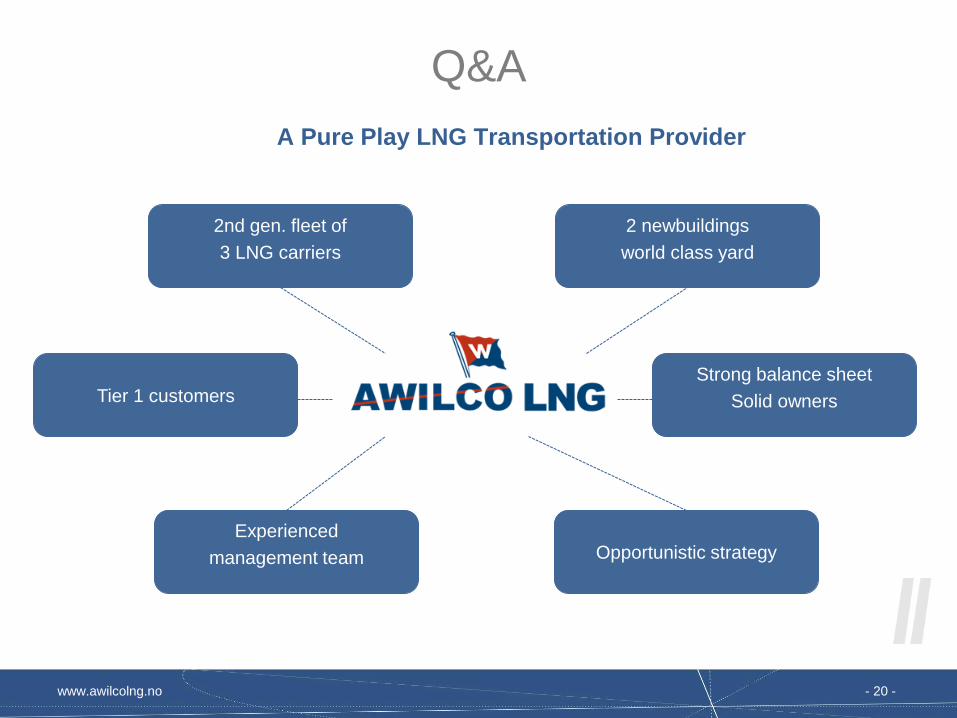
Q&A
Experienced
management team
2nd gen. fleet of
3 LNG carriers
2 newbuildings
world class yard
Strong balance sheet
Solid owners Tier 1 customers
Opportunistic strategy
A Pure Play LNG Transportation Provider

www.awilcolng.no - 21 -

www.awilcolng.no - 22 -

www.awilcolng.no - 23 -
www.awilcolng.no - 24 -
Jon Skule Storheill
CEO
Mobile: +47-9134 4356
E-mail: [email protected]
Snorre Schie Krogstad
CFO
Mobile: +47-9085 8393
E-mail: [email protected]