Aviation Suppliers Association Pioneering the Future of ... · now make up ~83% of domestic...
28
Aviation Suppliers Association Pioneering the Future of the Supply Chain June 17, 2014
Transcript of Aviation Suppliers Association Pioneering the Future of ... · now make up ~83% of domestic...

Aviation Suppliers Association Pioneering the Future of the Supply Chain
June 17, 2014

The Supply Base and Prospects(In Action)

Agenda
I. Introduction to RJET
II. Our industry – The Regional Space
III. The Evolution of the Industry and the Supply Chain
IV. Pioneering the Strategy – a key to OUR future
V. Dashboard and Data Analysis ‐ Examples

INTRODUCTION TO RJET

Republic Airways Holdings Inc
Republic operates over 239 aircraft for 3 primary partners Delta United American
The fleet composition is: ERJ – 41* EJET – 167* (E170/175 and E190) Q400 – 31*
FLEET IS SUPPORTED BY A FIXED FEE MODEL

Fixed‐fee model characteristics
• We are paid on our cost drivers (departures, block hours, flight hours, aircraft days)
• Limited exposure to domestic economy
Predictable Revenue
• No fuel exposure, airport costs, insurance, property taxes and in most cases aircraft ownership costs are passed through to Partners
Low Risk
• Our Mainline Partners are placing higher value on seamless customer experience
• 1-2 margin points available for high quality operation
Opportunity to earn
incentives (increase margin)
• All Partners now have 76 seat scope (larger aircraft = lower unit costs = better economics)
• Significant shift coming from 50 seat to 70+ seat regional aircraft, and RJET is well positioned for this change
Mainline Partner scope
clauses determine
regional fleet
Block hours
Crew wages & benefits
Crew per diem, hotel, training
Flight Hours
Maintenance wages & benefits
Engine overhaul, airframe, and other
maintenance
Departures
Engine LLP, landing gear, and other
maintenance
AC Days
Back office wages & benefits
Other expenses
and overheads
Pass‐through costs
Fuel
Landing fees & rents
AC ownership
Insurance & taxes
Model Cost Drivers

Stable financial performance
RJET Financial Overview
Metric 2012 (actual)
2013 (actual)
2014(midpoint guidance)
’14 vs ’13 YOY% change
Block Hours 701,040 749,931 786,613 4.9%
ASMs (millions) 13,437 13,486 14,771 9.5%
Revenue (millions) $1,377 $1,347 $1,375 2.1%
Pre-tax Income (millions)1 $51.1 $102.5 $110.0 7.3%
Pre-tax Margin 1 3.7% 7.6% 8.0% 0.4pp
Diluted EPS,continuing ops1,2 $0.63 $1.15 $1.30 12.8%
Unrestricted cash (millions)2 $210.8 $276.7 $200.0 -27.7%
1. For 2013, excludes effect of $21.2 impairment charge2. Assumes full use of $75M share repurchase/convertible debt authorization by 12/31/2014
Financial Highlights
Stable cash flows Sale of Frontier ~$77 million
Dec 2013, which is anticipated to be returned to shareholders by the end of 2014
Margin improvement and stabilization
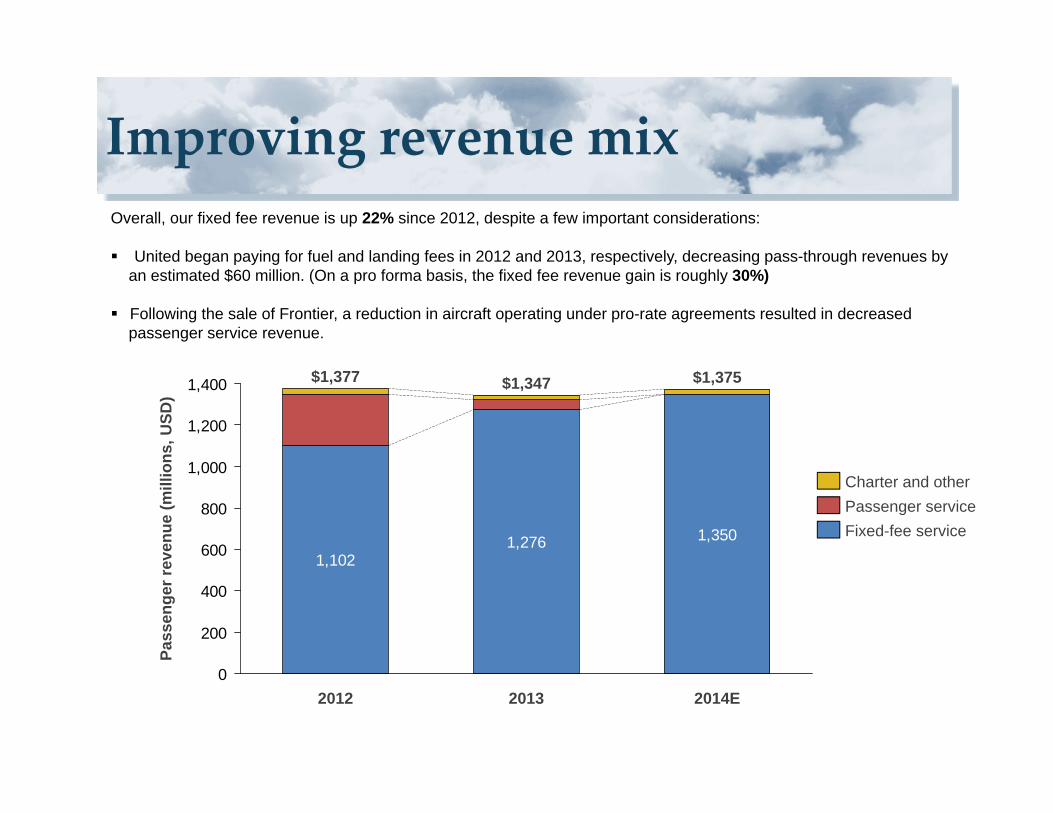
Improving revenue mixOverall, our fixed fee revenue is up 22% since 2012, despite a few important considerations:
United began paying for fuel and landing fees in 2012 and 2013, respectively, decreasing pass-through revenues by an estimated $60 million. (On a pro forma basis, the fixed fee revenue gain is roughly 30%)
Following the sale of Frontier, a reduction in aircraft operating under pro-rate agreements resulted in decreased passenger service revenue.
1,3501,2761,102
0
200
400
600
800
1,000
1,200
1,400
2012 2013 2014E
$1,375$1,347$1,377
Pass
enge
r rev
enue
(mill
ions
, USD
)
Fixed-fee service
Charter and otherPassenger service

Best in class fleet mix and diversity
15
0
10
5
2014(F)
14.8
90%
10%
2009
13.9
76%
24%
Milli
ons
of A
SM
s
6%800
700
400
600
0
500
200
100
300
Thou
sand
s of
Blo
ck h
ours
DL
UA/CO
AA/US
Other
2014E
10%
26.6%DL 15.7%
42.5%
1%
2009
29.9%
US 32.4%
9.9%
CO 11.1%
717
AA 7.6%
UA 23.3%
787
2009 vs 2014 ASMs 2009 vs 2014 Block hours
70+ Seats44-50 Seats
60% reduction in 44-50 seat flying

Winding‐down our 50‐seat fleet
3368
177
253
3571
140
247
0
100
200
300
400
500
EnvoySkywest
Airc
raft
Endeavor
500
PSAChautauquaAir Wisconsin
TSA
E135/140/145CRJ 200
50 seat jet fleets by regional operator (Operating under CPA as of 12/31/13)

Expanding our 70+ seat fleet
68
60
28
73
72
41
47 14
4720 47
0
20
40
60
80
100
120
140
160
180
67
173
Republic
42
Compass EndeavorSkywest
128
Aircraft
PSAGojetEnvoyMesa
CRJ900
E175E170
CRJ700
Q400
70+ seat jet fleets by regional operator (operating under CPA as of 12/31/13)

OUR INDUSTRY

Mainline partner consolidationDomestic passengers by carrier
150
50
400
300
450
350
250
200
100
0
99
67
2009
32
24
67
101
47
117
407
34
45
Dom
estic
pas
seng
ers
(000
s)
414
2013
132
56
+2%
WNAA FLUACO DLNWUS
Four large industry players remain American, Delta, United and Southwest
now make up ~83% of domestic capacity
The three merged legacy airlines are now focused on capacity rationalization, resulting in some hub closures Hub closures are a headwind to
regional carriers and create more white space for Ultra-low cost carriers, or “ULCCs”
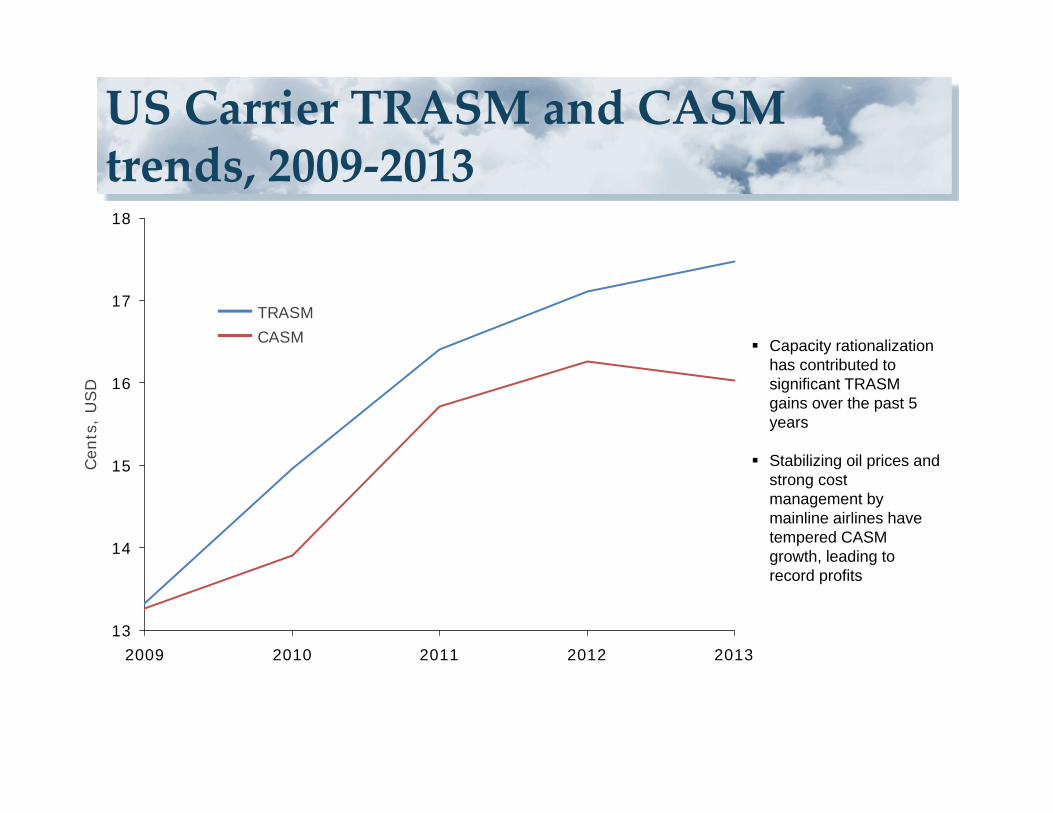
US Carrier TRASM and CASM trends, 2009‐2013
13
14
15
16
17
18
2009 2010 2011 2012 2013
Cen
ts,
USD
CASMTRASM
Capacity rationalization has contributed to significant TRASM gains over the past 5 years
Stabilizing oil prices and strong cost management by mainline airlines have tempered CASM growth, leading to record profits

Mainline partner scope changes
Trading ~ 550 small jet aircraft in favor of ~ 300 larger aircraft (76 seat)
Why does this make sense? Taking more connections over fewer hubs means revenues are produced more efficiently
Economies of scale (spreading the fixed cost of the business over more seats)
-81
US / AA New ?
150
50
300
259
500
350
193
255
450181
450
325
-32
-144
US / AA Old
532
339
81
112
UA New
195
102
153
UA Old
594
413
153
28
DL New
125
102
223
DL Old
531
272
102
157
50 seats or less51 - 70 seats71 to 76 seats
Expected reduction of ~ 250 regional aircraft
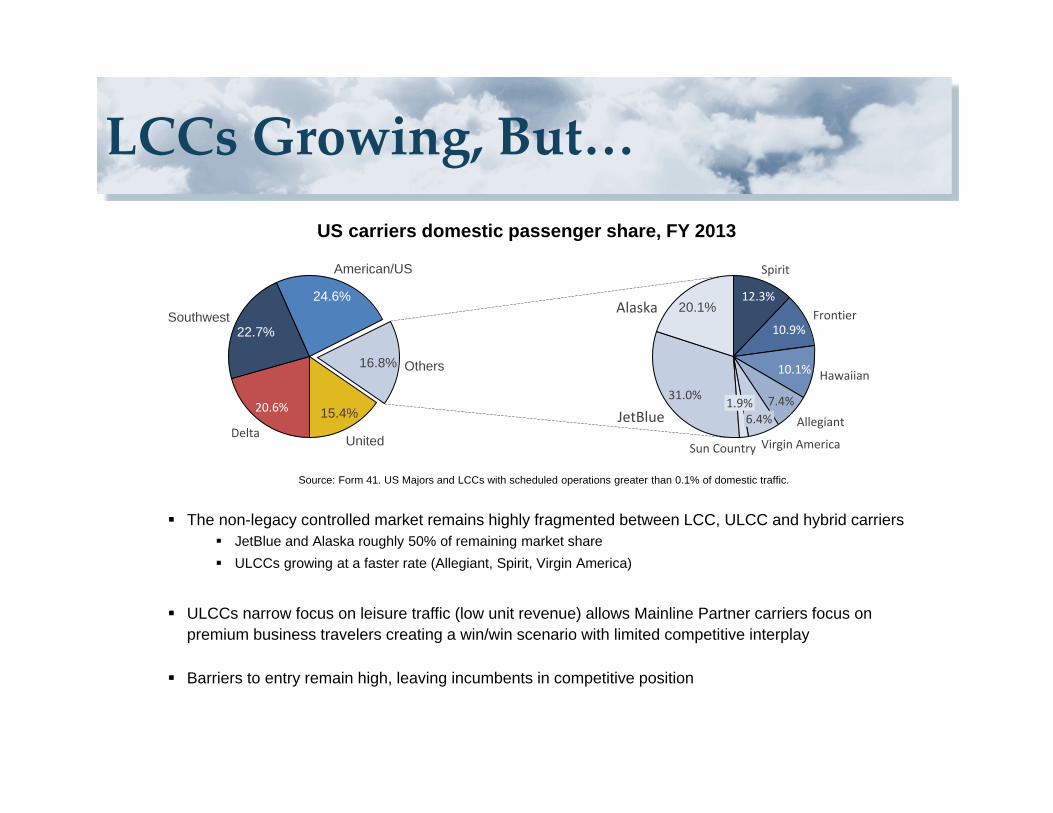
LCCs Growing, But…
The non-legacy controlled market remains highly fragmented between LCC, ULCC and hybrid carriers JetBlue and Alaska roughly 50% of remaining market share ULCCs growing at a faster rate (Allegiant, Spirit, Virgin America)
ULCCs narrow focus on leisure traffic (low unit revenue) allows Mainline Partner carriers focus on premium business travelers creating a win/win scenario with limited competitive interplay
Barriers to entry remain high, leaving incumbents in competitive position
US carriers domestic passenger share, FY 2013
Source: Form 41. US Majors and LCCs with scheduled operations greater than 0.1% of domestic traffic.
United
15.4%
Others16.8%
American/US
24.6%Southwest
22.7%
Delta
20.6%6.4%
10.1%
Allegiant
Hawaiian
FrontierAlaska
Spirit
Virgin America
10.9%
1.9%
12.3%
7.4%
Sun Country
20.1%
JetBlue31.0%

THE CURRENT THREATTO
OUR INDUSTRY

Mainline partner expected pilot retirements
14,000
18,000
10,000
16,000
4,000
0
12,000
8,000
6,000
2,000
Cum
ulat
ive
pilo
ts re
tirin
g
20162014
8,377
2020
2,2643,580
2021
6,644
2018
5,029
20222015
12,594
10,388
15,155
17,751
2017
1,032
20192013
Expected cumulative pilot retirements through 2022
Sources: Flight Path Economics, FAA and DOT

Where do mainline partners’ pilots come from?
20,000
10,000
30,000
40,000
0
50,000
41,100
6,200
Network Regional LCCCargo
17,000
Other
5,9002,300
FAR 117 pilot demand
Carrier Type Estimated additional pilots required
Network 2,000‐3,300
Regional 850‐1,350
Cargo 300‐500
LCC 300‐500
Other 100‐200
2012 pilot headcount by segment
Sources: Flight Path Economics, FAA and DOT

SUPPLY CHAINEVOLUTION AND THE FUTURE

The Evolution of the Aviation Supply Chain
1990 2000 2010 2014
Manual Orders Manual Processes Static Communication Status Quo Performance Supply Base Expansion
Semi Automation Accelerated
Communication Historical Analytics Advent of Enhanced
Performance Expanding Supply Base
Increase automation ERP Implementations Dynamic Communication New baseline Performance Supply Base Rationalization
Effi
cien
cies
/ O
ppor
tuni
ties
Big Data Analytics New Performance milestones Strategic Programs Packaged spend / opportunities Linked alliances and partnerships

V4 ‐ Key Deliverables for the Future
4
Velocity
Volume
Value
Victory
Communication – not only instant but proactive – see value TAT – 2014 performance requirements + Lead Time Compression Real time collaboration with all trading partners
Established high value electronic links Demand Indicators (ex) Supply Indicators
Data Integration / Data Accuracy Leverage technology / real time dashboards (example)
Value stream – map and remap (flex) for each partner
Limited market and expand offering Consolidation – still in play Alliances Diversification
Bilateral performance – measure and deliver! Celebrate all success Understand and align corporate objectives (ex)

Pioneering Strategy(Summary Checklist)
Must deliver: Velocity – data, status,
product, information Value – electronic
linkages and partnered automation that drives performance
Volume – expanded offerings through alliances or consolidation
Victory – align and flex your objectives with your trading partners (micro and macro)
Program trends – are you aligned?Domestic – limited opportunity
but monitory business intel / development that matches domestic market – all carriersGlobal – continued growth and
must be a player in this realm to grow your businessConsolidation or Expansion –
direct diversification of offering
Manage all trading partners –customers and suppliersGenerate efficienciesGain share on continuous
improvements Long term success of our
industry depends on continued vigilance of cost and ability to respond to changes
V4 DIVERSIFICATION COST DISCIPLINE

Evolution and Velocity?

REFERENCE SLIDES(POWER OF DATA AND ANALYTICS)

Real Time Dashboard Example(Embraer Program)
Strategic Programs: Real time dashboards analyzing big data and prioritizing
partnered actionsV4
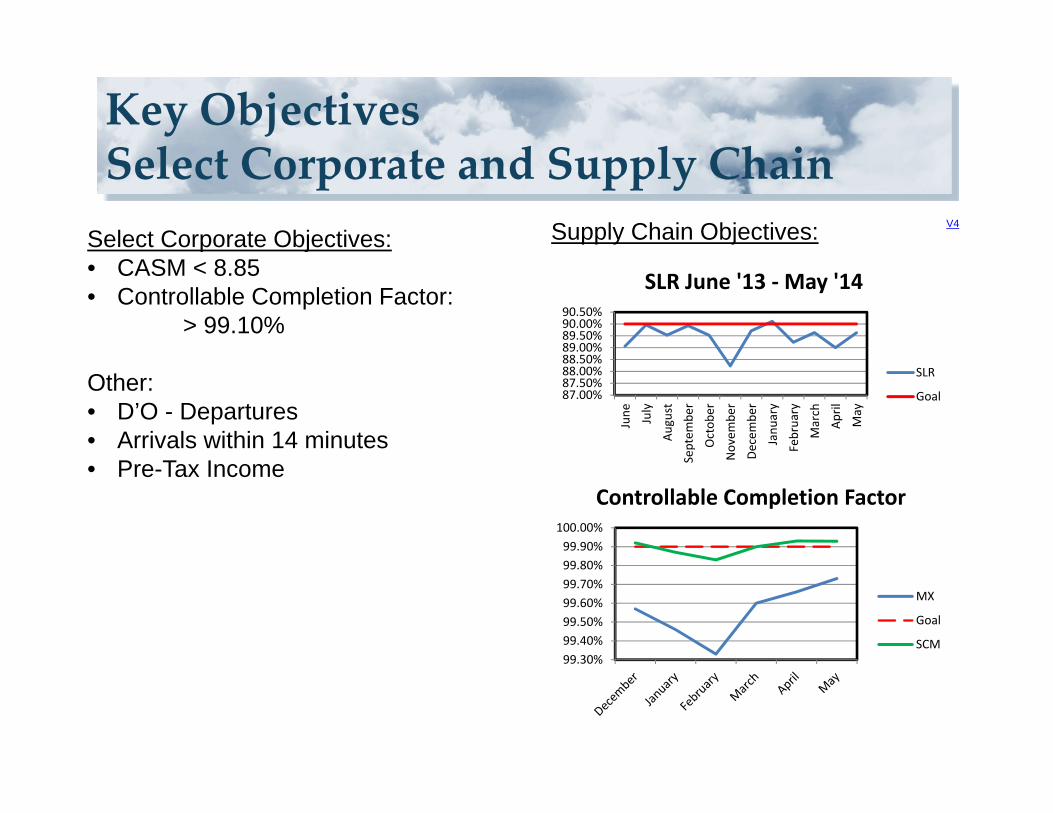
Key ObjectivesSelect Corporate and Supply Chain
87.00%87.50%88.00%88.50%89.00%89.50%90.00%90.50%
June July
August
Septem
ber
Octob
er
Novem
ber
Decembe
r
Janu
ary
February
March
April
May
SLR June '13 ‐May '14
SLR
Goal
99.30%99.40%99.50%99.60%99.70%99.80%99.90%
100.00%
Controllable Completion Factor
MX
Goal
SCM
Select Corporate Objectives:• CASM < 8.85• Controllable Completion Factor:
> 99.10%
Other:• D’O - Departures• Arrivals within 14 minutes• Pre-Tax Income
Supply Chain Objectives: V4
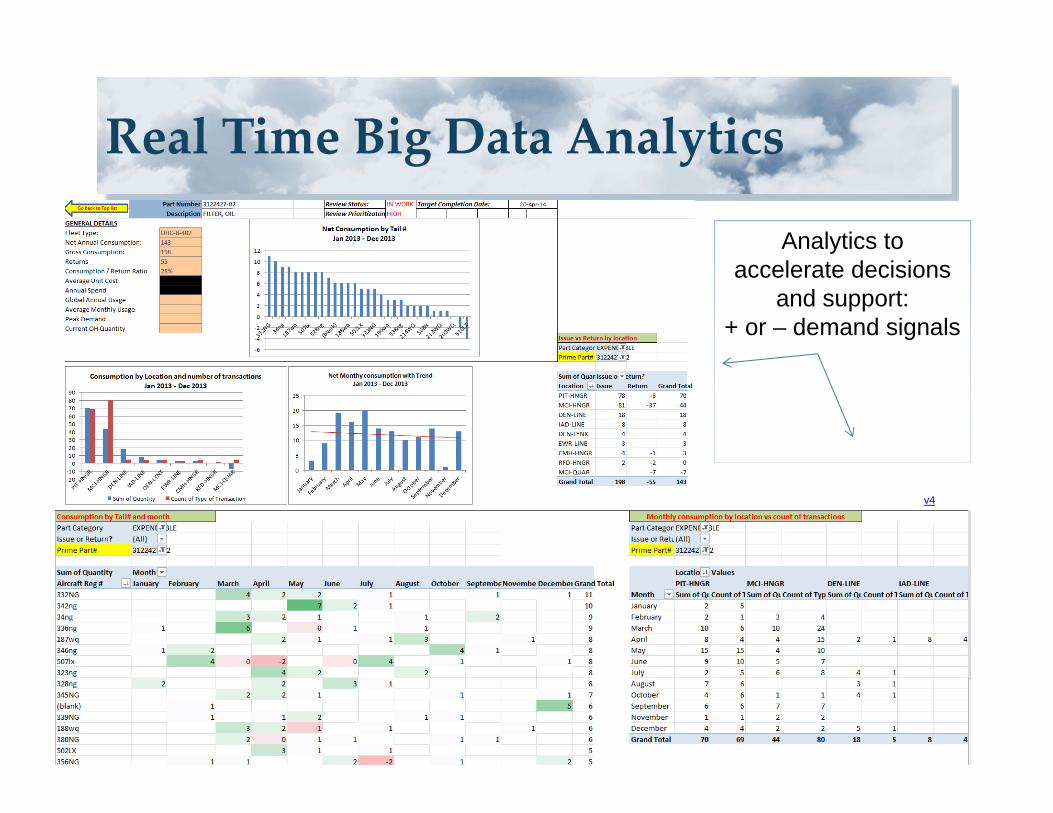
Real Time Big Data Analytics
Analytics to accelerate decisions
and support:+ or – demand signals
v4