Aviation Overweight (from Neutral)
13
See important disclosures at the end of this report Powered by EFA TM Platform 1 Sector Update, 16 December 2014 Aviation Overweight (from Neutral) Decline In Oil Prices Boosts Earnings Prospects Macro Risks Growth Value Ahmad Maghfur Usman 603 9207 7654 [email protected] P/E (x) P/B (x) Yield (%) Dec-15F Dec-15F Dec-15F AirAsia MYR2.80 MYR3.47 9.7 1.3 2.4 BUY AirAsia X MYR0.69 MYR0.58 na 1.8 - SELL Malaysia Airports Holdings MYR6.61 MYR8.06 93.0 1.4 2.1 BUY Company Name Price Target Rating Source: Company data, RHB The slump in oil prices will benefit the aviation sector. While we do not see demand growing strongly, sector earnings will be underpinned by yield recovery, with an additional positive impact from lower jet fuel prices. As such, we upgrade the sector to OVERWEIGHT from Neutral. AirAsia is our Top Pick for the Malaysian aviation sector. AirAsia X remains a SELL as losses will continue into FY15. Yields at an inflection point to recovery. Soon-to-be privatised Malaysian Airline System (MAS) (MAS MK, NR) is in the midst of a restructuring that will likely involve capacity cuts on loss-making routes and frequency reductions. More importantly, this ought to put to an end to its irrational pricing strategy, the chief cause behind the sector’s depressed yields. MAS has yet to announce the size of its capacity cuts, but we estimate that this could be c.10-15% of its available seat per kilometres (ASK) at best, as its core focus ought to be on cutting its workforce (by 30%) and raising ticket prices. 2015 travel sentiment remains shaky on goods and services tax (GST). We expect 2015 passenger growth to inch up 6% YoY after recovering from the tragic MH370 and MH17 incidents in 2014. This year, we forecast for passenger growth of 4.4% YoY, less than the 18.4% growth recorded in 2013. The recovery in 2015 passenger growth may not reach double-digit levels, though, given the uncertain consumer sentiment. For 2016, we expect a passenger growth of 5%. The weaker MYR could also have positive implications on inbound foreign tourist arrivals that would benefit airlines and airport operators. Decline in oil prices a positive. While we collectively see an overall improvement in earnings across the carriers we cover, we prefer to stick to those that have scale in their operations with proven cost efficiency structures. As such, we see AirAsia (AIRA MK, BUY, TP: MYR3.47) as a sound pick. Within our Malaysian aviation coverage, AirAsia X’s (AAX MK, SELL, TP: MYR0.58) bottomline would be the most sensitive to jet fuel price fluctuations. We note that the carrier is unprofitable currently and we estimate that a 1USD/bbl change oil prices would have an inverse impact in its bottomline by MYR12.4m and MYR13.5m in FY15 and FY16 respectively. Meanwhile AirAsia’s sensitivity to a 1USD/bbl change would inversely impact earnings by 2.3% in both FY15 and FY16 (or approximately MYR18.4m-19.2m). Carriers with strong balance sheets and cash piles like AirAsia could possibly take the opportunity to take a larger hedging position of its needed fuel intake into 2016. Upgrade to OVERWEIGHT. The slump in oil prices would benefit the aviation sector. While we do not see demand growing strongly, sector earnings would be underpinned by the yield recovery, with an additional positive impact from lower jet fuel price. As such, we upgrade the sector to OVERWEIGHT from Neutral. We prefer AirAsia for its compelling valuations and thrifty operating structure and the stock remains our sector Top Pick.
Transcript of Aviation Overweight (from Neutral)

See important disclosures at the end of this report Powered by EFATM
Platform 1
Sector Update, 16 December 2014
Aviation Overweight (from Neutral)
Decline In Oil Prices Boosts Earnings Prospects
Macro
2
Risks
2
Growth
3
Value
2
Ahmad Maghfur Usman 603 9207 7654
P/E (x) P/B (x) Yield (%)
Dec-15F Dec-15F Dec-15F
AirAsia MYR2.80 MYR3.47 9.7 1.3 2.4 BUY
AirAsia X MYR0.69 MYR0.58 na 1.8 - SELL
Malaysia Airports Holdings MYR6.61 MYR8.06 93.0 1.4 2.1 BUY
Company Name Price Target Rating
Source: Company data, RHB
The slump in oil prices will benefit the aviation sector. While we do not see demand growing strongly, sector earnings will be underpinned by yield recovery, with an additional positive impact from lower jet fuel prices. As such, we upgrade the sector to OVERWEIGHT from Neutral. AirAsia is our Top Pick for the Malaysian aviation sector. AirAsia X remains a SELL as losses will continue into FY15.
Yields at an inflection point to recovery. Soon-to-be privatised
Malaysian Airline System (MAS) (MAS MK, NR) is in the midst of a restructuring that will likely involve capacity cuts on loss-making routes and frequency reductions. More importantly, this ought to put to an end to its irrational pricing strategy, the chief cause behind the sector’s depressed yields. MAS has yet to announce the size of its capacity cuts, but we estimate that this could be c.10-15% of its available seat per kilometres (ASK) at best, as its core focus ought to be on cutting its workforce (by 30%) and raising ticket prices.
2015 travel sentiment remains shaky on goods and services tax (GST). We expect 2015 passenger growth to inch up 6% YoY after recovering from the tragic MH370 and MH17 incidents in 2014. This year, we forecast for passenger growth of 4.4% YoY, less than the 18.4% growth recorded in 2013. The recovery in 2015 passenger growth may not reach double-digit levels, though, given the uncertain consumer sentiment. For 2016, we expect a passenger growth of 5%. The weaker MYR could also have positive implications on inbound foreign tourist arrivals that would benefit airlines and airport operators.
Decline in oil prices a positive. While we collectively see an overall improvement in earnings across the carriers we cover, we prefer to stick to those that have scale in their operations with proven cost efficiency structures. As such, we see AirAsia (AIRA MK, BUY, TP: MYR3.47) as a sound pick. Within our Malaysian aviation coverage, AirAsia X’s (AAX MK, SELL, TP: MYR0.58) bottomline would be the most sensitive to jet fuel price fluctuations. We note that the carrier is unprofitable currently and we estimate that a 1USD/bbl change oil prices would have an inverse impact in its bottomline by MYR12.4m and MYR13.5m in FY15 and FY16 respectively. Meanwhile AirAsia’s sensitivity to a 1USD/bbl change would inversely impact earnings by 2.3% in both FY15 and FY16 (or approximately MYR18.4m-19.2m). Carriers with strong balance sheets and cash piles like AirAsia could possibly take the opportunity to take a larger hedging position of its needed fuel intake into 2016.
Upgrade to OVERWEIGHT. The slump in oil prices would benefit the aviation sector. While we do not see demand growing strongly, sector earnings would be underpinned by the yield recovery, with an additional positive impact from lower jet fuel price. As such, we upgrade the sector to OVERWEIGHT from Neutral. We prefer AirAsia for its compelling valuations and thrifty operating structure and the stock remains our sector Top Pick.
Typi non habent claritatem insitam. Est usus legentis in iis qui facit eorum Investigationes demonstraverunt lectores legere me lius quod ii legunt saepius. Claritas est etiam processus dynamicus, qui sequitur mutationem consuetudium lectorum. odo typi, qui nunc nobis videntur parum clari, fiant sollemnes in futurum.
Phasellus libero ante, ornare ornare fringilla ut, gravida sed urna. Mauris quam erat, molestie at suscipit vitae, molestie id massa. Etiam ut justo in augue rhoncus adipiscing. Sed sagittis sagittis nulla eget rutrum. Duis et posuere odio. In gravida rhoncus lobortis. Quisque nec lectus leo, non dapibus orci. Phasellus sollicitudin consectetur mauris, eget

Aviation 16 December 2014
See important disclosures at the end of this report 2
Table of Contents
2014 An Eventful Year 3
Yield Pick-Up From 4Q Onwards 4
Demand From 2015 Onwards 5
Slump In Oil Prices Leads To Earnings Bonuses 6
Assumptions 7
A Troubling Case For Malaysia Airports 9
Valuations And Recommendations 10

Aviation 16 December 2014
See important disclosures at the end of this report 3
2014 An Eventful Year
Figure 1: Supply and demand dynamics (2006-2017F)
Title:
Source:
Please fill in the values above to have them entered in your report
-20%
-15%
-10%
-5%
0%
5%
10%
15%
20%
25%
2006 2007 2008 2009 2010 2011 2012 2013 2014F 2015F 2016F 2017F
Demand growth % chg YoY Supply growth % chg YoY Average sector yields % chg YoY
Source: RHB, Company
2014 would be deemed a washout year for aviation. While the industry anticipated this year to be challenging – as intensifying competition put pressure on yields and the political conflicts affected Thailand’s capital – this was further compounded by the MH370 and MH17 tragedies, which dampened overall air travel sentiment. Passenger air traffic has since declined, due mainly to fewer inbound China tourists, which has always been a lucrative target market for Malaysian tourism. The aviation sector saw continuous earnings downgrades as quarterly earnings failed to meet expectations. In 2014, we also witnessed the privatisation of ailing MAS as a necessary means for its restructuring, which could possibly lead to a potential 10-15% capacity cut. MAS’ irrational pricing strategy, which was made in an attempt to boost loads – to the extent that it undercut air fares offered by low-cost carriers, has been the core reason behind the overall depressed yields in the Malaysian aviation sector. Malaysia Airports (MAHB MK, BUY, TP: MYR8.06) commenced operating KLIA2 in May, but its high operating costs disappointed investors. The airport operator also announced the full acquisition of the remaining unowned shares in its Sabiha Gokcen airport associate stake, which also took the market by surprise.
Figure 2: Chronology of events in 2014
24 Dec 2013 Malaysia Airports raised its stake at Sabiha Gokcen Airport to 40% from 20%. Raised funds (MYR997m) through private placement
27 Jan 2014 AirAsia X entered into a joint-venture (JV) with Indonesia partner PT Kirana Anugerah Perkasa to set up Indonesia AirAsia X
Throughout May 2014 4Q13 results disappointed
5 Feb 2014 Malaysia Airports announced that it had not received the certificate of completion and compliance for KLIA2, sparking concerns over delays in opening
12 Feb 2014 Airport tax hike (a 9% increase), of which Malaysia Airports accrued government compensations for not passing on the hike to passengers
4 Mar 2014 Malaysia Airports completed its MYR997m private placement exercise
8 Mar 2014 Tragic disappearance of Malaysia Airlines Flight 370
17 Mar 2014 RHB downgrades the aviation sector to NEUTRAL
1 May 2014 KLIA2 commenced operations. Only saw partial opening of its retail outlets
30 May 2014 AirAsia India announced its maiden flight from Bangalore to Goa; the service started on 12 Jun
Throughout May 2014 1Q14 earnings disappointed, rumours on the possible privatisation of MAS emerge
12 Jun 2014 First flight by AirAsia India
23 Jun 2014 Malaysia Airports won an arbitration case involving its void Male International Airport concession
23 Jun 2014 Datuk Badlisham Ghazali joined Malaysia Airports as the new managing director
1 Jul 2014 AirAsia announced its second attempt to enter the Japanese market with new partners
17 Jul 2014 MH17 tragedy
8 Aug 2014 Khazanah announced the privatisation of MAS at MYR0.27 per share
29 Aug 2014 Khazanah unveiled plans on MAS’ restructuring, which saw a 30% cut of its workforce. No capacity reduction quantum mentioned
Throughout Aug 2014 2Q14 earnings still disappointed
17 Sep 2014 Malaysia Airports’ consortium partner in Sabiha Gokcen, Limak, sells its entire 40% stake for EUR285m to TAV – a competitor at Ataturk Airport. Malaysia Airports deliberated on exercising its first right of first refusal (ROFR) to stop the sale
17 Sep 2014 British Airways announced its return to KLIA
23 Oct 2014 Malaysia Airports exercised its rights to block the sale of Sabiha Gokcen. Will acquire the 60% remainder of Sabiha Gokcen, thus making it a wholly owned subsidiary
6 Nov 2014 Shareholders approve MAS privatisation
10 Nov 2014 Malaysia Airports proposed a 1-for-5 rights issue at an indicative MYR4.80/rights share price to fund acquisition of the unowned 40% stake in Sabiha Gokcen
Throughout Nov 2014 Mixed 3Q14 earnings. AirAsia's earnings came in better than expected. Oil prices began to tumble
Source: Various
Demand growth over the years exceeded supply growth.
Sharp spike in demand and supply was due to aggressive capacity expansion in 2013 by all carriers along with the entry of Malindo Air and several full service carriers connecting to KLIA2 as MAS joins the oneworld alliance. The following two tragic MH flight incidents in 2014 led to a temporary oversupply glut, which is expected to ease into 2015 as MAS trims capacity.
MAS’ irrational pricing in attempt to fill up loads impacted the overall sector yields. We see yields reaching an inflection point in 3Q14 with a sequential recovery seen into 2015.

Aviation 16 December 2014
See important disclosures at the end of this report 4
Yield Pick-Up From 4Q Onwards Soon-to-be privatised MAS is in the midst of a restructuring that will likely involve capacity cuts from its loss-making routes and frequency reductions. We foresee the airline likely cutting its Amsterdam route and trimming down frequencies to North Asia, ASEAN and Australia. More importantly, this would put to an end to the carrier’s irrational pricing strategy, which has been the culprit behind the sector’s depressed yields. MAS has yet to announce the size of its capacity cuts, but we estimate that this could be to the tune of 10-15% of its ASK at best over the FY15-16 period, as its core focus ought to be on cutting its workforce (by 30%) and bumping up its ticket pricing. At the same time, we expect the budget carriers’ yields to be positive in 4Q, which will continue through to next year. We expect yields for AirAsia and AirAsia X to grow by 5% and 10% respectively in 2015 vs drops of 4.7% and 13% in FY14.
Figure 3: Quarterly overall passenger yields (including AirAsia X and AirAsia ancillaries)
Figure 4: YoY (%) changes in passenger yields of ASEAN-based low cost and full service carriers
Title:
Source:
Please fill in the values above to have them entered in your report
-25%
-20%
-15%
-10%
-5%
0%
5%
10%
15%
AirAsia AirAsia X Malaysian Airlines
Title:
Source:
Please fill in the values above to have them entered in your report
-15%
-10%
-5%
0%
5%
10%
LCC Average FSC Average
Source: RHB, Companies data Source: RHB, Companies data
Figure 5: YoY (%) change in passenger yields of ASEAN-based low cost carriers
Figure 6: YoY (%) change on passenger yields of ASEAN-based full service carriers
Title:
Source:
Please fill in the values above to have them entered in your report
-25%-20%-15%-10%
-5%0%5%
10%15%20%25%
AirAsia AirAsia X
Cebu Pacific Indonesia AirAsia
Nok Air Thai AirAsia
Tiger Air Average
Title:
Source:
Please fill in the values above to have them entered in your report
-20%
-15%
-10%
-5%
0%
5%
10%
15%
Garuda Indonesia Malaysian Airlines
Singapore Airlines SilkAir
Thai Airways Average
Source: RHB, Companies data Source: RHB, Companies data

Aviation 16 December 2014
See important disclosures at the end of this report 5
Demand From 2015 Onwards 2015 travel sentiment could be shaky due to GST
We expect consumer sentiment to be weak in 2015, on the upcoming implementation of the GST in Apr 2015. We also expect the tax to affect air fares. International routes and routes departing from tax-free zones such as Langkawi will be exempt from the tax, but domestic routes would see tickets being subjected to a 6% GST. Still, we do expect the carriers to absorb part of the taxes.
This could potentially cap the yield upsides for AirAsia and MAS. Passenger service charges (both international and domestic) would factor in the GST, although the impact on consumers should be fairly minimal as it will only translate to a 6% increase in the airport tax base. This will range from MYR6-65, depending on the airport that passengers depart from. Duty-free goods, and aircraft parking and landing charges are also understood to be zero-rated. On a positive note, Malaysia Airports may stand to benefit from the GST, as this could boost sales of duty-free goods. On the cost front, airlines are expected to pay for higher jet fuel, when it comes to local flights.
Although we note that the flat growth in wages and rising inflationary pressure – stemming from the implementation of the GST and rationalisation of subsidies – may weigh on consumer spending, we expect spending trends to gradually normalise over the course of next year. RHB economists project consumption spending to grow at a slower pace (+5.2% YoY) in 2015.
Figure 7: Malaysia’s consumer sentiment index
Title:
Source:
Please fill in the values above to have them entered in your report114.3 114.9
118.3 118.7122.9
109.7102
82.4
96.8 100.1 98
0
20
40
60
80
100
120
140
1Q12 2Q12 3Q12 4Q12 1Q13 2Q13 3Q13 4Q13 1Q14 2Q14 3Q14
Source: Malaysian Institute of Economic Research (MIER)
We expect 2015 passenger growth to inch up 6% YoY after recovering from the tragic MH370 and MH17 incidents in 2014. We estimate a 4.4% YoY growth this year, which is comparatively less than the 18.4% growth recorded in 2013. The recovery in 2015 passenger growth may not reach double-digit levels given the uncertain consumer sentiment. For 2016, we expect a passenger growth of 5%. The weaker MYR could also have positive implications on inbound foreign tourist arrivals that would benefit airlines and airport operators.

Aviation 16 December 2014
See important disclosures at the end of this report 6
Slump In Oil Prices Leads To Earnings Bonuses Oil price slump a saving grace for carriers
With the compounded negative news flow throughout 2014, things took a positive turn for the aviation sector as the crude oil price has slumped by 47.5% from its 2014 peak and continues to trend lower (39.8% for jet fuel spot). This would bode well for the aviation sectors’ earnings, which would move towards an inflection point as yields recover. Fuel costs represent a significant chunk of airlines’ operating costs and we believe that this could provide a double whammy in terms of an earnings upside, in addition to the recovery in yields. On the flipside, however, the downtrend in fuel prices has consequently weakened the MYR against the USD, which will put pressure on maintenance and USD-denominated borrowing costs as well as capex. These are typically transacted in USD. Fortunately, the sharp drop in jet fuel prices has clearly outweighed the negative impact arising from the depreciation of the MYR against the greenback. Our base case assumption for jet fuel prices for 2015 and 2016 stands at USD100/bbl and USD110/bbl respectively – which were recently lowered from USD115/bbl and USD123/bbl. Note that we have input a handling cost of USD7/barrel on the forecasted spot price as well as a 6% GST charge on fuel for domestic flights.
Figure 8: Jet fuel spot price (USD/bbl) Figure 9: Jet fuel spot price (MYR/bbl)
Title:
Source:
Please fill in the values above to have them entered in your report
0
20
40
60
80
100
120
140
160
180
200
Fe
b-0
6M
ay-
06
Aug
-06
Nov-0
6F
eb-0
7M
ay-
07
Aug
-07
Nov-0
7F
eb-0
8M
ay-
08
Aug
-08
Nov-0
8F
eb-0
9M
ay-
09
Aug
-09
Nov-0
9F
eb-1
0M
ay-
10
Aug
-10
Nov-1
0F
eb-1
1M
ay-
11
Aug
-11
Nov-1
1F
eb-1
2M
ay-
12
Aug
-12
Nov-1
2F
eb-1
3M
ay-
13
Aug
-13
Nov-1
3F
eb-1
4M
ay-
14
Aug
-14
Nov-1
4
Brent (USD/barrel) Jet fuel (USD/barrel)
Title:
Source:
Please fill in the values above to have them entered in your report
0
100
200
300
400
500
600
700
Feb
-06
May-
06
Aug-0
6N
ov-
06F
eb-0
7M
ay-
07
Aug-0
7N
ov-
07F
eb-0
8M
ay-
08
Aug-0
8N
ov-
08F
eb-0
9M
ay-
09
Aug-0
9N
ov-
09F
eb-1
0M
ay-
10
Aug-1
0N
ov-
10F
eb-1
1M
ay-
11
Aug-1
1N
ov-
11F
eb-1
2M
ay-
12
Aug-1
2N
ov-
12F
eb-1
3M
ay-
13
Aug-1
3N
ov-
13F
eb-1
4M
ay-
14
Aug-1
4N
ov-
14
Source: Bloomberg Source: Bloomberg
While we collectively see an overall improvement in earnings across the carriers under our coverage, we prefer to stick to those that have scale in their operations with proven cost efficiency structures. As such, we see AirAsia as a sound pick. Within our Malaysian aviation coverage, AirAsia X’s bottomline will be the most sensitive to jet fuel prices. We note that the carrier is unprofitable currently and we estimate that a 1USD/bbl change oil prices would have an inverse impact in its bottomline by MYR12.4m and MYR13.5m in FY15 and FY16 respectively. Meanwhile AirAsia’s sensitivity to a 1USD/bbl change would inversely impact earnings by 2.3-2.3% in both FY15 and FY16 (or approximately MYR18.4m-19.2m).

Aviation 16 December 2014
See important disclosures at the end of this report 7
Assumptions Fleet deliveries
Figure 10: Fleet assumptions Net change in average operating fleet FY13 FY14F FY15F FY16F
AirAsia 7.5 1.5 10.0 5.0
AirAsia X 4.3 3.8 1.0 1.5
Fleet year end FY13 FY14F FY15F FY16F
AirAsia 72.0 81.0 82.0 87.0
AirAsia X 16.0 19.0 21.0 22.0
Source: RHB, Companies data
AirAsia
Six aircraft were grounded in 3Q14, down from eight in the previous quarter. This led to more cost optimisation, given AirAsia’s sustainable load factor of 79-80%. The company will be reactivating three of its grounded aircraft in 4Q14, a quarter where demand is seasonally stronger.
Moving into FY15, AirAsia will be taking delivery of nine aircraft. The nine will be offset by the sale of four older aircraft. This will bring the net addition to its fleet at only five, of which one will be allocated to Malaysia and four to be leased to Thailand. In 2016, there will be 18 incoming new aircraft deliveries, of which most are also likely to be leased out to its associates.
With its current six grounded aircraft likely to be reactivated for next year, we expect capacity to grow by 12.8% and 6.3% in FY15 and FY16 respectively.
AirAsia X
AirAsia X’s upcoming aircraft delivery in 2015 will be slated for its associates, Indonesia AirAsia X (one aircraft) and Thai AirAsia X (two aircraft). We understand AirAsia X is only expected to see a net addition of only one aircraft in FY15 for its Malaysia operations. We also assume only one aircraft added in for FY16. We still remain concerned on where AirAsia X will be deploying its aircraft, although there are talks of a possibility reactivating its terminated London, UK, route. Another mooted destination is also Hawaii, US. We think these two routes are unlikely in the near term, unless the carrier optimises its overall cost restructure.
All of AirAsia X’s aircraft deliveries will be on operating lease in view of its weak balance sheet, and this will likely persist in FY16. As such, there will not be any aircraft capex required in the immediate term for the long haul low cost carrier.
In the meantime, to optimise capacity during the seasonally weaker quarters (2Q and 3Q), AirAsia X will continue to tactically deploy its fleet aggressively on wet leases in FY15. These wet leases could potentially earn as much as USD2m over a 2-3 month period for an aircraft, with a possible net margin of 10%. As such, we only expect single digit growth in ASK over the next two years.
Figure 11: Operating metrics assumptions RPK growth ASK growth Load factor %
FY13 FY14F FY15F FY16F FY13 FY14F FY15F FY16F FY13 FY14F FY15F FY16F
AirAsia 11.4% 2.8% 13.5% 6.3% 11.3% 3.7% 12.8% 6.3% 80.0% 79.5% 80.0% 80.0%
AirAsia X 16.6% 28.9% 5.3% 7.5% 19.0% 29.1% 5.3% 7.5% 81.9% 82.0% 82.0% 82.0%
Source: RHB, Companies data
Yield
Amongst the two carriers, we expect yield growth to be stronger from AirAsia X, which is expected to increase by 10% in FY15 as its recently introduced routes matures and the proportion of discounted airfares reduces. Furthermore, we also anticipate MAS could trim its capacity on some of its Australia routes, which will be beneficial for AirAsia X.
Figure 12: Yield assumptions Underlying passenger yield growth Ancillary per pax growth Overall passenger yield growth FY13 FY14F FY15F FY16F FY13 FY14F FY15F FY16F FY13 FY14F FY15F FY16F
AirAsia -17.2% -4.7% 5.0% 2.0% -1.1% 6.9% 2.0% 0.5% -9.6% -1.8% 3.0% 1.7%
AirAsia X -6.0% -13.0% 10.0% 5.0% 1.5% -2.0% 5.0% 2.0% 0.9% -8.8% 7.5% 3.7%
Source: RHB, Companies data
Aviation 16 December 2014
See important disclosures at the end of this report 8
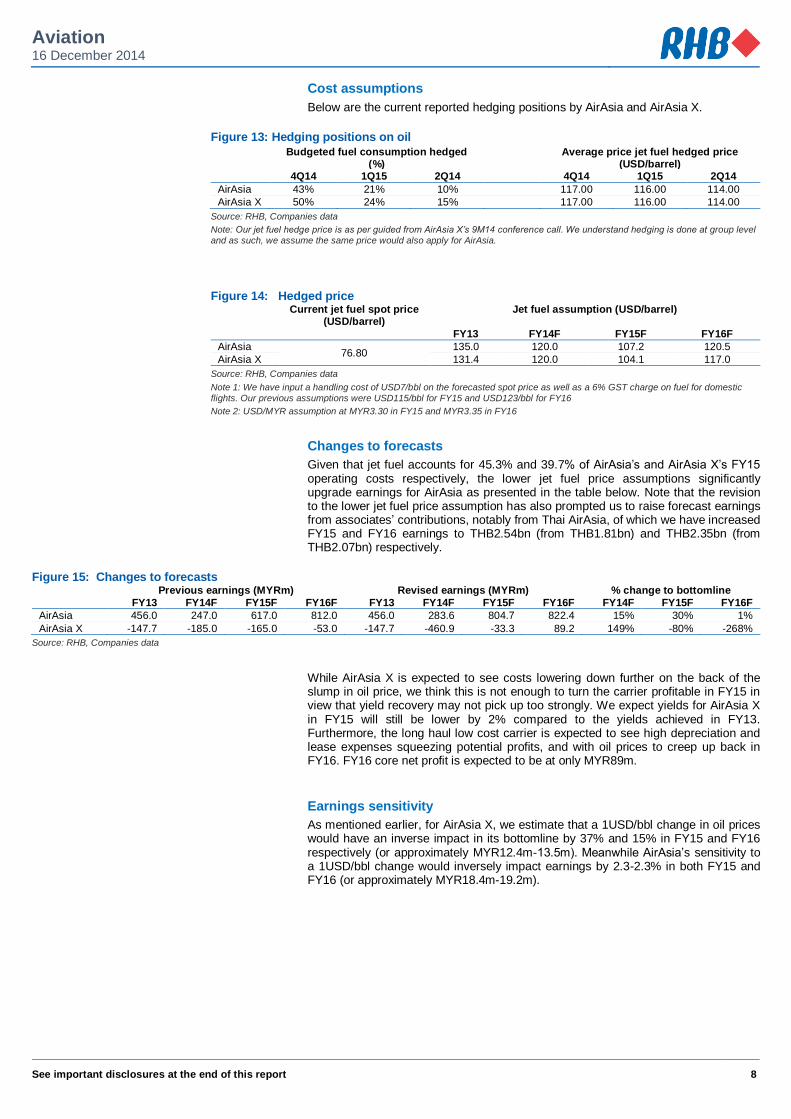
Cost assumptions
Below are the current reported hedging positions by AirAsia and AirAsia X.
Figure 13: Hedging positions on oil
Budgeted fuel consumption hedged (%)
Average price jet fuel hedged price (USD/barrel)
4Q14 1Q15 2Q14 4Q14 1Q15 2Q14
AirAsia 43% 21% 10% 117.00 116.00 114.00
AirAsia X 50% 24% 15% 117.00 116.00 114.00
Source: RHB, Companies data
Note: Our jet fuel hedge price is as per guided from AirAsia X’s 9M14 conference call. We understand hedging is done at group level
and as such, we assume the same price would also apply for AirAsia.
Figure 14: Hedged price Current jet fuel spot price
(USD/barrel) Jet fuel assumption (USD/barrel)
FY13 FY14F FY15F FY16F
AirAsia 76.80
135.0 120.0 107.2 120.5
AirAsia X 131.4 120.0 104.1 117.0
Source: RHB, Companies data
Note 1: We have input a handling cost of USD7/bbl on the forecasted spot price as well as a 6% GST charge on fuel for domestic
flights. Our previous assumptions were USD115/bbl for FY15 and USD123/bbl for FY16
Note 2: USD/MYR assumption at MYR3.30 in FY15 and MYR3.35 in FY16
Changes to forecasts
Given that jet fuel accounts for 45.3% and 39.7% of AirAsia’s and AirAsia X’s FY15 operating costs respectively, the lower jet fuel price assumptions significantly upgrade earnings for AirAsia as presented in the table below. Note that the revision to the lower jet fuel price assumption has also prompted us to raise forecast earnings from associates’ contributions, notably from Thai AirAsia, of which we have increased FY15 and FY16 earnings to THB2.54bn (from THB1.81bn) and THB2.35bn (from THB2.07bn) respectively.
Figure 15: Changes to forecasts Previous earnings (MYRm) Revised earnings (MYRm) % change to bottomline
FY13 FY14F FY15F FY16F FY13 FY14F FY15F FY16F FY14F FY15F FY16F
AirAsia 456.0 247.0 617.0 812.0 456.0 283.6 804.7 822.4 15% 30% 1%
AirAsia X -147.7 -185.0 -165.0 -53.0 -147.7 -460.9 -33.3 89.2 149% -80% -268%
Source: RHB, Companies data
While AirAsia X is expected to see costs lowering down further on the back of the slump in oil price, we think this is not enough to turn the carrier profitable in FY15 in view that yield recovery may not pick up too strongly. We expect yields for AirAsia X in FY15 will still be lower by 2% compared to the yields achieved in FY13. Furthermore, the long haul low cost carrier is expected to see high depreciation and lease expenses squeezing potential profits, and with oil prices to creep up back in FY16. FY16 core net profit is expected to be at only MYR89m.
Earnings sensitivity
As mentioned earlier, for AirAsia X, we estimate that a 1USD/bbl change in oil prices would have an inverse impact in its bottomline by 37% and 15% in FY15 and FY16 respectively (or approximately MYR12.4m-13.5m). Meanwhile AirAsia’s sensitivity to a 1USD/bbl change would inversely impact earnings by 2.3-2.3% in both FY15 and FY16 (or approximately MYR18.4m-19.2m).

Aviation 16 December 2014
See important disclosures at the end of this report 9
A Troubling Case For Malaysia Airports MAS’ capacity cuts to be replaced by other carriers
While MAS’ restructuring is expected to result in capacity cuts, we think this will not weigh heavily on reducing the overall passenger numbers handled by Malaysia Airports. This is because seat availability could be easily replaced by other carriers. The effect of a capacity cut by MAS was evident when the airline underwent a network shrinking exercise back in 2012, which led to 8.3% decline of its ASK and resulted in a drop of 8.4% YoY in passengers carried, according to its annual report. All of its capacity cuts were from the international segment, where ASK dipped 7.4% YoY, while the domestic side saw an increase of 4.8% YoY. Despite the decrease, Malaysia Airports saw its international passenger traffic numbers grow by 5.6%, bringing its total passengers handled higher by 4.7%. This was because the capacity that MAS gave up was quickly absorbed by other carriers, notably AirAsia. Aircraft movements recorded by Malaysia Airports for international flights in 2012, too, reflected the same quantum of increase in passenger traffic, which jumped by 5.7%. We also note that this happened in 2005-2007 as MAS underwent a route restructuring in 2006, especially for its domestic flights. This led to a 15% reduction in capacity. During the year, MAS also announced a mandatory separation scheme, trimming as much as 2,622 heads, or 18% of its workforce.
Figure 16: Percentage changes in pax (quarterly) between MAS, Malaysia Airports and AirAsia
Figure 17: Percentage changes in pax (quarterly) on domestic traffic
Title:
Source:
Please fill in the values above to have them entered in your report
-40%
-20%
0%
20%
40%
60%
80%
1Q
05
3Q
05
1Q
06
3Q
06
1Q
07
3Q
07
1Q
08
3Q
08
1Q
09
3Q
09
1Q
10
3Q
10
1Q
11
3Q
11
1Q
12
3Q
12
1Q
13
3Q
13
1Q
14
3Q
14
MAS total pax % chg YoY AirAsia total pax % chg YoY
MAHB total pax % chg YoY
Title:
Source:
Please fill in the values above to have them entered in your report
-50%
-40%
-30%
-20%
-10%
0%
10%
20%
30%
40%
50%1Q
05
3Q
05
1Q
06
3Q
06
1Q
07
3Q
07
1Q
08
3Q
08
1Q
09
3Q
09
1Q
10
3Q
10
1Q
11
3Q
11
1Q
12
3Q
12
1Q
13
3Q
13
1Q
14
3Q
14
MAS domestic pax % chg YoY
MAHB domestic pax % chg YoY
Source: Companies data Source: Companies data
Figure 18: Percentage changes in pax (quarterly) on international traffic
Title:
Source:
Please fill in the values above to have them entered in your report
-40%
-30%
-20%
-10%
0%
10%
20%
30%
40%
50%
1Q
05
3Q
05
1Q
06
3Q
06
1Q
07
3Q
07
1Q
08
3Q
08
1Q
09
3Q
09
1Q
10
3Q
10
1Q
11
3Q
11
1Q
12
3Q
12
1Q
13
3Q
13
1Q
14
3Q
14
MAS total international pax % chg YoY
MAHB total international pax % chg YoY
Source: Companies data

Aviation 16 December 2014
See important disclosures at the end of this report 10
The risk for Malaysia Airports is that the capacity cuts by MAS could result in lower earnings if more passengers begin to fly out of KLIA2, which charges lower airport taxes. However, we think the impact would be minimal. This is because there are still plenty of other full-service carriers that passengers can opt for to fly out of KLIA on their international routes. This risk, however, would be more exposed on domestic passengers out of KLIA potentially switching out to KLIA2, as this would be where most of the substitute domestic carriers, such as AirAsia and Malindo, are at. However, we take comfort in the fact that the difference in airport tax on domestic departure between KLIA2 and KLIA is significantly narrower in MYR terms, as it is significantly much cheaper when compared with international departures. As such, the magnitude of the drop in earnings – stemming from the shift to the cheaper airport tax charged at KLIA2 – would be manageable, in our view.
The wild card for Malaysia Airports
A positive catalyst for Malaysia Airports would be the potential upward revision in airport taxes at KLIA2, which is 33% lower for domestic departures and 51% lower for international departures vis-à-vis KLIA’s current tax rates. This is an attempt to implement a balanced airport tax structure between Kuala Lumpur’s two main airports. Should this materialise, it could provide a significant earnings boost for Malaysia Airports at the expense of carriers sacrificing the potential upside in yields if an airport tax hike did not materialise.

Aviation 16 December 2014
See important disclosures at the end of this report 11
Valuations And Recommendations AirAsia TP raised pegged at a lower FY15 target P/E
Following the earnings revision we raise TP for AirAsia to MYR3.47 (from MYR3.11). However, we lower our target FY15 P/E to 12x (from 14x) in light of consensus upgrades on peer comparables, which lowered the FY15 sector P/E multiple (which stands at 13.4x FY15 P/E). We still prefer AirAsia for its compelling valuations and thrifty operating structure. The stock remains our sector Top Pick. It has outperformed in the recent oil price slump and could enjoy an earnings upside should oil prices remain depressed for a protracted period.
AirAsia X still remains a SELL, citing balance sheet deterioration
Despite reducing FY15 losses by 80% on the lower jet fuel price assumptions, we nonetheless maintain our SELL stance, citing its lofty valuations. We continue to peg the stock at a target FY15 P/BV of 1.5x. Our P/BV target factors in AirAsia X’s leased aircraft as assets (at 20% equity funded) into its balance sheet.
The carrier’s deteriorating balance sheet raises concerns on how it would go about to fund its future aircraft acquisitions, of which it yesterday placed a firm order of 55 A330neo aircraft from Airbus (AIR FP, NR). These are slated for delivery beginning 2018. The A330neo is a new generation aircraft, which is understood to be 14% more fuel efficient. AirAsia X’s new order bumps up its total order to 91 aircraft from Airbus, which will be progressively delivered in 2016-2026. Some of these new deliveries are expected to replace aging aircraft from 2020 onwards.
As guided by management, there is a possibility of the carrier issuing a convertible bond in the near term to address its working capital and capex needs, as near term aircraft deliveries will be on an operational lease terms instead of a finance lease. We have assumed that AirAsia X will raise MYR500m in borrowings in FY14. The slump in oil prices has given some relief and, as such, we do not see a rights issue likely in the near term until it can produce consistent quarterly profits to investors.
Turning positive – upgrade sector to OVERWEIGHT
The slump in oil prices will clearly benefit the aviation sector. While we do not see demand growing strongly, sector earnings would be underpinned by the recovery in yields, with an additional positive impact from lower jet fuel prices. As we discontinued coverage on MAS, in light of its impending delisting, our market cap-weighted coverage now leans towards two BUY calls, namely AirAsia and Malaysia Airports vs one SELL call, AirAsia X. As such, we upgrade the sector to OVERWEIGHT from Neutral.
Figure 19: Peer comparison of low cost carriers
Last Price Market Cap
(USDm') FY01
P/E (x) FY02
P/E (x) FY01
EV/EBITDA (x) FY02
EV/EBITDA (x) FY02
P/BV (x) FY02 ROE (%)
AIRASIA BHD 2.80 2,221 27.4 9.7 11.5 8.7 1.3 13.9
AIRASIA X 0.69 463 - - - 11.5 1.8 -3.6
NOK AIR 13.40 254 - 13.0 - 4.4 1.9 14.7
ASIA AVIATION 4.66 685 - 16.2 35.3 8.0 1.1 4.8
TIGER AIRWAYS HOLDINGS LTD 0.28 467 - - - 52.6 2.7 -69.9
CEBU AIR INC 88.00 1,194 16.9 13.6 9.7 8.6 2.2 14.9
JET AIRWAYS INDIA LTD 373.25 666 - 14.7 13.2 7.5 - 17.0
SOUTHWEST AIRLINES CO 41.58 28,222 21.3 15.2 8.4 6.5 3.5 17.7
AIR ARABIA 1.38 1,753 12.7 11.3 10.3 8.4 1.2 10.0
RYANAIR HOLDINGS PLC 9.29 16,021 16.3 14.5 9.0 8.2 3.5 23.0
ALLEGIANT TRAVEL CO 136.84 2,393 23.0 16.5 9.8 7.2 5.3 26.4
NORWEGIAN AIR SHUTTLE AS 280.00 1,322 - 18.0 122.1 9.7 3.8 -5.6
AER LINGHUS GROUP 1.78 1,174 15.1 12.9 3.2 2.9 1.1 7.8
EASYJET PLC 1594.00 9,901 12.5 11.1 7.5 6.8 2.5 21.1
JETBLUE AIRWAYS CORP 14.94 4,360 20.8 12.2 7.1 4.9 2.0 11.9
GOL LINHAS AEREAS INTEL-ADR 5.11 1,447 - 43.7 - - 10.9 -46.3
WESTJET AIRLINES LTD 34.27 3,192 14.3 11.3 5.1 4.1 2.5 17.9
Average 18.0 15.6 19.4 10.0 3.0 4.4
Average Asia LCCs 22.2 13.4 17.4 8.1 1.8 10.3
Source: RHB, Bloomberg *Last price based on respective local currency, close as of 15 Dec

12
RHB Guide to Investment Ratings Buy: Share price may exceed 10% over the next 12 months
Trading Buy: Share price may exceed 15% over the next 3 months, however longer-term outlook remains uncertain Neutral: Share price may fall within the range of +/- 10% over the next 12 months Take Profit: Target price has been attained. Look to accumulate at lower levels
Sell: Share price may fall by more than 10% over the next 12 months Not Rated: Stock is not within regular research coverage
Disclosure & Disclaimer
All research is based on material compiled from data considered to be reliable at the time of writing, but RHB does not make any representation or warranty, express or implied, as to its accuracy, completeness or correctness. No part of this report is to be construed as an offer or solicitation of an offer to transact any securities or financial instruments whether referred to herein or otherwise. This report is general in nature and has been prepared for
information purposes only. It is intended for circulation to the clients of RHB and its related companies. Any recommendation contained in this report does not have regard to the specific investment objectives, financial situation and the particular needs of any specific addressee. This report is for the information of addressees only and is not to be taken in substitution for the exercise of judgment by addressees, who should obtain separate legal or
financial advice to independently evaluate the particular investments and strategies. This report may further consist of, whether in whole or in part, summaries, research, compilations, extracts or analysis tha t has been prepared by RHB’s
strategic, joint venture and/or business partners. No representation or warranty (express or implied) is given as to the accuracy or completeness of such information and accordingly investors should make their own informed decisions before relying on the same.
RHB, its affiliates and related companies, their respective directors, associates, connected parties and/or employees may own or have positions in securities of the company(ies) covered in this research report or any securities related thereto, and may from time to time add to, or dispose off, or may be materially interested in any such securities. Further, RHB, its affiliates and related companies do and seek to do business with the company(ies) covered
in this research report and may from time to time act as market maker or have assumed an underwriting commitment in securities of such company(ies), may sell them or buy them from customers on a principal basis and may also perform or seek to perform significant investment banking, advisory or underwriting services for or relating to such company(ies), as well as solicit such investment, advisory or other services from any entity mentioned in this
research report. RHB and its employees and/or agents do not accept any liability, be it directly, indirectly or consequential losses, loss of profits or damages that may arise
from any reliance based on this report or further communication given in relation to this report, including where such losses, loss of profits or damages are alleged to have arisen due to the contents of such report or communication being perceived as defamatory in nature.
The term “RHB” shall denote where applicable, the relevant entity distributing the report in the particular jurisdiction ment ioned specifically herein below and shall refer to RHB Research Institute Sdn Bhd, its holding company, affiliates, subsidiaries and related companies.
All Rights Reserved. This report is for the use of intended recipients only and may not be reproduced, distributed or published for any purpose without prior consent of RHB and RHB accepts no liability whatsoever for the actions of third parties in this respect.
Malaysia This report is published and distributed in Malaysia by RHB Research Institute Sdn Bhd (233327-M), Level 11, Tower One, RHB Centre, Jalan Tun Razak,
50400 Kuala Lumpur, a wholly-owned subsidiary of RHB Investment Bank Berhad (RHBIB), which in turn is a wholly-owned subsidiary of RHB Capital Berhad.
Singapore This report is published and distributed in Singapore by DMG & Partners Research Pte Ltd (Reg. No. 200808705N), a wholly-owned subsidiary of DMG &
Partners Securities Pte Ltd, a joint venture between Deutsche Asia Pacific Holdings Pte Ltd (a subsidiary of Deutsche Bank Group) and OSK Investment Bank Berhad, Malaysia which have since merged into RHB Investment Bank Berhad (the merged entity is referred to as “RHBIB”, which in turn is a wholly-owned subsidiary of RHB Capital Berhad). DMG & Partners Securities Pte Ltd is a Member of the Singapore Exchange Securities T rading Limited. DMG &
Partners Securities Pte Ltd may have received compensation from the company covered in this report for its corporate finance or its dealing activities; this report is therefore classified as a non-independent report.
As of 15 December 2014, DMG & Partners Securities Pte Ltd and its subsidiaries, including DMG & Partners Research Pte Ltd do not have proprietary positions in the securities covered in this report, except for: a) -
As of 15 December 2014, none of the analysts who covered the securities in this report has an interest in such securities, except for: a) -
Special Distribution by RHB
Where the research report is produced by an RHB entity (excluding DMG & Partners Research Pte Ltd) and distributed in Singapore, it is only distributed to "Institutional Investors", "Expert Investors" or "Accredited Investors" as defined in the Securities and Futures Act, CAP. 289 of Singapore. If you are not an "Institutional Investor", "Expert Investor" or "Accredited Investor", this research report is not intended for you and you should disregard this research
report in its entirety. In respect of any matters arising from, or in connection with this research report, you are to contact our Singapore Office, DMG & Partners Securities Pte Ltd
Hong Kong
This report is published and distributed in Hong Kong by RHB OSK Securities Hong Kong Limited (“RHBSHK”) (formerly known as OSK Securities Hong Kong Limited), a subsidiary of OSK Investment Bank Berhad, Malaysia which have since merged into RHB Investment Bank Berhad ( the merged entity is referred to as “RHBIB”), which in turn is a wholly-owned subsidiary of RHB Capital Berhad.

13
RHBSHK, RHBIB and/or other affiliates may beneficially own a total of 1% or more of any class of common equity securities of the subject company. RHBSHK, RHBIB and/or other affiliates may, within the past 12 months, have received compensation and/or within the next 3 months seek to obtain compensation for investment banking services from the subject company.
Risk Disclosure Statements
The prices of securities fluctuate, sometimes dramatically. The price of a security may move up or down, and may become valueless. It is as likely that losses will be incurred rather than profit made as a result of buying and selling securities. Past performance is not a guide to future performance. RHBSHK does not maintain a predetermined schedule for publication of research and will not necessarily update this report
Indonesia
This report is published and distributed in Indonesia by PT RHB OSK Securities Indonesia (formerly known as PT OSK Nusadana S ecurities Indonesia), a subsidiary of OSK Investment Bank Berhad, Malaysia, which have since merged into RHB Investment Bank Berhad, which in turn is a wholly-owned
subsidiary of RHB Capital Berhad. Thailand
This report is published and distributed in Thailand by RHB OSK Securities (Thailand) PCL (formerly known as OSK Securities (Thailand) PCL), a subsidiary of OSK Investment Bank Berhad, Malaysia, which have since merged into RHB Investment Bank Berhad, which in turn is a wholly-owned
subsidiary of RHB Capital Berhad. Other Jurisdictions
In any other jurisdictions, this report is intended to be distributed to qualified, accredited and professional investors, in compliance with the law and regulations of the jurisdictions.
DMG & Partners Research Guide to Investment Ratings
Buy: Share price may exceed 10% over the next 12 months Trading Buy: Share price may exceed 15% over the next 3 months, however longer-term outlook remains uncertain
Neutral: Share price may fall within the range of +/- 10% over the next 12 months Take Profit: Target price has been attained. Look to accumulate at lower levels Sell: Share price may fall by more than 10% over the next 12 months
Not Rated: Stock is not within regular research coverage DISCLAIMERS
This research is issued by DMG & Partners Research Pte Ltd and it is for general distribution only. It does not have any regard to the specific investment objectives, financial situation and particular needs of any specific recipient of this research report. You should independently evaluate particular
investments and consult an independent financial adviser before making any investments or entering into any transaction in relation to any securities or investment instruments mentioned in this report.
The information contained herein has been obtained from sources we believed to be reliable but we do not make any representation or warranty nor accept any responsibility or liability as to its accuracy, completeness or correctness. Opinions and views expressed in this report are subject to change without notice.
This report does not constitute or form part of any offer or solicitation of any offer to buy or sell any securities.
DMG & Partners Research Pte Ltd is a wholly-owned subsidiary of DMG & Partners Securities Pte Ltd, a joint venture between OSK Investment Bank Berhad, Malaysia which have since merged into RHB Investment Bank Berhad (the merged entity is referred to as “RHBIB” which in turn is a wholly-owned subsidiary of RHB Capital Berhad) and Deutsche Asia Pacific Holdings Pte Ltd (a subsidiary of Deutsche Bank Group). DMG & Partners Securities
Pte Ltd is a Member of the Singapore Exchange Securities Trading Limited. DMG & Partners Securities Pte Ltd and their associates, directors, and/or employees may have positions in, and may effect transactions in the securities
covered in the report, and may also perform or seek to perform broking and other corporate finance related services for the corporations whose securities are covered in the report. This report is therefore classified as a non-independent report.
As of 15 December 2014, DMG & Partners Securities Pte Ltd and its subsidiaries, including DMG & Partners Research Pte Ltd, do not have proprietary positions in the subject companies, except for: a) -
As of 15 December 2014, none of the analysts who covered the stock in this report has an interest in the subject companies covered in this report, except for:
a) - DMG & Partners Research Pte. Ltd. (Reg. No. 200808705N)
Kuala Lumpur Hong Kong Singapore
Malaysia Research Office
RHB Research Institute Sdn Bhd
Level 11, Tower One, RHB Centre Jalan Tun Razak
Kuala Lumpur Malaysia
Tel : +(60) 3 9280 2185 Fax : +(60) 3 9284 8693
RHB OSK Securities Hong Kong Ltd. (formerly known
as OSK Securities
Hong Kong Ltd.) 12
th Floor
World-Wide House 19 Des Voeux Road Central, Hong Kong
Tel : +(852) 2525 1118 Fax : +(852) 2810 0908
DMG & Partners
Securities Pte. Ltd.
10 Collyer Quay #09-08 Ocean Financial Centre
Singapore 049315 Tel : +(65) 6533 1818 Fax : +(65) 6532 6211
Jakarta Shanghai Phnom Penh
PT RHB OSK Securities Indonesia (formerly known as
PT OSK Nusadana Securities Indonesia)
Plaza CIMB Niaga 14th Floor
Jl. Jend. Sudirman Kav.25 Jakarta Selatan 12920, Indonesia
Tel : +(6221) 2598 6888 Fax : +(6221) 2598 6777
RHB OSK (China) Investment Advisory Co. Ltd.
(formerly known as OSK (China) Investment Advisory Co. Ltd.)
Suite 4005, CITIC Square 1168 Nanjing West Road
Shanghai 20041 China
Tel : +(8621) 6288 9611 Fax : +(8621) 6288 9633
RHB OSK Indochina Securities Limited (formerly
known as OSK Indochina Securities Limited) No. 1-3, Street 271
Sangkat Toeuk Thla, Khan Sen Sok Phnom Penh
Cambodia Tel: +(855) 23 969 161 Fax: +(855) 23 969 171
Bangkok
RHB OSK Securities (Thailand) PCL (formerly known
as OSK Securities (Thailand) PCL) 10th Floor, Sathorn Square Office Tower
98, North Sathorn Road, Silom Bangrak, Bangkok 10500
Thailand Tel: +(66) 2 862 9999 Fax : +(66) 2 108 0999