Aviação e a Atmosfera Global
23
Summary for Policymakers I P CC S P ECI A L REPORT A V IAT IO N A ND THE GL O BA L A TM O S PHERE
-
Upload
andi-agencia-de-noticias-do-direito-da-infancia -
Category
Documents
-
view
217 -
download
0
Transcript of Aviação e a Atmosfera Global

8/14/2019 Aviação e a Atmosfera Global
http://slidepdf.com/reader/full/aviacao-e-a-atmosfera-global 1/23
Summary for Policymakers
IPCC SPECIAL REPORT
AVIATION AND THE
GLOBAL ATMOSPHERE

8/14/2019 Aviação e a Atmosfera Global
http://slidepdf.com/reader/full/aviacao-e-a-atmosfera-global 2/23
8/14/2019 Aviação e a Atmosfera Global
http://slidepdf.com/reader/full/aviacao-e-a-atmosfera-global 3/23
Summary for Policymakers
Aviation and the
Global Atmosphere
Edited by
Joyce E. Penner David H. ListerUniversity of Michigan Defence Research
and Evaluation Agency
David J. Griggs David J. Dokken Mack McFarlandUK Meteorological Office University Corporation DuPont Fluoroproducts
for Atmospheric Research
A Special Report of IPCC Working Groups I and III
in collaboration with the
Scientific Assessment Panel to the Montreal Protocol
on Substances that Deplete the Ozone Layer
Published for the Intergovernmental Panel on Climate Change

8/14/2019 Aviação e a Atmosfera Global
http://slidepdf.com/reader/full/aviacao-e-a-atmosfera-global 4/23
© 1999, Intergovernmental Panel on Climate Change
ISBN: 92-9169-

8/14/2019 Aviação e a Atmosfera Global
http://slidepdf.com/reader/full/aviacao-e-a-atmosfera-global 5/23
Contents
Foreword . . . . . . . . . . . . . . . . . . . . . . . . . . . . . . . . . . . . . . . . . . . . . . . . . . . . . . . . . . . . . . . . . . . . . . . . . . . . . . . . . . . v
Preface . . . . . . . . . . . . . . . . . . . . . . . . . . . . . . . . . . . . . . . . . . . . . . . . . . . . . . . . . . . . . . . . . . . . . . . . . . . . . . . . . . . . vii
1. Introduction . . . . . . . . . . . . . . . . . . . . . . . . . . . . . . . . . . . . . . . . . . . . . . . . . . . . . . . . . . . . . . . . . . . . . . . . . . . . . . . . . . 3
2. How Do Aircraft Affect Climate and Ozone? . . . . . . . . . . . . . . . . . . . . . . . . . . . . . . . . . . . . . . . . . . . . . . . . . . . . . . . 3
3. How are Aviation Emissions Projected to Grow in the Future? . . . . . . . . . . . . . . . . . . . . . . . . . . . . . . . . . . . . . . . . . 4
4. What are the Current and Future Impacts of Subsonic Aviation on Radiative Forcing and UV Radiation? . . . . . 6
4.1 Carbon Dioxide . . . . . . . . . . . . . . . . . . . . . . . . . . . . . . . . . . . . . . . . . . . . . . . . . . . . . . . . . . . . . . . . . . . . . . . . 6
4.2 Ozone . . . . . . . . . . . . . . . . . . . . . . . . . . . . . . . . . . . . . . . . . . . . . . . . . . . . . . . . . . . . . . . . . . . . . . . . . . . . . . . 6
4.3 Methane . . . . . . . . . . . . . . . . . . . . . . . . . . . . . . . . . . . . . . . . . . . . . . . . . . . . . . . . . . . . . . . . . . . . . . . . . . . . . 64.4 Water Vapour . . . . . . . . . . . . . . . . . . . . . . . . . . . . . . . . . . . . . . . . . . . . . . . . . . . . . . . . . . . . . . . . . . . . . . . . . 7
4.5 Contrails . . . . . . . . . . . . . . . . . . . . . . . . . . . . . . . . . . . . . . . . . . . . . . . . . . . . . . . . . . . . . . . . . . . . . . . . . . . . . 7
4.6 Cirrus Clouds . . . . . . . . . . . . . . . . . . . . . . . . . . . . . . . . . . . . . . . . . . . . . . . . . . . . . . . . . . . . . . . . . . . . . . . . . 8
4.7 Sulfate and Soot Aerosols . . . . . . . . . . . . . . . . . . . . . . . . . . . . . . . . . . . . . . . . . . . . . . . . . . . . . . . . . . . . . . . . 8
4.8 What are the Overall Climate Effects of Subsonic Aircraft? . . . . . . . . . . . . . . . . . . . . . . . . . . . . . . . . . . . . . . . 8
4.9 What are the Overall Effects of Subsonic Aircraft on UV-B? . . . . . . . . . . . . . . . . . . . . . . . . . . . . . . . . . . . . . . 9
5. What are the Current and Future Impacts of Supersonic Aviation on Radiative Forcing and UV Radiation? . . . 9
6. What are the Options to Reduce Emissions and Impacts? . . . . . . . . . . . . . . . . . . . . . . . . . . . . . . . . . . . . . . . . . . . . . 10
6.1 Aircraft and Engine Technology Options . . . . . . . . . . . . . . . . . . . . . . . . . . . . . . . . . . . . . . . . . . . . . . . . . . . . . . . . 10
6.2 Fuel Options . . . . . . . . . . . . . . . . . . . . . . . . . . . . . . . . . . . . . . . . . . . . . . . . . . . . . . . . . . . . . . . . . . . . . . . . . . . . . 106.3 Operational Options . . . . . . . . . . . . . . . . . . . . . . . . . . . . . . . . . . . . . . . . . . . . . . . . . . . . . . . . . . . . . . . . . . . . . . . 11
6.4 Regulatory, Economic, and Other Options . . . . . . . . . . . . . . . . . . . . . . . . . . . . . . . . . . . . . . . . . . . . . . . . . . . . . . . 11
7. Issues for the Future . . . . . . . . . . . . . . . . . . . . . . . . . . . . . . . . . . . . . . . . . . . . . . . . . . . . . . . . . . . . . . . . . . . . . . . . . . . 12
List of IPCC Outputs . . . . . . . . . . . . . . . . . . . . . . . . . . . . . . . . . . . . . . . . . . . . . . . . . . . . . . . . . . . . . . . . . . . . . . . . . . 13

8/14/2019 Aviação e a Atmosfera Global
http://slidepdf.com/reader/full/aviacao-e-a-atmosfera-global 6/23

8/14/2019 Aviação e a Atmosfera Global
http://slidepdf.com/reader/full/aviacao-e-a-atmosfera-global 7/23
Foreword
The Intergovernmental Panel on Climate Change (IPCC) was
jointly established by the World Meteorological Organization(WMO) and the United Nations Environment Programme
(UNEP) in 1988 to: (i) assess available information on the
science, the impacts, and the economics of, and the options for
mitigating and/or adapting to, climate change and (ii) provide,
on request, scientific/technical/socio-economic advice to the
Conference of the Parties (COP) to the United Nations
Framework Convention on Climate Change (UNFCCC). Since
then the IPCC has produced a series of Assessment Reports,
Special Reports, Technical Papers, methodologies, and other
products that have become standard works of reference, widely
used by policymakers, scientists, and other experts.
This Special Report was prepared following a request from
the International Civil Aviation Organization (ICAO) and the
Parties to the Montreal Protocol on Substances that Deplete the
Ozone Layer. The state of understanding of the relevant science
of the atmosphere, aviation technology, and socio-economic
issues associated with mitigation options is assessed and reported
for both subsonic and supersonic fleets. The potential effects
that aviation has had in the past and may have in the future on
both stratospheric ozone depletion and global climate change
are covered; environmental impacts of aviation at the local
scale, however, are not addressed. The report synthesizes the
findings to identify and characterize options for mitigating
future impacts.
As is usual in the IPCC, success in producing this report has
depended first and foremost on the enthusiasm and cooperation
of experts worldwide in many related but different disciplines.
We would like to express our gratitude to all the Coordinating
Lead Authors, Lead Authors, Contributing Authors, ReviewEditors, and Expert Reviewers. These individuals have devoted
enormous time and effort to produce this report and we are
extremely grateful for their commitment to the IPCC process.
We would also like to express our sincere thanks to:
• Robert Watson, the Chairman of the IPCC and Co-Chair
of the Scientific Assessment Panel to the Montreal
Protocol
• John Houghton, Ding Yihui, Bert Metz, and Ogunlade
Davidson—the Co-Chairs of IPCC Working Groups I
and III
• Daniel Albritton, Co-Chair of the Scientific Assessment
Panel to the Montreal Protocol
• David Lister and Joyce Penner, the Coordinators of this
Special Report
• Daniel Albritton, John Crayston, Ogunlade Davidson,
David Griggs, Neil Harris, John Houghton, Mack
McFarland, Bert Metz, Nelson Sabogal, N. Sundararaman,
Robert Watson, and Howard Wesoky—the Science
Steering Committee for this Special Report
• David Griggs, David Dokken, and all the staff of the
Working Group I and II Technical Support Units,
including Mack McFarland, Richard Moss, Anne Murrill,
Sandy MacCracken, Maria Noguer, Laura Van WieMcGrory, Neil Leary, Paul van der Linden, and Flo
Ormond, and Neil Harris who provided additional help
• N. Sundararaman, the Secretary of the IPCC, and his staff,
Rudie Bourgeois, Cecilia Tanikie, and Chantal Ettori.
G.O.P. Obasi
Secretary-General
World Meteorological Organization
K. Töpfer
Executive Director
United Nations Environment Programme
and
Director-GeneralUnited Nations Office in Nairobi

8/14/2019 Aviação e a Atmosfera Global
http://slidepdf.com/reader/full/aviacao-e-a-atmosfera-global 8/23

8/14/2019 Aviação e a Atmosfera Global
http://slidepdf.com/reader/full/aviacao-e-a-atmosfera-global 9/23
Preface
Following a request from the International Civil Aviation
Organization (ICAO) to assess the consequences of greenhousegas emissions from aircraft engines, the IPCC at its Twelfth
Session (Mexico City, 11–13 September 1996) decided to produce
this Special Report, Aviation and the Global Atmosphere, in
collaboration with the Scientific Assessment Panel to the
Montreal Protocol. The task was initially a joint responsibility
between IPCC Working Groups I and II but, following a
change in the terms of reference of the Working Groups
(Thirteenth Session of the IPCC, Maldives, 22 and 25-28
September 1997), the responsibility was transferred to IPCC
Working Groups I and III, with administrative support remaining
with the Technical Support Units of Working Groups I and II.
Although it is less than 100 years since the first powered flight,
the aviation industry has undergone rapid growth and has
become an integral and vital part of modern society. In the
absence of policy intervention, the growth is likely to continue.
It is therefore highly relevant to consider the current and
possible future effects of aircraft engine emissions on the
atmosphere. A unique aspect of this report is the integral
involvement of technical experts from the aviation industry,
including airlines, and airframe and engine manufacturers,
alongside atmospheric scientists. This involvement has been
critical in producing what we believe is the most comprehensive
assessment available to date of the effects of aviation on the
global atmosphere. Although this Special Report is the firstIPCC report to consider a particular industrial subsector, other
sectors equally deserve study.
The report considers all the gases and particles emitted by aircraft
into the upper atmosphere and the role that they play in modifying
the chemical properties of the atmosphere and initiating the
formation of condensation trails (contrails) and cirrus clouds.
The report then considers (a) how the radiative properties of
the atmosphere can be modified as a result, possibly leading to
climate change, and (b) how the ozone layer could be modified,
leading to changes in ultraviolet radiation reaching the Earth’s
surface. The report also considers how potential changes inaircraft technology, air transport operations, and the institutional,
regulatory, and economic framework might affect emissions in
the future. The report does not deal with the effects of engine
emissions on local air quality near the surface.
The objective of this Special Report is to provide accurate,
unbiased, policy-relevant information to serve the aviation
industry and the expert and policymaking communities. The
report, in describing the current state of knowledge, also
identifies areas where our understanding is inadequate and
where further work is urgently required. It does not make
policy recommendations or suggest policy preferences, thus is
consistent with IPCC practice.
This report was compiled by 107 Lead Authors from 18 coun-
tries. Successive drafts of the report were circulated for reviewby experts, followed by review of governments and experts.
Over 100 Contributing Authors submitted draft text and infor-
mation to the Lead Authors and over 150 reviewers submitted
valuable suggestions for improvement during the review
process. All the comments received were carefully analysed
and assimilated into a revised document for consideration at
the joint session of IPCC Working Groups I and III held in San
José, Costa Rica, 12–14 April 1999. There, the Summary for
Policymakers was approved in detail and the underlying report
accepted.
We wish to express our sincere appreciation to the Report
Coordinators, David Lister and Joyce Penner; to all the
Coordinating Lead Authors, Lead Authors, and Review Editors
whose expertise, diligence, and patience have underpinned
the successful completion of this report; and to the many
contributors and reviewers for their valuable and painstaking
dedication and work. We thank the Steering Committee for
their wise counsel and guidance throughout the preparation of
the report. We are grateful to:
• ICAO for hosting the initial scoping meeting for the
report and the final drafting meeting, and for translating
the Summary for Policymakers into Arabic, Chinese,
French, Russian, and Spanish (ICAO also providedtechnical inputs requested)
• The government of Trinidad and Tobago for hosting the
first drafting meeting
• The International Air Transport Association (IATA) for
hosting the second drafting meeting
• The government of Costa Rica for hosting the Joint
Session of IPCC Working Groups I and III (San José,
12–14 April 1999), where the Summary for Policymakers
was approved line by line and the underlying assessment
accepted.
In particular, we are grateful to John Crayston (ICAO), StevePollonais (Government of Trinidad and Tobago), Leonie Dobbie
(IATA), and Max Campos (government of Costa Rica) for their
taking on the demanding burden of arranging for these meetings.
We also thank Anne Murrill of the Working Group I Technical
Support Unit and Sandy MacCracken of the Working Group II
Technical Support Unit for their tireless and good humored
support throughout the preparation of the report. Other members
of the Technical Support Units of Working Groups I and II also
provided much assistance, including Richard Moss, Mack
McFarland, Maria Noguer, Laura Van Wie McGrory, Neil
Leary, Paul van der Linden, and Flo Ormond. The staff of the
IPCC Secretariat, Rudie Bourgeois, Cecilia Tanikie, and

8/14/2019 Aviação e a Atmosfera Global
http://slidepdf.com/reader/full/aviacao-e-a-atmosfera-global 10/23
Chantal Ettori, provided logistical support for all government
liaison and travel of experts from the developing and transi-
tional economy countries.
Robert Watson, IPCC Chairman
John Houghton, Co-Chair of IPCC Working Group I
Ding Yihui, Co-Chair of IPCC Working Group I
Bert Metz, Co-Chair of IPCC Working Group III
Ogunlade Davidson, Co-Chair of IPCC Working Group III
N. Sundararaman, IPCC Secretary
David Griggs, IPCC Working Group I TSU
David Dokken, IPCC Working Group II TSU
Aviation and the Global Atmosphereviii

8/14/2019 Aviação e a Atmosfera Global
http://slidepdf.com/reader/full/aviacao-e-a-atmosfera-global 11/23

8/14/2019 Aviação e a Atmosfera Global
http://slidepdf.com/reader/full/aviacao-e-a-atmosfera-global 12/23

8/14/2019 Aviação e a Atmosfera Global
http://slidepdf.com/reader/full/aviacao-e-a-atmosfera-global 13/23
1. Introduction
This report assesses the effects of aircraft on climate and
atmospheric ozone and is the first IPCC report for a specific
industrial subsector. It was prepared by IPCC in collaboration
with the Scientific Assessment Panel to the Montreal Protocol
on Substances that Deplete the Ozone Layer, in response to a
request by the International Civil Aviation Organization(ICAO)1 because of the potential impact of aviation emissions.
These are the predominant anthropogenic emissions deposited
directly into the upper troposphere and lower stratosphere.
Aviation has experienced rapid expansion as the world economy
has grown. Passenger traffic (expressed as revenue passenger-
kilometres2) has grown since 1960 at nearly 9% per year, 2.4
times the average Gross Domestic Product (GDP) growth rate.
Freight traffic, approximately 80% of which is carried by
passenger airplanes, has also grown over the same time period.
The rate of growth of passenger traffic has slowed to about 5%
in 1997 as the industry is maturing. Total aviation emissionshave increased, because increased demand for air transport has
outpaced the reductions in specific emissions3 from the continuing
improvements in technology and operational procedures.
Passenger traffic, assuming unconstrained demand, is projected to
grow at rates in excess of GDP for the period assessed in this report.
The effects of current aviation and of a range of unconstrained
growth projections for aviation (which include passenger,
freight, and military) are examined in this report, including the
possible effects of a fleet of second generation, commercial
supersonic aircraft. The report also describes current aircraft
technology, operating procedures, and options for mitigating
aviation’s future impact on the global atmosphere. Thereport does not consider the local environmental effects of air-
craft engine emissions or any of the indirect environmental
effects of aviation operations such as energy usage by ground
transportation at airports.
2. How Do Aircraft Affect Climate and Ozone?
Aircraft emit gases and particles directly into the upper
troposphere and lower stratosphere where they have an impact
on atmospheric composition. These gases and particles alter
the concentration of atmospheric greenhouse gases, includingcarbon dioxide (CO2), ozone (O3), and methane (CH 4); trigger
formation of condensation trails (contrails); and may increase
cirrus cloudiness—all of which contribute to climate change
(see Box on page 4).
The principal emissions of aircraft include the greenhouse
gases carbon dioxide and water vapour (H2O). Other major
emissions are nitric oxide (NO) and nitrogen dioxide (NO2)
(which together are termed NOx), sulfur oxides (SOx), and soot.
The total amount of aviation fuel burned, as well as the total
emissions of carbon dioxide, NOx, and water vapour by air-
craft, are well known relative to other parameters important to
this assessment.
The climate impacts of the gases and particles emitted and
formed as a result of aviation are more difficult to quantify than
the emissions; however, they can be compared to each other
and to climate effects from other sectors by using the concept
of radiative forcing.4 Because carbon dioxide has a long
atmospheric residence time (≈100 years) and so becomes well
mixed throughout the atmosphere, the effects of its emissions
from aircraft are indistinguishable from the same quantity of carbon dioxide emitted by any other source. The other gases
(e.g., NOx, SOx, water vapour) and particles have shorter
atmospheric residence times and remain concentrated near
flight routes, mainly in the northern mid-latitudes. These
emissions can lead to radiative forcing that is regionally located
near the flight routes for some components (e.g., ozone and
contrails) in contrast to emissions that are globally mixed (e.g.,
carbon dioxide and methane).
The global mean climate change is reasonably well represented
by the global average radiative forcing, for example, when
evaluating the contributions of aviation to the rise in globallyaveraged temperature or sea level. However, because some of
aviation’s key contributions to radiative forcing are located
mainly in the northern mid-latitudes, the regional climate
response may differ from that derived from a global mean
radiative forcing. The impact of aircraft on regional climate
could be important, but has not been assessed in this report.
Ozone is a greenhouse gas. It also shields the surface of the
Earth from harmful ultraviolet (UV) radiation, and is a com-
mon air pollutant. Aircraft-emitted NOx participates in ozone
chemistry. Subsonic aircraft fly in the upper troposphere and
lower stratosphere (at altitudes of about 9 to 13 km), whereas
supersonic aircraft cruise several kilometres higher (at about 17to 20 km) in the stratosphere. Ozone in the upper troposphere
and lower stratosphere is expected to increase in response to
NOx increases and methane is expected to decrease. At higher
altitudes, increases in NOx lead to decreases in the stratospheric
ozone layer. Ozone precursor (NOx) residence times in these
regions increase with altitude, and hence perturbations to
ozone by aircraft depend on the altitude of NOx injection and
vary from regional in scale in the troposphere to global in scale
in the stratosphere.
1 ICAO is the United Nations specialized agency that has global
responsibility for the establishment of standards, recommended
practices, and guidance on various aspects of international civil
aviation, including environmental protection.
2 The revenue passenger-km is a measure of the traffic carried by
commercial aviation: one revenue-paying passenger carried 1 km.
3 Specific emissions are emissions per unit of traffic carried, for
instance, per revenue passenger-km.
4 Radiative forcing is a measure of the importance of a potential
climate change mechanism. It expresses the perturbation or change
to the energy balance of the Earth-atmosphere system in watts per
square metre (Wm-2
). Positive values of radiative forcing imply anet warming, while negative values imply cooling.
8/14/2019 Aviação e a Atmosfera Global
http://slidepdf.com/reader/full/aviacao-e-a-atmosfera-global 14/23
Aviation and the Global Atmosphere 4
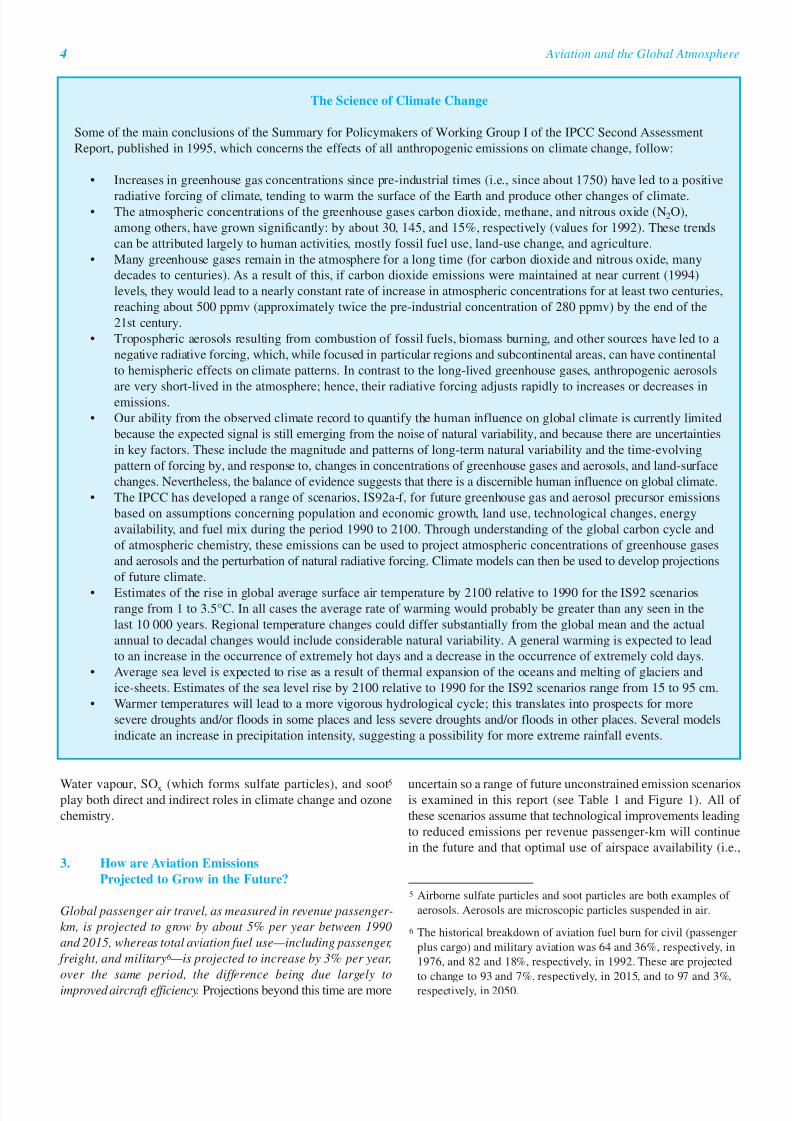
Water vapour, SOx (which forms sulfate particles), and soot5play both direct and indirect roles in climate change and ozone
chemistry.
3. How are Aviation Emissions
Projected to Grow in the Future?
Global passenger air travel, as measured in revenue passenger-
km, is projected to grow by about 5% per year between 1990
and 2015, whereas total aviation fuel use—including passenger,
freight, and military6 —is projected to increase by 3% per year,
over the same period, the difference being due largely to
improved aircraft efficiency. Projections beyond this time are more
uncertain so a range of future unconstrained emission scenariosis examined in this report (see Table 1 and Figure 1). All of
these scenarios assume that technological improvements leading
to reduced emissions per revenue passenger-km will continue
in the future and that optimal use of airspace availability (i.e.,
5 Airborne sulfate particles and soot particles are both examples of
aerosols. Aerosols are microscopic particles suspended in air.
6 The historical breakdown of aviation fuel burn for civil (passenger
plus cargo) and military aviation was 64 and 36%, respectively, in
1976, and 82 and 18%, respectively, in 1992. These are projected
to change to 93 and 7%, respectively, in 2015, and to 97 and 3%,respectively, in 2050.
The Science of Climate Change
Some of the main conclusions of the Summary for Policymakers of Working Group I of the IPCC Second Assessment
Report, published in 1995, which concerns the effects of all anthropogenic emissions on climate change, follow:
• Increases in greenhouse gas concentrations since pre-industrial times (i.e., since about 1750) have led to a positive
radiative forcing of climate, tending to warm the surface of the Earth and produce other changes of climate.• The atmospheric concentrations of the greenhouse gases carbon dioxide, methane, and nitrous oxide (N2O),
among others, have grown significantly: by about 30, 145, and 15%, respectively (values for 1992). These trends
can be attributed largely to human activities, mostly fossil fuel use, land-use change, and agriculture.
• Many greenhouse gases remain in the atmosphere for a long time (for carbon dioxide and nitrous oxide, many
decades to centuries). As a result of this, if carbon dioxide emissions were maintained at near current (1994)
levels, they would lead to a nearly constant rate of increase in atmospheric concentrations for at least two centuries,
reaching about 500 ppmv (approximately twice the pre-industrial concentration of 280 ppmv) by the end of the
21st century.
• Tropospheric aerosols resulting from combustion of fossil fuels, biomass burning, and other sources have led to a
negative radiative forcing, which, while focused in particular regions and subcontinental areas, can have continental
to hemispheric effects on climate patterns. In contrast to the long-lived greenhouse gases, anthropogenic aerosols
are very short-lived in the atmosphere; hence, their radiative forcing adjusts rapidly to increases or decreases inemissions.
• Our ability from the observed climate record to quantify the human influence on global climate is currently limited
because the expected signal is still emerging from the noise of natural variability, and because there are uncertainties
in key factors. These include the magnitude and patterns of long-term natural variability and the time-evolving
pattern of forcing by, and response to, changes in concentrations of greenhouse gases and aerosols, and land-surface
changes. Nevertheless, the balance of evidence suggests that there is a discernible human influence on global climate.
• The IPCC has developed a range of scenarios, IS92a-f, for future greenhouse gas and aerosol precursor emissions
based on assumptions concerning population and economic growth, land use, technological changes, energy
availability, and fuel mix during the period 1990 to 2100. Through understanding of the global carbon cycle and
of atmospheric chemistry, these emissions can be used to project atmospheric concentrations of greenhouse gases
and aerosols and the perturbation of natural radiative forcing. Climate models can then be used to develop projections
of future climate.
• Estimates of the rise in global average surface air temperature by 2100 relative to 1990 for the IS92 scenariosrange from 1 to 3.5°C. In all cases the average rate of warming would probably be greater than any seen in the
last 10 000 years. Regional temperature changes could differ substantially from the global mean and the actual
annual to decadal changes would include considerable natural variability. A general warming is expected to lead
to an increase in the occurrence of extremely hot days and a decrease in the occurrence of extremely cold days.
• Average sea level is expected to rise as a result of thermal expansion of the oceans and melting of glaciers and
ice-sheets. Estimates of the sea level rise by 2100 relative to 1990 for the IS92 scenarios range from 15 to 95 cm.
• Warmer temperatures will lead to a more vigorous hydrological cycle; this translates into prospects for more
severe droughts and/or floods in some places and less severe droughts and/or floods in other places. Several models
indicate an increase in precipitation intensity, suggesting a possibility for more extreme rainfall events.

8/14/2019 Aviação e a Atmosfera Global
http://slidepdf.com/reader/full/aviacao-e-a-atmosfera-global 15/23
5 Aviation and the Global Atmosphere
ideal air traffic management) is achieved by 2050. If these
improvements do not materialize then fuel use and emissions
will be higher. It is further assumed that the number of aircraft
as well as the number of airports and associated infrastructure
will continue to grow and not limit the growth in demand for
air travel. If the infrastructure was not available, the growth of
traffic reflected in these scenarios would not materialize.
IPCC (1992)7 developed a range of scenarios, IS92a-f, of
future greenhouse gas and aerosol precursor emissions based
on assumptions concerning population and economic growth,
land use, technological changes, energy availability, and fuel
mix during the period 1990 to 2100. Scenario IS92a is a mid-
range emissions scenario. Scenarios of future emissions are not
predictions of the future. They are inherently uncertain because
they are based on different assumptions about the future, and
Avg. traffic Avg. annual Avg. annual Avg. annual
growth growth rate economic population Ratio of Ratio of
Scenario per year of fuel burn growth growth traffic fuel burn
name (1990–2050)1 (1990–2050) 2 rate rate (2050/1990) (2050/1990) Notes
Fa1 3.1% 1.7% 2.9% 1.4% 6.4 2.71990–2025 1990–2025
2.3% 0.7%
1990–2100 1990–2100
Fa1H 3.1% 2.0% 2.9% 1.4% 6.4 3.3
1990–2025 1990–2025
2.3% 0.7%
1990–2100 1990–2100
Fa2 3.1% 1.7% 2.9% 1.4% 6.4 2.7
1990–2025 1990–2025
2.3% 0.7%
1990–2100 1990–2100
Fc1 2.2% 0.8% 2.0% 1.1% 3.6 1.6
1990–2025 1990–2025
1.2% 0.2%
1990–2100 1990–2100
Fe1 3.9% 2.5% 3.5% 1.4% 10.1 4.4
1990–2025 1990–2025
3.0% 0.7%1990–2100 1990–2100
Eab 4.0% 3.2% 10.7 6.6
Edh 4.7% 3.8% 15.5 9.4
1
Traffic measured in terms of revenue passenger-km.2All aviation (passenger, freight, and military).
Reference scenario developed byICAO Forecasting and Economic
Support Group (FESG); mid-
range economic growth from
IPCC (1992); technology for both
improved fuel efficiency and NOx
reduction
Fa1 traffic and technology
scenario with a fleet of supersonic
aircraft replacing some of the
subsonic fleet
Fa1 traffic scenario; technology
with greater emphasis on NOx
reduction, but slightly smaller
fuel efficiency improvement
FESG low-growth scenario;
technology as for Fa1 scenario
FESG high-growth scenario;
technology as for Fa1 scenario
Traffic-growth scenario based on
IS92a developed by Environmental
Defense Fund (EDF); technology
for very low NOx assumed
High traffic-growth EDF scenario;
technology for very low NOx
assumed
7 IPCC, 1992: Climate Change 1992: The Supplementary Report to
the IPCC Scientific Assessment [Houghton, J.T., B.A. Callander,
and S.K.Varney (eds.)]. Cambridge University Press, Cambridge,UK, 200 pp.
Table 1: Summary of future global aircraft scenarios used in this report.

8/14/2019 Aviação e a Atmosfera Global
http://slidepdf.com/reader/full/aviacao-e-a-atmosfera-global 16/23
the longer the time horizon the more uncertain these scenarios
become. The aircraft emissions scenarios developed here used
the economic growth and population assumptions found in the
IS92 scenario range (see Table 1 and Figure 1). In the following
sections, scenario Fa1 is utilized to illustrate the possible
effects of aircraft and is called the reference scenario. Its
assumptions are linked to those of IS92a. The other aircraft
emissions scenarios were built from a range of economic andpopulation projections from IS92a-e. These scenarios represent
a range of plausible growth for aviation and provide a basis for
sensitivity analysis for climate modeling. However, the high
growth scenario Edh is believed to be less plausible and the low
growth scenario Fc1 is likely to be exceeded given the present
state of the industry and planned developments.
4. What are the Current and Future Impacts
of Subsonic Aviation on Radiative Forcing
and UV Radiation?
The summary of radiative effects resulting from aircraft engine
emissions is given in Figures 2 and 3. As shown in Figure 2, the
uncertainty associated with several of these effects is large.
4.1 Carbon Dioxide
Emissions of carbon dioxide by aircraft were 0.14 Gt C/year in
1992. This is about 2% of total anthropogenic carbon dioxide
emissions in 1992 or about 13% of carbon dioxide emissions
from all transportation sources. The range of scenarios considered
here projects that aircraft emissions of carbon dioxide will
continue to grow and by 2050 will be 0.23 to 1.45 Gt C/year.
For the reference scenario (Fa1) this emission increases 3-fold
by 2050 to 0.40 Gt C/year, or 3% of the projected total anthro-
pogenic carbon dioxide emissions relative to the mid-range
IPCC emission scenario (IS92a). For the range of scenarios,
the range of increase in carbon dioxide emissions to 2050
would be 1.6 to 10 times the value in 1992.
Concentrations of and radiative forcing from carbon dioxide
today are those resulting from emissions during the last 100 yearsor so. The carbon dioxide concentration attributable to aviation in
the 1992 atmosphere is 1 ppmv, a little more than 1% of the total
anthropogenic increase. This percentage is lower than the
percentage for emissions (2%) because the emissions occurred
only in the last 50 years. For the range of scenarios in Figure 1,
the accumulation of atmospheric carbon dioxide due to aircraft
over the next 50 years is projected to increase to 5 to 13 ppmv.
For the reference scenario (Fa1) this is 4% of that from all human
activities assuming the mid-range IPCC scenario (IS92a).
4.2 Ozone
The NO x emissions from subsonic aircraft in 1992 are estimated
to have increased ozone concentrations at cruise altitudes in
northern mid-latitudes by up to 6%, compared to an atmosphere
without aircraft emissions. This ozone increase is projected to
rise to about 13% by 2050 in the reference scenario (Fa1). The
impact on ozone concentrations in other regions of the world is
substantially less. These increases will, on average, tend to
warm the surface of the Earth.
Aircraft emissions of NOx are more effective at producing
ozone in the upper troposphere than an equivalent amount of
emission at the surface. Also increases in ozone in the uppertroposphere are more effective at increasing radiative forcing
than increases at lower altitudes. Due to these increases the
calculated total ozone column in northern mid-latitudes is
projected to grow by approximately 0.4 and 1.2% in 1992 and
2050, respectively. However, aircraft sulfur and water emissions
in the stratosphere tend to deplete ozone, partially offsetting
the NOx-induced ozone increases. The degree to which this
occurs is, as yet, not quantified. Therefore, the impact of
subsonic aircraft emissions on stratospheric ozone requires
further evaluation. The largest increases in ozone concentration
due to aircraft emissions are calculated to occur near the
tropopause where natural variability is high. Such changes arenot apparent from observations at this time.
4.3 Methane
In addition to increasing tropospheric ozone concentrations,
aircraft NO x emissions are expected to decrease the concentration
of methane, which is also a greenhouse gas. These reductions
in methane tend to cool the surface of the Earth. The methane
concentration in 1992 is estimated here to be about 2% less
than that in an atmosphere without aircraft. This aircraft-
induced reduction of methane concentration is much smaller
than the observed overall 2.5-fold increase since pre-industrial
Aviation and the Global Atmosphere6
C
O 2 E m i s s i o n s ( G t C y r - 1 )
0.0
0.2
0.4
0.6
0.8
1.0
1.2
1.4
1.6
1990 2000 2010 2020 2030 2040 2050
I n c r e a s e s i n c e 1 9 9 0 ( %
)
Year
0
100
200
300
400
500
600
700
800
900Edh
Eab
Fa1H
Fc1
Fa1
Fe1
Figure 1: Total aviation carbon dioxide emissions resulting
from six different scenarios for aircraft fuel use. Emissions
are given in Gt C [or billion (109) tonnes of carbon] per year.
To convert Gt C to Gt CO2 multiply by 3.67. The scale on the
righthand axis represents the percentage growth from 1990 to
2050. Aircraft emissions of carbon dioxide represent 2.4% of
total fossil fuel emissions of carbon dioxide in 1992 or 2% of
total anthropogenic carbon dioxide emissions. (Note: Fa2 has
not been drawn because the difference from scenario Fa1
would not be discernible on the figure.)

8/14/2019 Aviação e a Atmosfera Global
http://slidepdf.com/reader/full/aviacao-e-a-atmosfera-global 17/23
7 Aviation and the Global Atmosphere
times. Uncertainties in the sources and sinks of methane
preclude testing the impact of aviation on methane concentrations
with atmospheric observations. In the reference scenario (Fa1)
methane would be about 5% less than that calculated for a
2050 atmosphere without aircraft.
Changes in tropospheric ozone are mainly in the Northern
Hemisphere, while those of methane are global in extent sothat, even though the global average radiative forcings are of
similar magnitude and opposite in sign, the latitudinal structure
of the forcing is different so that the net regional radiative
effects do not cancel.
4.4 Water Vapour
Most subsonic aircraft water vapour emissions are released in
the troposphere where they are rapidly removed by precipitation
within 1 to 2 weeks. A smaller fraction of water vapour emis-
sions is released in the lower stratosphere where it can build up
to larger concentrations. Because water vapor is a greenhouse
gas, these increases tend to warm the Earth’s surface, though
for subsonic aircraft this effect is smaller than those of other
aircraft emissions such as carbon dioxide and NO x.
4.5 Contrails
In 1992, aircraft line-shaped contrails are estimated to cover
about 0.1% of the Earth’s surface on an annually averaged
basis with larger regional values. Contrails tend to warm the
Earth’s surface, similar to thin high clouds. The contrail cover
is projected to grow to 0.5% by 2050 in the reference scenario
(Fa1), at a rate which is faster than the rate of growth in aviation
fuel consumption. This faster growth in contrail cover is
expected because air traffic will increase mainly in the upper
troposphere where contrails form preferentially, and may also
occur as a result of improvements in aircraft fuel efficiency.Contrails are triggered from the water vapour emitted by air-
craft and their optical properties depend on the particles emit-
ted or formed in the aircraft plume and on the ambient atmos-
pheric conditions. The radiative effect of contrails depends on
their optical properties and global cover, both of which are
uncertain. Contrails have been observed as line-shaped clouds
-0.06
-0.04
-0.02
0.00
0.02
0.04
0.06
0.08
R a d i a t i v e F o r c i n g ( W m - 2 )
0.10Radiative Forcing from Aircraft in 1992
from NOx
}
a)
Total(without
cirrusclouds)
DirectSoot
fair
CirrusClouds
verypoor
Contrails
fair
H2O
poor
CH4
poor
O3
fair
CO2
good
DirectSulfate
fair
R a d i a t i v e F o r c i n g ( W
m - 2 )
-0.2
-0.1
0.0
0.1
0.2
0.4
0.3
0.5
from NOx
}
Radiative Forcing from Aircraft in 2050
b)
Total(without
cirrusclouds)
CirrusClouds
very
poor
Contrails
fair
H2O
poor
CH4
poor
O3
poor
CO2
good
DirectSulfate
fair
DirectSoot
fair
Figure 2: Estimates of the globally and annually averaged
radiative forcing (Wm-2) (see Footnote 4) from subsonic
aircraft emissions in 1992 (2a) and in 2050 for scenario Fa1
(2b). The scale in Figure 2b is greater than the scale in 2a byabout a factor of 4. The bars indicate the best estimate of
forcing while the line associated with each bar is a two-thirds
uncertainty range developed using the best knowledge and
tools available at the present time. (The two-thirds uncertainty
range means that there is a 67% probability that the true
value falls within this range.) The available information on
cirrus clouds is insufficient to determine either a best estimate
or an uncertainty range; the dashed line indicates a range of
possible best estimates. The estimate for total forcing does
not include the effect of changes in cirrus cloudiness. The
uncertainty estimate for the total radiative forcing (without
additional cirrus) is calculated as the square root of the sumsof the squares of the upper and lower ranges for the individual
components. The evaluations below the graph (“good,”
“fair,” “poor,” “very poor”) are a relative appraisal associated
with each component and indicate the level of scientific
understanding. It is based on the amount of evidence available
to support the best estimate and its uncertainty, the degree of
consensus in the scientific literature, and the scope of the
analysis. This evaluation is separate from the evaluation of
uncertainty range represented by the lines associated with
each bar. This method of presentation is different and more
meaningful than the confidence level presented in similar
graphs from Climate Change 1995: The Science of Climate
Change.
➣

8/14/2019 Aviação e a Atmosfera Global
http://slidepdf.com/reader/full/aviacao-e-a-atmosfera-global 18/23
by satellites over heavy air traffic areas and covered on average
about 0.5% of the area over Central Europe in 1996 and 1997.
4.6 Cirrus Clouds
Extensive cirrus clouds have been observed to develop after
the formation of persistent contrails. Increases in cirrus cloud cover (beyond those identified as line-shaped contrails) are
found to be positively correlated with aircraft emissions in a
limited number of studies. About 30% of the Earth is covered
with cirrus cloud. On average an increase in cirrus cloud cover
tends to warm the surface of the Earth. An estimate for aircraft-
induced cirrus cover for the late 1990s ranges from 0 to 0.2%
of the surface of the Earth. For the Fa1 scenario, this may
possibly increase by a factor of 4 (0 to 0.8%) by 2050; however,
the mechanisms associated with increases in cirrus cover are
not well understood and need further investigation.
4.7 Sulfate and Soot Aerosols
The aerosol mass concentrations in 1992 resulting from aircraft
are small relative to those caused by surface sources. Although
aerosol accumulation will grow with aviation fuel use, aerosol
mass concentrations from aircraft in 2050 are projected to
remain small compared to surface sources. Increases in soot
tend to warm while increases in sulfate tend to cool the Earth’s
surface. The direct radiative forcing of sulfate and soot aerosols
from aircraft is small compared to those of other aircraft
emissions. Because aerosols influence the formation of clouds,
the accumulation of aerosols from aircraft may play a role in
enhanced cloud formation and change the radiative propertiesof clouds.
4.8 What are the Overall Climate Effects
of Subsonic Aircraft?
The climate impacts of different anthropogenic emissions can
be compared using the concept of radiative forcing. The best
estimate of the radiative forcing in 1992 by aircraft is 0.05 Wm-2
or about 3.5% of the total radiative forcing by all anthropogenic
activities. For the reference scenario (Fa1), the radiative forcing
by aircraft in 2050 is 0.19 Wm-2 or 5% of the radiative forcingin the mid-range IS92a scenario (3.8 times the value in 1992).
According to the range of scenarios considered here, the forcing
is projected to grow to 0.13 to 0.56 Wm-2 in 2050, which is a
factor of 1.5 less to a factor of 3 greater than that for Fa1 and
from 2.6 to 11 times the value in 1992. These estimates of
forcing combine the effects from changes in concentrations of
carbon dioxide, ozone, methane, water vapour, line-shaped
contrails, and aerosols, but do not include possible changes in
cirrus clouds.
Globally averaged values of the radiative forcing from different
components in 1992 and in 2050 under the reference scenario
(Fa1) are shown in Figure 2. Figure 2 indicates the best
estimates of the forcing for each component and the two-thirds
uncertainty range.8 The derivation of these uncertainty ranges
involves expert scientific judgment and may also include objec-
tive statistical models. The uncertainty range in the radiative forc-
ing stated here combines the uncertainty in calculating the
atmospheric change to greenhouse gases and aerosols with that
of calculating radiative forcing. For additional cirrus clouds,
only a range for the best estimate is given; this is not includedin the total radiative forcing.
The state of scientific understanding is evaluated for each
component. This is not the same as the confidence level expressed
in previous IPCC documents. This evaluation is separate from
the uncertainty range and is a relative appraisal of the scientific
understanding for each component. The evaluation is based on
the amount of evidence available to support the best estimate
and its uncertainty, the degree of consensus in the scientific
literature, and the scope of the analysis. The total radiative
forcing under each of the six scenarios for the growth of aviation
is shown in Figure 3 for the period 1990 to 2050.
The total radiative forcing due to aviation (without forcing
from additional cirrus) is likely to lie within the range from
0.01 to 0.1 Wm-2 in 1992, with the largest uncertainties coming
from contrails and methane. Hence the total radiative forcing
may be about two times larger or five times smaller than the
best estimate. For any scenario at 2050, the uncertainty range
of radiative forcing is slightly larger than for 1992, but the
largest variations of projected radiative forcing come from the
range of scenarios.
Over the period from 1992 to 2050, the overall radiative
forcing by aircraft (excluding that from changes in cirrus
Aviation and the Global Atmosphere8
0
0.1
0.2
0.3
0.4
0.5
0.6
1990 2000 2010 2020 2030 2040 2050
R a d i a t i v e F o r c i n g ( W m - 2 )
Year
Fa1
Fc1
Fe1
Fa1H
Eab
Edh
Figure 3: Estimates of the globally and annually averaged
total radiative forcing (without cirrus clouds) associated with
aviation emissions under each of six scenarios for the growth
of aviation over the time period 1990 to 2050. (Fa2 has not
been drawn because the difference from scenario Fa1 would
not be discernible on the figure.)
8 The two-thirds uncertainty range means there is a 67% probability
that the true value falls within this range.

8/14/2019 Aviação e a Atmosfera Global
http://slidepdf.com/reader/full/aviacao-e-a-atmosfera-global 19/23
clouds) for all scenarios in this report is a factor of 2 to 4 larger
than the forcing by aircraft carbon dioxide alone. The overall
radiative forcing for the sum of all human activities is estimated
to be at most a factor of 1.5 larger than that of carbon dioxide alone.
The emissions of NOx cause changes in methane and ozone,
with influence on radiative forcing estimated to be of similar
magnitude but of opposite sign. However, as noted above, thegeographical distribution of the aircraft ozone forcing is far
more regional than that of the aircraft methane forcing.
The effect of aircraft on climate is superimposed on that caused
by other anthropogenic emissions of greenhouse gases and
particles, and on the background natural variability. The radiative
forcing from aviation is about 3.5% of the total radiative forcing
in 1992. It has not been possible to separate the influence on
global climate change of aviation (or any other sector with
similar radiative forcing) from all other anthropogenic activities.
Aircraft contribute to global change approximately in proportion
to their contribution to radiative forcing.
4.9 What are the Overall Effects
of Subsonic Aircraft on UV-B?
Ozone, most of which resides in the stratosphere, provides a
shield against solar ultraviolet radiation. The erythemal dose
rate, defined as UV irradiance weighted according to how
effectively it causes sunburn, is estimated to be decreased by
aircraft in 1992 by about 0.5% at 45°N in July. For comparison,
the calculated increase in the erythemal dose rate due to
observed ozone depletion is about 4% over the period 1970 to
1992 at 45°N in July.9 The net effect of subsonic aircraft
appears to be an increase in column ozone and a decrease in
UV radiation, which is mainly due to aircraft NO x emissions.
Much smaller changes in UV radiation are associated with
aircraft contrails, aerosols, and induced cloudiness. In the
Southern Hemisphere, the calculated effects of aircraft emission
on the erythemal dose rate are about a factor of 4 lower than for
the Northern Hemisphere.
For the reference scenario (Fa1), the change in erythemal dose
rate at 45°N in July in 2050 compared to a simulation with no air-
craft is –1.3% (with a two-thirds uncertainty range from –0.7 to
–2.6%). For comparison, the calculated change in the erythemaldose rate due to changes in the concentrations of trace species,
other than those from aircraft, between 1970 to 2050 at 45°N is
about –3%, a decrease that is the net result of two opposing
effects: (1) the incomplete recovery of stratospheric ozone to 1970
levels because of the persistence of long-lived halogen-containing
compounds, and (2) increases in projected surface emissions of
shorter lived pollutants that produce ozone in the troposphere.
5. What are the Current and Future Impacts
of Supersonic Aviation on Radiative Forcing
and UV Radiation?
One possibility for the future is the development of a fleet of
second generation supersonic, high speed civil transport
(HSCT) aircraft, although there is considerable uncertainty
whether any such fleet will be developed. These supersonicaircraft are projected to cruise at an altitude of about 19 km,
about 8 km higher than subsonic aircraft, and to emit carbon
dioxide, water vapour, NOx, SOx, and soot into the stratos-
phere. NOx, water vapour, and SOx from supersonic aircraft
emissions all contribute to changes in stratospheric ozone. The
radiative forcing of civil supersonic aircraft is estimated to be
about a factor of 5 larger than that of the displaced subsonic
aircraft in the Fa1H scenario. The calculated radiative forcing
of supersonic aircraft depends on the treatment of water vapour
and ozone in models. This effect is difficult to simulate in
current models and so is highly uncertain.
Scenario Fa1H considers the addition of a fleet of civil
supersonic aircraft that was assumed to begin operation in the
year 2015 and grow to a maximum of 1 000 aircraft by the year
2040. For reference, the civil subsonic fleet at the end of the
year 1997 contained approximately 12 000 aircraft. In this
scenario, the aircraft are designed to cruise at Mach 2.4, and
new technologies are assumed that maintain emissions of 5 g
NO2 per kg fuel (lower than today’s civil supersonic aircraft
which have emissions of about 22 g NO2 per kg fuel). These
supersonic aircraft are assumed to replace part of the subsonic
fleet (11%, in terms of emissions in scenario Fa1). Supersonic
aircraft consume more than twice the fuel per passenger-km
compared to subsonic aircraft. By the year 2050, the combined
fleet (scenario Fa1H) is projected to add a further 0.08 Wm-2
(42%) to the 0.19 Wm-2 radiative forcing from scenario
Fa1 (see Figure 4). Most of this additional forcing is due to
accumulation of stratospheric water vapour.
The effect of introducing a civil supersonic fleet to form the
combined fleet (Fa1H) is also to reduce stratospheric ozone
and increase erythemal dose rate. The maximum calculated
effect is at 45°N where, in July, the ozone column change in
2050 from the combined subsonic and supersonic fleet relative
to no aircraft is -0.4%. The effect on the ozone column of the
supersonic component by itself is –1.3% while the subsoniccomponent is +0.9%.
The combined fleet would change the erythemal dose rate at
45°N in July by +0.3% compared to the 2050 atmosphere
without aircraft. The two-thirds uncertainty range for the
combined fleet is –1.7% to +3.3%. This may be compared to
the projected change of –1.3% for Fa1. Flying higher leads to
larger ozone column decreases, while flying lower leads to
smaller ozone column decreases and may even result in an
ozone column increase for flight in the lowermost stratosphere.
In addition, emissions from supersonic aircraft in the Northern
Hemisphere stratosphere may be transported to the Southern
Hemisphere where they cause ozone depletion.
9 Aviation and the Global Atmosphere
9 This value is based on satellite observations and model calculations.
See WMO, 1999: Scientific Assessment of Ozone Depletion: 1998.
Report No. 44, Global Ozone Research and Monitoring Project,World Meteorological Organization, Geneva, Switzerland, 732 pp.

8/14/2019 Aviação e a Atmosfera Global
http://slidepdf.com/reader/full/aviacao-e-a-atmosfera-global 20/23
Aviation and the Global Atmosphere10
6. What are the Options
to Reduce Emissions and Impacts?
There is a range of options to reduce the impact of aviation
emissions, including changes in aircraft and engine technology,
fuel, operational practices, and regulatory and economicmeasures. These could be implemented either singly or in
combination by the public and/or private sector. Substantial
aircraft and engine technology advances and the air traffic
management improvements described in this report are already
incorporated in the aircraft emissions scenarios used for
climate change calculations. Other operational measures,
which have the potential to reduce emissions, and alternative
fuels were not assumed in the scenarios. Further technology
advances have the potential to provide additional fuel and
emissions reductions. In practice, some of the improvements
are expected to take place for commercial reasons. The timing
and scope of regulatory, economic, and other options may
affect the introduction of improvements and may affect demand
for air transport. Mitigation options for water vapour and
cloudiness have not been fully addressed.
Safety of operation, operational and environmental performance,
and costs are dominant considerations for the aviation industry
when assessing any new aircraft purchase or potential engi-
neering or operational changes. The typical life expectancy of
an aircraft is 25 to 35 years. These factors have to be taken intoaccount when assessing the rate at which technology advances
and policy options related to technology can reduce aviation
emissions.
6.1 Aircraft and Engine Technology Options
Technology advances have substantially reduced most emissions
per passenger-km. However, there is potential for further
improvements. Any technological change may involve a balance
among a range of environmental impacts.
Subsonic aircraft being produced today are about 70% more
fuel efficient per passenger-km than 40 years ago. The majority
of this gain has been achieved through engine improvements
and the remainder from airframe design improvement. A 20%
improvement in fuel efficiency is projected by 2015 and a 40 to
50% improvement by 2050 relative to aircraft produced today.
The 2050 scenarios developed for this report already incorpo-
rate these fuel efficiency gains when estimating fuel use and
emissions. Engine efficiency improvements reduce the specific
fuel consumption and most types of emissions; however,
contrails may increase and, without advances in combuster
technology, NOx emissions may also increase.
Future engine and airframe design involves a complex decision-
making process and a balance of considerations among many
factors (e.g., carbon dioxide emissions, NOx emissions at
ground level, NOx emissions at altitude, water vapour emis-
sions, contrail/cirrus production, and noise). These aspects have
not been adequately characterized or quantified in this report.
Internationally, substantial engine research programmes are in
progress, with goals to reduce Landing and Take-off cycle (LTO)
emissions of NOx by up to 70% from today’s regulatory standards,
while also improving engine fuel consumption by 8 to 10%,
over the most recently produced engines, by about 2010.Reduction of NOx emissions would also be achieved at cruise
altitude, though not necessarily by the same proportion as for
LTO. Assuming that the goals can be achieved, the transfer of
this technology to significant numbers of newly produced aircraft
will take longer—typically a decade. Research programmes
addressing NOx emissions from supersonic aircraft are also in
progress.
6.2 Fuel Options
There would not appear to be any practical alternatives to
kerosene-based fuels for commercial jet aircraft for the next
Radiative Forcing from Aircraft in 2050with Supersonic Fleet
-0.2
-0.1
0
0.1
0.2
0.3
0.4
0.5
0.6
R a d i a t i v e F o r c i n g ( W m - 2 )
CO2O3
CH4
H2O Contrails
from NOx
}
Total(without
cirrusclouds)
Supersonic Fleet
Subsonic Fleet
Combined Fleet
CirrusClouds
DirectSulfate
DirectSoot
Figure 4: Estimates of the globally and annually averaged
radiative forcing from a combined fleet of subsonic and
supersonic aircraft (in Wm-2) due to changes in greenhouse
gases, aerosols, and contrails in 2050 under the scenarioFa1H. In this scenario, the supersonic aircraft are assumed to
replace part of the subsonic fleet (11%, in terms of emissions
in scenario Fa1). The bars indicate the best estimate of forcing
while the line associated with each bar is a two-thirds
uncertainty range developed using the best knowledge and
tools available at the present time. (The two-thirds uncertainty
range means that there is a 67% probability that the true
value falls within this range.) The available information on
cirrus clouds is insufficient to determine either a best estimate
or an uncertainty range; the dashed line indicates a range of
possible best estimates. The estimate for total forcing does
not include the effect of changes in cirrus cloudiness. The
uncertainty estimate for the total radiative forcing (withoutadditional cirrus) is calculated as the square root of the sums
of the squares of the upper and lower ranges. The level of
scientific understanding for the supersonic components are
carbon dioxide, “good;” ozone, “poor;” and water vapour, “poor.”

8/14/2019 Aviação e a Atmosfera Global
http://slidepdf.com/reader/full/aviacao-e-a-atmosfera-global 21/23
several decades. Reducing sulfur content of kerosene will
reduce SO x emissions and sulfate particle formation.
Jet aircraft require fuel with a high energy density, especially
for long-haul flights. Other fuel options, such as hydrogen,
may be viable in the long term, but would require new aircraft
designs and new infrastructure for supply. Hydrogen fuel
would eliminate emissions of carbon dioxide from aircraft, butwould increase those of water vapour. The overall environmen-
tal impacts and the environmental sustainability of the produc-
tion and use of hydrogen or any other alternative fuels have not
been determined.
The formation of sulfate particles from aircraft emissions,
which depends on engine and plume characteristics, is reduced
as fuel sulfur content decreases. While technology exists to
remove virtually all sulfur from fuel, its removal results in a
reduction in lubricity.
6.3 Operational Options
Improvements in air traffic management (ATM) and other
operational procedures could reduce aviation fuel burn by
between 8 and 18%. The large majority (6 to 12%) of these
reductions comes from ATM improvements which it is anticipated
will be fully implemented in the next 20 years. All engine
emissions will be reduced as a consequence. In all aviation
emission scenarios considered in this report the reductions
from ATM improvements have already been taken into account.
The rate of introduction of improved ATM will depend on the
implementation of the essential institutional arrangements at
an international level.
Air traffic management systems are used for the guidance,
separation, coordination, and control of aircraft movements.
Existing national and international air traffic management
systems have limitations which result, for example, in holding
(aircraft flying in a fixed pattern waiting for permission to
land), inefficient routings, and sub-optimal flight profiles.
These limitations result in excess fuel burn and consequently
excess emissions.
For the current aircraft fleet and operations, addressing the
above-mentioned limitations in air traffic management systemscould reduce fuel burned in the range of 6 to 12%. It is anticipated
that the improvement needed for these fuel burn reductions will
be fully implemented in the next 20 years, provided that the
necessary institutional and regulatory arrangements have been
put in place in time. The scenarios developed in this report
assume the timely implementation of these ATM improve-
ments, when estimating fuel use.
Other operational measures to reduce the amount of fuel
burned per passenger-km include increasing load factors
(carrying more passengers or freight on a given aircraft),
eliminating non-essential weight, optimizing aircraft speed,
limiting the use of auxiliary power (e.g., for heating, ventilation),
and reducing taxiing. The potential improvements in these
operational measures could reduce fuel burned, and emissions,
in the range 2 to 6%.
Improved operational efficiency may result in attracting
additional air traffic, although no studies providing evidence
on the existence of this effect have been identified.
6.4 Regulatory, Economic, and Other Options
Although improvements in aircraft and engine technology and in
the efficiency of the air traffic system will bring environmental
benefits, these will not fully offset the effects of the increased
emissions resulting from the projected growth in aviation. Policy
options to reduce emissions further include more stringent
aircraft engine emissions regulations, removal of subsidies and
incentives that have negative environmental consequences,
market-based options such as environmental levies (charges and
taxes) and emissions trading, voluntary agreements, research programmes, and substitution of aviation by rail and coach.
Most of these options would lead to increased airline costs and
fares. Some of these approaches have not been fully investigated
or tested in aviation and their outcomes are uncertain.
Engine emissions certification is a means for reducing specific
emissions. The aviation authorities currently use this approach
to regulate emissions for carbon monoxide, hydrocarbons,
NOx, and smoke. The International Civil Aviation Organization
has begun work to assess the need for standards for aircraft
emissions at cruise altitude to complement existing LTO
standards for NOx and other emissions.
Market-based options, such as environmental levies (charges
and taxes) and emissions trading, have the potential to encourage
technological innovation and to improve efficiency, and may
reduce demand for air travel. Many of these approaches have
not been fully investigated or tested in aviation and their out-
comes are uncertain.
Environmental levies (charges and taxes) could be a means for
reducing growth of aircraft emissions by further stimulating
the development and use of more efficient aircraft and by
reducing growth in demand for aviation transportation. Studies
show that to be environmentally effective, levies would need tobe addressed in an international framework.
Another approach that could be considered for mitigating aviation
emissions is emissions trading, a market-based approach which
enables participants to cooperatively minimize the costs of reducing
emissions. Emissions trading has not been tested in aviation
though it has been used for sulfur dioxide (SO2) in the United
States of America and is possible for ozone-depleting substances
in the Montreal Protocol. This approach is one of the provisions
of the Kyoto Protocol where it applies to Annex B Parties.
Voluntary agreements are also currently being explored as a
means of achieving reductions in emissions from the aviation
11 Aviation and the Global Atmosphere

8/14/2019 Aviação e a Atmosfera Global
http://slidepdf.com/reader/full/aviacao-e-a-atmosfera-global 22/23
Aviation and the Global Atmosphere12
sector. Such agreements have been used in other sectors to
reduce greenhouse gas emissions or to enhance sinks.
Measures that can also be considered are removal of subsidies
or incentives which would have negative environmental
consequences, and research programmes.
Substitution by rail and coach could result in the reduction of carbon dioxide emissions per passenger-km. The scope for this
reduction is limited to high density, short-haul routes, which
could have coach or rail links. Estimates show that up to 10%
of the travelers in Europe could be transferred from aircraft to
high-speed trains. Further analysis, including trade-offs
between a wide range of environmental effects (e.g., noise
exposure, local air quality, and global atmospheric effects) is
needed to explore the potential of substitution.
7. Issues for the Future
This report has assessed the potential climate and ozone changes
due to aircraft to the year 2050 under different scenarios. It rec-
ognizes that the effects of some types of aircraft emissions are well
understood. It also reveals that the effects of others are not,
because of the many scientific uncertainties. There has been a
steady improvement in characterizing the potential impacts of
human activities, including the effects of aviation on the global
atmosphere. The report has also examined technological
advances, infrastructure improvements, and regulatory or market-
based measures to reduce aviation emissions. Further work is
required to reduce scientific and other uncertainties, to under-
stand better the options for reducing emissions, to better inform
decisionmakers, and to improve the understanding of the social
and economic issues associated with the demand for air transport.
There are a number of key areas of scientific uncertainty that
limit our ability to project aviation impacts on climate and
ozone:
• The influence of contrails and aerosols on cirrus clouds
• The role of NOx in changing ozone and methane
concentrations
• The ability of aerosols to alter chemical processes• The transport of atmospheric gases and particles in the
upper troposphere/lower stratosphere
• The climate response to regional forcings and stratospheric
perturbations.
There are a number of key socio-economic and technological
issues that need greater definition, including inter alia the
following:
• Characterization of demand for commercial aviation
services, including airport and airway infrastructure
constraints and associated technological change• Methods to assess external costs and the environmental
benefits of regulatory and market-based options
• Assessment of the macroeconomic effects of emission
reductions in the aviation industry that might result
from mitigation measures
• Technological capabilities and operational practices to
reduce emissions leading to the formation of contrails
and increased cloudiness
• The understanding of the economic and environmental
effects of meeting potential stabilization scenarios (for
atmospheric concentrations of greenhouse gases), including
measures to reduce emissions from aviation and also
including such issues as the relative environmentalimpacts of different transportation modes.

8/14/2019 Aviação e a Atmosfera Global
http://slidepdf.com/reader/full/aviacao-e-a-atmosfera-global 23/23
I. IPCC FIRST ASSESSMENT REPORT, 1990
a) CLIMATE CHANGE — The IPCC Scientific Assessment. The
1990 report of the IPCC Scientific Assessment Working Group
(also in Chinese, French, Russian and Spanish).
b) CLIMATE CHANGE — The IPCC Impacts Assessment. The
1990 report of the IPCC Impacts Assessment Working Group (also
in Chinese, French, Russian and Spanish).
c) CLIMATE CHANGE — The IPCC Response Strategies. The
1990 report of the IPCC Response Strategies Working Group (also
in Chinese, French, Russian and Spanish).
d) Overview and Policymaker Summaries, 1990.
Emissions Scenarios (prepared by the IPCC Response Strategies
Working Group), 1990.
Assessment of the Vulnerability of Coastal Areas to Sea Level Rise
— A Common Methodology, 1991.
II. IPCC SUPPLEMENT, 1992
a) CLIMATE CHANGE 1992 — The Supplementary Report to
the IPCC Scientific Assessment. The 1992 report of the IPCC
Scientific Assessment Working Group.
b) CLIMATE CHANGE 1992 — The Supplementary Report to
the IPCC Impacts Assessment. The 1992 report of the IPCC
Impacts Assessment Working Group.
CLIMATE CHANGE: The IPCC 1990 and 1992 Assessments —IPCC First Assessment Report Overview and Policymaker
Summaries, and 1992 IPCC Supplement (also in Chinese, French,
Russian and Spanish).
Global Climate Change and the Rising Challenge of the Sea.
Coastal Zone Management Subgroup of the IPCC Response
Strategies Working Group, 1992.
Report of the IPCC Country Study Workshop, 1992.
Preliminary Guidelines for Assessing Impacts of Climate Change, 1992.
III. IPCC SPECIAL REPORT, 1994
CLIMATE CHANGE 1994 — Radiative Forcing of Climate
Change and An Evaluation of the IPCC IS92 Emission Scenarios.
IV. IPCC SECOND ASSESSMENT REPORT, 1995
a) CLIMATE CHANGE 1995 — The Science of Climate Change
(including Summary for Policymakers). Report of IPCC Working
Group I, 1995.
b) CLIMATE CHANGE 1995 — Scientific-Technical Analyses of
Impacts, Adaptations and Mitigation of Climate Change
c) CLIMATE CHANGE 1995 — The Economic and Social
Dimensions of Climate Change (including Summary for
Policymakers). Report of IPCC Working Group III, 1995.
d) The IPCC Second Assessment Synthesis of Scientific-Technical
Information Relevant to Interpreting Article 2 of the UN
Framework Convention on Climate Change, 1995.
(Please note: the IPCC Synthesis and the three Summaries for
Policymakers have been published in a single volume and are also
available in Arabic, Chinese, French, Russian and Spanish.)
V. IPCC METHODOLOGIES
a) IPCC Guidelines for National Greenhouse Gas Inventories (3
volumes), 1994 (also in French, Russian and Spanish).
b) IPCC Technical Guidelines for Assessing Climate Change
Impacts and Adaptations, 1995 (also in Arabic, Chinese, French, Russian and Spanish).
c) Revised 1996 IPCC Guidelines for National Greenhouse Gas
Inventories (3 volumes), 1996.
VI. IPCC TECHNICAL PAPERS
TECHNOLOGIES, POLICIES AND MEASURES FOR
MITIGATING CLIMATE CHANGE — IPCC Technical Paper 1,
1996 (also in French and Spanish).
AN INTRODUCTION TO SIMPLE CLIMATE MODELS USED
IN THE IPCC SECOND ASSESSMENT REPORT — IPCCTechnical Paper 2, 1997 (also in French and Spanish).
STABILIZATION OF ATMOSPHERIC GREENHOUSE
GASES: PHYSICAL, BIOLOGICAL AND SOCIO-ECONOMIC
IMPLICATIONS — IPCC Technical Paper 3, 1997 (also in French
and Spanish).
IMPLICATIONS OF PROPOSED CO2 EMISSIONS
LIMITATIONS — IPCC Technical Paper 4, 1997 (also in French
and Spanish).
VII. IPCC SPECIAL REPORT, 1997
THE REGIONAL IMPACTS OF CLIMATE CHANGE: AN
ASSESSMENT OF VULNERABILITY (including Summary for
Policymakers, which is available in Arabic, Chinese, English, French,
Russian and Spanish).
A Special Report of IPCC Working Group II, 1997.
VIII. IPCC SPECIAL REPORT, 1999
AVIATION AND THE GLOBAL ATMOSPHERE (including
Summary for Policymakers, which is available in Arabic, Chinese,
LIST OF IPCC OUTPUTS